A Comprehensive Guide to Lipidomics Workflows: From Sample Collection to Data Analysis
This article provides a detailed guide to lipidomics workflows, tailored for researchers, scientists, and drug development professionals.
A Comprehensive Guide to Lipidomics Workflows: From Sample Collection to Data Analysis
Abstract
This article provides a detailed guide to lipidomics workflows, tailored for researchers, scientists, and drug development professionals. It covers foundational principles, from lipid classification and the importance of proper sample collection to the intricacies of mass spectrometry-based analysis. The scope extends to methodological choices between LC-MS and shotgun lipidomics, advanced data processing with machine learning, and critical steps for troubleshooting, quality control, and validation to ensure reproducible and biologically relevant results.
Understanding the Lipidome: Core Concepts and Pre-Analytical Planning
Lipids are ubiquitous biomolecules that constitute a highly diverse class of metabolites, serving as crucial structural components of cell membranes, acting as signaling molecules, and providing a dense energy source for cellular functions [1] [2]. Their fundamental roles extend to regulating critical biological processes including cell proliferation, survival, death, and intercellular interactions [3]. The structural diversity of lipids arises from variations in their head groups and aliphatic chains, which differ in length, unsaturation, double bond position, cis-trans isomerism, and branched chains, contributing to their complex physicochemical properties and functional versatility [3].
In 2005, the LIPID MAPS consortium established a comprehensive classification system that categorizes lipid molecular species into eight major categories: fatty acids (FA), glycerolipids (GL), glycerophospholipids (GP), sphingolipids (SP), sterol lipids (ST), prenol lipids (PR), saccharolipids (SL), and polyketides (PK) [3]. This systematic organization has enabled more standardized research and communication within the lipidomics community. Beyond their foundational roles in membrane structure, lipids function as essential signaling molecules in inflammation and immune responses, and participate in key cellular processes including division, growth, migration, and apoptosis [4]. The growing understanding of how different lipid types influence health and disease has positioned lipidomics as a critical field in medical research, particularly for understanding pathological mechanisms and developing diagnostic and therapeutic strategies [3].
Lipid Functions in Cellular Systems and Organisms
Key Functional Roles of Lipid Classes
Table 1: Major Lipid Classes and Their Primary Biological Functions
| Lipid Category | Main Subclasses | Primary Biological Functions | Role in Disease |
|---|---|---|---|
| Glycerophospholipids | Phosphatidylcholine (PC), Phosphatidylethanolamine (PE), Phosphatidylinositol (PI) | Basic skeleton of cell membrane; cell integrity and relative independence [3] | Membrane dysfunction in metabolic and neurological disorders |
| Sphingolipids | Ceramides (CER), Sphingomyelins (SM), Hexosylceramide (HCER) | Powerful signaling molecules regulating inflammation, cell death, and metabolic processes [5] | Elevated ceramides strongly predict cardiovascular events and correlate with insulin resistance [5] |
| Glycerolipids | Triacylglycerols (TAG), Diacylglycerols (DAG) | Energy source for cells; maintain basic cellular activities and functions [3] | Dysregulation linked to metabolic syndrome and insulin resistance [6] |
| Sterol Lipids | Cholesterol, Cholesterol Esters (CE) | Membrane fluidity regulation; precursor for steroid hormones | Atherosclerosis and cardiovascular disease |
| Fatty Acids | Saturated, Unsaturated, Polyunsaturated | Energy substrates; precursors for signaling molecules; membrane composition | Inflammation regulation; roles in chronic diseases [6] |
Signaling and Metabolic Functions
Lipids play dynamic roles as signaling molecules and metabolic regulators. Specific lipid species function as secondary signaling molecules, with examples including arachidonic acid and lysophospholipids that participate in complex cellular communication networks [3]. Recent research has revealed that lipids have crucial roles in immune homeostasis and inflammation regulation, with dynamic changes observed in the plasma lipidome during respiratory viral infection, insulin resistance, and ageing [6].
Ether-linked lipids, including alkyl- and alkenyl- (plasmalogen) substituent containing lipids such as PE-O and PE-P, demonstrate distinct behavior from their ester-linked counterparts, suggesting unique physiological functions that are currently under investigation [6]. These lipids appear to have specialized roles in cellular signaling and membrane properties that may be particularly important in neurological function and oxidative stress response.
The complexity of lipid functions is further exemplified by the distinct physiological roles of lipid subclasses such as large and small triacylglycerols, which comprise ≤48 and ≥49 carbons across all fatty acids, respectively. These subclasses exhibit significant differences in variance and abundance distribution, suggesting specialized metabolic roles and regulation [6].
Lipidomic Workflows: From Sample Collection to Data Analysis
Sample Collection and Preparation Techniques
Proper sample collection and preparation are critical steps in lipidomic workflows to ensure accurate and reproducible results. Blood sampling protocols have been standardized for lipidomic analysis, typically requiring fasting samples collected in specialized tubes that prevent lipid oxidation [5]. For single-cell lipidomics, capillary sampling methods have been developed that enable user-selected sampling of individual cells, providing detailed lipid profiles that reveal critical differences between cell types and states [7].
Table 2: Sample Collection Methods in Lipidomics
| Method | Application Context | Key Features | References |
|---|---|---|---|
| Venous Blood Collection | Clinical lipid profiling; biomarker studies | Standardized protocols; specialized anti-oxidant tubes; fasting samples | [5] |
| Capillary Sampling | Single-cell lipidomics | Enables living whole-cell extraction; minimal perturbation; real-time analysis | [7] |
| Volumetric Absorptive Microsampling (VAMS) | Remote sampling; longitudinal studies | Small blood volumes; improved quantification; dried blood spots | [8] |
| Laser Capture Microdissection (LCM) | Tissue-specific lipidomics | Spatially resolved sampling; specific cell populations from tissue sections | [7] |
Recent advances in microsampling technologies have enabled lipidomic profiling from minimal sample volumes. Methods such as dried blood spots (DBS), quantitative dried blood spots (qDBS), and volumetric absorptive microsampling (VAMS) facilitate global lipidomic profiling of human whole blood using high-throughput LC-MS approaches [8]. These techniques are particularly valuable for longitudinal studies, pediatric populations, and situations where sample volume is limited.
For single-cell lipidomics, both manual and automated capillary sampling methods have been developed. Manual capillary sampling is typically performed under ambient conditions using capillary tips mounted on a nanomanipulator with cell selection under an inverted microscope [7]. Automated systems such as the Yokogawa SS2000 Single Cellome System offer controlled conditions (37°C, 5% CO2) with humidity control, enhancing reproducibility [7]. Critical parameters affecting lipid profiling include capillary tip type, aspiration volume, and appropriate blank correction, while sampling medium selection shows minimal impact [7].
Lipid Extraction and Analysis Methods
Lipid extraction represents a crucial step in sample preparation, with recent developments focusing on high-throughput methodologies. Novel approaches include single-phase lipid extraction using 1-octanol and methanol with 10mM ammonium formate as a carrier solvent, enabling efficient extraction of multiple lipid classes including phosphatidylcholine, lysophosphatidylcholine, phosphatidylethanolamine, and sphingomyelin, with extraction recoveries typically between 89% and 95% [9].
Advanced mass spectrometry platforms have significantly enhanced lipidomic capabilities. The Echo MS+ system, an acoustic ejection (AE) system coupled with mass spectrometry, offers a high-throughput, contactless workflow for comprehensive lipid profiling, operating at speeds as fast as 4 seconds per sample for targeted lipid panels [9]. This technology enables minimal solvent volumes and small nanoliter extracts while maintaining sensitivity and minimizing variability.
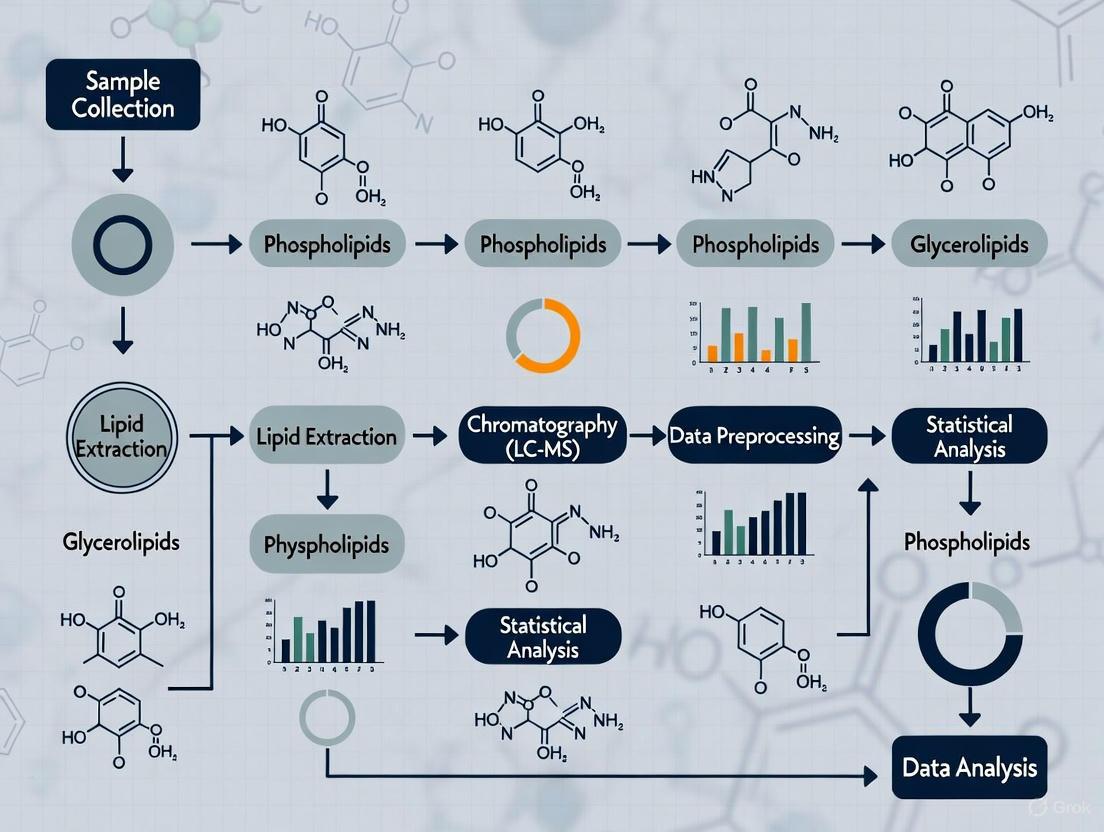
Diagram 1: Comprehensive Lipidomics Workflow from Sample to Analysis. This workflow outlines the major steps in lipidomic analysis, from sample preparation through data processing and application.
Analytical Approaches in Lipidomics
Lipidomics employs three primary analytical strategies, each with distinct applications and advantages:
Untargeted Lipidomics provides comprehensive, unbiased analysis of all detectable lipids in a sample. This approach utilizes high-resolution mass spectrometry (HRMS) techniques including Quadrupole Time-of-Flight Mass Spectrometry (Q-TOF MS), Orbitrap MS, and Fourier transform ion cyclotron resonance MS [3]. Data acquisition modes such as data-dependent acquisition (DDA), information-dependent acquisition (IDA), and data-independent acquisition (DIA) enable broad lipid coverage, making untargeted approaches particularly suitable for discovering novel lipid biomarkers and exploratory studies [3].
Targeted Lipidomics focuses on precise identification and quantification of specific, pre-defined lipid molecules with higher accuracy and sensitivity. This approach typically employs techniques such as ultra-performance liquid chromatography-triple quadrupole mass spectrometry (UPLC-QQQ MS) operating in multiple reaction monitoring (MRM) or parallel-reaction monitoring modes [3]. Targeted lipidomics is often used to validate potential biomarkers identified through initial untargeted screens and for rigorous quantitative analysis of specific lipid pathways.
Pseudo-targeted Lipidomics represents a hybrid approach that combines the comprehensive coverage of untargeted methods with the quantitative rigor of targeted techniques. This method uses information from initial untargeted analyses to develop targeted methods that achieve high coverage while maintaining quantitative accuracy [3]. Pseudo-targeted approaches offer high sensitivity, reliability, and good coverage, making them suitable for studying metabolic characteristics in complex diseases.
Data Analysis and Bioinformatics in Lipidomics
Statistical Processing and Visualization
The analysis of lipidomics data presents unique challenges due to the complexity and high-dimensionality of lipidomic datasets. Recent advances have addressed the need for standardized guidance for statistical processing and visualization in lipidomics and metabolomics [10]. Modern workflows utilize R and Python packages to perform critical steps including normalization, imputation, scaling, and visualization in a transparent and reproducible manner.
Essential statistical approaches include:
- Data normalization: Standards-based normalization accounting for analytical response factors and sample preparation variability
- Batch effect correction: Advanced algorithms such as LOESS (Locally Estimated Scatterplot Smoothing) and SERRF (Systematic Error Removal using Random Forest)
- Missing value imputation: Investigation of underlying causes of missingness rather than automatic imputation
- Multivariate statistics: Principal component analysis (PCA), partial least squares discriminant analysis (PLS-DA), and orthogonal PLS-DA (OPLS-DA)
Effective visualization techniques are crucial for interpreting lipidomics data. Recommended approaches include box plots with jitter or violin plots instead of traditional bar charts, volcano plots for differential analysis, dendrogram-heatmap combinations for visualizing sample clustering, and specialized visualizations such as lipid maps and fatty acyl-chain plots that reveal trends within lipid classes [10]. Dimensionality reduction techniques including PCA and Uniform Manifold Approximation and Projection (UMAP) support unsupervised data exploration and pattern recognition.
The lipidomics community has developed comprehensive resources to support data analysis and interpretation:
- LIPID MAPS Database: Provides reference information on lipid structures, taxonomy, and pathways
- Metabolights: Public repository for metabolomics and lipidomics data
- Lipidomics Standards Initiative: Develops and promotes standards for lipidomics data
- Laboratory of Lipid Metabolism GitBook: Curated resource with R/Python code for lipidomics data analysis [10]
These resources support the FAIR (Findable, Accessible, Interoperable, Reusable) data principles, enabling reproducible research and collaborative science in the lipidomics community [10].
The Scientist's Toolkit: Essential Research Reagents and Materials
Table 3: Essential Research Reagents and Materials for Lipidomics
| Category | Specific Items | Function/Purpose | Application Notes |
|---|---|---|---|
| Internal Standards | EquiSPLASH (16 ng mL−1), deuterated spike-in standards (54-component mix) | Quantitative accuracy; normalization against extraction variance | Included at known concentrations for nine lipid subclasses [7] [6] |
| Extraction Solvents | 1-octanol, methanol, butanol, ammonium formate (10mM) | Lipid extraction from biological matrices; carrier solvent for MS | Single-phase 1-octanol/methanol extraction shows 89-95% recovery [9] |
| Antioxidants | Butylated hydroxytoluene (BHT) | Prevent lipid oxidation during sample processing | Added to internal standard solution (0.01% v/v) [7] |
| Chromatography | Reversed-phase columns, HILIC columns, mobile phase solvents | Lipid separation prior to MS detection | Reduces spectral complexity and ion suppression [7] |
| Sampling Devices | Capillary tips (10 μm), microsampling devices (Mitra) | Single-cell isolation; volumetric microsampling | Yokogawa and Humanix tips for manual/automated sampling [7] |
| Cell Culture | DMEM, FBS, penicillin/streptomycin, L-glutamine | Cell maintenance for in vitro studies | Standard cell culture conditions (37°C, 5% CO2) [7] |
| S 9788 | S 9788, CAS:140945-01-3, MF:C28H33F2N7, MW:505.6 g/mol | Chemical Reagent | Bench Chemicals |
| SB-568849 | SB-568849|GPCR Research Compound|RUO | SB-568849 is a high-purity compound for GPCR and neuropharmacology research. For Research Use Only. Not for human or veterinary use. | Bench Chemicals |
Lipid Alterations in Disease and Clinical Applications
Lipidomics in Metabolic and Inflammatory Diseases
Comprehensive longitudinal lipidomic profiling has revealed dynamic alterations in the plasma lipidome associated with human health, disease, and ageing [6]. Studies analyzing >1,500 plasma samples from 112 participants followed for up to 9 years have identified distinct lipid signatures associated with health-to-disease transitions in diabetes, ageing, and inflammation.
Key findings include:
- Individuals with insulin resistance exhibit disturbed immune homeostasis and altered associations between lipids and clinical markers
- Accelerated changes in specific lipid subclasses occur during ageing in insulin-resistant individuals
- Dynamic changes in the plasma lipidome are observed during respiratory viral infection
- Lipid-cytokine networks demonstrate complex interactions between inflammatory mediators and lipid species
These findings suggest that lipids play roles in immune homeostasis and inflammation regulation, potentially guiding future monitoring and intervention strategies [6]. The highly personalized nature of lipid signatures, with intraparticipant variance consistently lower than interparticipant variance, highlights the potential for personalized approaches to disease management [6].
Lipidomics in Cancer and Gynecological Diseases
Lipidomics has shown significant promise in oncology, particularly in gynecological cancers where delayed diagnosis often impacts patient outcomes. In ovarian cancer, cervical cancer, and endometriosis, lipidomics offers new technical pathways for identifying potential biomarkers and understanding disease mechanisms [3].
Lipid metabolism is reprogrammed in cancer to support the energy demands of rapidly proliferating cancer cells [3]. Specific alterations include:
- Changes in phospholipid and sphingolipid profiles that may serve as early detection biomarkers
- Modifications in glycerophospholipid metabolism that influence membrane composition and signaling
- Alterations in eicosanoid and related lipid mediators that affect cancer-related inflammation
- Changes in sphingolipid ceramides that regulate cell death and survival pathways
These lipid alterations provide insights into cancer pathogenesis and offer opportunities for developing diagnostic tools and targeted therapeutic interventions [3].
Clinical Translation and Precision Health
Lipid profiling has demonstrated superior predictive capability for disease onset compared to genetic markers alone, with studies showing lipid profiles can predict disease 3-5 years earlier than genetic markers [5]. This early predictive capability has significant clinical implications, enabling earlier interventions and improved outcomes.
Clinical applications of lipidomics include:
- Personalized lipid analysis: Driving treatment decisions beyond genetic testing, with lipid-focused interventions showing 43% greater improvement in insulin sensitivity compared to genetic-based approaches [5]
- Therapeutic monitoring: Tracking lipid changes in response to interventions
- Risk stratification: Ceramide risk scores outperforming traditional cholesterol measurements in predicting cardiovascular events [5]
- Drug delivery systems: Lipid nanoparticle (LNP) technology enabling precise targeting of medications to specific tissues and cells, particularly in oncology [5]
The integration of lipidomics with other omics technologies (genomics, transcriptomics, proteomics) provides a comprehensive view of biological systems and enhances our understanding of disease mechanisms, supporting the development of precision medicine approaches [3].
Lipid diversity encompasses a vast array of molecular species with essential functions in cellular structure, signaling, and metabolism. The field of lipidomics has evolved rapidly, driven by technological advances in mass spectrometry, chromatography, and bioinformatics. Comprehensive lipidomic workflows now enable detailed characterization of lipid alterations associated with human health, disease, and ageing, providing insights into physiological and pathological processes.
The clinical translation of lipidomics is already demonstrating significant potential, with lipid-based diagnostic and therapeutic strategies outperforming traditional approaches for various conditions. As standardization improves and analytical technologies advance, lipidomics is poised to become an increasingly integral component of precision medicine, offering personalized insights into health and disease management.
Future directions include increased automation in lipid annotation, AI-driven feature assignment, closer integration with separation methods, and the development of scalable preprocessing approaches to handle increasing data volumes. These advances will further enhance our understanding of lipid diversity and function, opening new possibilities for diagnostic and therapeutic innovation.
Lipidomics, a specialized branch of metabolomics, has evolved into a distinct discipline dedicated to the comprehensive study of lipid molecules within biological systems [11]. Lipids are crucial cellular components, serving not only as structural elements of membranes but also as energy storage molecules and signaling mediators [12] [13]. The structural diversity of lipids—with over 180,000 possible species at the fatty acid constituent level—presents unique analytical challenges that require sophisticated workflows to unravel [14]. Mass spectrometry (MS) has emerged as the cornerstone technology for modern lipidomics due to its unparalleled sensitivity, selectivity, and versatility [13] [15]. This application note provides a detailed, step-by-step overview of the lipidomics workflow, framed within the context of methodological research from sample collection to data analysis, to guide researchers and drug development professionals in implementing robust lipidomics protocols.
Sample Collection and Preparation
Initial Collection Considerations
The foundation of any successful lipidomics study lies in proper sample collection and handling. Immediate processing or flash-freezing in liquid nitrogen is crucial, as enzymatic and chemical processes can rapidly alter lipid profiles post-collection [12]. For instance, leaving plasma samples at room temperature can artificially increase concentrations of lysophosphatidylcholine (LPC) and lysophosphatidic acid (LPA) [12]. Storage at -80°C is recommended for long-term preservation, though even at this temperature, storage duration should be minimized to prevent degradation [16] [12].
To minimize enzymatic activity and lipid degradation during collection, several strategies are effective:
- Use of appropriate anticoagulants (e.g., EDTA or heparin) for blood samples [16]
- Rapid processing and snap-freezing in liquid nitrogen for tissues [16]
- Immediate placement of samples on ice during handling [16]
- Incorporation of antioxidants like butylated hydroxytoluene (BHT) in extraction solvents to prevent oxidation, particularly for polyunsaturated fatty acids [14] [16]
Sample Homogenization
Homogenization methods must be tailored to sample type to ensure equal solvent accessibility to all lipids:
- Biofluids (serum, plasma): Homogenization is typically minimal [12]
- Tissue samples: Shear-force-based grinding with Potter-Elvehjem homogenizers or ULTRA-TURRAX systems in solvent, or crushing of liquid-nitrogen-frozen tissue using pestle and mortar [12]
- Cells: Disruption via pebble mill with beads or nitrogen cavitation bomb [12]
For tissue samples, recording the exact weight of tissue powder is critical as subsequent extraction volumes are adjusted based on this weight (typically 20 times the tissue weight in mg) [14].
Lipid Extraction Techniques
Several liquid-liquid extraction methods are commonly employed in lipidomics, each with distinct advantages:
Table 1: Comparison of Major Lipid Extraction Methods
| Method | Solvent Ratio | Phase Containing Lipids | Advantages | Limitations |
|---|---|---|---|---|
| Folch [17] | Chloroform:methanol:water (8:4:3, v/v/v) [14] | Lower organic phase (chloroform) | Well-established standard; high extraction efficiency | Use of hazardous chloroform; difficult automation |
| Bligh & Dyer [13] | Chloroform:methanol:water (1:2:0.8, v/v/v) | Lower organic phase (chloroform) | Suitable for small sample amounts (<50 mg tissue) | Chloroform collection from bottom layer; water-soluble impurity carry-over |
| MTBE [12] [13] | MTBE:methanol:water (5:1.5:1.45, v/v/v) | Upper organic phase (MTBE) | Easier handling; less hazardous; more feasible for automation | MTBE phase may carry water-soluble contaminants |
| BUME [12] [13] | Butanol:methanol + heptane:ethyl acetate + 1% acetic acid | Upper organic phase | Suitable for high-throughput in 96-well plates; avoids chloroform | Difficulty evaporating butanol component |
The Folch and Bligh & Dyer methods remain the most widely used protocols, though MTBE extraction is gaining popularity due to easier handling and reduced health concerns [12]. For specialized applications, solid-phase extraction (SPE) can be employed to purify or enrich specific lipid classes using normal phase silica gel, reverse phase (C8, C18), or ion exchange columns [17].
Internal Standards and Quality Control
Incorporation of internal standards is critical for quantitative lipidomics. These should be added prior to extraction to account for variations in extraction efficiency and matrix effects [14] [13]. A combination of class-representative internal standards is recommended, such as:
- Lysophosphatidylcholine (LPC 17:0, LPC 19:0)
- Phosphatidylcholine (PC 17:0/17:0, PC 19:0/19:0)
- Phosphatidylethanolamine (PE 15:0/15:0, PE 17:0/17:0)
- Triacylglyceride standards (TG 15:0/15:0/15:0, TG 17:0/17:0/17:0) [14]
Quality control procedures should include:
- Pooled quality control samples from all study samples [14]
- Standard reference materials (e.g., NIST SRM) [14] [18]
- Extraction blanks to monitor contamination [14]
Lipidomics Workflow: From Sample to Data
The following diagram illustrates the complete lipidomics workflow, integrating both sample preparation and analytical phases:
Analytical Approaches: LC-MS-Based Lipidomics
Chromatographic Separation
Liquid chromatography coupled to mass spectrometry (LC-MS) is the predominant approach in comprehensive lipidomics [11]. Reverse-phase chromatography using C18 columns is most common, separating lipids based on class, fatty acid constituents, and even positional isomers and double bond positions [14] [11]. The separation enhances specificity, reduces ion suppression, and aids in lipid identification [14].
Table 2: Typical LC Conditions for Lipid Separation
| Parameter | Specification | Notes |
|---|---|---|
| Column | C18 UHPLC column [14] | C30 columns also used for enhanced isomer separation [11] |
| Mobile Phase A | Acetonitrile:water (60:40, v/v) with 10 mM ammonium formate and 0.1% formic acid [14] | Aqueous phase |
| Mobile Phase B | Isopropanol:acetonitrile:water (90:8:2, v/v) with 10 mM ammonium formate and 0.1% formic acid [14] | Organic phase |
| Gradient | Increasing organic phase (B) from 30% to 100% | Optimized for lipid class elution |
| Reconstitution | 100% isopropanol [14] | After lipid extraction and drying |
Mass Spectrometric Analysis
High-resolution mass spectrometry (HRMS) is essential for distinguishing isobaric lipid species and achieving confident identifications [14] [11]. The following diagram details the LC-MS/MS data acquisition process:
Ionization techniques: Electrospray ionization (ESI) is the most popular soft-ionization method for lipid analysis, efficiently ionizing a broad range of intact molecular structures with minimal in-source fragmentation [13] [15]. Alternative techniques include atmospheric pressure chemical ionization (APCI) and matrix-assisted laser desorption/ionization (MALDI), the latter being particularly useful for MS imaging [13].
Tandem MS approaches: Both data-dependent acquisition (DDA) and data-independent acquisition (DIA) are employed:
- DDA: Selects most abundant precursors for fragmentation, providing rich MS/MS spectra
- DIA: Fragments all ions within selected m/z windows, providing more extensive coverage [14]
Common MS/MS techniques include product ion scan, precursor ion scan (PIS), neutral loss scan (NLS), and selected/multiple reaction monitoring (SRM/MRM) [13].
Data Processing and Statistical Analysis
Data Preprocessing
Raw MS data undergoes multiple processing steps before statistical analysis:
Feature detection and identification: Open-source software packages are commonly used for peak picking, alignment, and feature detection [14]. Lipid identification utilizes both MS and MS/MS spectra, matching fragmentation patterns against lipid databases [11].
Missing value imputation: Lipidomics datasets frequently contain missing values that require imputation strategies:
- Missing completely at random (MCAR): k-nearest neighbors (kNN) imputation recommended [18]
- Missing not at random (MNAR): Imputation using a percentage of the lowest concentration value (half-minimum method) [18]
Data normalization: Both pre-acquisition and post-acquisition normalization methods are employed:
- Pre-acquisition: Normalization to protein amount, tissue weight, cell count, or fluid volume [13] [18]
- Post-acquisition: Normalization to internal standards, quality control-based correction, or statistical normalization (sum, median, probabilistic quotient normalization) [18]
Statistical Analysis and Data Interpretation
A combination of univariate and multivariate statistical methods is employed to extract biological insights:
Univariate methods: Analyze lipid features independently using:
- Student's t-test (for two-group comparisons)
- ANOVA (for multiple group comparisons)
- False discovery rate (FDR) correction for multiple testing [11]
Multivariate methods: Analyze lipid features simultaneously to identify relationship patterns:
- Principal component analysis (PCA) for unsupervised pattern recognition
- Partial least squares-discriminant analysis (PLS-DA) for supervised classification [11]
Enrichment analysis and pathway mapping: Tools like LipidSig enable enrichment analysis based on lipid class, chain length, unsaturation, and other structural characteristics [19]. This helps identify biologically relevant patterns beyond individual lipid species.
Advanced visualization: Specialized plots including volcano plots, lipid maps, and fatty acyl chain plots help visualize complex lipidomic data [18].
The Scientist's Toolkit: Essential Research Reagent Solutions
Table 3: Essential Materials and Reagents for Lipidomics Research
| Item | Specification | Function/Application |
|---|---|---|
| Extraction Solvents | LC-MS grade chloroform, methanol, MTBE, water | Lipid extraction with minimal interference |
| Internal Standards | SPLASH LIPIDOMIX or custom mixtures | Quantification and quality control |
| LC Mobile Phase Additives | Ammonium formate, formic acid (LC-MS grade) | Enhance ionization and adduct formation |
| Antioxidants | Butylated hydroxytoluene (BHT) | Prevent oxidation of unsaturated lipids |
| UHPLC Columns | C18 (1.7-1.9 μm particle size, 100 × 2.1 mm) | Reverse-phase lipid separation |
| Quality Control Materials | NIST SRM 1950, pooled study samples | Monitor analytical performance |
| Solid Phase Extraction | Silica, C8, C18, amine columns | Lipid class-specific purification |
| Sample Tubes | Polypropylene Eppendorf/conical tubes | Prevent lipid adsorption to surfaces |
| (-)-Stylopine | (-)-Stylopine, CAS:7461-02-1, MF:C19H17NO4, MW:323.3 g/mol | Chemical Reagent |
| N3-D-Dap(Fmoc)-OH | N3-D-Dap(Fmoc)-OH, MF:C18H16N4O4, MW:352.3 g/mol | Chemical Reagent |
This application note has detailed the comprehensive lipidomics workflow from sample collection to data interpretation. The critical importance of proper sample handling and preparation cannot be overstated, as these pre-analytical steps profoundly impact data quality and biological conclusions. The combination of robust chromatography with high-resolution mass spectrometry enables the separation and identification of complex lipid mixtures, while appropriate statistical approaches and bioinformatics tools extract meaningful biological insights from the resulting data. As lipidomics continues to evolve, standardization of protocols and data reporting will be essential for advancing our understanding of lipid biology and its implications in health and disease.
In lipidomics, the pre-analytical phase—encompassing sample collection, homogenization, and storage—constitutes the most critical yet vulnerable stage in the workflow. Inappropriate handling during these initial steps can induce significant artifactual changes in the lipid profile, leading to enzymatic degradation, oxidation, and hydrolysis of lipid species [20] [21]. Such alterations obscure true biological signals and compromise data integrity, making subsequent sophisticated analyses futile. This application note details standardized, evidence-based protocols designed to preserve the native lipidome from the moment of sample acquisition, providing a robust foundation for accurate lipidomic analysis in research and drug development.
Sample Collection and Immediate Pre-analytics
The initial moments following sample collection are paramount for preserving lipid integrity. Immediate action is required to quench ongoing metabolism and prevent artifactual generation of lipid species.
Key Principles for Sample Collection
- Rapid Processing: Tissues should be frozen immediately in liquid nitrogen, while biofluids like plasma should be processed without delay or frozen at -80°C [20]. Prolonged exposure to room temperature accelerates enzymatic and chemical degradation processes such as lipid peroxidation or hydrolysis [20] [21].
- Inhibition of Degradation: For specific lipid classes like lysophosphatidic acid (LPA) and sphingosine-1-phosphate (S1P), which are generated instantly post-sampling, special precautions are required to preserve in vivo concentrations [20]. Lipolytic activity can continue even after the addition of organic solvents [20].
- Matrix-Specific Considerations: Different sample types demand tailored approaches. For instance, blood plasma collected with EDTA anticoagulant is preferred, and the potential for zonal distribution of lipids in tissues like liver must be accounted for during sampling [22] [14].
Table 1: Recommended Sample Collection Procedures by Sample Type
| Sample Type | Primary Collection Method | Immediate Processing | Critical Considerations |
|---|---|---|---|
| Tissue | Snap-freeze in liquid nitrogen [22] [14] | Homogenize or powder while frozen | Minimize sample heating; ensure representativity [22]. |
| Blood Plasma/Serum | Draw into EDTA tubes; centrifuge to separate [14] | Aliquot and freeze at -80°C | Plasma is generally preferred; note LPA/S1P generation in serum [20]. |
| Mammalian Cells | Pellet cells at 311 × g for 5 min at 4°C [14] | Wash with cold buffer; freeze pellet at -80°C | Avoid repeated freeze-thaw cycles. |
| Latent Fingerprints (Sebum) | Deposit on foil [23] | Process immediately or store foil at -20°C | A non-invasive method for specific lipid classes like TAG and WE [23]. |
Preventing Specific Lipid Artefacts
- Oxidation: To prevent oxidation, add Butylated Hydroxytoluene (BHT) to extraction solvents [14]. Protect samples from light and oxygen by storing in airtight containers [21] [24]. Lipids with polyunsaturated fatty acyl chains (PUFAs) are particularly susceptible [21].
- Enzymatic Degradation: Enzymes like phospholipases (PLA1, PLA2, PLD) and lipases can hydrolyze lipids, generating artifacts like lysophospholipids and free fatty acids [21]. Immediate denaturation using organic solvents or heat is effective.
- Hydrolysis and Isomerization: In samples kept at room temperature and pH >6, scrambling of fatty acyls in lysophospholipids can occur, resulting in a loss of regioisomeric specificity [20].
Tissue Homogenization and Lipid Extraction
The goal of homogenization and extraction is to achieve complete and unbiased recovery of all lipid classes from the complex biological matrix. The method chosen significantly influences the final analytical outcome [22].
Homogenization Techniques
Two primary homogenization methods are commonly employed, each with distinct advantages and limitations.
- Grinding in Liquid Nitrogen: This method, using a mortar and pestle, is considered a gold standard for tissues. It minimizes sample heating and provides a homogeneous powder representing the overall lipid composition, which is ideal for experiments requiring identical source material [22] [14].
- Bead-Based Homogenization: This approach is performed directly in organic solvents and is advantageous for high-throughput studies due to its simplicity and throughput capabilities [22]. Studies show bead-based homogenization results in efficient lipid recovery independent of solvent composition, unlike grinding methods [22].
Solvent Selection and Extraction Protocols
The choice of solvent system is critical for efficient lipid recovery. No single solvent perfectly extracts all lipid classes, so the protocol must be matched to the target lipids [20] [25].
- Classical Biphasic Methods: These methods, such as Folch (chloroform:methanol:water, 8:4:3, v/v/v) and Bligh & Dyer, are the gold standards for comprehensive lipid extraction [20] [14]. The MTBE (methyl-tert-butyl ether) method is a less toxic alternative that provides good recovery for many lipid classes [20] [25].
- Monophasic Methods: These are simpler and more amenable to automation but may not provide the same broad lipid coverage as biphasic methods and can lead to selective loss of nonpolar lipids [20].
- Green Solvent Alternatives: Recent research identifies Cyclopentyl Methyl Ether (CPME) and 2-Methyltetrahydrofuran (2-MeTHF) as sustainable, less hazardous alternatives to chloroform with comparable or even superior extraction efficiency for human plasma [25].
Table 2: Comparison of Common Lipid Extraction Methods
| Extraction Method | Solvent Composition | Recommended Application | Pros & Cons |
|---|---|---|---|
| Folch [14] | Chloroform:MeOH:Water (8:4:3, v/v/v) | Comprehensive lipidomics; broad lipid classes [20] [14] | Pro: High recovery of polar & nonpolar lipids.Con: Chloroform toxicity. |
| Bligh & Dyer [22] | Chloroform:MeOH:Water (1:2:0.8, v/v/v) | Polar lipids (e.g., phospholipids); acidic lipids with protocol adjustment [20] | Pro: Slightly better for polar lipids.Con: Lower nonpolar lipid recovery vs. Folch. |
| MTBE [25] | MTBE:MeOH:Water (10:3:2.5, v/v/v) | Broad lipid profiling; high-throughput needs [20] | Pro: Reduced toxicity; good recovery.Con: May require optimization for specific classes. |
| CPME-based [25] | MeOH/MTBE/CPME (1.33:1:1, v/v/v) | Sustainable alternative to chloroform methods. | Pro: Greener, safer, comparable performance.Con: Relatively new, requires validation. |
The following workflow diagram summarizes the key decision points and steps in the sample preparation process.
Sample Storage Protocols
Proper storage conditions are essential for maintaining lipid stability over time, especially in large-scale studies where samples may be stored for weeks or months before analysis [21].
Storage of Intact Samples and Lipid Extracts
- Intact Tissues and Biofluids: Must be stored at -80°C for long-term preservation [20] [14]. The stability of specific lipid classes under these conditions should be verified for the studied species [20].
- Lipid Extracts: After preparation, dried lipid extracts should be reconstituted and stored in organic solvents with antioxidants like BHT at -20°C or lower in an airtight container without exposure to light or oxygen [21] [24]. This reduces sublimation and chemically/physical induced transformations.
- Alternative Storage for Specific Samples: For latent fingerprint samples, storing the foil deposits directly at -20°C and delaying extraction until analysis is a viable option, minimizing batch-to-batch variability [23].
Quality Control and Stability Assessment
Integrating quality control measures is mandatory for monitoring lipid stability.
- Internal Standards: Add a cocktail of synthetic lipid internal standards prior to homogenization and extraction to correct for losses during sample preparation and analysis [20] [14].
- Stability Markers: Monitor known degradation markers, such as specific lysophospholipids (e.g., LPC 18:2) or sphingosine-1-phosphate, to assess sample quality and pre-analytical variation [21].
- Pooled Quality Controls (QCs): Create a pooled QC sample from an aliquot of all samples to analyze throughout the batch, allowing for the monitoring of instrumental performance and data quality [14].
The Scientist's Toolkit: Essential Research Reagents and Materials
The following table lists key reagents, solvents, and materials crucial for implementing robust pre-analytical protocols in lipidomics.
Table 3: Essential Research Reagents and Materials for Lipidomics Sample Preparation
| Item | Function & Application | Examples & Notes |
|---|---|---|
| Internal Standards | Corrects for extraction efficiency & MS variability; enables quantification [14]. | SPLASH LIPIDOMIX (Avanti); class-specific standards (e.g., PC 17:0/17:0, TG 17:0/17:0/17:0) [22] [14]. |
| Chloroform | Primary solvent in Folch/Bligh & Dyer; dissolves broad lipid range [20] [14]. | Health Warning: Toxic—use in fume hood. Consider greener alternatives like CPME [25]. |
| Methanol | Disrupts H-bonds, denatures proteins, quenches enzymes [25]. | LC-MS grade recommended to avoid contaminants. |
| Methyl-tert-butyl ether (MTBE) | Less toxic alternative for chloroform in biphasic extraction [20] [25]. | Used in MTBE-based extraction protocols [25]. |
| Cyclopentyl Methyl Ether (CPME) | Green solvent alternative to chloroform [25]. | Shows comparable/superior performance to Folch in some applications [25]. |
| Butylated Hydroxytoluene (BHT) | Antioxidant added to solvents to inhibit lipid oxidation [21] [14]. | Typical concentration: 1 mM in extraction methanol [14]. |
| Bead Homogenizer | Efficient tissue/cell disruption directly in solvent (e.g., Precellys) [22]. | Uses ceramic/zirconium oxide beads (soft tissue) or stainless steel (hard tissue) [14]. |
| Mortar and Pestle | Grinding frozen tissue in liquid nitrogen for homogenization [22] [14]. | Provides homogenous powder; minimizes heating. |
| Polypropylene Tubes | Sample storage and extraction; prevents lipid adhesion [14]. | Preferred over glass for certain applications to avoid analyte binding. |
| Formic Acid / Ammonium Formate | Mobile phase additives for LC-MS to improve ionization and separation [14] [26]. | Concentration typically 0.1% formic acid and 10 mM ammonium formate [14]. |
| E3 ligase Ligand 8 | E3 ligase Ligand 8, MF:C31H34N2O6, MW:530.6 g/mol | Chemical Reagent |
| Tigloside | Tigloside, CAS:216590-44-2; 3625-57-8, MF:C54H78O27, MW:1159.191 | Chemical Reagent |
{#introduction}
Lipid extraction is a critical first step in the lipidomics workflow, serving as the foundation for accurate and reproducible mass spectrometry analysis. The efficiency and selectivity of the extraction protocol directly influence the depth and coverage of the subsequent lipidomic profile. This Application Note provides a detailed overview and comparison of three major lipid extraction techniques: the classical Folch and Bligh & Dyer methods, which utilize chloroform/methanol, and the increasingly popular methyl-tert-butyl ether (MTBE) method. Understanding the principles, advantages, and limitations of each technique is essential for researchers and drug development professionals to select the optimal protocol for their specific biological sample, ensuring a robust lipidomic workflow from sample collection to data analysis [27] [28].
{##key-techniques}
Key Techniques and Comparative Analysis
{###comparison-table}
Comparative Analysis of Lipid Extraction Methods
The following table summarizes the key parameters of the three major lipid extraction techniques, facilitating a direct comparison for method selection.
| Parameter | Folch Method [29] [28] [30] | Bligh & Dyer Method [28] [31] | MTBE Method [32] [33] [34] |
|---|---|---|---|
| Primary Solvent System | Chloroform/Methanol (2:1, v/v) [29] [30] | Chloroform/Methanol/Water (1:2:0.8, v/v/v) [31] | MTBE/Methanol/Water (varies; e.g., 8:2:2, v/v/v) [33] [35] |
| Sample Type | Tissues, cells, fluids [28] | Liquid samples, homogenates, cell suspensions [31] | Plasma, cells, tissues, CSF [33] [34] [35] |
| Phase Separation | Organic (lower) phase contains lipids [28] | Organic (lower) phase contains lipids [31] | Organic (upper) phase contains lipids [32] [34] |
| Key Advantage | Considered the "gold-standard"; more accurate for samples with >2% lipid content [31] | Rapid; suitable for samples with high water content [31] | Faster, cleaner recovery; safer solvent; easier collection of upper organic phase [32] |
| Limitation | Uses toxic chloroform; more complex phase collection [28] | Underestimates lipid content in fatty samples (>2% lipids) [31] | Relatively newer method compared to classical protocols [32] |
| Compatibility | High-throughput LC-MS/MS lipidomics with adaptations [28] | LC-MS/MS lipidomics [28] | Highly compatible with automated shotgun profiling and LC-MS/MS [32] [33] |
{###workflow-diagram}
Lipidomic Workflow in Research
The following diagram illustrates the position of lipid extraction within the broader context of a standardized lipidomics research workflow.
{##detailed-protocols}
Detailed Experimental Protocols
{###mtbe-protocol}
MTBE-Based Extraction Protocol
This protocol is well-suited for automated shotgun profiling and LC-MS/MS analysis, offering a safer alternative to chloroform-based methods [32] [33].
{###procedure}
Procedure
- Protein Precipitation and Extraction: To a sample (e.g., 100 µL of plasma in a 1.5 mL microtube), add 200 µL of cold methanol and vortex. Then, add 800 µL of cold methyl-tert-butyl ether (MTBE) and vortex again [33] [34].
- Incubation: Cap the tube and incubate at 2-8°C for 1 hour to ensure complete protein precipitation and lipid extraction [34].
- Phase Separation: Add 200-300 µL of water to the mixture [33] [34]. Vortex the tube for 10 seconds and then centrifuge at 4°C for 10 minutes (e.g., 10,000 × g) to achieve phase separation [33] [35].
- Organic Phase Collection: Carefully collect the upper organic phase (MTBE layer), which contains the extracted lipids, using a pipette [33] [34].
- Drying and Storage: Dry the collected organic phase under a stream of nitrogen or in a SpeedVac concentrator. Store the dried lipid extract at -80°C until analysis [33] [35].
- Reconstitution for MS: For mass spectrometry analysis, reconstitute the dried lipids in an appropriate solvent mixture, such as 20-40 µL of acetonitrile/isopropanol/water (65:30:5, v/v/v) [33].
{###folch-protocol}
Modified Folch Protocol
This is a common modification of the classical Folch method for extracting lipids from cell pellets [29].
{####procedure}
Procedure
- Solvent Addition: Add 2 mL of chloroform and 1 mL of methanol to a sample (e.g., a cell pellet resuspended in 1.5 mL of water) in a glass vial. To prevent oxidation, add the antioxidant butylated hydroxytoluene (BHT) at a concentration of 50 µg/mL during extraction [29].
- Acidification: Add 500 µL of 1N HCl to bring the final concentration to 0.1 N. Vortex the mixture thoroughly and incubate it on ice for 20 minutes [29].
- Centrifugation: Centrifuge the sample at 2,000 × g for 5 minutes at 4°C to separate the phases [29].
- Organic Phase Collection: Transfer the lower organic (chloroform) layer to a new tube.
- Aqueous Re-extraction: To the remaining aqueous layer, add 1.5 mL of a 2:1 chloroform:methanol solution. Vortex and centrifuge again. Combine this organic layer with the one collected in the previous step [29].
- Drying and Storage: Dry the combined organic layers under a stream of nitrogen. The dried lipid extract can be resuspended in 240 µL of a 1:1 methanol:isopropanol mixture and stored at -80°C [29].
{###bligh-dyer-protocol}
Bligh & Dyer Protocol
This method is particularly suitable for lipid extraction from incubation media, tissue homogenates, or cell suspensions [31].
{####procedure}
Procedure
- Initial Homogenization: To a sample containing 1 mL of water (e.g., cell suspension, plasma), add 3.75 mL of a chloroform/methanol (1:2, v/v) mixture. Vortex for 10-15 minutes [31].
- Partitioning: Add 1.25 mL of chloroform, mix for 1 minute, and then add 1.25 mL of water, mixing for another minute [31].
- Centrifugation: Centrifuge the mixture to separate the two liquid phases. A disk of precipitated proteins will form at the interface [31].
- Organic Phase Collection: Discard the upper aqueous phase. Carefully collect the lower organic (chloroform) phase by pipetting through the protein disk [31].
- Evaporation: After evaporation of the solvent, the lipid extract can be redissolved in a small volume of chloroform/methanol (2:1, v/v) for further analysis [31].
{##the-scientists-toolkit}
The Scientist's Toolkit
{###research-reagent-solutions}
Research Reagent Solutions
The following table lists essential materials and reagents used in lipid extraction protocols, along with their primary functions.
| Reagent/Material | Function in Lipid Extraction |
|---|---|
| Chloroform | Primary non-polar solvent for dissolving neutral lipids and forming the organic phase in Folch and Bligh & Dyer methods [28]. |
| Methanol | Polar solvent that disrupts lipid-protein complexes and helps in the extraction of polar lipids [28]. |
| Methyl-tert-butyl ether (MTBE) | Less toxic, low-density ether solvent that forms the upper organic phase in the MTBE method, enabling easier collection [32] [34]. |
| Water | Used to induce phase separation between organic and aqueous layers; hydration aids in solvent penetration [33] [28] [31]. |
| Butylated Hydroxytoluene (BHT) | Antioxidant added to the solvent mixture to prevent oxidation of unsaturated lipids during the extraction process [29]. |
| Hydrochloric Acid (HCl) / Acetic Acid | Used to acidify the extraction medium, which improves the recovery of acidic phospholipids by blocking their binding to denatured proteins [29] [31]. |
| Salt Solutions (e.g., NaCl, KCl) | Salt solutions are used in washing steps to remove non-lipid contaminants from the organic extract [28] [31]. |
| Fmoc-Ala-Pro-OH | Fmoc-Ala-Pro-OH, CAS:186023-44-9, MF:C23H24N2O5, MW:408.454 |
| Jasminoside | Jasminoside, MF:C26H30O13, MW:550.5 g/mol |
{###method-selection-diagram}
Lipid Extraction Method Selection Logic
Choosing the correct extraction method is critical for success. The following decision logic aids in selecting the most appropriate protocol based on key sample and research criteria.
{##integration-workflow}
Integration into a Comprehensive Lipidomics Workflow
A robust lipidomics study extends beyond extraction. Subsequent steps, including mass spectrometric analysis and data processing, are crucial for generating high-quality, biologically meaningful data. Following extraction and LC-MS/MS analysis, the application of standardized statistical workflows in R or Python is recommended for data processing, normalization, and visualization. These tools help address challenges in reproducibility and transparency, offering modular components for diagnostic visualization (e.g., PCA, QC trends), batch effect correction, and sophisticated plots like lipid maps and volcano plots, ultimately guiding data interpretation and biological insight [10]. Adherence to guidelines from the Lipidomics Standards Initiative (LSI) throughout the entire workflow ensures data quality and interoperability across studies [10].
Lipidomics, the large-scale study of lipid pathways and networks in biological systems, relies heavily on mass spectrometry (MS) for the identification and quantification of lipid species [36]. The initial and critical step of converting neutral lipid molecules into gas-phase ions is performed by the ion source, making the choice of ionization technique a cornerstone of any lipidomic workflow [37]. The structural diversity of lipids—encompassing variations in acyl chain length, double bond position, and stereochemistry—poses a significant analytical challenge. No single ionization technique is universally optimal, and the choice depends heavily on the analytical goals, the lipid classes of interest, and the chromatographic method employed [38] [37].
This article provides a detailed overview of three key ionization techniques—Electrospray Ionization (ESI), Matrix-Assisted Laser Desorption/Ionization (MALDI), and Atmospheric Pressure Chemical Ionization (APCI)—within the context of a complete lipidomic workflow. We will present standardized experimental protocols and data to guide researchers in selecting and implementing the most appropriate ionization method for their specific lipid analysis challenges.
Ionization techniques are broadly categorized as "hard" or "soft." Hard ionization, such as Electron Ionization (EI), uses high-energy processes that cause extensive analyte fragmentation, which is often undesirable for intact lipid analysis. In contrast, ESI, MALDI, and APCI are "soft" ionization techniques that preserve the molecular ion, making them particularly suitable for lipidomic profiling [37].
The following table summarizes the fundamental principles, strengths, and limitations of ESI, MALDI, and APCI for lipid analysis.
Table 1: Comparison of Key Soft Ionization Techniques in Lipid Analysis
| Feature | Electrospray Ionization (ESI) | Matrix-Assisted Laser Desorption/Ionization (MALDI) | Atmospheric Pressure Chemical Ionization (APCI) |
|---|---|---|---|
| Principle | Spraying a solution to create charged droplets; ions form via desolvation [39] [37]. | Mixing analyte with a light-absorbing matrix; laser pulse causes desorption/ionization [40] [37]. | Nebulization and vaporization followed by gas-phase chemical ionization via corona discharge [41] [37]. |
| Ionization Mode | Solution-phase | Solid-phase | Gas-phase |
| Typical Fragmentation | Minimal in-source fragmentation | Minimal in-source fragmentation | More pronounced in-source fragmentation [41] |
| Compatibility | Direct infusion ("shotgun") or coupled with LC (especially RPLC) [42]. | Primarily used for direct analysis or mass spectrometry imaging (MSI) [40]. | Coupled with LC (compatible with normal-phase solvents like isooctane) [41]. |
| Key Strength | Excellent for polar lipids and large biomolecules; can generate multiply charged ions; high sensitivity [37] [42]. | High spatial resolution for imaging; fast analysis; relatively tolerant to salts [40] [43]. | Effective for less polar, semi-volatile, and neutral lipids (e.g., sterol esters, triacylglycerols) [41] [37]. |
| Key Limitation | Susceptible to ion suppression from matrix effects [37]. | Less suited for quantitative analysis due to matrix interference [37]. | Not ideal for thermally labile or very polar lipids (e.g., lysophospholipids) [41]. |
Detailed Techniques and Application Protocols
Electrospray Ionization (ESI) with Post-Column Lithium Adduct Enhancement
Principle: ESI works by applying a high voltage to a liquid sample, creating a fine spray of charged droplets. As the solvent evaporates, the charge concentrates until gas-phase ions of the analyte are produced. It is highly effective for a wide range of phospholipids and is the most common interface for LC-MS-based lipidomics [37] [42]. A powerful strategy to enhance the detection of certain lipid classes is the post-column infusion of lithium salts to form stable [M+Li]⺠adducts, which improves sensitivity and provides characteristic fragmentation for structural elucidation [41] [39].
Experimental Protocol: NPLC-ESI-MS with Post-Column Lithium Addition
- Sample Preparation: Extract lipids from biological samples (e.g., heart, brain, liver) using a validated liquid-liquid extraction method, such as MeOH/MTBE, which has demonstrated excellent recovery (>85%) for phospholipids [42].
- Chromatography:
- Column: Normal-phase column for lipid class separation.
- Mobile Phase: Non-polar gradient starting with solvents like isooctane, moving to more polar solvents like ethyl acetate or acetone [41].
- Post-Column Modification:
- Solution: Prepare a 0.10 mM solution of lithium chloride in a solvent compatible with both the NPLC eluent and ESI process (e.g., isopropanol) [41].
- Infusion: Use a syringe pump or a dedicated makeup flow to introduce the lithium solution post-column at an optimized flow rate.
- MS Acquisition:
- Ion Source: ESI in positive mode.
- Key Parameters: Monitor for [M+Li]⺠adducts. This method significantly enhances the detection and study of molecular species in sterol esters (SE), triacylglycerols (TG), and acylated steryl glucosides (ASG), while also improving signals for monoacylglycerols (MG) and lysophosphatidylcholines (LPC) [41].
Table 2: Lipid Classes Amenable to Lithium Adduct Formation and Their Benefits
| Lipid Class | Adduct Type | Key Analytical Benefit |
|---|---|---|
| Triacylglycerols (TG) | [M+Li]⺠| Stabilizes the molecular ion, enables structural analysis via tandem MS [41] [39] |
| Sterol Esters (SE) | [M+Li]⺠| Facilitates detection, which is hindered by in-source fragmentation in APCI [41] |
| Glycerophospholipids | [M+Li]⺠| "Lithium adduct consolidation" can increase sensitivity and provide informative fragments [41] [39] |
Matrix-Assisted Laser Desorption/Ionization (MALDI) for Spatial Lipidomics
Principle: In MALDI, the sample is co-crystallized with a UV-absorbing organic matrix. A pulsed laser irradiates the matrix, which transfers energy to the analyte, causing desorption and ionization. A major application is MALDI Mass Spectrometry Imaging (MALDI-MSI), which allows for the label-free visualization of the spatial distribution of hundreds of lipids directly in tissue sections [40] [43].
Experimental Protocol: MALDI-MSI of Lipids in Tissue Sections
- Sample Preparation:
- Tissue Preservation: Snap-freeze fresh tissue in liquid nitrogen and section (5-20 µm thickness) using a cryostat. Mount sections on conductive indium tin oxide (ITO) glass slides [40].
- Matrix Application: Apply a homogeneous layer of matrix (e.g., 4-(dimethylamino)cinnamic acid, DMACA) via automated spray coating or sublimation. Sublimation is preferred for high spatial resolution as it minimizes analyte delocalization [40] [43].
- MS Acquisition:
- Instrument: MALDI-time-of-flight (TOF) or MALDI-timsTOF systems.
- Spatial Resolution: Set the raster width to the desired pixel size (typically 5-50 µm for cellular resolution, down to 1 µm for subcellular features) [40] [43].
- Mass Resolution: Acquire data in high-resolution mode to confidently assign lipid masses.
- Data Analysis: Use specialized software to generate ion images based on the intensity of specific m/z values, correlating lipid signatures with tissue histology [40].
Innovation Note: A recent advanced sample preparation method involves pre-staining tissue sections with cresyl violet before matrix application. This method has been shown to enhance lipid signal intensities by an order of magnitude and enables simultaneous imaging of lipids and nucleotides at subcellular resolution (down to 1 µm pixel size) [43].
Atmospheric Pressure Chemical Ionization (APCI) for Neutral Lipids
Principle: APCI is a gas-phase ionization technique. The sample solution is nebulized and vaporized in a heated chamber. A corona discharge needle creates primary ions from the solvent vapour, which then undergo ion-molecule reactions to protonate the analyte molecules ([M+H]âº) [37]. This technique is less susceptible to ion suppression from polar matrix components and is well-suited for less polar lipids.
Experimental Protocol: NPLC-APCI-MS for Global Lipid Class Analysis
- Sample Preparation: Use standard lipid extraction protocols (e.g., Bligh & Dyer).
- Chromatography:
- MS Acquisition:
- Ion Source: APCI in positive mode.
- Key Parameters: Optimize vaporizer temperature and corona current. A key feature of APCI is the generation of in-source fragment ions (e.g., [MG+H-H₂O]⺠for monoacylglycerols) that provide information on the distribution of esterified fatty acyls within a lipid family [41].
Application Insight: The NPLC-APCI-MS method is powerful for profiling up to 30 lipid classes in a single analysis. However, it may struggle with very polar lipids (e.g., LPC) at the end of the gradient and can cause excessive in-source fragmentation of certain classes like sterol esters, which is why the ESI-lithium method serves as a valuable complement [41].
The Scientist's Toolkit: Essential Reagents and Materials
Table 3: Key Research Reagent Solutions for Lipidomics Ionization Workflows
| Item / Reagent | Function in Lipid Analysis |
|---|---|
| Lithium Chloride (LiCl) / Lithium Acetate | Cationizing agent for post-column adduct formation in ESI; stabilizes molecular ions and enhances sensitivity for neutral lipids [41]. |
| MALDI Matrix (e.g., DMACA) | Light-absorbing compound mixed with the sample to enable efficient desorption and ionization of lipids by laser irradiation [40] [43]. |
| MTBE (Methyl tert-butyl ether) | Organic solvent for liquid-liquid extraction (e.g., MeOH/MTBE); provides high recovery (>85%) for diverse phospholipid classes [42]. |
| Deuterated Internal Standards (e.g., SPLASH Lipidomix) | Mixture of stable isotope-labeled lipids; essential for correcting for extraction efficiency, matrix effects, and instrumental variability during semi-quantification [42]. |
| Cresyl Violet | Pre-staining dye that, when applied before matrix deposition, dramatically improves lipid signal intensity and enables subcellular MSI [43]. |
| Isomorellinol | Isomorellinol, MF:C33H38O7, MW:546.6 g/mol |
| 3-O-Methyl-DL-DOPA | 3-Methoxytyrosine |
Lipidomics Workflow and Technique Selection Pathway
The following diagram illustrates the decision-making process for integrating these ionization techniques into a complete lipidomic workflow, from sample collection to data analysis.
Diagram Title: Lipidomics Workflow & Ionization Technique Selection
The selection of an ionization technique—ESI, MALDI, or APCI—is a fundamental decision that shapes the scope and success of a lipidomics study. ESI excels in sensitivity and compatibility with LC for comprehensive profiling, MALDI is unmatched for spatial mapping in tissues, and APCI provides robust analysis of neutral lipid classes. As demonstrated by innovative approaches like post-column lithium addition in ESI and pre-staining in MALDI-MSI, the ongoing refinement of these core techniques continues to deepen our ability to unravel the complexity of the lipidome. By understanding the principles, applications, and practical protocols outlined in this article, researchers can make informed choices to effectively address their specific biological questions.
Analytical Strategies and Advanced Applications in Lipidomics
Lipidomics, the comprehensive analysis of lipids in biological systems, has emerged as a crucial discipline for understanding cellular functions, signaling pathways, and disease mechanisms. As a branch of metabolomics, lipidomics provides unique insights into lipid metabolism and its dysregulation in various pathological conditions [44]. Mass spectrometry (MS) has become the cornerstone technology in lipidomics due to its high sensitivity and specificity, with two primary approaches dominating the field: shotgun lipidomics and liquid chromatography-mass spectrometry (LC-MS) based lipidomics [45]. These methodologies offer complementary advantages and limitations, making the choice between them critical for experimental success. This guide provides a detailed comparison of these platforms, along with practical protocols to assist researchers in selecting and implementing the most appropriate approach for their specific research questions in drug development and basic science.
The fundamental difference between these approaches lies in sample introduction. Shotgun lipidomics involves the direct infusion of lipid extracts into the mass spectrometer without prior chromatographic separation, exploiting the unique chemical and physical properties of lipids for their identification and quantification [44] [45]. In contrast, LC-MS based lipidomics incorporates liquid chromatographic separation before mass spectrometric analysis, reducing complexity at the point of ionization and separation of isomeric species [46]. Both approaches have evolved significantly, with shotgun lipidomics expanding into multi-dimensional platforms and high-resolution systems, while LC-MS methodologies have advanced with techniques such as ion mobility spectrometry and electron-activated dissociation to enhance lipid coverage and confidence in identification [45] [46].
Fundamental Principles and Instrumentation
Shotgun Lipidomics: Core Concepts and Platforms
Shotgun lipidomics operates on the principle of analyzing lipids directly from organic extracts of biological samples under constant concentration conditions during direct infusion [44]. This unique feature allows researchers to perform detailed tandem mass spectrometric analyses without time constraints typically encountered during chromatographic elution. The identification of lipid species relies on recognizing that most lipids represent linear combinations of fundamental building blocks, including glycerol, sphingoid bases, polar head groups, and fatty acyl substituents [44].
Three major platforms of shotgun lipidomics are currently in practice:
Profiling by Class-Specific Fragments: This approach uses characteristic fragments after collision-induced dissociation to determine individual molecular species through precursor-ion or neutral loss scanning. Internal standards are added during extraction to correct for experimental factors and enable accurate quantification [44].
Tandem MS with High-Resolution Mass Spectrometers: This methodology employs high mass accuracy/high mass resolution mass spectrometers (e.g., quadrupole-time-of-flight instruments) to acquire product ion spectra of each molecular ion. Identification occurs through bioinformatic reconstruction of fragments from precursor-ion or neutral loss scans, with quantification achieved by comparing fragment intensities to preselected internal standards [44].
Multidimensional Mass Spectrometry-Based Shotgun Lipidomics (MDMS-SL): This advanced platform creates two-dimensional mass spectrometric maps analogous to 2D NMR spectroscopy. The first dimension represents molecular ions, while the second dimension represents building blocks characteristic of lipid classes. This approach facilitates the identification of individual lipid molecular species, including the deconvolution of isomeric species, and employs a two-step quantification procedure to significantly increase dynamic range [44].
LC-MS Based Lipidomics: Separation Mechanisms and Advancements
LC-MS based lipidomics incorporates chromatographic separation prior to mass spectrometric analysis, primarily using two complementary separation mechanisms:
Reversed-Phase Liquid Chromatography (RPLC): This method separates lipid species based on their hydrophobic properties, including acyl chain length, and degree of unsaturation [47]. RPLC provides excellent separation within lipid classes and is particularly powerful for resolving non-polar lipids and distinguishing structural isomers that differ in acyl chain composition [48].
Hydrophilic Interaction Liquid Chromatography (HILIC): This technique separates lipids according to polarity in a class-specific fashion through interaction of the polar head groups with the stationary phase [47]. The retention mechanism of HILIC is advantageous for quantification due to co-elution of endogenous lipid species and internal standards belonging to the same lipid subclass, enabling appropriate correction for matrix effects [47].
Recent advancements in LC-MS lipidomics have incorporated additional separation dimensions and fragmentation techniques. Ion mobility spectrometry separates lipid ions based on their collision cross section (CCS), a physical property reflecting conformational shape, providing an extra dimension for separating isobaric and isomeric species [48]. Polarity switching during single runs allows acquisition of both positive and negative ion mode data from the same injection, expanding lipid coverage [46]. Additionally, electron-activated dissociation (EAD) has emerged as a powerful fragmentation technique that provides more detailed structural information for confident lipid identification [46].
Table 1: Comparison of Chromatographic Separation Methods in LC-MS Lipidomics
| Method | Separation Mechanism | Key Applications | Quantification Advantages |
|---|---|---|---|
| Reversed-Phase (RPLC) | Hydrophobicity (acyl chain length & unsaturation) | Separation within lipid classes; non-polar lipids; structural isomers | Wide lipid coverage; high peak capacity |
| Hydrophilic Interaction (HILIC) | Polar head group interaction with stationary phase | Class-specific separation; polar lipids | Co-elution of lipid class with internal standards; reduced matrix effects |
| Ion Mobility | Collision cross section (CCS) in gas phase | Separation of isobaric/isomeric species; complex samples | Additional identification parameter (CCS value) |
Comparative Analysis: Performance and Applications
Technical Comparison of Key Parameters
Understanding the technical capabilities of each approach is essential for selecting the appropriate methodology for specific research questions. The following table provides a direct comparison of key performance parameters between shotgun and LC-MS based lipidomics:
Table 2: Technical Comparison of Shotgun vs. LC-MS Based Lipidomics
| Parameter | Shotgun Lipidomics | LC-MS Based Lipidomics |
|---|---|---|
| Sample Throughput | High (no separation step) | Moderate to Low (chromatographic runtime required) |
| Ion Suppression | Higher potential in complex samples | Reduced through chromatographic separation |
| Dynamic Range | Can be extended via MDMS-SL [44] | Naturally wider for low-abundance species |
| Identification of Isobaric/Isomeric Species | Limited in classical approach; improved with MDMS-SL [44] [45] | Superior with RPLC and ion mobility [45] [48] |
| Quantification Accuracy | High with appropriate internal standards [44] | High with co-eluting internal standards in HILIC [47] |
| Lipidome Coverage | Broad for major classes; may miss low-abundance species | Comprehensive, including low-abundance lipids |
| Method Development Complexity | Moderate (optimization of infusion & MS parameters) | High (optimization of chromatography & MS methods) |
| Data Complexity | High (requires advanced bioinformatics) | Very High (additional chromatographic dimension) |
| Instrument Cost | Moderate to High | High to Very High |
| Analysis of Complex Matrices | May require pre-fractionation | Better suited without extensive sample preparation |
Application-Based Selection Guidance
The optimal choice between shotgun and LC-MS lipidomics depends heavily on the specific research objectives, sample types, and analytical requirements:
Clinical and Large-Scale Studies: For high-throughput analysis of large sample cohorts (e.g., population studies, clinical trials), shotgun lipidomics offers significant advantages due to its rapid analysis time and robustness [47]. Similarly, HILIC-based LC-MS approaches provide an excellent compromise for high-throughput quantification when comprehensive lipid class profiling is required [47]. A recent large-scale clinical application demonstrated the robust measurement of 782 circulatory lipid species across 1,086 plasma samples with median between-batch reproducibility of 8.5% using a HILIC-based approach [47].
Single-Cell and Limited Sample Applications: When sample material is extremely limited, as in single-cell lipidomics, LC-MS approaches are particularly advantageous. Recent advances have demonstrated successful lipid profiling from single cells using nanoflow LC-MS systems, with platforms incorporating polarity switching, ion mobility spectrometry, and electron-activated dissociation significantly enhancing both lipidome coverage and confidence in lipid identification [46]. The chromatographic separation in LC-MS reduces matrix effects, which is crucial when analyzing minute sample amounts [46].
Structural Characterization and Isomer Separation: For studies requiring detailed structural information, including identification of double bond positions, acyl chain attachment sites, or separation of isomeric species, RPLC-MS and ion mobility-MS approaches are superior [48]. The combination of chromatographic retention time, collision cross section values, and fragmentation patterns provides multiple dimensions for confident structural annotation.
High-Throughput Screening: In drug discovery applications where rapid screening of lipid changes in response to compound libraries is needed, shotgun lipidomics provides the necessary throughput without compromising data quality, especially when combined with automated sample preparation and data processing workflows [44].
Experimental Protocols
Shotgun Lipidomics Protocol for Clinical Samples
This protocol is adapted from established shotgun lipidomics workflows for clinical samples such as tissue, blood plasma, and peripheral blood mononuclear cells [49].
I. Sample Preparation
- Lipid Extraction: Use methyl tert-butyl ether (MTBE) protocol. Add 225 μL of methanol and 750 μL of MTBE to 50 μL of plasma sample.
- Internal Standard Addition: Add at least two molecular species of each lipid class of interest as internal standards during extraction. Select compounds that are absent or minimal in original extracts and faithfully represent physical properties of the examined lipid class [44].
- Vortex and Incubate: Vortex thoroughly for 1 hour at 4°C in a shaking incubator.
- Phase Separation: Add 188 μL of MS-grade water to induce phase separation. Centrifuge at 1,000 × g for 10 minutes.
- Collection: Collect the upper organic phase and evaporate under nitrogen stream.
- Reconstitution: Reconstitute dried lipids in 100 μL of chloroform:methanol (1:2, v/v) with 10 mM ammonium acetate for ESI-MS analysis.
II. Mass Spectrometric Analysis
- Direct Infusion: Use a syringe pump at flow rate of 5-10 μL/min.
- Instrument Setup: Utilize a high-resolution mass spectrometer (e.g., Q-TOF, Orbitrap, or FT-ICR) or triple quadrupole instrument.
- Acquisition Modes:
- Full Scan MS: Acquire in both positive and negative ion modes with mass resolution >100,000 for lipid profiling.
- Precursor Ion Scans: Perform class-specific scans (e.g., m/z 184.0733 for phosphocholine-containing lipids in positive mode).
- Neutral Loss Scans: Implement (e.g., neutral loss of 141.05 for phosphatidylethanolamines).
- Data-Dependent MS/MS: Acquire fragmentation spectra for structural elucidation.
- Quality Control: Analyze quality control samples (e.g., NIST SRM 1950 plasma) every 12 samples to monitor instrument performance [47].
III. Data Processing and Lipid Identification
- Peak Picking and Alignment: Use instrument software or open-source tools (e.g., MS-DIAL, LipidSearch).
- Lipid Identification: Identify based on accurate mass (mass error < 5 ppm), MS/MS spectra, and characteristic fragmentation patterns.
- Quantification: Calculate lipid concentrations as peak area ratio between analyte and structurally similar internal standard multiplied by its known spiked concentration [47].
- Isotopic Correction: Perform correction for isotopic overlap using tools like LICAR (Lipid Class-based Automatic Correction) [47].
LC-MS Based Lipidomics Protocol for Single Cells
This protocol demonstrates a nanoflow LC-MS method for single-cell lipidomics, as recently evaluated across multiple instrumental platforms [46].
I. Single Cell Isolation and Sample Preparation
- Cell Culture: Culture human pancreatic adenocarcinoma cells PANC-1 in appropriate medium. Wash twice with warm FBS-free culture medium before sampling.
- Capillary Sampling: Use Yokogawa SS2000 Single Cellome System with 10 μm capillaries. Apply pressures: pre-sampling 6 kPa, sampling 14 kPa, post-sampling 3 kPa. Hold cells for 200 ms.
- Cell Lysis: Immediately freeze capillary tips on dry ice after sampling. Transfer cells to LC-MS vials by backfilling capillaries with 5 μL lysis solvent (IPA/H₂O/ACN, 51:62:87 v/v/v) spiked with EquiSPLASH internal standard mixture (16 ng/mL).
- Sample Preparation: For nanoflow workflows, freeze-dry samples under low vacuum (0.5 mbar) and store under nitrogen at -80°C until analysis.
II. LC-MS Analysis
- Chromatographic Separation:
- Column: Use C18 reversed-phase column (e.g., 75 μm × 150 mm, 1.7 μm particles).
- Mobile Phase: A: acetonitrile:water (60:40) with 10 mM ammonium formate; B: isopropanol:acetonitrile (90:10) with 10 mM ammonium formate.
- Gradient: 0-2 min, 30% B; 2-20 min, 30-100% B; 20-25 min, 100% B; 25-25.1 min, 100-30% B; 25.1-35 min, 30% B.
- Flow Rate: 300 nL/min.
- Mass Spectrometric Detection:
- Instrument: Orbitrap Exploris 240 or similar high-sensitivity instrument.
- Ionization: Nano-electrospray ionization at 2.2 kV.
- Acquisition: Full scan MS at resolution 60,000 (m/z 250-1250) with data-dependent MS/MS at resolution 15,000.
- Fragmentation: Higher-energy collisional dissociation (HCD) at 35 V.
- Polarity Switching: Acquire both positive and negative modes in single run by switching every 10 scans [46].
III. Data Processing
- Feature Detection: Use software such as Compound Discoverer or XCMS for peak picking and alignment.
- Lipid Identification: Match accurate mass (mass error < 5 ppm), MS/MS spectra against databases (e.g., LipidBlast, HMDB), and retention time when available.
- Quality Assessment: Monitor internal standard intensities and retention time stability. Include blank injections to identify background signals.
Workflow Visualization
Lipidomics Workflow Selection
Research Reagent Solutions
Table 3: Essential Research Reagents for Lipidomics Workflows
| Reagent/Category | Function | Example Products/Compositions |
|---|---|---|
| Internal Standard Mixtures | Quantification accuracy & correction of experimental factors | EquiSPLASH (Avanti Polar Lipids), SPLASH LipidoMix (Avanti), stable isotope-labeled lipids |
| Lipid Extraction Solvents | Lipid isolation from biological matrices | Methyl tert-butyl ether (MTBE), chloroform:methanol mixtures, 2-propanol/IPA |
| Chromatography Columns | Lipid separation prior to MS analysis | Acquity Premier BEH Amide (for HILIC), C18 reversed-phase columns (for RPLC) |
| Mobile Phase Additives | Enhance ionization & chromatographic separation | Ammonium formate, ammonium acetate, formic acid |
| Quality Control Materials | Method validation & batch-to-batch normalization | NIST SRM 1950 plasma, pooled study samples, commercial quality control plasmas |
| Cell Lysis Reagents | Lipid extraction from single cells & cultured cells | Isopropanol/Hâ‚‚O/acetonitrile (51:62:87) mixtures with internal standards |
Shotgun and LC-MS based lipidomics represent complementary rather than competing approaches for comprehensive lipid analysis. Shotgun lipidomics excels in high-throughput applications where sample quantity is not limiting and rapid screening is prioritized. Its direct infusion approach allows for unlimited time to perform detailed tandem MS analyses, making it particularly valuable for clinical and large-scale studies [44] [47]. Conversely, LC-MS based lipidomics provides superior separation of complex lipid mixtures, reduced ion suppression, and enhanced identification of isobaric and isomeric species, making it indispensable for detailed structural characterization and analysis of limited samples, such as in single-cell applications [45] [46].
The choice between these methodologies should be guided by specific research objectives, sample availability, and required depth of lipid coverage. For many research programs, a hybrid approach that leverages the strengths of both platforms may be optimal—using shotgun lipidomics for initial high-throughput screening and LC-MS for detailed follow-up analysis of significant findings. As both technologies continue to evolve with improvements in instrument sensitivity, separation power, and data processing capabilities, their applications in drug development and clinical research will expand, providing unprecedented insights into lipid metabolism and its role in health and disease.
In mass-spectrometry-based lipidomics, chromatography serves as a critical front-end separation technique that significantly enhances the depth and reliability of lipid analysis. The extreme complexity of biological lipidomes, characterized by vast concentration dynamic ranges and numerous structural isomers, presents substantial analytical challenges [50] [51]. Effective chromatographic separation reduces ion suppression effects, minimizes matrix interferences, and provides an additional dimension of selectivity for confident lipid identification [52]. This application note details optimized chromatographic strategies for comprehensive lipidomic profiling, focusing on column technology selection and mobile phase optimization to achieve robust, reproducible separations of complex lipid mixtures across diverse biological matrices.
Column Selection for Lipidomic Separations
Reversed-Phase Liquid Chromatography (RPLC)
Reversed-phase liquid chromatography is the most widely employed chromatographic mode in lipidomics due to its exceptional capability to separate lipids based on their acyl chain length and degree of unsaturation [52]. The hydrophobic interactions between lipid molecules and the stationary phase provide excellent resolution for most lipid classes, including glycerophospholipids, glycerolipids, and sphingolipids.
A systematic evaluation of five different RPLC columns with varying stationary phase chemistries, particle sizes, and dimensions demonstrated significant differences in their ability to resolve complex lipid mixtures from human blood plasma [51]. The optimal 32-minute RPLC-MS/MS method developed in this study identified over 600 lipid species spanning 18 lipid classes, highlighting the critical importance of column selection for comprehensive lipidome coverage.
Table 1: Performance Comparison of Chromatographic Methods in Lipidomics
| Method | Separation Principle | Optimal Lipid Classes | Analysis Time | Key Advantages | Limitations |
|---|---|---|---|---|---|
| Reversed-Phase LC | Hydrophobicity (acyl chain length & unsaturation) | Glycerophospholipids, Sphingolipids, Glycerolipids | 15-60 min [53] | High resolution within lipid classes; compatible with ESI-MS; robust methods | Limited separation of very polar lipids; long equilibration times |
| HILIC | Polarity (headgroup chemistry) | Phospholipid classes, Sphingolipids | 15-50 min [53] | Effective class separation; direct injection of organic extracts possible | Potentially broader peaks for some lipid classes |
| SFC | Polarity & hydrophobicity | Multiple lipid classes with isomer separation | Not specified | Superior isomer separation; high resolution; fast analysis | Requires specialized equipment; less established methods |
| Shotgun (FI) | No chromatography | High-abundance lipids | Very fast | High throughput; minimal sample preparation | Ion suppression; limited isomer resolution; matrix effects |
For researchers pursuing high-throughput lipidomics, fast LC-MS methods with injection-to-injection times under 10 minutes have been demonstrated as feasible without compromising data quality when optimized columns and conditions are employed [53].
Hydrophilic Interaction Liquid Chromatography (HILIC)
HILIC separates lipids based on their polarity and headgroup chemistry, making it particularly valuable for separating different phospholipid classes (e.g., PC, PE, PS, PI) that co-elute in RPLC systems [53]. This technique utilizes a hydrophilic stationary phase with a reversed-phase type eluent containing high organic solvent content, which enhances electrospray ionization efficiency.
When employing HILIC for lipid class separation, mobile phase modifiers significantly impact chromatographic performance. For ESI-positive mode, 10 mM ammonium formate with 0.125% formic acid provided optimal separation of amino acids, biogenic amines, sugars, nucleotides, and acylcarnitines, while also enabling baseline separation of critical isomers such as leucine and isoleucine [53].
Emerging Chromatographic Techniques
Supercritical fluid chromatography has recently gained attention for its enhanced separation of hydrophobic and structural isomers, addressing a key limitation in conventional lipidomic approaches [54]. In a comparative study evaluating quantitative performance across four analytical methods, SFC-MS/MS outperformed HILIC-MS/MS in all measured chromatographic parameters, including height equivalent to a theoretical plate, resolution, peak height, and structural isomer separation performance [54].
The same study revealed that while FI, RPLC, HILIC, and SFC methods showed no significant quantification differences for six lipid classes, other classes exhibited notable method-specific variations, highlighting the importance of aligning separation techniques with specific analytical requirements [54].
Mobile Phase Optimization Strategies
Mobile Phase Modifiers for Comprehensive Lipidomics
Mobile phase additives play a critical role in modulating electrospray ionization efficiency, chromatographic peak shape, and retention time stability in lipidomic analyses. A systematic investigation of different mobile phase modifiers revealed that optimal compositions differ significantly between positive and negative ionization modes [53].
For ESI-positive mode in RPLC lipidomics, mobile phases containing 10 mM ammonium formate or 10 mM ammonium formate with 0.1% formic acid provided high signal intensity across various lipid classes while maintaining robust retention times [53]. These modifiers promote the formation of [M+H]+ and [M+NH4]+ adducts, which are essential for comprehensive lipid detection.
For ESI-negative mode, a mobile phase with 10 mM ammonium acetate with 0.1% acetic acid represented an optimal compromise between signal intensity of detected lipids and retention time stability compared to 10 mM ammonium acetate alone or 0.02% acetic acid [53]. This formulation enhances the formation of [M-H]- and [M+acetate]- adducts for anionic lipids.
Table 2: Optimized Mobile Phase Compositions for Lipidomics
| Chromatographic Mode | Ionization Mode | Recommended Mobile Phase Modifiers | Optimal Lipid Classes | Performance Characteristics |
|---|---|---|---|---|
| RPLC | ESI(+) | 10 mM ammonium formate OR 10 mM ammonium formate with 0.1% formic acid | Most lipid classes | High signal intensity; stable retention times [53] |
| RPLC | ESI(-) | 10 mM ammonium acetate with 0.1% acetic acid | Anionic lipids (PA, PS, PI, etc.) | Balanced intensity & stability [53] |
| HILIC | ESI(+) | 10 mM ammonium formate with 0.125% formic acid | Polar metabolites; lipid classes | Superior isomer separation; excellent for amino acids, sugars [53] |
| HILIC | ESI(-) | 10 mM ammonium formate with 0.125% formic acid | Organic acids; hexose phosphates | Effective class separation; stable for ~200 injections [53] |
Retention Time Stability and Method Robustness
Long-term retention time stability is a critical consideration for large-scale lipidomic studies involving hundreds or thousands of injections. Method robustness was rigorously evaluated through intra-batch repeatability testing, which demonstrated excellent retention time stability with a relative standard deviation (RSD) of <0.7% for 67 tested compounds (median RSD of 0.14%) across 200 injections of plasma extracts [53].
This level of reproducibility corresponds to a maximum retention time shift of less than 2 seconds, enabling confident lipid identification based on retention time alignment throughout extensive analytical sequences. Such performance is essential for maintaining data quality in large-scale clinical or epidemiological studies where instrument run times may extend over several days or weeks.
Experimental Protocols
Protocol 1: RPLC-MS/MS for Comprehensive Lipid Profiling
This protocol describes a robust RPLC-MS/MS method capable of resolving complex lipid mixtures, adapted from validated approaches [52] [51].
Materials:
- Column: reversed-phase C18 or C8 column (e.g., 2.1 × 150 mm, 1.8-2.1 μm particle size)
- Mobile Phase A: acetonitrile/water (60:40, v/v) with 10 mM ammonium formate
- Mobile Phase B: isopropanol/acetonitrile (90:10, v/v) with 10 mM ammonium formate
- MS System: High-resolution mass spectrometer (Q-Exactive HF Orbitrap or equivalent)
Procedure:
- Column equilibration: Stabilize column at 45°C with 30% B for 10 minutes
- Injection volume: 1-5 μL of lipid extract (equivalent to 1-10 μg total lipid)
- Gradient program:
- 0-2 min: 30% B
- 2-25 min: 30-100% B (linear gradient)
- 25-30 min: 100% B
- 30-32 min: 100-30% B
- 32-40 min: 30% B (re-equilibration)
- Flow rate: 0.2-0.3 mL/min
- MS detection: Full MS scan (m/z 200-2000) at resolution 70,000-140,000, followed by data-dependent MS/MS (resolution 17,500-35,000) of top 5-10 ions
Quality Control:
- Include quality control samples (pooled reference samples) every 10-15 injections
- Monitor retention time stability of internal standards (RSD < 2%)
- Evaluate peak shape and system sensitivity
Protocol 2: HILIC-MS for Lipid Class Separation
This protocol enables effective separation of lipid classes based on polar headgroups, complementing RPLC methods [53].
Materials:
- Column: UPLC BEH Amide (2.1 × 50 mm, 1.7 μm)
- Mobile Phase A: water with 10 mM ammonium formate + 0.125% formic acid
- Mobile Phase B: acetonitrile with 10 mM ammonium formate + 0.125% formic acid
Procedure:
- Column temperature: 40°C
- Injection volume: 2 μL
- Gradient program:
- 0-1 min: 95% B
- 1-8 min: 95-60% B
- 8-9 min: 60% B
- 9-9.5 min: 60-95% B
- 9.5-11 min: 95% B
- Flow rate: 0.4 mL/min
- MS detection: Full MS scan in both positive and negative mode with polarity switching
Lipidomics Workflow Integration
Diagram 1: Comprehensive lipidomics workflow integrating chromatographic separation with mass spectrometric detection. The workflow begins with proper sample collection and preparation, followed by strategic selection of chromatographic method based on analytical objectives, and culminates in data processing and biological interpretation. Abbreviations: LLE, liquid-liquid extraction; MTBE, methyl tert-butyl ether; RPLC, reversed-phase liquid chromatography; HILIC, hydrophilic interaction liquid chromatography; SFC, supercritical fluid chromatography; HRAM, high-resolution accurate mass; DDA, data-dependent acquisition; PCA, principal component analysis.
The Scientist's Toolkit: Essential Research Reagents and Materials
Table 3: Essential Research Reagents for Lipidomics Chromatography
| Item | Function/Purpose | Examples/Specifications |
|---|---|---|
| RPLC Columns | Separation by hydrophobicity | C18 or C8 (e.g., 2.1 × 150 mm, 1.8-2.1 μm) [51] |
| HILIC Columns | Separation by polarity/headgroup | UPLC BEH Amide (50-150 mm × 2.1 mm, 1.7 μm) [53] |
| Ammonium Formate | Mobile phase additive for ESI(+) | 10 mM concentration; enhances [M+NH4]+ formation [53] |
| Ammonium Acetate | Mobile phase additive for ESI(-) | 10 mM concentration; enhances [M+acetate]- formation [53] |
| Formic Acid | Mobile phase modifier (acidic) | 0.1-0.125%; improves protonation in ESI(+) [53] |
| Acetic Acid | Mobile phase modifier (mild acid) | 0.1%; suitable for anionic lipids in ESI(-) [53] |
| MTBE | Lipid extraction solvent | Less hazardous alternative to chloroform [50] |
| Deuterated Internal Standards | Quantitation reference | One per lipid class for relative quantitation [54] |
| Chloropretadalafil | Chloropretadalafil, CAS:171596-58-0, MF:C22H19ClN2O5, MW:426.8 g/mol | Chemical Reagent |
| Sorbic Acid | Sorbic Acid | Research-grade Sorbic Acid, a widely used antimicrobial agent. For Research Use Only (RUO). Not for diagnostic, therapeutic, or personal use. |
Optimal chromatographic separation is fundamental to successful lipidomic studies, directly impacting lipid coverage, quantification accuracy, and analytical reproducibility. The selection between RPLC, HILIC, and SFC should be guided by specific research objectives, with RPLC providing superior separation within lipid classes, HILIC excelling in class separation, and SFC offering enhanced isomer resolution. Careful optimization of mobile phase modifiers significantly enhances ionization efficiency and retention time stability, particularly critical for large-scale studies. When integrated within a comprehensive lipidomics workflow, these chromatographic strategies enable researchers to address complex biological questions with greater confidence and analytical precision.
Lipidomics, the large-scale study of cellular lipidomes, relies heavily on mass spectrometry (MS) to identify and quantify thousands of complex lipid species present in biological systems [55]. The structural diversity of lipids, arising from variations in aliphatic chain length, double bond placement, and polar head groups, presents significant analytical challenges that require sophisticated instrumentation and methodologies for confident molecular characterization [55]. Tandem mass spectrometry (MS/MS) has emerged as a powerful approach for deciphering this complexity through controlled fragmentation of lipid ions and detection of characteristic product ions.
Among the various MS/MS scanning techniques, three play particularly important roles in lipid identification and quantification: Precursor Ion Scanning (PIS), Neutral Loss Scanning (NLS), and Multiple Reaction Monitoring (MRM). These techniques provide complementary information about lipid structure by exploiting class-specific fragmentation patterns and selective transitions [55]. PIS identifies all precursor ions that fragment to produce a specified product ion, making it ideal for detecting lipid classes that share common head group fragments. NLS detects precursors that lose a common neutral fragment, useful for lipids that undergo class-specific neutral losses. MRM monitors specific precursor-to-product ion transitions, offering exceptional sensitivity and selectivity for targeted quantification of known lipid species [56] [57].
The integration of these techniques within comprehensive lipidomics workflows has dramatically advanced our understanding of lipid metabolism in health and disease. Applications range from discovering lipid biomarkers for pancreatic cancer [56] to understanding lipid dysregulation in neurological disorders [27] [15]. This protocol outlines the practical implementation of PIS, NLS, and MRM for confident lipid identification and quantification within the context of a complete lipidomic workflow.
Fundamentals of Lipid Fragmentation and Analysis
Principles of Lipid Fragmentation in Tandem MS
Lipid molecules fragment in predictable patterns during collision-induced dissociation (CID) based on their chemical structure. The fragmentation behavior provides crucial information about the lipid class, fatty acyl composition, and molecular structure. There are several common fragmentation pathways for lipids including: (1) neutral loss of the head group or modified head group; (2) formation of product ions representing the head group; and (3) formation of product ions representing the fatty acyl chains [55].
The specific fragmentation patterns are dictated by the lipid category. Glycerophospholipids typically fragment to produce characteristic positive or negative ions corresponding to their polar head group. For example, phosphatidylcholines and sphingomyelins produce a fragment at m/z 184 corresponding to the phosphocholine head group in positive ion mode [56] [55]. Phosphatidylethanolamines exhibit a neutral loss of 141 Da (loss of the phosphoethanolamine group) [56]. Sphingolipids fragment to produce ions characteristic of their sphingoid backbone, while glycerolipids often fragment to produce diacylglycerol-related ions. Understanding these class-specific fragmentation patterns is essential for selecting appropriate PIS, NLS, and MRM experiments.
Technique Selection Guide
Table 1: Comparison of Tandem MS Techniques for Lipid Analysis
| Technique | Principle | Primary Application | Advantages | Limitations |
|---|---|---|---|---|
| Precursor Ion Scanning (PIS) | Identifies all precursors that produce a specified product ion | Lipid class screening; Identification of lipids sharing common structural motifs | High specificity for lipid classes; Comprehensive profiling within classes | Limited to known fragment ions; May miss novel lipid classes |
| Neutral Loss Scanning (NLS) | Identifies precursors that lose a specific neutral fragment | Identification of lipid classes with characteristic neutral losses (e.g., phospholipids) | Excellent for selective detection of specific lipid categories | Requires characteristic neutral loss; Limited quantitative application |
| Multiple Reaction Monitoring (MRM) | Monitors specific precursor→product ion transitions | Targeted quantification of known lipid species; High-sensitivity detection | Superior sensitivity and selectivity; Excellent quantitative performance | Requires prior knowledge of lipid identities; Limited to predefined transitions |
Experimental Protocols
Sample Preparation for Lipidomic Analysis
Materials:
- Methanol, chloroform, water (HPLC/MS grade)
- Internal standard mixture (see Section 3.5)
- Benzoyl chloride (for derivatization of poorly ionizing lipids) [56]
- Pyridine (for derivatization)
- Ammonium formate or ammonium acetate (for mobile phase)
- Acetonitrile, isopropanol (HPLC/MS grade)
Protocol:
- Protein Precipitation: Add 250 μL of cold chloroform/methanol/water (30:60:8, v/v/v) to 10 μL of serum/plasma sample spiked with internal standards. Vortex thoroughly and place in an ultrasonic bath for 10 minutes at 30°C [56].
- Phase Separation: Add 500 μL of chloroform/methanol/water mixture to promote phase separation. Centrifuge at 3,462 × g for 5 minutes.
- Organic Phase Collection: Carefully collect the organic (lower) phase containing lipids into a clean glass vial.
- Solvent Evaporation: Evaporate the organic solvent under a gentle stream of nitrogen at 35°C.
- Chemical Derivatization (Optional): For enhanced sensitivity of poorly ionizing lipids (e.g., monoacylglycerols, diacylglycerols, sphingoid bases), reconstitute the dried lipid extract in 335 μL of pyridine in acetonitrile (1:9, v/v). Add 120 μL of benzoyl chloride in acetonitrile (1:9, v/v) and react for 60 minutes at ambient temperature with gentle stirring [56].
- Derivatization Quenching: Terminate the reaction using a modified Folch extraction: add 3 mL of chloroform/methanol (2:1, v/v) and 0.6 mL of 250 mM ammonium carbonate. Stir for 5 minutes, centrifuge, and collect the organic layer.
- Sample Reconstitution: Evaporate the organic solvent under nitrogen and reconstitute the lipid extract in 250 μL of chloroform/methanol (1:1, v/v) prior to LC-MS analysis.
Liquid Chromatography Conditions
Chromatography System: UHPLC system capable of binary gradient separation Column: Acquity UPLC BEH C18 column (150 mm × 2.1 mm, 1.7 μm) Column Temperature: 55°C Flow Rate: 0.35 mL/min Injection Volume: 2.5 μL Autosampler Temperature: 4°C Mobile Phase A: Acetonitrile/water (60:40, v/v) with 10 mM ammonium formate Mobile Phase B: Isopropanol/acetonitrile (90:10, v/v) with 10 mM ammonium formate Gradient Program:
- 0-2 min: 40% B
- 2-25 min: 40-100% B (linear gradient)
- 25-30 min: 100% B
- 30-31 min: 100-40% B
- 31-35 min: 40% B (re-equilibration)
Mass Spectrometry Parameters
Instrumentation: Triple quadrupole mass spectrometer Ionization Mode: Electrospray ionization (ESI), positive and negative ion modes Ion Source Parameters:
- Ion Spray Voltage: ±5500 V (positive/negative mode)
- Source Temperature: 500°C
- Curtain Gas: 30 psi
- Ion Source Gas 1: 50 psi
- Ion Source Gas 2: 60 psi
PIS, NLS, and MRM Method Development
Precursor Ion Scanning (PIS) Methods:
- For phosphatidylcholines (PC) and sphingomyelins (SM): PIS of m/z 184 in positive mode [56]
- For phosphatidylinositols (PI): PIS of m/z 241 in negative mode
- For sulfatides: PIS of m/z 97 in negative mode
- Collision Energy: Optimize between 35-50 eV
Neutral Loss Scanning (NLS) Methods:
- For phosphatidylethanolamines (PE): NLS of 141 Da in positive mode [56]
- For phosphatidic acids (PA): NLS of 115 Da in negative mode
- For monoacylglycerols (MG): NLS of water (18 Da) in positive mode [56]
- Collision Energy: Optimize between 20-35 eV
Multiple Reaction Monitoring (MRM) Methods:
- Develop MRM transitions for specific lipid species based on precursor m/z and characteristic product ions
- For quantitative analysis, optimize declustering potential and collision energy for each transition
- Include MRM transitions for internal standards (see Section 3.5)
- For benzoyl chloride-derivatized lipids: monitor transitions specific to the derivatized product [56]
Internal Standard Selection and Quantification
Table 2: Recommended Internal Standards for Lipid Quantification
| Lipid Class | Internal Standard Examples | Key Considerations |
|---|---|---|
| Phosphatidylcholines (PC) | PC(14:0/14:0), PC(15:0/15:0) | Stable isotope-labeled standards preferred |
| Sphingomyelins (SM) | SM(d18:1/12:0) | Use odd-chain or deuterated analogs |
| Phosphatidylethanolamines (PE) | PE(14:0/14:0), PE(15:0/15:0) | Not present in biological samples |
| Triacylglycerols (TG) | TG(15:0/15:0/15:0) | Response factors vary by chain length |
| Diacylglycerols (DG) | DG(15:0/15:0) | Derivatization may improve sensitivity |
| Monoacylglycerols (MG) | MG(15:0) | Low abundance requires sensitive detection |
| Sphingoid Bases | d17:1 Sphingosine | Chemical derivatization enhances detection |
| Free Fatty Acids | d31-Palmitic acid | Stable isotope-labeled recommended |
Quantification Protocol:
- Prepare internal standard mixture containing representative standards for each lipid class of interest.
- Spike internal standards into the sample at the earliest possible stage (pre-extraction).
- Ensure the added amount of each internal standard is within the linear range and approximates the expected concentration of endogenous lipids.
- For absolute quantification, establish calibration curves using authentic standards when available.
- Calculate lipid concentrations using the ratio of analyte peak area to internal standard peak area, applying response factors when necessary [57].
Workflow Integration and Data Analysis
Comprehensive Lipidomics Workflow
The following diagram illustrates how PIS, NLS, and MRM techniques integrate into a complete lipidomics workflow from sample preparation to data interpretation:
Technique Selection Logic
The decision process for selecting appropriate tandem MS techniques based on analytical goals is summarized below:
Data Processing and Quality Control
Lipid Identification:
- Process PIS and NLS data to identify lipid classes present in the sample.
- Use MRM data for targeted identification and quantification of specific lipid species.
- Apply retention time constraints for additional identification confidence.
- Utilize high-resolution mass spectrometry when isobaric interferences are suspected.
Quality Control Measures:
- Incorporate quality control (QC) samples from pooled reference material.
- Monitor retention time stability and peak shape throughout analyses.
- Track internal standard responses to identify instrumental drift.
- Apply batch correction algorithms when analyzing large sample sets [10].
Data Normalization and Statistical Analysis:
- Normalize data using internal standards and quality control-based methods.
- Apply multivariate statistical analysis (PCA, PLS-DA) to identify patterns.
- Implement appropriate missing value imputation strategies based on data structure.
- Use specialized lipidomics software (e.g., LipidQuant) for data processing and isotopic correction [58].
Research Reagent Solutions
Table 3: Essential Research Reagents for Lipidomics
| Reagent Category | Specific Examples | Function/Purpose |
|---|---|---|
| Internal Standards | Odd-chain lipids (PC(15:0/15:0)), Deuterated lipids (d31-palmitic acid) | Quantification normalization, Correction for extraction efficiency |
| Derivatization Reagents | Benzoyl chloride | Enhance sensitivity of poorly ionizing lipids (e.g., monoacylglycerols) |
| Extraction Solvents | Chloroform, Methanol, Methyl tert-butyl ether (MTBE) | Lipid extraction from biological matrices |
| LC Mobile Phase Additives | Ammonium formate, Ammonium acetate, Ammonium carbonate | Enhance ionization efficiency and chromatographic separation |
| Quality Control Materials | NIST SRM 1950 (human plasma), Pooled quality control samples | Method validation, Batch-to-batch normalization |
Applications in Disease Research
The application of PIS, NLS, and MRM techniques has revealed significant lipid alterations in various disease states. In pancreatic cancer research, benzoyl chloride derivatization coupled with MRM analysis identified upregulation of most monoacylglycerols and sphingosine, with pronounced downregulation of sphingolipids with very long saturated N-acyl chains in patient sera compared to healthy controls [56]. In neurological diseases, these techniques have uncovered disruptions in brain lipidomes associated with Alzheimer's and Parkinson's diseases, particularly in glial cells which show distinct lipid profiles including enrichment of cholesterol in astrocytes and oligodendrocytes and higher sphingolipid content in microglia [15].
The combination of these tandem MS approaches provides a powerful toolkit for comprehensive lipidome characterization, enabling both discovery-based lipid profiling and targeted quantification of specific lipid pathways implicated in disease mechanisms. Continued refinement of these methodologies promises to further advance our understanding of lipid biology in health and disease.
Mass spectrometry-based lipidomics has become a prevailing approach for comprehensively defining the lipidome and uncovering metabolic alterations linked to development, damage, and disease [27]. The journey from a raw mass spectrometry file to a biological interpretation is a complex computational process involving critical steps of peak detection, lipid identification, and database searching. This application note provides a detailed protocol for this data processing workflow, framed within the broader context of a lipidomics research pipeline that begins with sample collection and ends with data analysis. The guidance is tailored for researchers, scientists, and drug development professionals aiming to generate high-quality, reproducible lipidomics data.
Experimental Protocols
Protocol 1: Peak Picking and Initial Quantitation
The first computational step is processing the raw chromatographic and mass spectrometric data to detect lipid features and perform initial quantitation.
- Methodology: Automated peak finding and integration are typically performed by dedicated software. As one protocol outlines, the Lipid Mass Spectrum Analysis (LIMSA) v.1.0 software linear fit algorithm can be used for automated peak finding and correction of 13C isotope effects [59].
- Procedure:
- Data Input: Load raw data files (e.g., in mzXML, mzML format) from your mass spectrometer into the chosen processing software.
- Chromatogram Generation: The software reconstructs the total ion chromatogram and base peak chromatogram.
- Peak Picking: Apply algorithms to detect chromatographic peaks based on signal intensity, peak shape, and signal-to-noise ratio across the mass-to-charge (m/z) and retention time dimensions.
- Isotope Correction: Use software functions, like the linear fit algorithm in LIMSA, to correct for the natural abundance of 13C isotopes. This prevents a single lipid species from being misidentified as multiple species at different m/z values due to its isotopic pattern [59].
- Quantitation: For each found peak, the area under the curve is calculated. This area is then quantified by normalization against an internal standard of a similar lipid class added during sample preparation. The internal standard corrects for variations in sample preparation and instrument response [59].
Protocol 2: Lipid Identification via Tandem Mass Spectrometry
Peak finding yields a list of m/z and retention time pairs. Confident identification of the lipid species corresponding to these features requires tandem mass spectrometry (MS/MS).
- Methodology: Structural analysis is performed using data-dependent or data-independent acquisition modes on a pooled sample to fragment precursor ions and generate MS/MS spectra.
- Procedure:
- Inclusion List Creation: From the peak finding results, compile a list of the top several hundred most abundant precursor ions in both negative and positive ionization modes for MS/MS analysis [59].
- Data-Dependent Acquisition (DDA): Import the inclusion list into the instrument control software (e.g., Xcalibur). In a subsequent LC-MS run of a pooled quality control sample, the mass spectrometer will sequentially isolate and fragment each precursor ion on the list to generate MS/MS spectra [59].
- Spectral Interpretation: The generated MS/MS spectra are used for identification. This can be done by:
- Spectral Library Searching: Matching the experimental MS/MS spectrum against a reference spectral library (e.g., in platforms like GNPS) [60].
- Database-Dependent Identification: Querying a lipid database (e.g., LIPID MAPS, SwissLipids) with the observed precursor m/z and, if available, fragment ions.
- Database-Independent Identification: Using software like LipidXplorer, which employs a 'molecular fragmentation query language' (MFQL) to identify lipids based on defined fragmentation rules without relying on a reference spectral library [61].
Protocol 3: Data Pre-processing for Statistical Analysis
Before statistical analysis, the quantified lipid data must be cleaned and normalized to ensure the observed variation is biological, not technical.
- Methodology: This involves handling missing values, data normalization, and transformation using statistical programming languages like R or Python [18] [10].
- Procedure:
- Missing Value Imputation: Investigate the cause of missing values (e.g., below detection limit, random). Apply an appropriate imputation method. Common practices include:
- k-Nearest Neighbors (kNN): Effective for data Missing Completely at Random (MCAR) or at Random (MAR) [18].
- Constant Value Replacement: Replacing missing values with a percentage of the minimum concentration for that lipid is often optimal for data Missing Not at Random (MNAR), typically caused by abundances below the limit of detection [18].
- Data Normalization: Apply normalization to remove unwanted technical variation (e.g., batch effects). This can involve:
- Pre-acquisition normalization: Based on sample protein amount, cell count, or volume.
- Post-acquisition normalization: Using quality control (QC) samples and algorithms like LOESS or SERRF (Systematic Error Removal using Random Forest) to correct for signal drift [10].
- Data Transformation and Scaling: Log-transformation is often applied to correct for heteroscedasticity (non-constant variance) and to make the data more symmetric. Scaling (e.g., unit variance, Pareto) is used to adjust for large concentration differences between lipids so that abundant species do not dominate the statistical model [18].
- Missing Value Imputation: Investigate the cause of missing values (e.g., below detection limit, random). Apply an appropriate imputation method. Common practices include:
Data Presentation
Software Solutions for Lipidomics Data Processing
Table 1: Key Software Tools for Lipidomics Data Analysis
| Tool Name | Type/Platform | Primary Function | Key Feature |
|---|---|---|---|
| LIMSA [59] | Standalone Software | Peak finding, isotope correction, and quantitation | Linear fit algorithm for 13C isotope effect correction |
| LipidXplorer [61] | Standalone Software | Lipid identification from MS/MS data | Uses MFQL for identification without a reference spectral library |
| LipidCreator [61] | Standalone/Web Platform | Targeted MS assay design | Supports spectral library generation and collision energy optimization |
| Genedata Expressionist [62] | Enterprise Platform | End-to-end MS data analysis & workflow automation | High-throughput processing for biopharma, GxP compliance |
| MetaboScape [63] | Commercial Software | Untargeted metabolomics & lipidomics | T-ReX algorithm for peak alignment and CCS-aware identification |
| GNPS [60] | Web Platform | Tandem MS data analysis & networking | Community-wide spectral library for identification and molecular networking |
| LipidSpace [61] | Standalone Tool | Lipidome comparison & analysis | Graph-based comparison of lipid structural similarities |
| Goslin [61] | Web App/Program | Lipid name normalization | Converts different lipid nomenclatures to a standardized shorthand |
Key Lipid Databases for Identification
Table 2: Essential Databases for Lipid Identification and Annotation
| Database Name | Scope | Utility in Identification |
|---|---|---|
| LIPID MAPS [61] [64] | Comprehensive lipid database | Provides classification system, structures, and reference data for lipid identification. |
| SwissLipids [61] | Expert-curated knowledgebase | Offers lipid structures, taxonomy, and cross-references for annotating lipid species. |
| GNPS Spectral Libraries [60] | Crowdsourced MS/MS spectra | Allows for spectral matching of experimental MS/MS data for confident identification. |
The Scientist's Toolkit
Table 3: Research Reagent Solutions for Lipidomics Data Analysis
| Item | Function |
|---|---|
| Internal Standards (IS) | A set of stable isotope-labeled or non-natural lipid analogs spiked into samples before extraction. They enable correction for recovery and ion suppression, allowing for accurate quantification [59]. |
| Quality Control (QC) Sample | A pooled sample created by combining small aliquots of all biological samples. It is analyzed intermittently throughout the batch to monitor instrument stability, track technical variation, and correct for batch effects during data pre-processing [18] [10]. |
| Standard Reference Material (SRM) | Commercially available reference material (e.g., NIST SRM 1950 for plasma). Used as a long-term reference QC to evaluate method performance and enable cross-laboratory comparisons [18]. |
| Bioinformatic Scripts (R/Python) | Custom or published code for advanced data pre-processing, statistical analysis, and visualization. Provides flexibility and transparency, promoting reproducible research [18] [10]. |
| DL-Homocysteine | DL-Homocysteine, CAS:454-28-4, MF:C4H9NO2S, MW:135.19 g/mol |
| DL-Panthenol | DL-Panthenol Powder|Provitamin B5 for Research |
Mandatory Visualization
Lipid Identification Data Flow
From Identified Data to Biological Insight
Integrating Lipidomics with Machine Learning for Biomarker Discovery and Disease Classification
Lipidomics, the large-scale study of lipid pathways and networks in biological systems, has emerged as a powerful tool for understanding health and disease [65]. When integrated with machine learning (ML), lipidomics transforms into a revolutionary approach for biomarker discovery and disease classification, bridging fundamental research with clinical applications [65] [66]. This integration addresses critical challenges in precision medicine by enabling early detection, risk assessment, and personalized treatment strategies for various human diseases including cancer, cardiovascular disorders, neurodegenerative diseases, and metabolic conditions [65] [3]. The combination of high-throughput lipidomic profiling using advanced mass spectrometry with ML algorithms for pattern recognition creates a synergistic workflow capable of identifying subtle lipid signatures that often precede clinical symptoms by several years [5]. This document provides detailed application notes and experimental protocols for implementing this integrated approach within a comprehensive lipidomic workflow spanning from sample collection to data analysis.
Lipidomics Fundamentals and Methodological Strategies
Lipid Classification and Biological Significance
Lipids represent a diverse class of biomolecules with crucial structural, energetic, and signaling functions. The LIPID MAPS consortium classification system organizes lipids into eight main categories [66] [3]:
- Fatty Acyls (FA): Including signaling molecules like eicosanoids
- Glycerolipids (GL): Primarily triacylglycerols (TGs) for energy storage
- Glycerophospholipids (GP): Key membrane components (PC, PE, PI, PS)
- Sphingolipids (SP): Structural and signaling molecules (ceramides, sphingomyelins)
- Sterol Lipids (ST): Including cholesterol and derivatives
- Prenol Lipids (PR): Including fat-soluble vitamins
- Saccharolipids (SL)
- Polyketides (PK)
Table 1: Key Lipid Classes and Their Biological Functions in Disease Contexts
| Lipid Category | Representative Lipids | Primary Functions | Disease Associations |
|---|---|---|---|
| Glycerophospholipids | Phosphatidylcholine (PC), Phosphatidylethanolamine (PE) | Membrane structure, cell signaling | Cancer, neurodegenerative diseases [66] [67] |
| Sphingolipids | Ceramides (Cer), Sphingomyelin (SM) | Apoptosis, inflammation, membrane domains | Cardiovascular risk, insulin resistance [65] [5] |
| Glycerolipids | Triacylglycerols (TAG) | Energy storage, fatty acid transport | Metabolic disorders, cancer [67] |
| Fatty Acyls | Arachidonic acid, 12-HETE | Inflammation signaling | Inflammatory disorders [66] |
Selection of Lipidomics Analytical Strategies
Three primary analytical strategies are employed in lipidomics research, each with distinct applications in biomarker discovery [3]:
Untargeted Lipidomics: Global profiling of all detectable lipids in a sample using high-resolution mass spectrometry (HRMS). This approach is ideal for hypothesis generation and novel biomarker discovery.
Targeted Lipidomics: Precise identification and quantification of predefined lipid panels using multiple reaction monitoring (MRM). This method offers higher accuracy and sensitivity for validating candidate biomarkers.
Pseudo-targeted Lipidomics: Combines the comprehensive coverage of untargeted approaches with the quantitative precision of targeted methods, particularly useful for complex disease characterization.
Table 2: Comparative Analysis of Lipidomics Methodological Approaches
| Parameter | Untargeted Lipidomics | Targeted Lipidomics | Pseudo-targeted Lipidomics |
|---|---|---|---|
| Primary Objective | Discovery of novel biomarkers | Validation of specific lipids | Comprehensive profiling with quantification |
| Coverage | Broad (1000+ lipids) | Narrow (10-100 lipids) | Moderate to broad |
| Quantitation | Semi-quantitative | Absolute | Relative to reference standards |
| Throughput | Moderate | High | Moderate |
| Key Instrumentation | Q-TOF, Orbitrap MS | UPLC-QQQ MS | LC-QTOF with SWATH/DIA |
| Best Applications | Biomarker discovery, pathway analysis | Clinical validation, translational studies | Complex disease subtyping |
Integrated Lipidomics-ML Workflow: From Sample to Insight
Comprehensive Experimental Workflow
The following diagram illustrates the integrated lipidomics and machine learning workflow for biomarker discovery and disease classification:
Sample Collection and Preparation Protocol
Protocol 3.2.1: Standardized Serum/Plasma Collection for Lipidomic Studies
Materials Required:
- EDTA or heparin blood collection tubes
- Pre-chilled centrifuge (4°C)
- Cryogenic vials for storage
- Liquid nitrogen or -80°C freezer
- Methanol, methyl-tert-butyl ether (MTBE), and chloroform for lipid extraction
Procedure:
- Collect blood samples after overnight fasting (12-14 hours) to minimize dietary effects
- Process samples within 30-60 minutes of collection to prevent lipid degradation
- Centrifuge at 2,000-3,000 × g for 15 minutes at 4°C to separate plasma/serum
- Aliquot supernatant into cryovials (recommended: 50-100 μL aliquots)
- Flash-freeze in liquid nitrogen and store at -80°C until analysis
- Include quality control (QC) samples: pool equal volumes from all samples for process monitoring
- Perform lipid extraction using modified Folch or MTBE method [10]:
- Add 300 μL sample to 1 mL methanol, vortex 10 seconds
- Add 2 mL MTBE, vortex 30 seconds, incubate 10 minutes at room temperature
- Add 0.5 mL water, vortex 30 seconds, centrifuge 10 minutes at 2,000 × g
- Collect upper organic phase, evaporate under nitrogen stream
- Reconstitute in appropriate LC-MS solvent
Critical Considerations:
- Maintain consistent processing time across all samples
- Avoid multiple freeze-thaw cycles (maximum 2 cycles recommended)
- Include blank samples (extraction solvent only) to monitor contamination
- Use internal standards (SPLASH LipidoMix or equivalent) added prior to extraction
Lipidomic Analysis Methods
Protocol 3.3.1: Untargeted Lipidomics Using LC-HRMS
Instrumentation:
- Liquid Chromatography: UHPLC system with C8 or C18 reverse-phase column (e.g., Acquity UPLC BEH C8, 1.7 μm, 2.1 × 100 mm)
- Mass Spectrometry: High-resolution instrument (Q-TOF, Orbitrap) capable of MS/MS fragmentation
- Mobile Phase: A) Water:acetonitrile (60:40) with 10 mM ammonium formate; B) Isopropanol:acetonitrile (90:10) with 10 mM ammonium formate
Chromatographic Conditions:
- Gradient: 0-2 min 15% B, 2-25 min 15-99% B, 25-30 min 99% B, 30-30.1 min 99-15% B, 30.1-35 min 15% B
- Flow Rate: 0.4 mL/min
- Column Temperature: 55°C
- Injection Volume: 2-5 μL
MS Acquisition Parameters:
- Polarity: Positive and negative ion modes (separate runs)
- Mass Range: m/z 150-2,000
- Source Temperature: 300°C
- Collision Energies: 20-40 eV for MS/MS
- Data Acquisition: Data-dependent acquisition (DDA) or data-independent acquisition (DIA)
Protocol 3.3.2: Targeted Lipidomics Validation Using LC-MRM/MS
Instrumentation:
- Liquid Chromatography: UHPLC system with C8 or C18 column
- Mass Spectrometry: Triple quadrupole (QQQ) instrument
- Mobile Phase: Similar to untargeted method with alternative modifiers (e.g., ammonium acetate)
MRM Method Development:
- Identify precursor and product ions for each target lipid
- Optimize collision energies for each transition
- Establish retention time windows for scheduled MRM
- Use stable isotope-labeled internal standards for quantification
Quality Assurance:
- Analyze QC samples every 6-10 injections to monitor system stability
- Ensure relative standard deviation (RSD) < 30% for quantified lipids in QC samples [68]
- Include standard reference materials (NIST SRM 1950 or equivalent) for inter-laboratory comparison
Machine Learning Integration for Biomarker Discovery
Data Preprocessing and Feature Selection
Protocol 4.1.1: Lipidomic Data Preprocessing Pipeline
The preprocessing workflow ensures data quality and prepares lipidomic datasets for machine learning analysis [10]:
Peak Alignment and Annotation:
- Use software tools (MS-DIAL, Lipostar, XCMS) for peak picking and alignment
- Annotate lipids using LIPID MAPS database with MS/MS spectral matching
Quality Control Filtering:
- Remove features with RSD > 30% in QC samples
- Eliminate lipids detected in <80% of samples in at least one study group
Missing Value Imputation:
- Investigate missingness mechanism (MCAR, MAR, MNAR)
- Apply appropriate imputation: k-nearest neighbors for MCAR/MAR, minimum value for MNAR
Normalization and Scaling:
- Apply internal standard-based normalization
- Implement data transformation (log2, Pareto scaling) based on data distribution
- Use batch correction algorithms (SERRF, ComBat) for multi-batch studies
Protocol 4.1.2: Ensemble Feature Selection Strategy
The feature selection process identifies the most discriminative lipid biomarkers [69] [68] [67]:
Apply Multiple Feature Selection Methods:
- Filter methods: ANOVA, Kruskal-Wallis test
- Wrapper methods: Recursive feature elimination
- Embedded methods: Random Forest variable importance, LASSO
- Entropy-based methods for non-linear relationships
Robust Rank Aggregation (RRA):
- Combine results from multiple feature selection methods
- Calculate aggregated ranks for each lipid feature
- Select top-ranked features for model building
Biological Relevance Integration:
- Incorporate fold-change thresholds (typically ≥1.2 or ≤0.83)
- Apply false discovery rate (FDR) correction (e.g., Benjamini-Hochberg)
- Consider pathway enrichment in selection criteria
Machine Learning Model Development and Validation
Protocol 4.2.1: Classification Model Development
Data Preparation:
- Split data into training (70-80%) and testing (20-30%) sets
- Address class imbalance using oversampling techniques (SMOTE) if needed
- Perform k-fold cross-validation (typically 5-10 folds) on training set
Model Selection and Training:
- Implement Multiple Classifiers:
- Support Vector Machine (SVM) with linear, radial, and polynomial kernels
- Random Forest (RF) with optimized tree parameters
- Naive Bayes (NB) for probabilistic classification
- Logistic Regression (LR) with regularization
- XGBoost for enhanced gradient boosting
Hyperparameter Optimization:
- Use grid search or Bayesian optimization for parameter tuning
- Optimize for balanced accuracy, especially with imbalanced datasets
Model Evaluation Metrics:
- Area Under ROC Curve (AUC)
- Accuracy, Sensitivity, Specificity
- F1-score, Matthews Correlation Coefficient (MCC)
Table 3: Performance Comparison of ML Classifiers in Lipidomic Studies
| Classifier | Average AUC Range | Optimal Use Cases | Advantages | Limitations |
|---|---|---|---|---|
| Random Forest | 0.85-0.97 [67] | High-dimensional data, non-linear relationships | Handles missing data, feature importance | Prone to overfitting without tuning |
| SVM | 0.82-0.95 [67] | Small sample sizes, clear margin separation | Effective in high dimensions, versatile kernels | Sensitive to parameter tuning |
| Naive Bayes | 0.89-0.95 [69] | Probabilistic interpretation, quick training | Fast training, works well with small data | Assumes feature independence |
| Logistic Regression | 0.80-0.92 | Linear relationships, interpretability | Model interpretability, probability outputs | Limited to linear decision boundaries |
| XGBoost | 0.88-0.98 | Complex non-linear patterns | High performance, handles missing data | Computational intensity, overfitting risk |
The following diagram illustrates the machine learning workflow for lipid biomarker discovery:
Protocol 4.2.2: Model Validation and Biomarker Interpretation
Validation Framework:
- Internal Validation:
- Perform k-fold cross-validation (5-10 folds) on training set
- Calculate confidence intervals for performance metrics using bootstrapping
External Validation:
- Validate selected model on independent cohort
- Assess generalizability across different populations
Clinical Relevance Assessment:
- Evaluate biomarker panel using ROC analysis
- Calculate clinical utility measures (NNT, decision curve analysis)
Biological Interpretation:
- Pathway Analysis:
- Map significant lipids to metabolic pathways (KEGG, Lipid Maps)
- Identify enriched pathways using overrepresentation analysis
- Network Integration:
- Construct lipid-lipid interaction networks
- Integrate with other omics data (genomics, proteomics) for systems biology insights
Application Notes: Case Studies in Disease Classification
Case Study 1: Nonsyndromic Cleft Lip with Palate (nsCLP) Diagnosis
Experimental Design [69] [68]:
- Objective: Identify maternal serum lipid biomarkers for prenatal diagnosis of nsCLP
- Cohorts: Discovery cohort (n=60), validation cohort (independent samples)
- Sample Type: Maternal serum collected at 22-26 weeks gestation
- Analytical Platform: Untargeted lipidomics (discovery) and targeted validation (LC-MRM)
Key Findings:
- Machine learning analysis identified a panel of 3 lipid biomarkers with high diagnostic performance
- Specific lipids FA (20:4) and LPC (18:0) were significantly downregulated in nsCLP group
- Naive Bayes classifier achieved AUC of 0.95 using top 35 lipid features
- Ensemble feature selection with RRA outperformed individual selection methods
Protocol Implementation:
- Lipid Extraction: Methyl-tert-butyl ether (MTBE) method
- LC-MS Analysis: UHPLC-QTOF in positive and negative modes
- Feature Selection: 8 different methods combined with RRA algorithm
- Model Training: 7 classification models evaluated with cross-validation
- Validation: Targeted MRM analysis of candidate biomarkers in independent cohort
Case Study 2: Breast Cancer Subtype Classification
Experimental Design [67]:
- Objective: Identify lipid signatures distinguishing breast cancer subtypes
- Sample Type: Breast cancer tissue vs. normal adjacent tissue
- Analytical Platform: LC-MS in positive and negative ionization modes
- Lipid Classes: PC, LPC, PE, PS, PI, Cer, SM, TAG (8 families)
Key Findings:
- Elevated saturated and monounsaturated phospholipids in cancer tissues
- Lower triacylglycerol levels in cancerous vs. normal tissues
- Phospholipid PC 30:0 showed distinct patterns across molecular subtypes
- Entropy-based feature selection outperformed other methods for HER2 status classification
Protocol Implementation:
- Tissue Processing: Cryopreservation, cryosectioning, lipid extraction
- Data Preprocessing: Log2 transformation, median-centering, scaling
- Feature Selection: Boruta, MLP, Entropy-based, and VIP scores compared
- Subtype Classification: ER, PR, HER2 status prediction using lipid profiles
- Biological Validation: Association with SCD1 enzyme activity in lipid desaturation
Table 4: Lipid Biomarker Panels for Disease Classification from Case Studies
| Disease Application | Key Lipid Biomarkers | Direction of Change | ML Model Performance | Biological Interpretation |
|---|---|---|---|---|
| nsCLP Diagnosis [69] | FA (20:4), LPC (18:0), Panel of 3 lipids | Downregulated | AUC 0.95 (Naive Bayes) | Altered lipid signaling in embryonic development |
| Breast Cancer Detection [67] | Saturated PCs, Monounsaturated PCs | Upregulated | Accuracy 0.984 (SVM-Polynomial) | Membrane rigidity, ferroptosis resistance |
| Breast Cancer Subtyping [67] | PC 30:0 | Variable by subtype | Accuracy 0.9387 (MLP for ER status) | SCD1 activity in HER2+ tumors |
| Cardiovascular Risk [65] | Specific ceramides, Phosphatidylcholines | Upregulated | Not specified | Cellular apoptosis, inflammation signaling |
The Scientist's Toolkit: Essential Research Reagents and Materials
Table 5: Essential Research Reagent Solutions for Lipidomics-ML Workflow
| Category | Product/Kit | Manufacturer/Provider | Application Notes |
|---|---|---|---|
| Lipid Extraction | SPLASH LipidoMix | Avanti Polar Lipids | Internal standard mixture for quantification |
| MTBE, Chloroform, Methanol | Sigma-Aldrich | HPLC-grade solvents for lipid extraction | |
| LC-MS Columns | Acquity UPLC BEH C8/C18 | Waters Corporation | 1.7 μm particle size, 2.1 × 100 mm |
| Kinetex C8 Core-Shell | Phenomenex | Alternative for complex separations | |
| Mass Spectrometry | Mass Spectrometer Q-TOF | Agilent/Sciex/Waters | High-resolution accurate mass |
| Triple Quadrupole MS | Agilent/Sciex/Thermo | Targeted MRM quantification | |
| Data Processing | MS-DIAL | RIKEN Center | Untargeted lipidomics data processing |
| Lipostar | Molecular Discovery | Lipid identification and quantification | |
| Statistical Analysis | R Studio with tidyverse | R Foundation | Data wrangling and visualization |
| Python SciKit-Learn | Python Software Foundation | Machine learning implementation | |
| Quality Control | NIST SRM 1950 | NIST | Inter-laboratory standardization |
| Human Plasma Pool | In-house preparation | Process quality control | |
| TRIA-662 (Standard) | TRIA-662 (Standard), CAS:1063-92-9, MF:C7H9ClN2O, MW:172.61 g/mol | Chemical Reagent | Bench Chemicals |
Troubleshooting and Technical Notes
Common Challenges and Solutions
Analytical Challenges:
- Problem: Low lipid identification agreement between software platforms (14-36% with default settings) [66]
- Solution: Implement consensus identification across multiple platforms and manual verification
- Problem: Batch effects in large-scale studies
- Solution: Incorporate randomization, use batch correction algorithms (SERRF, ComBat), include QC samples
Machine Learning Challenges:
- Problem: Overfitting with high-dimensional lipidomic data
- Solution: Apply regularization, feature selection, cross-validation, and independent validation
- Problem: Biological interpretation of complex lipid signatures
- Solution: Integrate pathway analysis, lipid metabolic networks, and multi-omics data
Standardization and Reproducibility
Quality Assurance Measures:
- Follow Lipidomics Standards Initiative (LSI) guidelines for reporting [10]
- Implement standard operating procedures for sample processing
- Use reference materials for inter-laboratory comparison
- Document all preprocessing and analysis parameters for reproducibility
Data Sharing and FAIR Principles:
- Make data Findable, Accessible, Interoperable, and Reusable [10]
- Use standardized data formats (mzML, mzTab)
- Share code through repositories (GitHub) with detailed documentation
The integration of lipidomics with machine learning represents a transformative approach for biomarker discovery and disease classification. This comprehensive protocol provides researchers with detailed methodologies for implementing this integrated workflow, from sample collection through computational analysis. As the field advances, standardization of analytical protocols, implementation of robust machine learning frameworks, and validation in diverse clinical cohorts will be essential for translating lipidomic biomarkers into clinical practice. The continuous development of AI-driven annotation tools and miniaturized separation platforms promises to further enhance the efficiency and accessibility of this powerful integrated approach.
Ensuring Data Quality: Troubleshooting and Workflow Optimization
Lipidomics, the large-scale study of lipid metabolites, is rapidly gaining prominence in basic and translational research, opening new avenues for disease prediction, prevention, and treatment [70]. However, the reliability of lipidomic data is highly dependent on sample quality, with pre-analytical inconsistencies being responsible for up to 80% of laboratory testing errors in clinical routine diagnostics [71]. The stability of lipids in biological samples ranges from very stable to extremely unstable within minutes after sample collection, making the pre-analytical phase—from patient preparation to sample processing—of utmost importance for obtaining valid profiling data [71].
This application note addresses three critical pre-analytical challenges in lipidomics workflows: general lipid degradation, specific oxidation of vulnerable lipid species, and isobaric interference that complicates accurate annotation. We provide evidence-based protocols and solutions to mitigate these issues, ensuring higher quality data for researchers, scientists, and drug development professionals working within the comprehensive context of lipidomic workflows from sample collection to data analysis.
Understanding and Mitigating Major Pre-Analytical Pitfalls
Comprehensive Pitfall Analysis and Solutions
Table 1: Major Pre-Analytical Pitfalls in Lipidomics: Causes, Impacts, and Mitigation Strategies
| Pitfall Category | Primary Causes | Affected Lipid Classes | Preventive Measures |
|---|---|---|---|
| General Lipid Degradation | Extended processing delays; inappropriate temperature; cellular metabolism in unprocessed samples; improper freeze-thaw cycles [71] | Phospholipids, sphingolipids, glycerolipids | Process samples within 30 minutes; maintain continuous cooling at 4°C; use standardized centrifugation; limit freeze-thaw cycles [71] |
| Oxidation | Exposure to oxygen; elevated temperature; light exposure; pro-oxidative contaminants [72] | Polyunsaturated fatty acids (PUFAs); oxylipins; plasmalogens | Add antioxidants (e.g., BHT); work under inert atmosphere; reduce processing time; protect from light [72] |
| Isobaric Interference | Co-eluting isomers; identical mass-to-charge ratios; limited chromatographic resolution; inadequate MS/MS fragmentation [70] [73] | All lipid classes, particularly phospholipids and glycerolipids | Advanced chromatographic separation; MS/MS with high resolution; computational approaches (LC=CL); ion mobility spectrometry [70] [73] |
| Collection Tube Effects | Leaching of plasticizers; polymer-based gel separators; interfering additives [71] | All lipid classes | Pre-test tubes for suitability; avoid gel separators; use consistent tube brands across studies [71] |
| Enzymatic Degradation | Endogenous lipases; phospholipases; delayed inhibition of enzymatic activity [71] | Glycerophospholipids, triacylglycerols | Rapid processing; immediate cooling; addition of enzyme inhibitors where appropriate [71] |
Experimental Protocols for Pitfall Mitigation
Protocol 1: Standardized Blood Collection and Processing for Plasma/Serum Lipidomics
Materials: Tourniquet, K3EDTA or citrate tubes (pre-tested), cryovials (pre-validated), cooled centrifuge, ice-water bath, permanent labels suitable for ultra-low temperatures [71].
Patient Preparation: Implement a ≥12-hour fasting period with a standardized resting period (no strenuous activity 48 hours before collection). Collect samples between 7 and 10 am to minimize diurnal variation [71] [74].
Blood Collection: Perform venipuncture with minimal tourniquet time. Draw blood into pre-tested collection tubes containing appropriate anticoagulants (for plasma) or clotting promoters (for serum). Avoid using the first tube for lipidomics analysis [71].
Immediate Processing: Place tubes immediately in an ice-water bath and process within 30 minutes of collection. Centrifuge at 2000 × g for 15 minutes at 4°C [71].
Aliquot Preparation: Carefully transfer the supernatant (plasma or serum) to pre-validated cryovials without disturbing the buffy coat. Create multiple aliquots to avoid repeated freeze-thaw cycles.
Storage: Flash-freeze aliquots in liquid nitrogen and transfer to −80°C freezers for long-term storage. Use permanent labels that withstand ultra-low temperatures [71].
Protocol 2: Minimizing Oxidation During Lipid Extraction
Materials: Nitrogen gas supply, glassware, antioxidant butylated hydroxytoluene (BHT), methyl-tert-butyl ether (MTBE), methanol, amber vials [72] [75].
Environment Setup: Perform extractions in a glove box under nitrogen atmosphere or ensure continuous nitrogen blanket over samples during processing.
Antioxidant Addition: Add BHT (0.01-0.02% w/v) to all extraction solvents immediately before use [72].
Reduced Light Exposure: Use amber glassware or work under dimmed light conditions to prevent photo-oxidation.
Cold Chain Maintenance: Maintain samples at 4°C throughout the extraction process using pre-cooled equipment and solvents.
Solvent Selection: Utilize MTBE-based extraction methods which provide superior recovery of diverse lipid classes with reduced oxidation risk compared to chloroform-based methods [75].
Protocol 3: Addressing Isobaric Interference Through Advanced Chromatography and Computational Approaches
Materials: UHPLC system, high-resolution mass spectrometer, stable isotope-labeled internal standards, computational tools (LC=CL, Lipid Annotator, MS-Dial) [70] [73] [72].
Chromatographic Optimization: Employ reversed-phase UHPLC with sub-2μm particles for superior separation of isobaric and isomeric lipids. Use optimized gradient programs specifically developed for lipid separations [72].
MS/MS Acquisition: Implement data-dependent acquisition (DDA) with iterative MS/MS at multiple collision energies (e.g., 20 and 40 eV). Use narrow isolation windows (1.3 m/z) for improved precursor selection [72].
Computational Annotation: Utilize the LC=CL computational solution which leverages retention time databases and machine learning to automatically identify carbon-carbon double bond positions in complex lipids [70].
Multi-Tool Verification: Combine multiple bioinformatic tools (Lipid Annotator, MS-Dial, LipidHunter, LipidMS) with manual inspection of MS/MS spectra to verify annotations and eliminate false positives [72].
Visualizing Lipidomics Workflows and Relationships
Integrated Lipidomics Quality Assurance Workflow
Lipidomics Quality Assurance Workflow - This diagram illustrates the integrated approach to addressing pre-analytical pitfalls throughout the lipidomics workflow, highlighting critical control points and mitigation strategies for lipid degradation, oxidation, and isobaric interference.
Lipid Identification Confidence Scoring System
Lipid Identification Confidence Scoring - This visualization depicts the layered approach to lipid identification confidence based on the lipidomics scoring system, showing how analytical techniques build confidence levels and address specific pitfalls.
The Scientist's Toolkit: Essential Research Reagents and Materials
Table 2: Research Reagent Solutions for Lipidomics Workflows
| Reagent/Material | Function/Purpose | Application Notes | References |
|---|---|---|---|
| K3EDTA Tubes | Anticoagulant for plasma collection; preferred over heparin for lipidomics | Pre-test tubes for plasticizers and interfering compounds; avoid gel separators | [71] |
| BHT (Butylated Hydroxytoluene) | Antioxidant to prevent lipid oxidation during processing | Use at 0.01-0.02% (w/v) in extraction solvents; particularly important for PUFA-rich samples | [72] |
| MTBE (Methyl Tert-Butyl Ether) | Extraction solvent for lipidomics | Less toxic than chloroform; superior recovery of diverse lipid classes; compatible with oxidation-sensitive lipids | [75] |
| SIL (Stable Isotope-Labeled) Lipids | Internal standards for quantification and quality control | Use deuterium or 13C-labeled analogs; essential for correcting extraction efficiency and matrix effects | [70] [10] |
| SPLASH Lipidomix | Quantitative internal standard mixture | Contains labeled standards across multiple lipid classes; enables semi-quantification of 700+ lipid species | [72] |
| Nitrogen Gas Supply | Create inert atmosphere during processing | Prevents oxidation; essential for processing oxidation-sensitive lipids like oxylipins | [72] |
| Pre-Validated Cryovials | Long-term sample storage | Use labels withstand -80°C; ensure chemical resistance; pre-test for contaminant leaching | [71] |
Addressing pre-analytical pitfalls in lipidomics requires a systematic approach that integrates solutions across the entire workflow, from sample collection to data analysis. The protocols and solutions presented here provide a foundation for improving lipidomic data quality by mitigating the major challenges of lipid degradation, oxidation, and isobaric interference. Implementation of standardized procedures, appropriate reagent selection, and advanced computational approaches enables researchers to generate more reliable and reproducible lipidomic data essential for meaningful biological insights and robust biomarker discovery.
As the field continues to evolve, adherence to guidelines from the Lipidomics Standards Initiative and implementation of quality scoring systems [73] will further enhance the reliability and interoperability of lipidomic data across laboratories and studies.
Missing data points are a pervasive and critical challenge in mass spectrometry-based lipidomics, with the potential to compromise data integrity, lead to biased statistical interpretations, and obscure genuine biological insights [76]. The presence of missing values can hinder the application of essential multivariate statistical methods, such as Principal Component Analysis (PCA), which require complete datasets to function [76]. Effectively managing these missing values is therefore not merely a technical data processing step, but a fundamental prerequisite for ensuring the reliability and biological relevance of lipidomics research outcomes. The strategies for handling missing data are deeply intertwined with the underlying causes of their absence, necessitating a thoughtful and evidence-based approach to imputation.
Understanding the Causes of Missing Data
A strategic approach to handling missing data begins with a thorough investigation into its potential causes. In lipidomics, missing data are typically categorized into three main types, which inform the selection of an appropriate imputation method.
Table 1: Causes and Categories of Missing Data in Lipidomics
| Category | Abbreviation | Description | Common Causes in Lipidomics |
|---|---|---|---|
| Missing Completely at Random | MCAR | The missingness is unrelated to both the observed and unobserved data. | Technical variability, sample preparation errors, random instrument fluctuations [77]. |
| Missing at Random | MAR | The probability of missingness may depend on observed data, but not on unobserved data. | A low-intensity lipid is missing because its concentration is correlated with another, observed lipid that was below the detection limit [77]. |
| Missing Not at Random | MNAR | The probability of missingness depends on the unobserved value itself. | The true abundance of a lipid is below the instrument's limit of detection (LOD) or limit of quantitation (LOQ) [77] [76]. |
In practice, Missing Not at Random (MNAR) is considered the most prevalent scenario in shotgun lipidomics data, where missing values frequently arise due to low analyte abundance falling below the detection threshold [77]. Determining the exact cause for every missing value is challenging, but this framework is essential for making an informed choice about how to proceed with data imputation.
A variety of imputation methods are available, ranging from simple, naive replacements to more advanced algorithms that model the underlying structure of the data.
Table 2: Comparison of Common Imputation Methods for Lipidomics Data
| Imputation Method | Principle | Pros | Cons | Best Suited For |
|---|---|---|---|---|
| Zero / Half-Minimum | Replaces missing values with zero or half of the minimum value for that lipid. | Simple, fast. | Biases statistical estimates; assumes all missing values are at a fixed, low level [77]. | Not generally recommended; sometimes used as a baseline. |
| Mean / Median | Replaces missing values with the mean or median of the observed values for that lipid. | Simple, preserves the mean of the observed data. | Ignores correlation structure; severely underestimates variance; poor for MNAR data [77] [76]. | MCAR data with low missingness rate. |
| k-Nearest Neighbor (k-NN) | Uses values from the 'k' most similar lipids (based on correlation) to impute the missing value. | Accounts for correlations between lipids. | Performance can depend on the choice of 'k'; requires a complete dataset to find neighbors [77]. | MCAR, MAR. |
| k-NN Truncated Normal (k-NN TN) | A specialized k-NN method that incorporates an upper bound (e.g., LOD) for imputed values. | Specifically designed for data with an upper detection limit; performs well with MNAR data [77]. | More computationally complex than simple k-NN. | MNAR (e.g., values below LOD) [77] [76]. |
| Random Forest | Uses an ensemble of decision trees to predict missing values based on all other lipids. | Powerful, non-linear, can model complex interactions. | Computationally intensive; can overfit. | MCAR, MAR. |
Research by Lipotype scientists, involving the testing of multiple methods on lipidomic datasets, concluded that the k-nearest neighbor truncation approach demonstrated the best performance for handling missing values commonly found in lipidomics [76]. Another independent simulation-based study confirmed that k-nearest neighbor approaches based on correlation and truncated normal distributions show the best performance, particularly as they effectively impute missing values independent of the type of missingness, which is often impossible to determine definitively in practice [77].
Detailed Experimental Protocols
Protocol 1: Diagnosis of Missing Data Patterns
1. Objective: To quantify the extent of missing data and generate hypotheses about the potential mechanisms of missingness before selecting an imputation method. 2. Materials:
- Raw lipid abundance data matrix (samples x lipids)
- R or Python statistical environment
- R packages:
naniar,ggplot2/ Python libraries:pandas,matplotlib,seaborn
3. Procedure:
- Step 1: Data Import and Matrix Assessment. Load the lipid abundance data. Calculate the total percentage of missing values in the entire dataset. For each lipid, calculate the percentage of missing values. For each sample, calculate the percentage of missing values.
- Step 2: Visualization. Create a histogram showing the distribution of missingness rates across all lipids. Generate a heatmap with samples as rows and lipids as columns, where missing values are colored distinctly from present values. This can reveal patterns, such as whether missing values are clustered in specific sample groups or are random.
- Step 3: Correlation with Total Ion Current (TIC). For each sample, correlate the number of missing lipids with the sample's TIC (a proxy for overall data quality). A strong negative correlation might indicate that missingness is related to overall sample quality (hinting at MAR).
- Step 4: Association with Abundance. Compare the average intensity (or median) of lipids that have many missing values versus those with complete data. If lipids with high missingness rates have consistently low average intensities in samples where they are detected, this is strong evidence for MNAR.
4. Interpretation: A dataset where missing values are predominantly found in low-abundance lipids supports the hypothesis of MNAR and justifies the use of methods like k-NN TN.
Protocol 2: k-Nearest Neighbor Truncated Normal (k-NN TN) Imputation
1. Objective: To robustly impute missing lipid values suspected to be MNAR, using the k-NN TN method. 2. Materials:
- Lipid abundance data matrix after basic pre-processing (excluding lipids with >80% missingness)
- High-performance computing environment (R/Python)
- R:
`imputeLCMD`package / Python:scikit-learnandnumpy
3. Procedure:
- Step 1: Data Pre-processing. Remove lipids with an extremely high rate of missingness (e.g., >80%), as these provide little information for imputation. Log-transform the data to stabilize variance and make the data more normally distributed.
- Step 2: Parameter Definition. Set the number of neighbors
k. A common starting point is the square root of the number of lipids, which can be optimized. Define the truncation threshold. This is often set as the minimum value observed for each lipid across all samples, serving as a proxy for the LOD. - Step 3: Imputation Execution.
- a. Scale the data: Standardize the data (mean-centered and scaled to unit variance) lipid-wise.
- b. Find neighbors: For each lipid
Lwith missing values, identify thekmost similar lipids based on Pearson correlation across all samples. - c. Impute: For a missing value in lipid
Land sampleS, calculate a weighted average of the values from thekneighbor lipids in sampleS. The weights are typically the correlations betweenLand each neighbor. - d. Truncate: If the imputed value from step (c) is above the predefined truncation threshold for lipid
L, use the calculated value. If it is above the threshold, cap it at the threshold value. - e. Back-transform: Reverse the scaling and log-transformation to return the data to its original scale.
- Step 4: Quality Control. Re-inspect the data matrix to ensure no missing values remain. Compare the distribution of imputed values versus measured values for a few key lipids to check for obvious biases.
The Scientist's Toolkit: Essential Research Reagents and Materials
Table 3: Key Research Reagent Solutions for Lipidomics Quality Control
| Item Name | Function in Managing Missing Data |
|---|---|
| Avanti EquiSPLASH LIPIDOMIX | A quantitative mass spectrometry internal standard mixture of deuterated lipids. Added prior to extraction to monitor and correct for losses during sample preparation, a key source of missingness [78]. |
| Quality Control (QC) Pooled Samples | A pool created from all study samples, injected repeatedly throughout the analytical sequence. Used to monitor instrument stability and detect drift that can cause missing values in later runs [10]. |
| System Suitability Standards | A mixture of known lipids at known concentrations. Injected at the beginning of a sequence to verify instrument sensitivity is adequate to detect low-abundance lipids and prevent MNAR [10]. |
| Blank Solvent Samples | Samples containing only the extraction solvents. Injected to identify and remove signals stemming from solvents or contaminants, preventing false-positive identifications and clarifying true missing data [10]. |
| NIST SRM 1950 | Standard Reference Material for human plasma. Used for inter-laboratory comparison and batch effect correction, helping to standardize detection and minimize technically driven missing data [10]. |
Integrated Workflow for Decision-Making
Choosing the correct imputation strategy requires a systematic evaluation of the data. The following workflow diagram outlines a logical decision pathway to guide researchers from data assessment to a robustly imputed dataset.
Large-scale untargeted lipidomics experiments, which can involve the measurement of hundreds to thousands of samples, are typically acquired on a single instrument over days or weeks of analysis [79]. These extensive data acquisition processes introduce a variety of systematic errors, including batch differences, longitudinal drifts, and instrument-to-instrument variation [79]. Such technical data variance can obscure true biological signals and hinder the discovery of biologically relevant findings [79]. The lipidome presents particular challenges due to the extensive chemical diversity of lipid species, with estimates suggesting between 10,000 and 100,000 distinct lipid chemical species exist [11]. This diversity, combined with a wide dynamic range of concentrations in biological matrices (from pM to mM) and the presence of numerous isomeric and isobaric species, makes comprehensive lipid analysis particularly vulnerable to systematic technical errors [80] [11].
Quality Control (QC) samples, typically prepared as pooled aliquots of the biological study samples, provide a critical tool for monitoring and correcting these technical variations [79] [81]. When injected regularly throughout the analytical sequence, QC samples enable researchers to track instrumental drift and batch effects over time [79]. The fundamental principle behind QC-based normalization approaches is to utilize the intensity patterns observed in QCs to model and regress out unwanted systematic error for each metabolite or lipid, thereby retaining essential biological variation of interest [79]. Compared to other normalization approaches such as data-driven methods or internal standard-based normalizations, QC-based methods offer the advantage of accounting for matrix effects that specifically affect the study samples [79].
Understanding QC-Based Normalization Approaches
The Role of Quality Control Samples
In lipidomics workflows, Quality Control (QC) samples are essential components for ensuring data quality and reliability. These samples are typically prepared by combining equal aliquots from all study samples, creating a pooled sample that is representative of the entire sample set [79]. These pooled QC samples are then injected at regular intervals throughout the analytical sequence—for example, after every 5-10 study samples—to monitor technical performance over time [81]. The primary function of QC samples is to capture systematic technical variations that occur during data acquisition, including instrumental drift, batch effects, and other non-biological fluctuations that could otherwise obscure true biological signals [79].
A reliable QC-based normalization method should fulfill three key requirements: (1) accurately fit intensity drifts caused by instrument use over time, (2) robustly respond to outliers within the QC samples themselves, and (3) show resilience against overfitting to the training QCs [79]. The power of QC-based normalization lies in its ability to distinguish technical artifacts from biological phenomena, thus enhancing the statistical power to detect biologically meaningful differences [79]. For a case-control study, it has been demonstrated that a mere 5% standard deviation increment for a metabolite with a small effect size (Cohen's d = 0.2) would require 41 more samples to achieve 80% statistical power, highlighting the critical importance of effective normalization [79].
Comparison of Normalization Strategies
In lipidomics, multiple sample normalization strategies have been developed to combat technical errors, which can be broadly classified into three categories [79]:
Table 1: Categories of Normalization Methods in Lipidomics
| Category | Description | Limitations |
|---|---|---|
| Data-Driven Normalizations | Methods such as MSTUS, median, and sum normalization that rely on the assumption that the total signal remains constant across samples [79]. | The self-averaging property assumption may not hold in lipidomics, as systematic errors may affect different lipids differently [79]. |
| Internal Standard-Based Normalizations | Utilize added internal standards (IS) such as single IS, global IS, or multiple IS methods to normalize intensity [79]. | IS peaks may not adequately represent all matrix effects; standards can be influenced by co-elution and may not cover all chemical species [79]. |
| QC-Based Normalizations | Use pooled quality control samples to model and correct systematic errors [79]. | Requires careful experimental design with sufficient QC replication throughout the analytical sequence [79]. |
Advanced Normalization Algorithms: LOESS and SERRF
LOESS (Locally Estimated Scatterplot Smoothing)
LOESS (Locally Estimated Scatterplot Smoothing) is a widely used QC-based normalization algorithm designed to correct for systematic biases and variability in high-throughput lipidomics data [81]. The algorithm operates by fitting smooth curves to the relationship between the measured intensities of QC samples and their position within the analytical sequence (run order) [81]. This process is particularly effective for addressing non-linear temporal drift that commonly occurs in mass spectrometry-based analyses [81].
The LOESS algorithm works through local polynomial regression, fitting polynomials to small subsets of the data by least squares regression, with greater emphasis placed on points near the target point [81]. This localized approach allows LOESS to adapt to complex, non-linear patterns of instrumental drift without making strong assumptions about the overall functional form of the trend [81]. The "span" parameter in LOESS (typically set around 0.75) controls the degree of smoothing by determining the proportion of data points used in each local regression [81].
SERRF (Systematic Error Removal using Random Forest)
SERRF (Systematic Error Removal using Random Forest) represents a more recent advancement in QC-based normalization that leverages machine learning to address technical variations [79] [82]. Unlike traditional methods that assume systematic error for each variable is only associated with batch effect and injection order, SERRF incorporates a key insight: systematic variation for each variable can be better predicted by considering the systematic variation of other compounds alongside batch effects and injection order numbers [79].
The random forest algorithm was selected as the predictive engine for SERRF due to several advantageous attributes [79] [82]:
- It can be applied when there are more variables than samples (p ≫ n), which fits the data structure of high-throughput untargeted lipidomics
- It can fit nonlinear trends frequently observed in lipidomics data
- It does not suffer from multicollinearity (high correlation among variables)
- It tolerates missing values and outliers
- It is proven not to be overfitting when the number of trees increases
The fundamental equation underlying SERRF represents the systematic error (si) for the i-th metabolite as a function of injection order (t), batch effect (B), and the intensity of QCs from other metabolites (I(-i,QC)) [79]: si ∼ Φi (t, B, I_(-i,QC))
Where Φi is the random forest classifier. To remove signal drift and unwanted technical variations, the intensity of each compound is normalized by dividing the predicted systematic error si and multiplying by the median average of the raw values [79].
Performance Comparison
Multiple studies have compared the performance of SERRF against other normalization methods, including LOESS, across large-scale lipidomics datasets. The following table summarizes benchmark performance data from the original SERRF validation study, which utilized lipidomics data sets from three large cohort studies (P20, GOLDN, and ADNI) [79] [82]:
Table 2: Performance Comparison of SERRF vs. Other Methods Across Different Lipidomics Datasets
| Dataset | Ionization Mode | Metric | Raw Data | LOESS | SERRF |
|---|---|---|---|---|---|
| P20 | Negative | Median CV-QC RSD | 26.5% | 8.2% | 6.3% |
| P20 | Positive | Median CV-QC RSD | 19.7% | N/A | 3.9% |
| ADNI | Positive | Median CV-QC RSD | 17.5% | 11.3% | 4.4% |
| GOLDN | Negative | Median CV-QC RSD | 34.1% | 8.4% | 4.7% |
These results demonstrate that SERRF consistently outperforms other normalization methods, including LOESS, across diverse datasets and ionization modes [79] [82]. The superior performance of SERRF is attributed to its ability to leverage correlation structures between compounds when modeling and correcting systematic errors, rather than treating each compound in isolation [79].
Experimental Protocols
Sample Preparation and QC Design
Protocol: Preparation of Pooled QC Samples for Lipidomics
Sample Pooling: Combine equal aliquots (e.g., 10-20 μL) from each study sample to create a pooled QC sample that is representative of the entire sample set [79]. The volume taken from each sample should be proportional to the original sample volume to maintain representation.
QC Replication: Prepare a sufficient volume of the pooled QC sample to allow for repeated injections throughout the entire analytical sequence. As a general guideline, the QC/sample number ratio should be greater than 1:10 (at least 1 QC per 10 samples) [81].
Experimental Design: Integrate QC samples at regular intervals throughout the run sequence. A typical approach involves injecting a QC sample after every 5-10 experimental samples [81]. Additionally, include several QC injections at the beginning of the sequence to condition the system and a block of QC samples at the end to evaluate long-term drift.
Storage: Aliquot the pooled QC samples to avoid repeated freeze-thaw cycles and store at the same conditions as the study samples (typically -80°C) until analysis.
Materials Required:
- Biological samples: Plasma, serum, or tissue samples from the study cohort
- Solvents: HPLC-grade methanol, methyl tert-butyl ether (MTBE), water [80]
- Internal standards: Deuterated lipid standards or odd-chain lipid standards for monitoring extraction efficiency [79] [80]
LC-MS Data Acquisition
Protocol: Liquid Chromatography-Mass Spectrometry Analysis with QC Integration
Chromatographic Separation:
- Use reversed-phase liquid chromatography with a C18 or C30 column for comprehensive lipid separation [11].
- Employ a gradient elution program suitable for lipid separation. A typical gradient for lipidomics might start at 5% acetonitrile (in water or aqueous buffer) and progress linearly to 95% acetonitrile over 5-25 minutes [83].
- Maintain the column temperature at a constant value (typically 25-40°C) throughout the analysis [83].
Mass Spectrometry Parameters:
- Operate the mass spectrometer in both positive and negative electrospray ionization modes to capture different lipid classes [79] [80].
- Use data-dependent acquisition (DDA) or data-independent acquisition (DIA) methods for untargeted lipidomics [11].
- Include MS/MS fragmentation for lipid identification.
Sequence Design:
- Program the autosampler to inject samples in randomized order to avoid confounding biological effects with injection order [48].
- Integrate QC samples at regular intervals throughout the sequence (e.g., every 5-10 samples) [81].
- Include system suitability tests and blank samples (extraction blanks) to monitor contamination.
Implementation of LOESS Normalization
Protocol: LOESS Normalization in R
Data Preparation:
QC Sample Selection:
LOESS Smoothing:
Smoothing Factor Calculation and Normalization:
Output Normalized Data:
Implementation of SERRF Normalization
Protocol: SERRF Normalization Using Web-Based Tool
Data Formatting:
- Prepare your data in a .csv or .xlsx format with specific column requirements [82] [81].
- The dataset must include the following columns with exact spelling and case sensitivity [81]:
batch: Batch identifiers (can represent time intervals, machines, or labs)sampleType: Sample type identifiers ('qc', 'sample', or optional 'validate')time: Running sequence/injection order as continuous numberslabel: Sample labels for each column and compound labels for each rowNo: Compound number index (without empty cells)
Web-Based Normalization:
- Access the SERRF online tool at https://slfan2013.github.io/SERRF-online/ or the secondary server at https://slfan.shinyapps.io/ShinySERRF/ if the main server is under maintenance [81].
- Upload your properly formatted dataset using the "Choose File" button.
- Click the "Apply SERRF normalization" button to initiate the normalization process.
Result Interpretation:
- After processing, download the normalized results.
- Review the generated PCA plots and RSD values to assess normalization effectiveness.
- A successful normalization will typically show QC samples clustered tightly in PCA space and reduced relative standard deviation values [82].
Protocol: SERRF Normalization in R
For users preferring R implementation, SERRF can be executed using the following approach:
Workflow Visualization
Diagram 1: Lipidomics Normalization Workflow. This diagram illustrates the complete workflow from sample preparation through data normalization, highlighting decision points for choosing between LOESS and SERRF normalization methods based on data complexity.
Diagram 2: SERRF Algorithm Workflow. This diagram details the step-by-step process of the SERRF normalization algorithm, highlighting how it leverages random forest modeling and inter-compound correlations to correct systematic errors.
The Scientist's Toolkit
Table 3: Essential Research Reagents and Tools for Lipidomics Normalization
| Category | Item | Function | Example/Specification |
|---|---|---|---|
| QC Materials | Pooled QC Samples | Monitor technical variation and enable normalization | Prepared from aliquots of all study samples [79] |
| Internal Standards | Deuterated Lipid Standards | Monitor extraction efficiency and instrument performance | Odd-chain and deuterated lipid internal standards [79] [80] |
| Solvents | HPLC-grade Solvents | Lipid extraction and mobile phase preparation | Methanol, MTBE, acetonitrile, water [80] |
| Chromatography | UPLC/HPLC System | Lipid separation prior to mass spectrometry | Reversed-phase C18 or C30 columns [11] |
| Mass Spectrometry | High-Resolution Mass Spectrometer | Lipid detection and quantification | Q-TOF, Orbitrap, or triple quadrupole instruments [11] |
| Software Tools | SERRF Web Tool | Online normalization using random forest algorithm | https://slfan2013.github.io/SERRF-online/ [82] [81] |
| Software Tools | R Statistical Environment | Implementation of LOESS and other normalization methods | Packages: tidyverse, randomForest [81] |
Effective data normalization is a critical component of robust lipidomics workflows, particularly in large-scale studies where technical variations can easily obscure biological signals. Both LOESS and SERRF offer powerful approaches for correcting systematic errors using quality control samples, with each having distinct advantages depending on the complexity of the dataset and the nature of the technical artifacts. While LOESS provides a robust method for addressing non-linear temporal drift, SERRF leverages advanced machine learning to account for more complex, multi-factor systematic errors by incorporating correlation structures between compounds.
The implementation of these normalization strategies requires careful experimental design, including appropriate integration of QC samples throughout the analytical sequence and proper data formatting. As lipidomics continues to evolve with increasing sample throughput and analytical complexity, advanced normalization methods like SERRF that can leverage complex correlation structures between compounds will become increasingly important for extracting biologically meaningful information from large-scale lipidomics datasets.
Mass spectrometry-based lipidomics and metabolomics generate extensive datasets that, together with clinical metadata, require specific data exploration skills to identify and visualize statistically significant trends and biologically relevant differences [18]. The complexity of this data, characterized by features like missing values, heteroscedasticity, and large-scale correlations, demands robust, reproducible, and transparent computational workflows [18] [10]. While user-friendly web platforms exist, they often lack the flexibility required for advanced customization and visualization [18]. This application note addresses this gap by providing a comprehensive guide for implementing modular, code-based statistical workflows in R and Python, enabling researchers to perform everything from data preprocessing to the generation of publication-ready graphics [10]. Framed within the broader context of a lipidomic workflow—from sample collection to data analysis—this protocol emphasizes best practices that align with FAIR data principles (Findable, Accessible, Interoperable, Reusable) and guidelines from the Lipidomics Standards Initiative (LSI) and the Metabolomics Society [10] [84].
Experimental Design and Materials
Research Reagent Solutions
Successful lipidomic analysis depends on carefully selected reagents and standards to ensure accuracy and reproducibility. The table below details essential materials used in the featured workflows.
Table 1: Essential Research Reagents and Materials for Lipidomics Workflows
| Item Name | Function/Application | Key Details |
|---|---|---|
| Quality Control (QC) Samples | Evaluation of technical variability and data quality; used for normalization and batch effect correction [18]. | Can be a pool of all biological samples or commercial standards (e.g., NIST SRM 1950 for plasma) [18]. |
| Internal Standards (IS) | Normalization for extraction efficiency and instrument response; enables absolute quantification [85] [86]. | Often a stable isotope-labeled mixture (e.g., EquiSPLASH); crucial for converting peak areas to concentrations [85] [7]. |
| Solvent Blanks | Identification of background contaminants and background subtraction [7]. | Prepared using the starting mobile phase solvent to monitor system contamination [7]. |
| Sample Preparation Solvents | Lipid extraction from biological matrices. | Simplified protocols exist, such as methanol/methyl tert-butyl ether (1:1, v/v) for minimal serum volumes [86]. |
Software and Computational Environment Setup
The following tools form the core of the proposed computational workflow. Researchers should install the appropriate environment before proceeding.
Table 2: Core Software Tools and Packages for Lipidomics Data Analysis
| Tool Category | Recommended Options | Application Notes |
|---|---|---|
| Programming Language | R (version >4.0) or Python (version >3.8) | R is preferred for polished static graphics; Python integrates well with complex machine learning workflows [10]. |
| R Packages | ggplot2, ggpubr, ComplexHeatmap, ggtree, mixOmics |
Used for statistical modeling and creating publication-quality visualizations [10]. |
| Python Libraries | seaborn, matplotlib, scikit-learn |
Employed for flexible data visualization and statistical analysis [10]. |
| Integrated Development Environment (IDE) | RStudio, Jupyter Notebook, VS Code | Facilitates script development, execution, and documentation. |
| Complementary Resource | Associated GitBook: "Omics Data Visualization in R and Python" | Provides step-by-step code, versioning, and decision logic [10] [84]. |
Protocol: Data Processing and Statistical Workflow
The following protocol outlines a complete workflow for analyzing lipidomics data, from handling raw data to advanced statistical modeling and visualization. The accompanying diagram illustrates the logical flow and key decision points.
Data Analysis Workflow - Logical flow for processing lipidomics data from raw input to final output.
Handling Missing Values - Step-by-Step Protocol
Objective: To identify, classify, and impute missing values in a lipidomics dataset without substantially altering the underlying biological information [18].
Background: Missing values are common and can arise from analytical issues or analyte abundance being below the limit of detection (LOD). They are classified as:
- MCAR (Missing Completely at Random): The missingness is unrelated to any variable.
- MAR (Missing at Random): The missingness is related to observed variables.
- MNAR (Missing Not at Random): The missingness is related to the unobserved value itself (e.g., below LOD) [18].
Procedural Steps:
- Data Filtering: Remove lipid species with a high percentage of missing values (e.g., >35% across all samples) [18].
- Classification: Investigate the potential causes of missingness to classify them as MCAR, MAR, or MNAR. MNAR is often suspected when a lipid is absent in one biological group but present in another [18].
- Imputation: Apply an imputation method suitable for the identified type of missingness.
- Validation: Visually compare the data distribution before and after imputation (e.g., using density plots) to ensure no major artifacts have been introduced.
Notes: Avoid applying imputation methods blindly. The combination of kNN for MCAR/MAR and a method like hm for MNAR has been shown to be effective [18].
Data Normalization and Transformation
Objective: To remove unwanted technical variation (e.g., batch effects, instrument drift) and prepare the data for statistical modeling.
Background: Normalization is critical for spotlighting biological information. Pre-acquisition normalization (e.g., by sample volume, mass, or cell count) is preferred. Post-acquisition normalization uses QC samples and internal standards to correct for batch effects and variations in extraction efficiency [18] [10].
Procedural Steps:
- Pre-acquisition Normalization: Ensure data is normalized based on the initial sample amount (e.g., volume, mass, protein concentration) before statistical analysis [18].
- Batch Effect Correction: Use QC samples injected throughout the analytical sequence. Apply advanced algorithms like LOESS (Locally Estimated Scatterplot Smoothing) or SERRF (Systematic Error Removal using Random Forest) to correct for systematic drift [10].
- Internal Standard Normalization: Use internal standards to normalize raw data, accounting for instrument response and lipid recovery during extraction. This can enable absolute quantification [85].
- Data Transformation and Scaling: Apply log-transformation or power transformation to address heteroscedasticity and make data more symmetric. Use unit variance scaling (autoscaling) if needed for methods that require it [10].
Notes: Data transformation should never be performed automatically and should align with the requirements of the chosen statistical tests [10].
Protocol: Statistical Analysis and Visualization
Exploratory and Differential Analysis
Objective: To uncover underlying patterns, groupings, and statistically significant lipid alterations between experimental conditions.
Procedural Steps:
Exploratory Analysis - Unsupervised Learning:
- Perform Principal Component Analysis (PCA) to visualize overall data structure, identify outliers, and detect batch effects [10].
- Use clustering algorithms (e.g., hierarchical clustering) combined with heatmaps and dendrograms to visualize relationships between samples and lipids [18] [10].
- Apply Uniform Manifold Approximation and Projection (UMAP) for non-linear dimensionality reduction, which can reveal more complex patterns [10].
Differential Analysis - Supervised Learning:
- Hypothesis Testing: Apply statistical tests (e.g., t-test, ANOVA) to identify lipids with significant abundance changes between groups. Account for multiple testing using corrections like False Discovery Rate (FDR) [18].
- Volcano Plots: Visualize the results of differential analysis by plotting statistical significance (-log10(p-value)) against the magnitude of change (log2(fold-change)) [18].
- Advanced Visualizations: Utilize specialized plots like lipid maps and fatty acyl-chain plots to reveal trends within lipid classes and their structural properties [10].
Data Visualization Toolkit
Effective visualization is key to interpreting complex lipidomics data. The following diagram summarizes the core visualization workflow and its connection to the analysis steps.
Visualization Workflow - From processed data to key plot types for lipidomics.
Implementation in R and Python:
The table below lists the primary packages and functions for generating these visualizations.
Table 3: Implementation of Key Visualizations in R and Python
| Visualization Type | R Package & Function | Python Library & Function | Key Application |
|---|---|---|---|
| Box/Violin Plot | ggplot2::geom_boxplot(), ggpubr |
seaborn::boxplot(), seaborn::violinplot() |
Compare data distributions across groups; use jitter to show individual data points [10]. |
| PCA Plot | mixOmics::pca(), ggplot2::geom_point() |
sklearn.decomposition.PCA, matplotlib.pyplot.scatter() |
Unsupervised exploration of data structure and outliers [10]. |
| Heatmap with Dendrogram | ComplexHeatmap::Heatmap() |
seaborn::clustermap() |
Visualize clustering of samples and lipids simultaneously [10]. |
| Volcano Plot | ggplot2::geom_point(), EnhancedVolcano |
matplotlib.pyplot.scatter() |
Identify statistically significant and large-magnitude changes [18]. |
| Lipid Maps & Acyl-Chain Plots | Custom scripts (see GitBook) [10] | Custom scripts (see GitBook) [10] | Visualize trends within lipid classes and fatty acid properties [10]. |
This application note provides a structured framework for implementing statistical workflows for lipidomics data in R and Python. By adhering to the outlined protocols for data preprocessing, normalization, and analysis, researchers can enhance the robustness, transparency, and reproducibility of their findings. The emphasis on code-based, modular workflows over rigid "black box" pipelines empowers scientists to adapt and understand each step of their analysis [10]. The provided GitBook resource, with its step-by-step code and decision logic, serves as a living document to support the broader adoption of these best practices within the lipidomics and metabolomics communities [10] [84]. As the field advances towards greater integration with artificial intelligence and automated annotation, these foundational skills in programming and statistics will become increasingly vital for extracting meaningful biological insights from complex omics datasets.
In mass spectrometry-based lipidomics, the transition from raw data to biological insight is governed by the ability to effectively visualize complex, high-dimensional datasets. While bar charts are a staple for displaying group means, they often obscure the underlying data distribution, outliers, and complex relationships that are hallmarks of lipidomic data [10]. Advanced visualization techniques including volcano plots, lipid maps, and Principal Component Analysis (PCA) have become essential tools for revealing patterns, trends, and potential outliers that would otherwise remain hidden [10] [87]. These methods form the core of a modern lipidomic workflow, enabling researchers to communicate findings with clarity and rigor, thereby supporting reproducible research and accelerating discovery in fields ranging from basic biochemistry to pharmaceutical development.
Data Preprocessing: The Foundation for Reliable Visualization
Handling Missing Values
Lipidomics datasets frequently contain missing values, which must be addressed before visualization and statistical analysis. The nature of these missing values falls into three categories, each requiring a different imputation strategy [87]:
- Missing Completely at Random (MCAR): The missingness is independent of both observed and unobserved data.
- Missing at Random (MAR): The missingness is related to observed variables but not the missing values themselves.
- Missing Not at Random (MNAR): The missingness is related to the unobserved missing values themselves, often because the lipid species is below the limit of detection.
Common imputation methods include substitution by a percentage of the lowest concentration measured, k-nearest neighbors (kNN) imputation, and random forest-based imputation [87]. For MNAR data, imputation with a half-minimum value has been identified as an effective approach [87].
Normalization and Scaling
Normalization aims to remove unwanted technical variation while preserving biological signal. Best practices recommend:
- Using quality control (QC) samples for batch effect correction.
- Applying standards-based normalization to account for analytical response factors.
- Carefully selecting data transformation (e.g., log, power) and scaling (e.g., unit variance, Pareto) methods based on the data distribution and subsequent statistical analysis [10].
Table 1: Common Data Preprocessing Challenges and Recommended Strategies in Lipidomics
| Processing Step | Challenge | Recommended Strategy | Rationale |
|---|---|---|---|
| Missing Value Imputation | Data missing not at random (MNAR) | Imputation with a percentage (e.g., 50%) of the minimum concentration | Avoids false positives for lipids below detection limit while preserving data structure [87] |
| Batch Effect Correction | Signal drift across analytical runs | LOESS or SERRF normalization using QC samples | Corrects for systematic technical variation without relying on biological assumptions [10] |
| Data Transformation | Heteroscedasticity & skewed distributions | Log or power transformation | Stabilizes variance and makes data distributions more symmetrical [87] |
| Data Scaling | Large dynamic range of lipid concentrations | Unit variance or Pareto scaling | Prevents high-abundance lipids from dominating the analysis [10] |
Core Visualization Techniques: Protocols and Applications
Volcano Plots
Volcano plots are powerful tools for visualizing the results of differential analysis, simultaneously displaying statistical significance (p-value) and magnitude of change (fold-change).
Experimental Protocol: Creating a Volcano Plot in R
- Perform Statistical Testing: Conduct a statistical test (e.g., t-test, Wilcoxon test) for each lipid to compare groups.
- Calculate Fold-Change: Compute the log2 fold-change for each lipid between groups.
- Generate Plot: Plot the -log10(p-value) against the log2(fold-change).
- Apply Thresholds: Draw vertical lines to indicate desired fold-change thresholds (e.g., ±log2(1.5)) and a horizontal line for the significance threshold (e.g., -log10(0.05)).
- Annotate Significants: Highlight and optionally label data points that pass both thresholds.
Volcano plot creation workflow
Interpretation: Points in the top-left and top-right quadrants represent lipids that are both statistically significant and substantially altered in abundance, making them prime candidates for biomarkers or further investigation [10] [87].
Lipid Maps
Lipid maps are specialized visualizations that organize lipidomic data based on chemical structure or biochemical relationships, such as lipid class, fatty acyl chain length, or degree of unsaturation.
Experimental Protocol: Generating a Fatty Acyl Chain Plot
- Data Aggregation: Aggregate lipid intensities based on the sum of carbon atoms and double bonds in their fatty acyl chains.
- Create Matrix: Structure the data into a matrix where rows represent total carbon number and columns represent total double-bond count.
- Visualize Heatmap: Visualize the matrix as a heatmap, where the color intensity in each cell represents the total abundance of lipids with that specific carbon:double bond combination.
- Interpret Trends: Look for visual patterns that indicate enzymatic preferences or metabolic states, such as clusters along a diagonal or specific regions of high intensity.
Lipid map generation process
These visualizations can reveal trends within lipid classes and provide insights into the activity of desaturase and elongase enzymes, which are key players in lipid metabolism [10].
Principal Component Analysis (PCA)
PCA is an unsupervised technique used to reduce the dimensionality of lipidomics data, revealing inherent clustering, outliers, and major sources of variation.
Experimental Protocol: Executing and Interpreting PCA
- Data Preparation: Start with a preprocessed, scaled data matrix (lipids as columns, samples as rows).
- Perform PCA: Compute principal components using singular value decomposition.
- Generate Scores Plot: Create a scatter plot of the first two or three principal components (PC1 vs. PC2). Color points by experimental group.
- Generate Loadings Plot: Create a plot showing the contribution of each lipid to the principal components.
- Interpret Results: Examine the scores plot for sample clustering and outliers. Use the loadings plot to identify which lipids drive the separation observed in the scores plot.
PCA analysis procedure
PCA is particularly valuable as a first step in exploratory analysis for quality control, allowing researchers to quickly flag problematic samples or batches before deeper analysis [10].
Table 2: Essential Research Reagent Solutions for Lipidomics Visualization
| Reagent/Material | Function in Lipidomics Workflow | Application in Visualization |
|---|---|---|
| NIST SRM 1950 | Standard Reference Material for human plasma | Normalization and quality control; enables batch correction for reliable PCA and cross-study comparisons [87] |
| Internal Standards (IS) | Stable isotope-labeled lipid analogs added to samples | Data normalization for accurate quantification; essential for generating reliable fold-change values in volcano plots [10] |
| Quality Control (QC) Pool | Pooled sample from all biological samples | Monitoring instrument performance; used in LOESS/SERRF normalization to minimize technical variation in all visualizations [10] [87] |
| LIPID MAPS Database | Curated lipid structure and pathway database | Provides classification and nomenclature for accurate annotation in lipid maps and other class-based visualizations [88] |
Implementation Toolkit: From Code to Publication
Software and Packages
Implementing these visualizations requires proficiency in statistical programming environments. The following tools are recommended for their maturity, community adoption, and ability to generate publication-quality output [10]:
- R Packages:
ggplot2,ggpubr, andtidyplotsfor static graphics;ComplexHeatmapandggtreefor heatmaps and dendrograms;mixOmicsfor multivariate analysis including PCA. - Python Packages:
seabornandmatplotlibfor flexible visualizations;scikit-learnfor PCA and other statistical methods.
Integrated Workflow for Comprehensive Analysis
A typical workflow integrates multiple visualization techniques to tell a complete story. For example, PCA might first be used for quality control and to assess overall data structure. Subsequently, volcano plots can identify specific lipids of interest between experimental groups. Finally, lipid maps can place these significant lipids into a broader biochemical context, revealing patterns related to lipid class and fatty acid composition.
Application in Neurodegenerative Disease Research
Advanced visualization techniques are proving particularly valuable in clinical and translational research. For instance, the Neurolipid Atlas—a data commons for neurodegenerative diseases—leverages these methods to compare lipid profiles across different brain cell types and disease states [89]. In one application, PCA and heatmaps revealed that induced pluripotent stem cell (iPSC)-derived neurons, astrocytes, and microglia exhibit distinct lipid profiles that recapitulate known in vivo lipotypes [89]. Furthermore, volcano plots and lipid class-based visualizations were instrumental in identifying cholesterol ester accumulation in ApoE4 astrocytes, a phenotype also observed in Alzheimer's disease brain tissue [89]. This case study exemplifies how moving beyond bar charts to multidimensional visualizations can uncover biologically and clinically relevant insights in complex systems.
The adoption of advanced visualization techniques represents a critical evolution in the lipidomic workflow. Volcano plots, lipid maps, and PCA provide powerful, complementary perspectives on complex datasets, enabling researchers to detect subtle patterns, generate robust hypotheses, and communicate findings effectively. As the field continues to mature, with an increasing emphasis on reproducibility and FAIR data principles, these visualization methods—supported by standardized protocols and open-source computational tools—will remain foundational to extracting meaningful biological knowledge from lipidomic data.
Validation, Harmonization, and Translating Discoveries
The Role of Reference Materials (e.g., NIST SRM 1950) in Intra- and Inter-laboratory Validation
In the evolving field of lipidomics, the transition from biomarker discovery to clinical application necessitates rigorous quality control and method validation. The diversity of lipidomic workflows, encompassing variations in sample preparation, analytical platforms, and data processing, presents a significant challenge for harmonizing results across different laboratories and over time [90]. Reference materials provide a standardized benchmark to address this challenge, enabling scientists to assess the accuracy and reproducibility of their quantitative measurements. Among these, the National Institute of Standards and Technology (NIST) Standard Reference Material (SRM) 1950, "Metabolites in Frozen Human Plasma," has emerged as a critical tool for intra- and inter-laboratory validation in lipidomics [91] [92]. This application note details the use of SRM 1950 within the context of a complete lipidomic workflow, from sample collection to data analysis, providing researchers and drug development professionals with structured data, detailed protocols, and visual guides to enhance the reliability of their lipidomic data.
The Benchmark: NIST SRM 1950
NIST SRM 1950 was developed as a "normal" human plasma reference material, constructed from 100 fasting individuals aged 40–50 years, representing the average composition of the U.S. population as defined by race, sex, and health [91]. Its commercial availability and well-characterized nature make it an ideal material for harmonizing lipidomic measurements.
While the certificate of analysis provides certified values for a limited number of metabolites and lipids, the lipidomics community requires benchmark values that reflect the diversity of the lipidome. To meet this need, a significant interlaboratory comparison exercise (ILCE) was conducted involving 31 diverse laboratories [91] [92]. This effort established consensus mean concentration estimates for hundreds of lipid species in SRM 1950, providing the community-wide benchmarks essential for validation.
Table 1: Lipid Classes with Consensus Values in SRM 1950
| Lipid Category | Example Lipid Classes | Primary Use in Validation |
|---|---|---|
| Fatty Acyls (FA) | Free Fatty Acids (FFA), Eicosanoids | Assess extraction & quantification of inflammatory mediators & energy substrates |
| Glycerolipids (GL) | Diacylglycerols (DAG), Triacylglycerols (TAG) | Monitor accuracy for high-abundance, complex lipid species |
| Glycerophospholipids (GP) | Phosphatidylcholines (PC), Phosphatidylethanolamines (PE), Lysophospholipids (LPC, LPE) | Validate separation & detection of major membrane lipid components |
| Sphingolipids (SP) | Ceramides (CER), Sphingomyelins (SM), Hexosylceramides (HexCer) | Benchmark performance for clinically relevant signaling lipids |
| Sterols (ST) | Cholesteryl Esters (CE), Free Cholesterol (FC) | Control for quantification of essential structural & metabolic sterols |
The consensus values were calculated using robust statistical methods (Median of Means and DerSimonian Laird estimation) for lipid species measured by multiple laboratories, ensuring their reliability for harmonization purposes [90]. These values allow a laboratory to answer a critical question: "Do my results agree with those produced by the wider lipidomics community?"
Application Note: Utilizing SRM 1950 for Quality Control
Visualizing the Validation Workflow
The following diagram illustrates the standard operating procedure for incorporating NIST SRM 1950 into a lipidomics workflow for method validation and quality assurance.
The Scientist's Toolkit: Essential Research Reagent Solutions
Table 2: Key Reagents and Materials for SRM 1950-Based Validation
| Item | Function / Role | Example / Note |
|---|---|---|
| NIST SRM 1950 | Matrix-matched quality control; provides benchmark for accuracy | Commercially available frozen human plasma [91] |
| Stable Isotope-Labeled Internal Standards | Correct for extraction efficiency & ionization variability | Deuterated ceramide mix for absolute quantification [93] |
| Authentic Synthetic Lipid Standards | Create calibration curves for absolute quantification | Avanti Polar Lipids; used for ceramide harmonization [93] |
| Solvents & Reagents | Lipid extraction; mobile phase for chromatography | MS-grade chloroform, methanol, water, isopropanol, ammonium formate |
| Quality Control Pools | Monitor analytical performance over time | In-house prepared pool of patient/control plasma |
Detailed Experimental Protocol: Ceramide Quantification
The following protocol is adapted from a community-driven interlaboratory study that achieved highly concordant results for ceramide quantification in SRM 1950 [93].
1. Sample Preparation (Extraction)
- Thawing: Thaw SRM 1950 plasma aliquots on ice.
- Aliquoting: Pipette a precise volume of plasma (e.g., 10-30 µL) into a glass tube.
- Spiking: Add a known amount of a mixture of deuterated internal standards (e.g., d7-Cer 16:0, d7-Cer 18:0, d7-Cer 24:0, d7-Cer 24:1).
- Lipid Extraction: Perform a modified Bligh-Dyer extraction:
- Add a chloroform:methanol (1:2 v/v) mixture to the plasma.
- Vortex thoroughly and incubate.
- Add additional chloroform and water to achieve phase separation (final ratio 1:1:0.9, chloroform:methanol:water).
- Centrifuge to separate phases.
- Collect the lower organic layer containing lipids.
- Drying: Evaporate the organic solvent under a gentle stream of nitrogen.
- Reconstitution: Reconstitute the dried lipid extract in a suitable solvent for LC-MS injection (e.g., 2-propanol/methanol with 10 mmol/L ammonium formate).
2. Instrumental Analysis (LC-MS/MS)
- Chromatography:
- Column: Use a reversed-phase C18 column (e.g., 2.1 x 100 mm, 1.7 µm).
- Mobile Phase: A) Water with 10 mmol/L ammonium formate; B) 2-propanol/acetonitrile with 10 mmol/L ammonium formate.
- Gradient: Employ a linear gradient from 30% B to 100% B over 10-15 minutes.
- Flow Rate: 0.2-0.4 mL/min.
- Column Temperature: 40-60°C.
- Mass Spectrometry:
- Ionization: Electrospray Ionization (ESI) in positive mode.
- Detection: Multiple Reaction Monitoring (MRM) on a triple quadrupole instrument.
- Key MRM Transitions: Define specific precursor > product ion transitions for each target ceramide (e.g., Cer 18:1;O2/16:0: m/z 520.5 > 264.3) and its corresponding deuterated standard.
3. Data Processing and Quantification
- Calibration: Generate a calibration curve using authentic, non-deuterated ceramide standards of known concentration. A multi-point calibration is recommended over single-point for superior accuracy [93].
- Calculation: Calculate the concentration of each ceramide in the sample by comparing the ratio of the analyte peak area to its corresponding internal standard's peak area, and interpolating from the calibration curve.
Data Analysis and Harmonization
Inter-laboratory Comparison and LipidQC Tool
The consensus values from the NIST interlaboratory study provide a reference for data harmonization. For example, a recent ring trial focusing on four specific ceramides in SRM 1950 demonstrated that using shared, authentic standards dramatically reduced inter-laboratory variability, achieving inter-laboratory coefficients of variation (CV) of less than 14% [93]. This level of concordance is a significant achievement in the field.
To facilitate easy comparison, researchers can use tools like LipidQC, a visualization tool that provides a platform-independent means to rapidly compare experimental lipid concentrations (nmol/mL) against the NIST consensus mean value estimates for SRM 1950 [90]. LipidQC supports various lipid nomenclature styles (sum composition, fatty acid position level) and automatically sums concentrations of isobaric species for appropriate comparison.
Table 3: Example Consensus Values for Ceramides in SRM 1950 (from a 2024 Study)
| Lipid Species | Shorthand | Consensus Mean Concentration (nmol/mL) ± Uncertainty | Inter-lab CV |
|---|---|---|---|
| Cer 18:1;O2/16:0 | Cer16 | ~1.50 | < 14% |
| Cer 18:1;O2/18:0 | Cer18 | ~0.55 | < 14% |
| Cer 18:1;O2/24:0 | Cer24 | ~0.90 | < 14% |
| Cer 18:1;O2/24:1 | Cer24:1 | ~1.20 | < 14% |
NIST SRM 1950, complemented by community-derived consensus values and robust protocols, is an indispensable resource for advancing lipidomics. Its integration into the analytical workflow, from sample preparation to data analysis, provides a concrete mechanism for intra-laboratory quality control and inter-laboratory harmonization. For researchers and drug development professionals, this translates to increased confidence in data quality, which is foundational for generating reliable biological insights and validating potential clinical biomarkers. The ongoing community efforts to further characterize SRM 1950 ensure its continued role in strengthening the foundation of lipidomic science [94].
The Lipidomics Standards Initiative (LSI) is a community-wide effort established to create formal guidelines for the major lipidomic workflows, from sample collection to data reporting [95] [96]. Its primary mission is to harmonize practices across the lipidomics community, providing a common language for researchers and ensuring that data is comparable, reproducible, and of high quality. The initiative collaborates closely with established organizations like LIPID MAPS to harmonize data reporting and storage, creating a standardized framework for the entire field [95] [96]. This is particularly critical given that lipidomics is one of the fastest-growing research fields, with the number of related publications increasing by a factor of 7.7 within the last decade [50]. The LSI operates through a steering committee of leading lipidomics experts and promotes guideline development through workshops and online discussion meetings, focusing on key areas such as preanalytics and lipid extraction [96].
The need for such standardization is starkly illustrated by inter-laboratory comparisons. One study involving 30 different laboratories revealed considerable disagreement in lipid identification and quantitation when each lab followed its own protocols [97]. Another study demonstrated that even different software platforms processing identical LC-MS data can show alarmingly low identification agreement—as low as 14.0% using default settings [98]. The LSI guidelines are designed to overcome these reproducibility challenges by providing clear, community-vetted protocols for every step of the lipidomics workflow, thereby reducing variability and false discoveries.
LSI Guidelines for the Lipidomics Workflow
Sample Collection and Storage
The initial steps of sample handling are critical, as improper practices can introduce significant artefacts that compromise data quality. The LSI emphasizes that samples should be processed as quickly as possible or flash-frozen and stored at -80 °C to halt enzymatic and chemical activity [50]. Even when stored at -80 °C, storage duration should be minimized, as lipids remain prone to oxidation and hydrolysis over time [50].
Specific pre-analytical variables require careful control. For instance:
- Leaving plasma samples at room temperature can artificially increase concentrations of lipids like lysophosphatidylcholine (LPC) and lysophosphatidic acid (LPA) [50].
- Monolysocardiolipin can be generated by the hydrolysis of cardiolipin during the freezing process itself [50].
- When samples are left in methanol at temperatures above 20 °C and at pH > 6, lysophospholipid regioisomers will isomerize until they reach equilibrium [50].
For tissue samples, effective homogenization is essential to ensure lipids from all tissue regions are equally accessible. Recommended methods include shear-force-based grinding with a Potter-Elvehjem homogenizer or ULTRA-TURRAX in a solvent, or crushing liquid-nitrogen-frozen tissue with a pestle and mortar [50]. For cells, disruption can be achieved via a pebble mill with beads or a nitrogen cavitation bomb, with the latter avoiding shear stress on biomolecules [50].
Lipid Extraction Protocols
Lipid extraction serves to reduce sample complexity by removing non-lipid compounds and to enrich lipids for improved signal-to-noise ratios. The LSI recognizes several well-established liquid-liquid extraction methods.
The table below compares the most common extraction protocols:
Table 1: Comparison of Common Lipid Extraction Methods in Lipidomics
| Extraction Method | Solvent Ratio | Phase Orientation | Key Advantages | Reported Lipid Coverage |
|---|---|---|---|---|
| Folch [50] [17] | Chloroform/Methanol/Water(8:4:3 v/v/v) [17] | Organic phase (lower) | Established, high lipid recovery; good for saturated fatty acids & plasmalogens [50] [17] | Comprehensive total lipid extract [17] |
| Bligh & Dyer [50] [17] | Chloroform/Methanol/Water(1:2:0.8 v/v/v) [17] | Organic phase (lower) | Adapted for systems with high water content [50] [17] | Comprehensive total lipid extract [17] |
| MTBE [80] [50] | MTBE/Methanol/Water(e.g., 10:3:2.5 v/v/v) [80] | Organic phase (upper) | Easier pipetting; less harmful than chloroform; better for glycerophospholipids, ceramides, unsaturated FAs [80] [50] | 428 lipids identified from human plasma [80] |
| BUME [50] | Butanol/Methanol, Heptane/Ethylacetate | Organic phase (upper) | Fully automatable for high-throughput; chloroform-free [50] | Comparable to Folch [50] |
| One-Step/Precipitation [50] | Methanol, Ethanol, or 2-Propanol | Single phase | Fast, robust; higher efficiency for polar lipids (LPC, LPI, gangliosides, S1P) [50] | Enhanced for polar lipids [50] |
The LSI provides a specific, optimized protocol for MTBE-based extraction, which is widely used for its safety and performance [80]. The following is a detailed methodology suitable for application notes.
Protocol: MTBE-Based Lipid Extraction from Plasma/Serum [80]
- Materials:
- Methanol, LC-MS grade
- Methyl tert-butyl ether (MTBE), HPLC grade
- Deionized water
- Formic acid (e.g., 1M)
- Internal standards (e.g., Avanti EquiSPLASH LIPIDOMIX)
- Equipment:
- 15 mL glass tubes
- Multi-pulse vortexer (e.g., Glas-Col)
- Centrifuge
- Nitrogen evaporator
- Procedure:
- Spike and Acidify: Transfer 100 µL of plasma or serum into a 15 mL glass tube containing a dried mixture of internal standards. Resuspend the standards in 750 µL methanol. Add 20 µL of 1M formic acid and vortex the tube for 10 seconds [80].
- Extract: Add 2.5 mL of MTBE to the mixture. Mix the sample vigorously using a multi-pulse vortexer for 5 minutes [80].
- Phase Separation: Add 625 µL of deionized water to induce phase separation. Mix again with a vortexer for 3 minutes. Centrifuge the tubes at 1000 g for 5 minutes [80].
- Collect Organic Phase: The mixture will separate into two clear phases. Carefully collect the upper organic phase (MTBE layer), which contains the extracted lipids, using a pipette [80].
- Re-extract (Optional but Recommended): The lower phase can be re-extracted with an additional volume of pure MTBE or a solvent of intermediate polarity to improve the recovery of specific lipid classes. Combine the organic phases [80].
- Dry and Reconstitute: Evaporate the combined organic phases to dryness under a gentle stream of nitrogen. Reconstitute the dried lipid extract in an appropriate volume of a solvent compatible with your downstream LC-MS analysis (e.g., isopropanol/acetonitrile mixtures) [80].
LC-MS Analysis and Data Acquisition
The LSI guidelines for mass spectrometry-based analysis focus on achieving comprehensive coverage, high reproducibility, and confident lipid identification.
Chromatographic Separation: The use of reversed-phase C18 columns is common, with gradients often exceeding 15 minutes to adequately resolve isomeric species [80] [11]. High-resolution separation is critical as it adds retention time as a key dimension of selectivity for distinguishing lipids with the same exact mass [11].
Mass Spectrometry: High-resolution accurate mass (HRAM) instruments are recommended for their ability to resolve isobaric species and provide exact mass measurements [80] [11]. Data-dependent acquisition (DDA) is typically employed in untargeted workflows, where the most abundant ions in a survey MS1 scan are selected for fragmentation to generate MS/MS spectra for identification [11].
Key Performance Metrics: Adherence to LSI guidelines should yield data with high precision. A benchmark study achieved a median signal intensity relative standard deviation (RSD) of 10% across 48 technical replicates, with 394 identified lipids showing an RSD < 30% [80]. Another workflow using internal standard normalization achieved RSDs of 5-6% [86]. Monitoring these RSDs for quality control samples is a core LSI recommendation.
Data Processing, Lipid Identification, and Reporting
This is a critical area where a lack of standardization can lead to significant reproducibility issues. The LSI stresses the need for robust bioinformatic pipelines and manual curation.
The Software Reproducibility Challenge: A 2024 study highlighted a major pitfall, finding only 14.0% identification agreement between two popular software platforms (MS DIAL and Lipostar) when processing identical LC-MS data with default settings. Even when using MS/MS fragmentation data, the agreement only rose to 36.1% [98]. This underscores that software output is not infallible.
Guidelines for Confident Lipid Identification:
- Utilize MS/MS Data: Identification based solely on accurate mass is insufficient and can lead to numerous false positives. MS/MS spectra should be matched against authentic standards or curated databases like LIPID MAPS [80] [98].
- Manual Curation is Mandatory: Researchers must manually inspect MS/MS spectra, check for co-elution, and verify fragment assignments. This is the most effective way to reduce false positive identifications [98].
- Report Multiple Levels of Identification: Following metabolomics standards, lipids should be classified based on identification confidence (e.g., identified by MS/MS standard, putatively annotated by MS/MS spectrum, putatively characterized by exact mass only) [98].
- Data-Driven Quality Control: Implement additional checks, such as using support vector machine regression to identify outliers in retention time patterns, which can flag potentially false identifications [98].
The overall lipidomics workflow, integrating all LSI-guided steps from sample to analysis, is summarized in the diagram below.
Essential Research Reagent Solutions
Successful implementation of LSI guidelines relies on the use of high-quality, specific reagents and materials. The following table details key components of the lipidomics research toolkit.
Table 2: Essential Research Reagent Solutions for Lipidomics Workflows
| Category | Specific Examples | Function & Importance |
|---|---|---|
| Extraction Solvents | MTBE, Chloroform, Methanol, Butanol (all HPLC/MS grade) [80] [50] | High-purity solvents are critical for efficient lipid extraction and to prevent contamination that causes ion suppression and instrument downtime. |
| Internal Standards | Deuterated Synthetic Lipids (e.g., Avanti EquiSPLASH LIPIDOMIX) [80] [98] | Added at the beginning of extraction to monitor and correct for variations in recovery, ionization efficiency, and instrument performance; essential for precise quantification. |
| Chromatography | Reversed-phase columns (C18, C30); Ammonium formate/Formic acid additives [80] [11] | Provides separation of isomeric and isobaric lipids, reducing spectral complexity and ion suppression. Additives promote stable ionization. |
| Mass Calibration | Calibrant Solutions (vendor-specific) | Ensures high mass accuracy (< 5 ppm) for confident elemental composition assignment and lipid identification. |
| Quality Control Pools | Pooled Reference Plasma (e.g., NIST SRM 1950) [97] | A quality control sample analyzed throughout the batch to monitor system stability, performance, and reproducibility over time. |
| Lipid Libraries | LIPID MAPS, LipidBlast [98] [11] | Curated databases used to match accurate mass and MS/MS spectra for putative lipid identification. |
Adherence to the guidelines set forth by the Lipidomics Standards Initiative provides a clear and actionable path toward achieving reproducibility in lipidomics research. By standardizing protocols across the entire workflow—from stringent sample collection and storage practices, through optimized and validated extraction and LC-MS methods, to rigorously curated data processing—researchers can significantly reduce inter-laboratory variability and false discoveries. The integration of detailed protocols, robust quality control measures using internal standards and reference materials, and mandatory manual curation of software outputs forms the bedrock of reliable, high-quality lipidomics data. As the field continues to grow and its findings increasingly impact drug development and clinical diagnostics, the community-wide adoption of these LSI standards will be paramount for generating truly comparable and translatable scientific knowledge.
Lipidomics aims to identify and quantify the vast array of lipid species present in biological systems, providing insights into their functions in health and disease [57]. The cellular lipidome is extraordinarily complex, consisting of hundreds of thousands of individual lipid molecular species divided into different classes and subclasses based on their backbone structures, head groups, and aliphatic chains [57]. Accurate quantification of these species remains a significant challenge in the field, despite advances in mass spectrometry (MS) technologies, particularly electrospray ionization mass spectrometry (ESI-MS), which has revolutionized lipidomics research [57] [27].
The fundamental principle of MS quantification relies on the relationship between ion intensity and analyte concentration. However, the actual ion intensity of an analyte can be significantly affected by minor alterations in sample preparation, ionization conditions, and instrumental variations [57]. These factors cause the response factor (A) in the equation I = A × c (where I is ion intensity and c is concentration) to be variable and irreproducible, making direct quantification impractical without proper standardization [57]. This article addresses these challenges by detailing the critical roles of internal standards and response factors in achieving accurate lipid quantification.
Principles of Accurate Lipid Quantification
The Role of Internal Standards
Internal standards are analogous compounds, typically stable isotopologues of the target analytes, added at the earliest possible stage of sample preparation [57]. They serve to compensate for variations throughout the entire analytical process, including extraction efficiency, ionization suppression/enhancement, and instrument performance drift. The key advantage of internal standardization is that both the standard and endogenous analytes experience identical experimental conditions simultaneously, allowing for precise correction of analytical variations [57].
For accurate quantification, the internal standard must be absent from the biological sample or present at extremely low abundance (<< 1% of the analyte). The amount added should be carefully considered relative to the expected concentration of the target analyte to remain within a suitable dynamic range [57]. Proper selection and use of internal standards enable both relative quantification (measuring pattern changes in a lipidome) and absolute quantification (determining mass levels of individual lipid species) [57].
Limitations of External Standardization
While external standardization using calibration curves of authentic standards is theoretically possible, this approach is particularly susceptible to matrix effects and instrumental variations [57]. Sample preparation involving multiple extraction steps can lead to differential recovery, and varying matrix compositions can cause differential ionization responses between analyses. Even minor variations in spray stability during ESI-MS analysis can significantly impact ionization efficiency, making external standardization alone insufficient for comprehensive lipidome analysis [57].
Table 1: Comparison of Quantification Approaches in Lipidomics
| Aspect | External Standardization | Internal Standardization |
|---|---|---|
| Standard Addition | Analyzed separately from sample | Added directly to sample before preparation |
| Matrix Effects | Poor compensation | Excellent compensation |
| Ionization Variations | Susceptible | Corrected |
| Extraction Efficiency | Not accounted for | Accounted for |
| Practical Application | Limited for complex samples | Preferred for lipidomic workflows |
Experimental Protocols for Accurate Lipid Quantification
Internal Standard Selection and Application
The selection of appropriate internal standards is critical for accurate quantification. Ideally, internal standards should be:
- Structurally analogous to target analytes (preferably stable isotopologues)
- Added at the earliest possible stage of sample preparation (e.g., during lipid extraction)
- Present in appropriate amounts relative to expected analyte concentrations
- Non-interfering with endogenous lipid species [57]
For targeted lipid quantification, multiple internal standards representing different lipid classes may be necessary due to varying extraction efficiencies and ionization responses across lipid categories [57]. In high-throughput workflows, such as the acoustic ejection mass spectrometry (AE-MS) approach, internal standards are incorporated into the single-phase extraction system (e.g., 1-octanol and methanol with 10mM ammonium formate) to maintain sensitivity and minimize variability [9].
Lipid Extraction and Sample Preparation
The following protocol outlines a robust approach for lipid extraction suitable for accurate quantification:
Materials:
- Methyl-tert-butyl ether (MTBE) or 1-octanol/methanol mixture for single-phase extraction
- Internal standard mixture covering targeted lipid classes
- Butylated hydroxytoluene (BHT) as an antioxidant (optional)
- Ammonium formate or other modifiers for MS compatibility
Procedure:
- Add appropriate internal standard mixture to the biological sample (e.g., plasma, tissue homogenate) at the beginning of extraction.
- For liquid extraction (LE), use MTBE/methanol/water (10:3:2.5, v/v/v) or butanol/methanol (BUME) systems. Alternatively, employ single-phase extraction with 1-octanol/methanol with 10mM ammonium formate [9].
- Vortex vigorously and centrifuge to separate phases (if using biphasic systems).
- Collect the organic layer containing lipids.
- Dry under nitrogen stream and reconstitute in appropriate MS-compatible solvent.
- Analyze by direct infusion (shotgun lipidomics) or LC-MS approaches.
This protocol, when properly executed with appropriate internal standards, typically yields extraction recoveries between 89% and 95% for most lipid classes [9].
Mass Spectrometric Analysis
Two major platforms are commonly used in ESI-MS-based lipidomics:
- Direct infusion (shotgun lipidomics): Analysis performed at constant lipid concentration without chromatographic separation [57]
- LC-MS: Lipid analysis performed after chromatographic separation of lipid classes and/or species [57]
For both approaches, baseline correction is essential for accurate quantification, particularly for low-abundance species where the signal-to-noise ratio may be compromised [57]. Tandem MS analysis can significantly reduce baseline noise through double filtering, but correction remains necessary for precise quantification of minor lipid species.
Table 2: Key Internal Standards for Lipid Class Quantification
| Lipid Class | Recommended Internal Standard Type | Key Considerations |
|---|---|---|
| Phosphatidylcholines (PC) | Deuterated PC species | Cover range of fatty acid chain lengths |
| Sphingomyelins (SM) | Deuterated SM or unusual SM species | Account for differential ionization |
| Triacylglycerols (TAG) | Deuterated TAG or odd-chain TAG | Multiple species recommended for coverage |
| Ceramides | Deuterated ceramides | Structural analogs essential |
| Free Fatty Acids | Deuterated fatty acids | Chain length specificity important |
| Phosphatidylethanolamines (PE) | Deuterated PE species | Consider different headgroup responses |
Workflow Visualization
Diagram Title: Lipidomics Workflow with Critical Quantification Steps
Diagram Title: Internal Standards Correct MS Response Variability
The Scientist's Toolkit: Essential Research Reagents
Table 3: Essential Reagents for Quantitative Lipidomics
| Reagent Category | Specific Examples | Function in Quantitative Workflow |
|---|---|---|
| Stable Isotope-Labeled Internal Standards | Deuterated PC(d7), PE(d7), SM(d9), Cer(d7), TAG(d5) | Compensate for extraction losses and ionization variations; enable absolute quantification |
| Extraction Solvents | MTBE, methanol, chloroform, 1-octanol, butanol | Efficient lipid recovery with minimal degradation; 1-octanol enables single-phase extraction for high-throughput workflows |
| Mass Spectrometry Modifiers | Ammonium formate, ammonium acetate, formic acid | Enhance ionization efficiency and adduct formation consistency in ESI-MS |
| Antioxidants | Butylated hydroxytoluene (BHT) | Prevent oxidation of unsaturated lipids during extraction and storage |
| Quality Control Materials | NIST SRM 1950 (human plasma), pooled quality control (QC) samples | Monitor method performance, reproducibility, and instrument stability over time |
Advanced Methodologies and Future Directions
Recent technological advances have introduced high-throughput approaches like acoustic ejection mass spectrometry (AE-MS), which enables analysis times as short as 4 seconds per sample for targeted lipid panels and 12 seconds per sample for untargeted analysis [9]. This workflow utilizes a single-phase lipid extraction with 1-octanol and methanol with 10mM ammonium formate as a carrier solvent, demonstrating extraction recoveries between 89% and 95% for major lipid classes and signal reproducibility better than 6% for lipid class representatives [9].
For comprehensive lipid coverage, the selection of internal standards must align with the analytical scope. While a minimal set of internal standards can provide reasonable quantification for major lipid classes, more extensive standardization is necessary for detailed molecular species quantification across multiple lipid pathways [57]. Future directions in quantitative lipidomics include improved standardization strategies, enhanced high-throughput capabilities, and more integrated approaches for structural characterization alongside quantification.
Regardless of the specific methodology employed, the fundamental principle remains: accurate quantification in lipidomics relies heavily on appropriate internal standardization to account for the multiple variables affecting lipid extraction, ionization, and detection in mass spectrometry-based workflows.
Lipidomics, the large-scale study of lipid molecules, has become indispensable for understanding cellular function and disease mechanisms in biomedical research [50]. However, the field's rapid expansion has been accompanied by significant methodological diversity, creating an urgent need to assess measurement comparability and establish consensus values to ensure data quality and reproducibility [99] [100]. This case study examines the concerted efforts by the National Institute of Standards and Technology (NIST) and the broader lipidomics community to profile current methodologies, identify key challenges, and establish harmonized workflows through systematic interlaboratory comparison. The initiative represents a critical step toward developing community-accepted guidelines and protocols that will enhance the reliability of lipidomics data across research and clinical applications [99].
Community Landscape and Methodological Diversity
Laboratory Demographics and Practices
Between May and August 2017, NIST conducted a comprehensive questionnaire to profile methodological practices across the lipidomics community, receiving responses from 125 laboratories (39% response rate from 322 invitations) [99]. The survey revealed a field experiencing rapid global expansion, with 52% of respondents from the United States and the remainder distributed across multiple countries [99]. Notably, 40% of respondents were relatively new to the field (<5 years), while 60% had over five years of experience, indicating both growth and established expertise [99]. Most laboratories (74%) identified as academic entities, with primary applications in health sciences (84%), biomarker discovery (79%), and drug development (24%) [99].
Productivity metrics demonstrated the field's substantial output, with 41% of laboratories publishing more than three manuscripts annually and 64% processing between 50-500 samples monthly [99]. A significant proportion (20%) handled over 500 samples monthly, highlighting the need for robust, standardized protocols to support this scale of research [99].
Table 1: Lipidomics Laboratory Demographics from NIST Questionnaire
| Characteristic | Response Distribution | Percentage of Respondents |
|---|---|---|
| Experience in Field | <5 years | 40% |
| >5 years | 60% | |
| Laboratory Size | >5 personnel | 70% |
| >10 personnel | 34% | |
| Primary Affiliation | Academic | 74% |
| Key Applications | Clinical/Medical Science | 84% |
| Biomarker Discovery | 79% | |
| Drug Development | 24% | |
| Monthly Sample Throughput | 50-500 samples | 64% |
| >500 samples | 20% |
Methodological Diversity in Lipidomics Workflows
The NIST questionnaire highlighted extensive diversity in all aspects of lipidomics workflows, from sample preparation to data analysis [99]. This variability presents significant challenges for comparing results across studies and laboratories. The most commonly analyzed lipid categories were sphingolipids (86%), glycerophospholipids (85%), glycerolipids (80%), fatty acyl lipids (79%), and sterol lipids (62%) [99]. Lesser-studied categories included saccharolipids (14%), prenol lipids (10%), and polyketides (3%) [99].
Researchers employed diverse sample matrices, with plasma (87%), tissues (86%), cells (86%), and serum (75%) being most common [99]. Additional matrices included urine (35%), feces (26%), plant material (24%), and various other biofluids [99]. This matrix diversity necessitates customized approaches but complicates direct comparison of results.
Table 2: Common Lipid Categories and Sample Matrices in Lipidomics Research
| Lipid Category | Analysis Frequency | Representative Molecules | Biological Significance |
|---|---|---|---|
| Sphingolipids | 86% | Ceramides, Sphingosine-1-phosphate | Apoptosis regulation, cell signaling |
| Glycerophospholipids | 85% | Phosphatidylcholine, Phosphatidylserine | Cell membrane structure, apoptosis |
| Glycerolipids | 80% | Triglycerides, Diacylglycerols | Energy storage, signaling pathways |
| Fatty Acyls | 79% | Arachidonic acid, Linoleic acid | Energy metabolism, inflammatory signaling |
| Sterol Lipids | 62% | Cholesterol, Ergosterol | Membrane fluidity, hormone synthesis |
| Common Sample Matrices | Usage Frequency | Key Considerations | |
| Plasma | 87% | Standardized collection essential | |
| Tissues | 86% | Homogenization critical for reproducibility | |
| Cells | 86% | Disruption methods affect lipid profiles | |
| Serum | 75% | Clotting time influences lipid composition |
Experimental Design and Protocol for Interlaboratory Studies
Harmonization Workflow Framework
The NIST study implemented a systematic approach to harmonization based on established principles: (1) instilling community awareness of the need for harmonization, (2) defining areas of the lipidomics workflow requiring harmonization, and (3) engaging the community with activities focused on ameliorating harmonization issues [99]. Continuous communication with the community throughout the process was essential to ensure acceptance and implementation of recommendations [99].
Sample Preparation Protocols
Proper sample preparation is critical for reproducible lipidomics results. Sample processing must begin immediately after collection, as enzymatic and chemical processes can rapidly alter lipid profiles [50]. Key considerations include:
Sample Homogenization: For tissues, shear-force-based grinding (Potter-Elvehjem homogenizer, ULTRA-TURRAX) in solvent or crushing of liquid-nitrogen-frozen tissue using pestle and mortar are recommended [50]. Cells can be disrupted using pebble mills with beads or nitrogen cavitation bombs [50]. Consistent homogenization ensures equal lipid accessibility from all tissue regions.
Liquid-Liquid Extraction: The most widely used extraction methods include:
- Folch and Bligh & Dyer protocols: Utilize ternary mixtures of chloroform, methanol, and water [50]. For anionic lipids (PA, LPA, PI, S1P), adding acid improves extraction efficiency but requires strict control of concentration and time to prevent hydrolysis artifacts [50].
- MTBE method: Uses methyl tert-butyl ether instead of chloroform, with comparable efficiency but easier handling and reduced toxicity [50]. Recent comparisons show MTBE is more efficient for glycerophospholipids, ceramides, and unsaturated fatty acids, while chloroform excels for saturated fatty acids and plasmalogens [50].
- BUME method: A fully automated protocol using butanol/methanol and heptane/ethyl acetate in 96-well plates, avoiding hazardous chloroform while maintaining efficiency [50].
Single-Cell Lipidomics: Advanced techniques enable lipid analysis at single-cell resolution using capillary sampling or microfluidics coupled with LC-MS [101]. Cells are manually selected under microscope observation and sampled into capillaries, followed by immediate freezing and transfer to MS vials with lysis solvent [101].
LC-MS Analysis Platforms
Liquid chromatography-mass spectrometry (LC-MS) serves as the cornerstone technology for lipidomics due to its sensitivity and specificity [50]. The NIST questionnaire revealed diverse instrumental configurations across laboratories. Recent advances have enabled single-cell lipidomics using various LC-MS platforms:
Platform Configurations:
- Analytical flow with MS1 acquisition: Provides comprehensive lipid profiling without MS/MS fragmentation [101].
- Microflow with DDA and electron-activated dissociation: Enhances identification confidence through advanced fragmentation [101].
- Nanoflow with polarity switching: Improves coverage of lipid classes with different ionization preferences [101].
- Nanoflow with ion mobility and MS2: Adds separation dimension for isomer distinction and reduces spectral complexity [101].
Methodological Enhancements: Polarity switching, ion mobility spectrometry, and electron-activated dissociation significantly improve lipidome coverage and identification confidence [101]. These technologies help address challenges posed by the high dynamic range and structural complexity of cellular lipids, particularly at single-cell level [101].
Key Findings and Community Challenges
Perceived Challenges in Lipidomics
The NIST questionnaire identified the top five challenges perceived by the lipidomics community, highlighting critical areas requiring harmonization efforts [99] [100]:
- Lack of standardization amongst methods/protocols - The extensive methodological diversity across laboratories complicates data comparison and integration.
- Lack of lipid standards - Limited availability of reference materials for various lipid classes hampers accurate quantification.
- Software/data handling and quantification - Inconsistent data processing algorithms and software platforms generate variability in results.
- Over-reporting/false positives - Insufficient validation leads to reporting of artifactual or misidentified lipids.
- Quantitation accuracy - Variable approaches to calibration and normalization affect measurement reliability.
These challenges underscore the need for community-wide standards and reference materials to improve data quality and comparability.
Quality Assurance and Data Processing
Recent advances in data processing aim to address challenges in lipidomics quantification. Modular, interoperable workflows in R and Python provide flexible solutions for statistical processing and visualization [10]. Key components include:
Batch Correction and Normalization: Implementation of LOESS (Locally Estimated Scatterplot Smoothing) and SERRF (Systematic Error Removal using Random Forest) algorithms correct for technical variability [10]. Standards-based normalization accounts for analytical response factors and sample preparation variability [10].
Missing Data Management: Rather than applying imputation blindly, researchers should investigate underlying causes of missingness (missing completely at random, at random, or not at random) and address them appropriately [10].
Advanced Visualization: Tools like lipid maps, fatty acyl-chain plots, violin plots, and dendrogram-heatmap combinations reveal patterns within lipid classes and sample groups [10]. These visualizations support quality control and biological interpretation.
Consensus Building and Standardization Initiatives
Research Reagent Solutions
Standardized reagents and materials are essential for achieving comparable results across laboratories. The following table outlines key research reagents and their functions in lipidomics workflows:
Table 3: Essential Research Reagents for Lipidomics Studies
| Reagent/Material | Function | Application Notes |
|---|---|---|
| Internal Standards | Correction for extraction efficiency and ionization variability | Isotopically-labeled lipid analogs; should cover major lipid classes [102] |
| Reference Materials | Method validation and quality control | NIST SRM 1950 provides benchmark values for human plasma [99] |
| Extraction Solvents | Lipid isolation and purification | Chloroform, MTBE, or butanol/methanol systems; choice affects lipid recovery [50] |
| Quality Control Pools | Monitoring analytical performance | Pooled representative samples analyzed throughout sequence [10] |
| Chromatography Standards | System suitability testing | Assess retention time stability and MS response [10] |
| Ion Mobility Calibrants | Collision cross-section measurement | Enable structural characterization and isomer separation [101] |
Community Initiatives and Future Directions
Several community initiatives are addressing lipidomics standardization. The Lipidomics Standards Initiative (LSI) and Metabolomics Society provide guidelines for experimental design, data acquisition, and reporting [10]. The LIPID MAPS consortium has established comprehensive lipid classification and databases containing over 40,000 unique lipid structures [102].
Future directions include:
- Advanced Technologies: Integration of ion mobility, electron-activated dissociation, and artificial intelligence for improved lipid identification [101] [10].
- Miniaturized Platforms: Development of high-throughput microsampling and nano-LC systems for limited samples [8] [101].
- Data Standardization: Implementation of FAIR (Findable, Accessible, Interoperable, Reusable) principles through open-source tools and standardized formats [10].
- Clinical Translation: Addressing barriers to routine clinical integration, including inter-laboratory variability and validation requirements [103].
This case study demonstrates that while lipidomics encompasses diverse methodologies and applications, strategic interlaboratory comparisons provide a pathway toward community-wide consensus values. The NIST initiative and complementary technological advances establish a foundation for harmonized practices across the lipidomics workflow. Continued community engagement, standardized reagents, transparent data processing, and advanced instrumentation will enhance measurement comparability and data quality. These efforts support the growing role of lipidomics in basic research, clinical applications, and therapeutic development, ultimately strengthening the reliability and interpretability of lipid measurements across the scientific community.
Lipidomics, a rapidly growing branch of systems biology, has emerged as a powerful tool for in-depth examination of lipid species and their dynamic changes in both healthy and diseased states [65]. This field provides critical insights into lipid metabolism, signal transduction pathways, and intercellular communication through qualitative and quantitative analyses of lipid profiles in patients [3]. As lipids are increasingly recognized as bioactive molecules that regulate inflammation, metabolic homeostasis, and cellular signaling, lipidomics offers tremendous potential for identifying novel biomarkers across a diverse range of clinical diseases and disorders [65]. The technological progress in lipidomics, particularly advancements in high-resolution mass spectrometry, has greatly advanced our comprehension of lipid metabolism and biochemical mechanisms in human diseases while offering new technical pathways for identifying potential biomarkers and therapeutic targets [3].
The transition of lipidomics from a research tool to clinical applications represents a revolutionary approach that bridges fundamental lipid research with clinical applications [65]. This application note details standardized protocols and applications of lipidomics within pharmaceutical development and clinical biomarker discovery, providing researchers with practical methodologies to advance their translational research programs. By framing this content within the broader context of lipidomic workflow from sample collection to data analysis, we aim to support the integration of lipidomics into routine clinical practice and drug development pipelines.
Regulatory Framework for Biomarker Validation
Biomarker Categories and Context of Use
The validation of biomarkers for regulatory purposes requires a clear understanding of their intended application. The FDA defines a biomarker's Context of Use (COU) as a concise description of the biomarker's specified use in drug development, which includes the BEST (Biomarkers, EndpointS, and other Tools) biomarker category and the biomarker's intended use [104]. The fit-for-purpose validation approach recognizes that the level of evidence needed to support biomarker use depends on its specific COU and application [104].
Table 1: Biomarker Categories and Their Applications in Drug Development
| Biomarker Category | Primary Use in Drug Development | Exemplary Lipid Biomarkers |
|---|---|---|
| Diagnostic | Identify presence or subtype of a disease | Plasma gangliosides (GD2, GD3) for ovarian cancer detection [105] |
| Prognostic | Identify likelihood of disease recurrence or progression | Altered phospholipids in polycystic ovary syndrome [3] |
| Predictive | Identify responders to specific therapies | Sphingolipid profiles for immunotherapy response prediction [65] |
| Pharmacodynamic/Response | Monitor biological response to therapeutic intervention | Phosphatidylcholine changes after metabolic therapy [65] |
| Safety | Monitor potential adverse drug effects | Specific phospholipid patterns for drug-induced liver injury [104] |
| Susceptibility/Risk | Identify individuals with increased disease risk | Lipid signatures for metabolic syndrome progression [65] |
Biomarker Validation Pathways
Regulatory acceptance of biomarkers follows structured pathways that emphasize early engagement and fit-for-purpose validation. The FDA's Biomarker Qualification Program (BQP) provides a framework for regulatory acceptance of biomarkers across multiple drug development programs, involving three stages: Letter of Intent, Qualification Plan, and Full Qualification Package [104]. Alternatively, drug developers can engage with the FDA through the Investigational New Drug (IND) application process to pursue clinical validation within specific drug development programs [104]. The 2025 FDA Biomarker Guidance emphasizes that although validation parameters for biomarker assays are similar to those for drug concentration assays (accuracy, precision, sensitivity, selectivity, parallelism, range, reproducibility, and stability), the technical approaches must be adapted to demonstrate suitability for measuring endogenous analytes [106] [107].
Lipidomics Workflow: From Sample to Insight
Experimental Design and Sample Preparation
Proper experimental design and sample preparation are critical for generating reliable lipidomics data. For plasma/serum samples, protocols must be optimized for minimal volume requirements while maintaining comprehensive lipid coverage. Recent advancements demonstrate that nanoflow liquid chromatography (nanoLC) coupled with trapped ion mobility spectrometry and time-of-flight mass spectrometry (TIMS-TOF) enables comprehensive lipid profiling from as little as 1 μL of plasma [108]. Two single-phase extraction protocols have been successfully scaled to microsample volumes: methanol-methyl tert-butyl ether (MeOH:MTBE) and isopropanol-water (IPA:H₂O) extraction methods [108]. Sample exclusion criteria should include: subjects with >2 freeze-thaw cycles, obvious hemolysis or particulates, current cancer diagnosis other than the disease of interest, previous diagnosis of the disease being studied, and pregnancy at time of sample collection [105].
Analytical Platform Selection
Mass spectrometry-based lipidomics can be categorized into three primary analytical approaches, each with distinct advantages and applications:
Untargeted Lipidomics provides comprehensive, unbiased analysis of the lipidome using high-resolution mass spectrometry (HRMS) platforms such as Quadrupole Time-of-Flight (Q-TOF), Orbitrap, and Fourier transform ion cyclotron resonance MS [3]. This approach is particularly suitable for discovering novel lipid biomarkers and uses data acquisition modes including data-dependent acquisition (DDA), information-dependent acquisition (IDA), and data-independent acquisition (DIA) [3].
Targeted Lipidomics enables precise identification and quantification of specific lipid molecules with higher accuracy and sensitivity, typically using multiple reaction monitoring (MRM) or parallel reaction monitoring on platforms such as ultra-performance liquid chromatography-triple quadrupole mass spectrometry (UPLC-QQQ MS) [3]. This approach is ideal for validating potential biomarkers initially identified through untargeted screening.
Pseudo-targeted Lipidomics combines the advantages of both targeted and untargeted approaches, using information from untargeted methods to guide targeted data acquisition for high coverage while maintaining quantitative accuracy [3]. This strategy is particularly valuable for studying metabolic characteristics in complex diseases.
Table 2: Comparison of Lipidomics Analytical Approaches
| Parameter | Untargeted Lipidomics | Targeted Lipidomics | Pseudo-targeted Lipidomics |
|---|---|---|---|
| Primary Objective | Comprehensive lipid discovery | Precise quantification of predefined lipids | High-coverage quantification |
| Analytical Platform | HRMS (Q-TOF, Orbitrap) | UPLC-QQQ MS | HRMS with targeted acquisition |
| Data Acquisition | DDA, DIA, IDA | MRM, PRM | Targeted based on untargeted discovery |
| Coverage | Broad (hundreds to thousands of lipids) | Narrow (dozens to hundreds of lipids) | Intermediate to broad |
| Quantitative Rigor | Semi-quantitative | Highly quantitative | Quantitative |
| Ideal Application | Novel biomarker discovery | Biomarker validation, clinical assays | Complex disease mechanisms |
| Throughput | Moderate | High | Moderate to high |
Application Note: Early-Stage Ovarian Cancer Detection
Protocol: Serum Lipidomics for Cancer Biomarker Discovery
Background: Ovarian cancer is the fifth leading cause of cancer-related deaths among women, with most patients diagnosed at late stage (III/IV), resulting in a 5-year survival rate below 30% [105]. This protocol describes a lipidomics approach for early detection of ovarian cancer in symptomatic populations.
Sample Cohort Design:
- Cohort inclusion: Women presenting with vague abdominal symptoms (VAS), including those with benign adnexal masses, early- and late-stage ovarian cancer, gastrointestinal disorders, and otherwise healthy women seeking care for symptoms [105].
- Sample size: Two independent cohorts (N = 433 and N = 399) designed to reflect the symptomatic population [105].
- Sample processing: Collect serum samples prospectively before surgical intervention or treatment. Exclude samples with >2 freeze-thaw cycles, obvious hemolysis, or particulates [105].
Lipidomics Analysis:
- Lipid extraction: Use single-phase extraction with methanol-methyl tert-butyl ether (MeOH:MTBE) or isopropanol-water (IPA:Hâ‚‚O) scaled for low sample volumes [108].
- LC-MS analysis: Employ untargeted ultrahigh pressure liquid chromatography-mass spectrometry (UHPLC-MS) with chromatographic separation optimized using 2-10 mM NHâ‚„HCOâ‚‚ mobile phase buffer [108].
- Quality control: Include pooled quality control samples and standard reference materials (NIST SRM 1950) to monitor analytical performance [108].
Data Integration and Modeling:
- Protein biomarkers: Quantify established protein biomarkers including cancer antigen 125 (CA125), human epididymis protein 4 (HE4), β-2 folate receptor α, and mucin 1 [105].
- Machine learning: Develop models using lipid and protein features, with training on one cohort and independent validation on the second cohort [105].
- Performance assessment: Evaluate models using area under the curve (AUC) with 95% confidence intervals for distinguishing ovarian cancer from controls and early-stage ovarian cancer from controls [105].
Results and Clinical Validation
The proof-of-concept multiomic model combining lipidomics and protein biomarkers achieved AUCs of 92% (95% CI: 87%-95%) for distinguishing ovarian cancer from controls and 88% (95% CI: 83%-93%) for distinguishing early-stage ovarian cancer from controls in validation testing [105]. This demonstrates the clinical utility and robustness of lipids as diagnostic biomarkers for early ovarian cancer within the clinically complex symptomatic population, particularly when applied in a multiomic approach [105].
Bioinformatics and Data Analysis Tools
Table 3: Essential Lipidomics Software and Databases
| Tool Name | Functionality | Application in Workflow | Access |
|---|---|---|---|
| LIPID MAPS | Comprehensive lipid database with >40,000 lipids; provides classification, structures, pathways [109] [110] | Lipid identification, classification, pathway analysis | Web-based, public |
| BioPAN | Pathway analysis from lipidomics datasets; explores changes in lipid pathways at different levels [109] | Biological interpretation, pathway enrichment | Web-based, public |
| LipidFinder | Distinguishes lipid-like features from contaminants in LC-MS datasets; optimized analysis based on user data [109] [110] | Data processing, peak filtering, statistical analysis | Standalone, public |
| LipidCreator | Creates targeted MS assays; supports lipid categories, integrates with Skyline [61] | Targeted method development, assay design | Standalone, public |
| LipidXplorer | Identifies lipids from shotgun and LC-MS data; uses molecular fragmentation query language [61] | Lipid identification, data processing | Standalone, public |
| LipidSpace | Compares lipidomes by assessing structural differences; graph-based comparison [61] | Data analysis, quality control, lipidome comparison | Standalone, public |
| Goslin | Standardizes lipid nomenclature; converts different lipid names to LIPID MAPS shorthand [61] | Data standardization, nomenclature normalization | Web-based/standalone |
Regulatory Pathway for Biomarker Acceptance
Challenges and Future Perspectives
Despite significant advancements, the routine integration of lipidomics into clinical practice faces several challenges, including inter-laboratory variability, data standardization, lack of defined procedures, and insufficient clinical validation [65]. The field must address these limitations through standardized reporting checklists, such as the Lipidomics Minimal Reporting Checklist, which provides guidelines for transparent, reliable, and reproducible data reporting [61].
Future developments in lipidomics will likely focus on enhanced integration with other omics technologies, artificial intelligence-driven data analysis, and the establishment of standardized protocols for clinical validation [110]. The continued qualification of lipid biomarkers through regulatory pathways such as the FDA's Biomarker Qualification Program will be essential for translating lipidomics discoveries into clinical practice and drug development [104].
As lipidomics technologies evolve toward higher sensitivity and throughput, and as bioinformatics tools become more sophisticated, lipidomics is poised to become an indispensable tool in precision medicine, enabling improved disease diagnosis, prognosis monitoring, and development of targeted therapeutic strategies [3].
Conclusion
A robust lipidomics workflow, integrating meticulous sample preparation, advanced mass spectrometry, and sophisticated data analysis, is paramount for generating high-quality, biologically meaningful data. The field is moving towards greater standardization and reproducibility, guided by initiatives like the Lipidomics Standards Initiative and the use of shared reference materials. Future directions are poised to be revolutionized by the deeper integration of artificial intelligence and machine learning for automated annotation, enhanced biomarker discovery, and the development of novel lipid-based therapeutics, ultimately strengthening the role of lipidomics in precision medicine and personalized healthcare.
References
- 1. Lipids in Cellular Function and Disease | Keystone Symposia [https://www.keystonesymposia.org/conferences/conference-listing/meeting/d12025]
- 2. Lipids in health and disease [https://www.asbmb.org/annual-meeting/program/lipids]
- 3. The strategic role of lipidomics in biomarker identification and ... [https://pmc.ncbi.nlm.nih.gov/articles/PMC12483926/]
- 4. Special Issue : The Role of Lipids in Health and Diseases [https://www.mdpi.com/journal/ijms/special_issues/G249C0W13V]
- 5. Up-to-Date Look at Lipids Role in Precision Health (2025) [https://www.laboratoriosrubio.com/en/lipidomics-precision-health/]
- 6. Dynamic lipidome alterations associated with human ... [https://www.nature.com/articles/s42255-023-00880-1]
- 7. Single-cell lipidomics: protocol development for reliable ... [https://pubs.rsc.org/en/content/articlehtml/2025/an/d5an00037h]
- 8. Deep insights into microsampling technologies for global ... [https://www.sciencedirect.com/science/article/pii/S0026265X25011142]
- 9. LipiSonics: An Enhanced High-Throughput Lipidomics ... [https://chemrxiv.org/engage/chemrxiv/article-details/6893a845728bf9025e394df6]
- 10. Streamlining Lipidomics: Novel Statistical Workflows and ... [https://www.chromatographyonline.com/view/streamlining-lipidomics-novel-statistical-workflows-and-visualization-in-r-and-python]
- 11. Lipidomics Workflows [https://www.thermofisher.com/us/en/home/industrial/mass-spectrometry/mass-spectrometry-learning-center/mass-spectrometry-applications-area/metabolomics-mass-spectrometry/lipidomics-workflows.html]
- 12. Lipidomics from sample preparation to data analysis [https://link.springer.com/article/10.1007/s00216-019-02241-y]
- 13. Lipidomics: Techniques, applications, and outcomes ... [https://pmc.ncbi.nlm.nih.gov/articles/PMC5085849/]
- 14. A Robust Lipidomics Workflow for Mammalian Cells ... [https://pmc.ncbi.nlm.nih.gov/articles/PMC6170197/]
- 15. Glial Biologist's Guide to Mass Spectrometryâ€Based Lipidomics [https://pmc.ncbi.nlm.nih.gov/articles/PMC11784846/]
- 16. Lipidomics Sample Preparation FAQ [https://www.metwarebio.com/lipidomics-sample-preparation-faq/]
- 17. Sample Processing Methods for Lipidomics Research [https://lipidomics.creative-proteomics.com/resource/sample-preparation-techniques-in-lipidomics-analysis.htm]
- 18. Best practices and tools in R and Python for statistical ... [https://www.nature.com/articles/s41467-025-63751-1]
- 19. FAQ - LipidSig 2.0 [https://lipidsig.bioinfomics.org/FAQ/]
- 20. Recommendations for good practice in MS-based lipidomics [https://pmc.ncbi.nlm.nih.gov/articles/PMC8585648/]
- 21. A Review of Efforts to Improve Lipid Stability during Sample ... [https://pmc.ncbi.nlm.nih.gov/articles/PMC7725844/]
- 22. Accurate Lipid Quantification of Tissue Homogenates ... [https://pmc.ncbi.nlm.nih.gov/articles/PMC8228350/]
- 23. Exploring Sample Storage Conditions for the Mass ... [https://pmc.ncbi.nlm.nih.gov/articles/PMC12024923/]
- 24. A Review of Efforts to Improve Lipid Stability during Sample ... [https://www.nist.gov/publications/review-efforts-improve-lipid-stability-during-sample-preparation-and-standardization]
- 25. Towards sustainable lipidomics: computational screening and ... [https://pmc.ncbi.nlm.nih.gov/articles/PMC12596327/]
- 26. Ultrahigh-Performance Liquid Chromatography–Mass ... [https://www.spectroscopyonline.com/view/ultrahigh-performance-liquid-chromatography-mass-spectrometry-lipidomics]
- 27. Glial Biologist's Guide to Mass Spectrometry-Based Lipidomics [https://pubmed.ncbi.nlm.nih.gov/39751169/]
- 28. Advances in Lipid Extraction Methods—A Review [https://www.mdpi.com/1422-0067/22/24/13643]
- 29. Lipid Extraction [https://bio-protocol.org/exchange/minidetail?id=10392342&type=30]
- 30. Lipids in microalgae: The Extraction by modified Folch ... [https://www.protocols.io/view/lipids-in-microalgae-the-extraction-by-modified-fo-dm6gpr9jdvzp/v1]
- 31. Liquid samples (bligh and dyer) - Cyberlipid - gerli [http://cyberlipid.gerli.com/techniques-of-analysis/extraction-handling-of-extracts/liquid-samples-bligh-dyer/]
- 32. Lipid extraction by methyl-tert-butyl ether for high ... [https://www.sciencedirect.com/science/article/pii/S002222752042601X]
- 33. Lipid Extraction for Mass Spectrometry Lipidomics [https://www.protocols.io/view/lipid-extraction-for-mass-spectrometry-lipidomics-d5m6849e.html]
- 34. MTBE Lipid Extraction - Protocol - OneLab [https://onelab.andrewalliance.com/library/mtbe-lipid-extraction-Zo0j8wAO]
- 35. Lipid Extraction [https://bio-protocol.org/exchange/minidetail?id=18722437&type=30]
- 36. Critical overview of mass spectrometry-based lipidomics ... [https://pmc.ncbi.nlm.nih.gov/articles/PMC11833014/]
- 37. Top 6 Ion Sources in Mass Spectrometry: EI, CI, ESI, APCI, ... [https://www.metwarebio.com/top-6-ion-sources-mass-spectrometry/]
- 38. Enhancing Lipidomics With High-Resolution Ion Mobility ... [https://pmc.ncbi.nlm.nih.gov/articles/PMC12445972/]
- 39. The application of desorption electrospray ionization mass ... [https://www.sciencedirect.com/science/article/abs/pii/S0039914025011014]
- 40. Highlight of Recent Advances and Applications of MALDI ... [https://pmc.ncbi.nlm.nih.gov/articles/PMC12065102/]
- 41. Comparison of electrospray ionization-lithium adduct ... [https://www.sciencedirect.com/science/article/abs/pii/S0021967325004066]
- 42. LC-ESI-HRMS — lipidomics of phospholipids [https://link.springer.com/article/10.1007/s00216-023-05080-0]
- 43. Subcellular mass spectrometry imaging of lipids and ... [https://www.nature.com/articles/s41467-025-64604-7]
- 44. Shotgun Lipidomics [https://www.aocs.org/resource/shotgun-lipidomics/]
- 45. Strategies to improve/eliminate the limitations in shotgun ... [https://pmc.ncbi.nlm.nih.gov/articles/PMC7394605/]
- 46. Single-cell lipidomics: performance evaluation across four ... [https://pmc.ncbi.nlm.nih.gov/articles/PMC12462284/]
- 47. Clinical lipidomics reveals high individuality and sex ... [https://pmc.ncbi.nlm.nih.gov/articles/PMC12022646/]
- 48. Data analysis of MS-based clinical lipidomics studies with ... [https://pmc.ncbi.nlm.nih.gov/articles/PMC8620525/]
- 49. Shotgun Lipidomics Approach for Clinical Samples [https://lifs-tools.org/publications/shotgun-lipidomics-approach-for-clinical-samples.html]
- 50. Lipidomics from sample preparation to data analysis [https://pmc.ncbi.nlm.nih.gov/articles/PMC7118050/]
- 51. Rational selection of reverse phase columns for high ... [https://pubmed.ncbi.nlm.nih.gov/30940444/]
- 52. Lipidomics by ultrahigh performance liquid ... [https://pmc.ncbi.nlm.nih.gov/articles/PMC6013032/]
- 53. Optimization of Mobile Phase Modifiers for Fast LC-MS ... [https://pmc.ncbi.nlm.nih.gov/articles/PMC9916776/]
- 54. Evaluation of separation performance and quantification ... [https://pubmed.ncbi.nlm.nih.gov/40609317/]
- 55. MULTI-DIMENSIONAL MASS SPECTROMETRY-BASED ... [https://pmc.ncbi.nlm.nih.gov/articles/PMC3259006/]
- 56. Benzoyl chloride derivatization improves selectivity and ... [https://link.springer.com/article/10.1007/s00216-025-06151-0]
- 57. Selection of internal standards for accurate quantification of ... [https://pmc.ncbi.nlm.nih.gov/articles/PMC4947032/]
- 58. Lipid Quant 2.1: Open-source software for identification ... [https://www.sciencedirect.com/science/article/pii/S0169743924001096]
- 59. Lipid Peak Finding, Identification, and Quantitation [https://bio-protocol.org/exchange/minidetail?id=18750271&type=30]
- 60. GNPS - Analyze, Connect, and Network with your Mass ... [https://gnps.ucsd.edu/]
- 61. Home - LIFS Tools web portal [https://lifs-tools.org/]
- 62. Mass Spectrometry Data Analysis | Genedata Expressionist [https://www.genedata.com/platform/expressionist]
- 63. Mass Spectrometry Software Updates [https://www.bruker.com/en/products-and-solutions/mass-spectrometry/ms-software/mass-spectrometry-software-updates.html]
- 64. The strategic role of lipidomics in biomarker identification ... [https://www.frontiersin.org/journals/endocrinology/articles/10.3389/fendo.2025.1546512/full]
- 65. Exploring lipidomics in biomarker discovery [https://www.sciencedirect.com/science/article/pii/S0009898125005777?dgcid=rss_sd_all]
- 66. Exploring lipidomics in biomarker discovery [https://www.sciencedirect.com/science/article/abs/pii/S0009898125005777]
- 67. Leveraging ML for profiling lipidomic alterations in breast ... [https://www.nature.com/articles/s41598-024-71439-7]
- 68. Combining lipidomics and machine learning to identify lipid ... [https://pmc.ncbi.nlm.nih.gov/articles/PMC12128965/]
- 69. Combining lipidomics and machine learning to identify lipid ... [https://pubmed.ncbi.nlm.nih.gov/40337862/]
- 70. Computationally unmasking each fatty acyl C=C position in ... [https://pmc.ncbi.nlm.nih.gov/articles/PMC12340080/]
- 71. From bedside to bench—practical considerations to avoid pre ... [https://pmc.ncbi.nlm.nih.gov/articles/PMC8410705/]
- 72. LiLA: lipid lung-based ATLAS built through a ... [https://www.nature.com/articles/s42003-023-05680-7]
- 73. Introduction of a lipidomics scoring system for data quality ... [https://pmc.ncbi.nlm.nih.gov/articles/PMC12345285/]
- 74. Recommendations for sample selection, collection and ... [https://link.springer.com/article/10.1007/s11306-025-02259-7]
- 75. Critical Factors in Sample Collection and Preparation for ... [https://www.mdpi.com/2218-1989/14/1/36]
- 76. Lipidomics data analysis: Imputation [https://www.lipotype.com/lipidomics-applications/lipidomics-data-analysis-imputation/?srsltid=AfmBOorBQ1sAXKwQSnuw6AjIxHgVeWjtW2SkzP0Q4Od09xvDtvOFW6V9]
- 77. Imputation of missing values in lipidomic datasets [https://pubmed.ncbi.nlm.nih.gov/38602226/]
- 78. Challenges in Lipidomics Biomarker Identification [https://pmc.ncbi.nlm.nih.gov/articles/PMC11356033/]
- 79. Systematic Error Removal Using Random Forest for ... [https://pmc.ncbi.nlm.nih.gov/articles/PMC9652764/]
- 80. A Comprehensive and Reproducible Untargeted Lipidomic ... [https://pmc.ncbi.nlm.nih.gov/articles/PMC6572761/]
- 81. Batch effect corrections in R (advanced) [https://laboratory-of-lipid-metabolism-a.gitbook.io/omics-data-visualization-in-r-and-python/data-transformation-scaling-and-normalization-in-r/batch-effect-corrections-in-r-advanced]
- 82. SERRF - GitHub Pages [https://slfan2013.github.io/SERRF-online/]
- 83. High-performance liquid chromatography [https://en.wikipedia.org/wiki/High-performance_liquid_chromatography]
- 84. Standardizing Statistical Tools for “Omics': Best Practices ... [https://www.chromatographyonline.com/view/standardizing-statistical-tools-for-omics-best-practices-using-r-and-python]
- 85. ADViSELipidomics: a workflow for analyzing lipidomics data [https://pmc.ncbi.nlm.nih.gov/articles/PMC9750127/]
- 86. Rapid and reproducible LC-HRMS for combined lipidomics ... [https://www.sciencedirect.com/science/article/pii/S0026265X25032254]
- 87. Best practices and tools in R and Python for statistical ... [https://pmc.ncbi.nlm.nih.gov/articles/PMC12485147/]
- 88. Update on LIPID MAPS classification, nomenclature, and ... [https://pmc.ncbi.nlm.nih.gov/articles/PMC7707175/]
- 89. The Neurolipid Atlas: a lipidomics resource for ... [https://www.nature.com/articles/s42255-025-01365-z]
- 90. LipidQC: Method Validation Tool for Visual Comparison ... [https://pmc.ncbi.nlm.nih.gov/articles/PMC11493136/]
- 91. NIST interlaboratory comparison exercise for lipidomics using ... [https://pmc.ncbi.nlm.nih.gov/articles/PMC5711491/]
- 92. Harmonizing lipidomics: NIST interlaboratory comparison ... [https://www.sciencedirect.com/science/article/pii/S0022227520335549]
- 93. Concordant inter-laboratory derived concentrations of ... [https://www.nature.com/articles/s41467-024-52087-x]
- 94. NIST SRM 1950: beyond the Certificate of Analysis [https://www.mqacc.org/srm1950]
- 95. Lipidomics Standard Initiative [https://lipidomicstandards.org/]
- 96. Lipidomics Standards Initiative (LSI) [https://lipidomicssociety.org/interest_groups/lipidomics-standards-initiative-lsi/]
- 97. Harmonizing lipidomics [https://www.asbmb.org/asbmb-today/science/050119/harmonizing-lipidomics]
- 98. Challenges in Lipidomics Biomarker Identification [https://www.mdpi.com/2218-1989/14/8/461]
- 99. NIST lipidomics workflow questionnaire: an assessment of ... [https://pmc.ncbi.nlm.nih.gov/articles/PMC11493135/]
- 100. NIST Lipidomics Workflow Questionnaire: An Assessment ... [https://www.nist.gov/publications/nist-lipidomics-workflow-questionnaire-assessment-community-wide-methodologies-and]
- 101. Single-cell lipidomics: performance evaluation across four ... [https://pubs.rsc.org/en/content/articlehtml/2025/an/d5an00851d]
- 102. Unveiling Lipidomics Quantitative Analysis: What, Why, ... [https://dmpkservice.wuxiapptec.com/articles/479-unveiling-lipidomics-quantitative-analysis-what-why-and-how/]
- 103. Exploring lipidomics in biomarker discovery [https://pubmed.ncbi.nlm.nih.gov/41197707/]
- 104. Use of Biomarkers in Drug Development for Regulatory ... [https://pmc.ncbi.nlm.nih.gov/articles/PMC12489174/]
- 105. Utilizing Serum-Derived Lipidomics with Protein ... [https://pmc.ncbi.nlm.nih.gov/articles/PMC12409608/]
- 106. The 2025 FDA Biomarker Guidance: Understanding ... [https://www.linkedin.com/pulse/2025-fda-biomarker-guidance-understanding-lxoke]
- 107. FDA Guidance for Industry on Bioanalytical Method ... [https://labs.iqvia.com/blog/fda-guidance-bioanalytical-method-validation-biomarkers]
- 108. Optimizing nanoLC-TIMS-TOF and lipidomics sample ... [https://chemrxiv.org/engage/chemrxiv/article-details/68ed0a0b5dd091524f3c2b40]
- 109. Lipid Analysis Software [https://www.lipidmaps.org/resources/tools/lm_software]
- 110. Common Lipidomics Databases and Software [https://www.metwarebio.com/common-lipidomics-databases-and-software/]