A Comprehensive UHPLC-MS/MS Lipidomics Protocol: From Foundational Principles to Clinical Biomarker Validation
This article provides a detailed protocol for ultra-high performance liquid chromatography tandem mass spectrometry (UHPLC-MS/MS) in lipidomics, tailored for researchers, scientists, and drug development professionals.
A Comprehensive UHPLC-MS/MS Lipidomics Protocol: From Foundational Principles to Clinical Biomarker Validation
Abstract
This article provides a detailed protocol for ultra-high performance liquid chromatography tandem mass spectrometry (UHPLC-MS/MS) in lipidomics, tailored for researchers, scientists, and drug development professionals. It covers the foundational principles of lipidomics and its role in understanding cellular processes and disease mechanisms. The guide delivers a step-by-step methodological workflow, from sample preparation to data acquisition, including targeted and untargeted approaches. It further addresses critical troubleshooting and optimization strategies to enhance sensitivity and reproducibility. Finally, the protocol outlines rigorous biomarker validation processes and compares lipidomics platforms, establishing a clear path for translating lipidomic research into clinical applications and precision medicine.
Lipidomics Foundations: Exploring Lipid Diversity and Its Role in Health and Disease
Lipidomics, a specialized subset of metabolomics, is the large-scale study of lipids—their structures, functions, interactions, and distribution within biological systems [1]. Lipids play critical roles as structural components of cell membranes, energy storage molecules, and signaling agents [1]. With advancements in analytical technologies, particularly mass spectrometry (MS), lipidomics has become indispensable in biomedical research, including disease diagnostics, metabolic studies, and drug development [1]. This field aims to comprehensively profile lipid molecules to understand their roles in health and disease, providing crucial insights into cellular function and enabling clinical applications.
The structural diversity of lipids is systematically classified by databases such as LIPID MAPS, which categorizes lipids into eight main categories: fatty acyls, glycerolipids, glycerophospholipids, sphingolipids, sterol lipids, prenol lipids, saccharolipids, and polyketides [1]. This classification system provides a framework for understanding the vast lipidome, which contains over 40,000 unique lipid compounds [1].
Key Analytical Protocols in Lipidomics
Single-Cell Lipidomics Profiling
Single-cell lipidomics enables detailed analysis of the lipidomes of individual cells, revealing cellular heterogeneity that bulk analyses may obscure [2] [3]. This protocol is particularly valuable for studying pathological conditions involving heterogeneous cell populations, including cancer, diabetes, and infectious diseases [3].
Experimental Workflow for Capillary Sampling:
- Cell Preparation: Culture human pancreatic adenocarcinoma cells (PANC-1) in DMEM with 10% fetal bovine serum, 1% penicillin/streptomycin, and 2 mM L-glutamine at 37°C with 5% CO₂ [3]. Seed 200,000 cells into a 3.5 cm glass-bottom dish 48 hours before sampling. Before sampling, wash cells twice with warm FBS-free culture medium.
- Single-Cell Isolation: Use a Yokogawa SS2000 Single Cellome System with 10 μm capillaries for manual cell selection [3]. Apply the following pressures: pre-sampling 6 kPa, sampling 14 kPa, and post-sampling 3 kPa. Hold sampled cells for 200 ms within the capillary.
- Sample Processing: Immediately freeze capillary tips on dry ice after cell sampling [3]. Transfer cell contents to LC-MS vials by backfilling capillaries with 5 μL of lysis solvent (51:62:87 IPA/H₂O/ACN) spiked with internal standards (e.g., EquiSPLASH at 16 ng/mL).
- LC-MS Analysis: Analyze samples using an appropriate LC-MS platform. For analytical flow with MS1 acquisition, use a Thermo Fisher Scientific Ultimate 3000 UHPLC coupled to a Q-Exactive Plus Orbitrap [3]. Set the HESI probe to 320°C with a spray voltage of 4 kV, and acquire data in the m/z range of 200-1400 with a resolution of 140,000.
- Quality Control: Prepare blank samples by aliquoting cell culture media without cells into a culture dish and processing alongside cellular samples [3]. Dilute blank media in starting mobile phase to a concentration of 1 nL per μL.
Critical Parameters for Success: Appropriate blank correction, capillary tip selection, and control of aspiration volumes are crucial for preserving detection sensitivity [2]. Automated and manual capillary sampling yield comparable lipid profiles when these key parameters are controlled [2].
Integrated Lipidomics and Metabolomics from Serum
This protocol describes an integrated LC-HRMS workflow for untargeted profiling of lipids and metabolites from minimal serum volumes, optimized for high-throughput clinical applications [4].
Experimental Workflow for Serum Profiling:
- Sample Collection and Extraction: Collect only 10 μL of serum and perform a simplified extraction using methanol/methyl tert-butyl ether (1:1, v/v) [4]. This protocol reduces operator variability and enables simultaneous lipid-metabolite coverage.
- Internal Standard Normalization: Add ready-to-use internal standards to enable precise normalization, improving analytical precision to achieve relative standard deviations of 5-6% [4].
- LC-HRMS Analysis: Conduct liquid chromatography-high-resolution mass spectrometry analysis. The method enables confident identification of over 440 lipid species across 23 classes and broad metabolite coverage (approximately 1000 metabolite features) in both ionization modes [4].
- Data Processing: Utilize a semi-automated data processing script to streamline analysis, eliminating the need for advanced programming expertise [4].
Clinical Application: When applied to a clinical cohort of patients with age-related macular degeneration (AMD), this method detected consistent lipid and metabolite alterations, including a 34-fold increase in a highly unsaturated triglyceride (TG 22:622:622:6) and significant reductions in fatty acids, complex glycans, and sphingomyelins [4].
Data Processing and Normalization
Lipidomics data require specific preprocessing to address unique challenges before statistical analysis.
Missing Value Imputation: Missing values are common in lipidomics datasets and should be investigated and addressed prior to analysis [5]. The optimal imputation strategy depends on the nature of the missingness:
- Missing Not at Random (MNAR): Often caused by abundances below the detection limit; impute using a percentage of the lowest concentration or quantile regression imputation of left-censored data (QRILC) [5].
- Missing Completely at Random (MCAR) or Missing at Random (MAR): Impute using k-nearest neighbors (kNN) or random forest methods [5].
Data Normalization: The primary goal of normalization is to remove unwanted technical variation while preserving biological signal [5]. Pre-acquisition normalization based on sample volume, mass, cell count, or protein amount is preferred [5]. Post-acquisition normalizations (e.g., sum or median normalization) and quality control-based normalization using pooled quality control (QC) samples are also effective for removing batch effects [5].
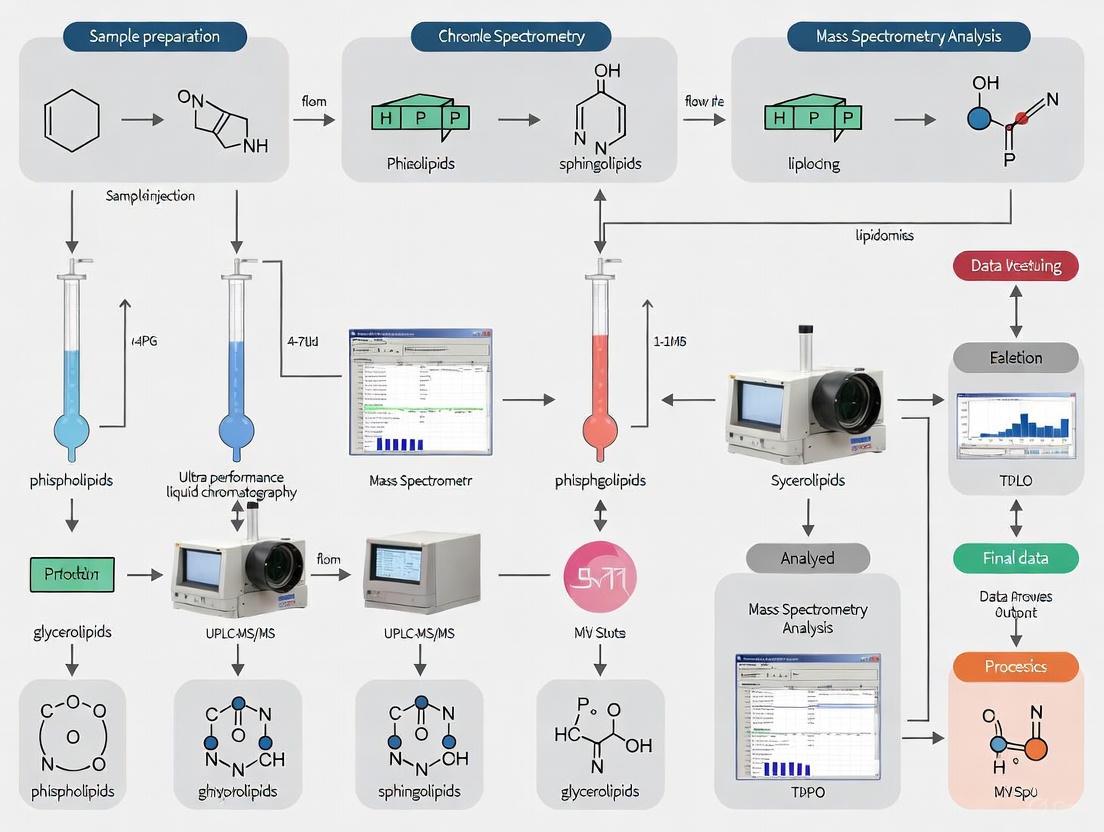
Lipidomics Workflow Diagram
Data Analysis and Statistical Processing
Multivariate Statistical Analysis
Multivariate analysis is essential for exploring high-dimensional lipidomics data and identifying patterns related to biological conditions.
Principal Component Analysis (PCA): PCA is a well-established, widely validated tool for exploratory analysis of lipidomics data [6]. This unsupervised method reduces data dimensionality while preserving major trends, allowing visualization of sample groupings and outliers. PCA is particularly effective in controlled experimental settings where lipidomic alterations tend to be systematic and directional [6].
Partial Least Squares-Discriminant Analysis (PLS-DA): PLS-DA is a supervised method that maximizes separation between predefined sample groups [6]. It is particularly useful for identifying lipids that contribute most to differences between experimental conditions. When applying PCA and PLS-DA, data should be log-transformed and median-centered to meet analysis assumptions and mitigate nonlinearity [6].
Validation of Multivariate Methods: Despite their linear nature, PCA and PLS-DA are appropriate for capturing systematic variations in complex biological systems, particularly in controlled in vitro models [6]. These methods should be integrated into a broader analytical pipeline that includes rigorous statistical testing, data transformations, and biological validation to ensure robustness and relevance [6].
Statistical Testing and Visualization
A comprehensive lipidomics analysis integrates both multivariate and univariate approaches to identify statistically significant alterations.
Univariate Analysis: For individual lipid species, implement moderated t-tests with false discovery rate (FDR) correction (p < 0.01) and fold change thresholds (>1.5) to identify significantly altered lipids [6]. These analyses are effectively visualized using:
- Volcano Plots: Display the relationship between statistical significance (-log10 p-value) and magnitude of change (log2 fold change) [6] [5].
- Annotated Box Plots: Show distribution of lipid levels across experimental groups [5].
Advanced Visualizations: Specialized lipid-centric visualizations include:
- Lipid Maps: Display lipid class alterations [5].
- Fatty Acyl Chain Plots: Visualize changes in fatty acid composition [5].
- Heatmaps: Show patterns of lipid abundance across samples and lipids, often combined with clustering analysis [5].
Table 1: Key Statistical Methods in Lipidomics Data Analysis
| Method Type | Specific Technique | Application in Lipidomics | Key Considerations |
|---|---|---|---|
| Multivariate | Principal Component Analysis (PCA) | Exploratory data analysis, outlier detection | Unsupervised; requires data transformation [6] |
| Partial Least Squares-Discriminant Analysis (PLS-DA) | Group separation, biomarker identification | Supervised; risk of overfitting without validation [6] | |
| Univariate | Moderated t-tests | Identifying significantly altered individual lipids | Apply FDR correction for multiple testing [6] |
| Fold Change Analysis | Magnitude of lipid alterations | Typically use threshold of >1.5 or <-1.5 [6] | |
| Specialized | Volcano Plots | Visualizing significance vs. fold change | Combine statistical and magnitude information [6] [5] |
| Heatmaps with Clustering | Pattern recognition across samples | Effective for grouped data visualization [5] |
Clinical Applications and Insights
Lipidomics has demonstrated significant utility in clinical research, particularly in disease mechanism elucidation and biomarker discovery.
Age-Related Macular Degeneration (AMD): Application of the serum lipidomics workflow revealed substantial lipid remodeling in AMD patients, including a remarkable 34-fold increase in a highly unsaturated triglyceride (TG 22:622:622:6) and significant reductions in fatty acids, complex glycans, and sphingomyelins (fold changes 0.6-0.8) [4]. These findings provide insights into metabolic dysregulation associated with AMD progression.
Hepatocyte Lipotoxicity: In studies of human hepatocytes exposed to cadmium and free fatty acids, lipidomics analysis revealed that melatonin repairs the lipidome by reversing toxic alterations [6]. This demonstrates how lipidomics can identify protective mechanisms against lipotoxicity, with potential therapeutic implications for metabolic liver diseases.
Cancer Heterogeneity: Single-cell lipidomics has uncovered cell-type specific lipid signatures across various tissues, including prostate, kidney, liver, and pancreas [3]. This approach has contributed to the "lipotype" hypothesis, which suggests that specific lipid compositions define cellular identity and state [3].
The Scientist's Toolkit
Essential Research Reagents and Materials
Table 2: Essential Research Reagents and Materials for Lipidomics
| Item | Function/Application | Example Specifications |
|---|---|---|
| Internal Standards | Normalization, quantification accuracy | EquiSPLASH mixture (16 ng/mL) [3] |
| Lysis Solvent | Lipid extraction from biological samples | IPA/Hâ‚‚O/ACN (51:62:87 v/v) [3] |
| Extraction Solvent | Comprehensive lipid extraction | Methanol/MTBE (1:1, v/v) [4] |
| Cell Culture Media | Maintenance of cellular models | DMEM with 10% FBS, 1% penicillin/streptomycin [3] |
| Sampling Capillaries | Single-cell isolation | 10 μm capillaries for cell sampling [3] |
| Quality Control Materials | Monitoring technical variability | NIST SRM 1950 for plasma metabolomics [5] |
| Chromatography Columns | Lipid separation prior to MS | C18 columns for reverse-phase chromatography [3] |
| Mobile Phase Additives | Improving ionization efficiency | Ammonium formate, formic acid [3] |
| Methyl Stearate | Methyl Stearate|112-61-8|Research Grade | Methyl stearate is a key fatty acid methyl ester (FAME) for biodiesel, surfactant, and crystallization research. This product is for research use only (RUO). |
| Dinophysistoxin 1 | Dinophysistoxin-1 Research Grade|For RUO | Dinophysistoxin-1 (DTX-1) is a marine toxin for diarrhetic shellfish poisoning (DSP) research. This product is for Research Use Only (RUO). Not for human, veterinary, or household use. |
Lipidomics Databases:
- LIPID MAPS: Comprehensive resource cataloging over 40,000 unique lipid compounds with systematic classification [1].
- SwissLipids: Knowledgebase focused on lipid classification and annotation, linking structures to biological pathways [1].
- Metabolomics Workbench: Public repository for metabolomics and lipidomics data, hosting real-world datasets [1].
Analysis Software:
- LipidFinder: For LC-MS data analysis, distinguishes lipid features from noise [1].
- LipidMatch: Rule-based tool for lipid identification in high-resolution tandem MS experiments [1] [7].
- LipidSearch: Commercial tool tailored for Orbitrap and triple quadrupole instruments with automated identification [1].
- BioPAN: Pathway analysis tool that predicts gene activity changes from lipidomics data [1].
Data Analysis Pathway
Advanced Applications and Future Perspectives
As lipidomics technologies continue to evolve, several advanced applications and future directions are emerging:
Instrumentation Advances: Modern LC-MS platforms incorporating polarity switching, ion mobility spectrometry, and electron-activated dissociation significantly enhance lipidome coverage and confidence in lipid identification from minimal samples, including single cells [3]. These technologies improve selectivity and sensitivity, pushing detection boundaries.
Multi-Omics Integration: Integrating lipidomics data with other omics fields (genomics, transcriptomics, proteomics) provides a more comprehensive understanding of biological systems and disease mechanisms [1]. Tools like BioPAN facilitate this integration by linking lipid changes to genetic regulation [1].
Artificial Intelligence in Lipidomics: Machine learning and AI are increasingly transforming lipidomics data analysis [1]. Tools like LipidSig use machine learning for advanced data analysis, promising greater efficiency and discovery potential in pattern recognition from complex lipidomic datasets [1] [5].
The ongoing standardization of lipidomics protocols, development of more sophisticated bioinformatics tools, and integration with other analytical platforms will further enhance the clinical utility of lipidomics, solidifying its role in precision medicine, biomarker discovery, and therapeutic development.
Lipidomics, the large-scale study of cellular lipids, has emerged as a critical discipline in biomedical research due to the essential roles lipids play in cellular structure, signaling, and energy storage. This application note details a robust ultra-performance liquid chromatography tandem mass spectrometry (UPLC-MS/MS) protocol for the simultaneous quantification of over 400 lipid species across three key classes: glycerophospholipids, sphingolipids, and glycerolipids. The method employs hydrophilic interaction liquid chromatography (HILIC) with electrospray ionization and multiple reaction monitoring to achieve comprehensive lipid profiling with high reproducibility (%CV 1.5-12%). We present detailed methodologies for sample preparation, chromatographic separation, mass spectrometric detection, and data analysis, along with applications in toxicological studies demonstrating the protocol's utility in identifying lipid dysregulation. This standardized approach provides researchers in drug development with a powerful tool for uncovering lipid-based biomarkers and understanding molecular mechanisms in disease and therapeutic intervention.
Cellular lipids constitute a highly complex and dynamic component of living systems, with tens to hundreds of thousands of molecular species at concentrations ranging from amol to nmol/mg protein [8]. Lipids perform crucial functions as structural components of membranes, energy storage depots, and signaling mediators [9]. Among the diverse lipid classes, three families are particularly significant in biomedical research: glycerophospholipids, sphingolipids, and glycerolipids.
Glycerophospholipids, the main component of biological membranes in eukaryotic cells, are glycerol-based phospholipids with amphipathic properties that drive the formation of lipid bilayers [10]. These molecules consist of a glycerol backbone with fatty acids esterified at the sn-1 and sn-2 positions and a phosphate group at the sn-3 position, which is often esterified to various head groups (e.g., choline, ethanolamine, serine, or inositol) [11]. Beyond their structural role, glycerophospholipids serve as reservoirs for secondary messengers and are involved in cellular signaling processes [10].
Sphingolipids represent a distinct class of lipids containing a backbone of sphingoid bases, typically sphingosine, rather than glycerol [12]. These compounds, discovered in brain extracts in the 1870s, play important roles in signal transduction and cell recognition [12]. The sphingolipid family includes ceramides, sphingomyelins, and glycosphingolipids, with simple sphingolipid metabolites such as ceramide and sphingosine-1-phosphate serving as key mediators in signaling cascades involved in apoptosis, proliferation, stress responses, and differentiation [12].
Glycerolipids, primarily consisting of triacylglycerols (TAG) and diacylglycerols (DAG), serve as major energy storage depots and play important roles in cellular signaling [13]. In the yeast Saccharomyces cerevisiae, a model organism for lipid metabolism studies, glycerolipids are synthesized and metabolized by enzymes associated with the cytosol and membranous organelles, including endoplasmic reticulum, mitochondria, and lipid droplets [13].
The integration of UPLC-MS/MS in lipidomic analyses has revolutionized the study of these lipid classes by enabling simultaneous quantification of hundreds of lipid species with high sensitivity and specificity [8]. This application note provides a comprehensive protocol for targeted lipidomics analysis of these key lipid classes, framed within the context of a broader thesis on UPLC-MS/MS lipidomics research.
Table 1: Key Lipid Classes in Biomedical Research
| Lipid Class | Core Structure | Primary Functions | Cellular Localization |
|---|---|---|---|
| Glycerophospholipids | Glycerol backbone with two fatty acyl chains and polar head group | Membrane structure, signaling precursors, membrane trafficking | All cellular membranes, plasma membrane, organelle membranes |
| Sphingolipids | Sphingoid base backbone with amide-linked fatty acid | Signal transduction, cell recognition, apoptosis, lipid rafts | Plasma membrane (enriched in outer leaflet), lipid rafts |
| Glycerolipids | Glycerol backbone with three fatty acyl chains | Energy storage, lipid droplet formation, signaling | Lipid droplets, cytoplasmic inclusions |
Lipid Class Structures and Biological Significance
Glycerophospholipids
Glycerophospholipids are derived from glycerol-3-phosphate in a de novo pathway and consist of various species that differ primarily in their polar head groups [10]. The amphipathic nature of these molecules—with hydrophobic fatty acid tails and hydrophilic phosphate-containing heads—drives the spontaneous formation of lipid bilayers in aqueous environments [11]. The fatty acid at the sn-1 position is typically saturated, while the sn-2 position often contains an unsaturated fatty acid, a configuration that influences membrane fluidity [11].
Major subclasses of glycerophospholipids include:
- Phosphatidylcholines (PC): Also known as lecithins, these are abundant in all living organisms and commercially important as emulsifying agents [10]. The choline head group carries a positive charge on the quaternary ammonium, while the phosphate has a negative charge.
- Phosphatidylethanolamines (PE): Often found in the cytosolic side of plasma membranes, particularly in neural tissues [10].
- Phosphatidylserines (PS): Important in cell signaling, especially apoptosis, and constitutes 13-15% of phospholipids in the human cerebral cortex [10].
- Phosphatidylinositols (PI): Make up a small component of the cytosol in eukaryotic cell membranes and play roles in cell signaling [10].
- Phosphatidylglycerols (PG): Present in mitochondrial membranes and bacterial membranes.
- Phosphatidic acids (PA): Serve as key intermediates in glycerophospholipid and triacylglycerol synthesis [13].
The metabolism of glycerophospholipids is tightly regulated, with phosphatidic acid serving as a central intermediate in the synthesis of all membrane phospholipids and storage lipids [13]. In neural membranes, glycerophospholipids provide stability, permeability, and fluidity, with their composition greatly altering membrane functional efficacy [10].
Sphingolipids
Sphingolipids are characterized by a sphingoid base backbone, most commonly sphingosine, which is synthesized from serine and palmitoyl-CoA [12]. These lipids are amphipathic molecules with hydrophobic properties derived from a sphingoid long chain base with a fatty acid chain attached by an amide bond at carbon 2, and hydrophilic properties from phosphate groups, sugar residues, and/or hydroxyl groups [14].
The sphingolipid family includes:
- Ceramides: The simplest sphingolipids, consisting of a sphingoid base linked to a fatty acid via an amide bond [12]. Ceramides serve as precursors to more complex sphingolipids and play significant roles in cellular signaling pathways related to apoptosis, stress responses, and cell differentiation [14]. They have high phase transition temperatures (>37°C) due to their predominantly saturated nature, which favors tight packing and segregation into membrane microdomains called "rafts" [14].
- Sphingomyelins (SM): Contain a phosphocholine or phosphoethanolamine head group and are particularly abundant in the myelin sheath of nerve cells [12].
- Glycosphingolipids: Cerebrosides contain a single sugar residue, while more complex gangliosides feature multiple sugar residues and are essential for cell-to-cell recognition and signaling in the nervous system [12].
- Sphingosine-1-phosphate (S1P): A potent bioactive lipid mediator involved in cell migration, proliferation, and immune responses [12].
Sphingolipids are synthesized in a pathway that begins in the endoplasmic reticulum and is completed in the Golgi apparatus, but they are enriched in the plasma membrane and in endosomes, where they perform many of their functions [12]. They are virtually absent from mitochondria and the ER but constitute a 20-35 molar fraction of plasma membrane lipids [12].
Glycerolipids
Glycerolipids are composed of a glycerol backbone with fatty acids esterified to all three hydroxyl groups. The major glycerolipids include:
- Triacylglycerols (TAG): Neutral lipids that serve as the primary storage form of fatty acids and energy in adipose tissue and lipid droplets [13].
- Diacylglycerols (DAG): Important signaling molecules that activate protein kinase C and also serve as precursors for TAG and phospholipid synthesis [13].
In yeast, which serves as a model organism for studying eukaryotic lipid metabolism, glycerolipids play important roles in cell signaling, membrane trafficking, and anchoring of membrane proteins in addition to their functions in energy storage [13]. The regulation of TAG metabolism is particularly important in lipid droplet formation and depletion [13].
Experimental Protocols
Sample Preparation
Proper sample preparation is critical for accurate lipidomic analysis. The following protocol has been optimized for mammalian plasma/serum samples but can be adapted for tissues and cells.
Table 2: Sample Preparation Reagents and Equipment
| Item | Specification | Purpose/Function |
|---|---|---|
| Extraction Solvent | Isopropanol/ACN (1:2, v/v) containing stable labelled isotope mix | Protein precipitation and lipid extraction with internal standards |
| Internal Standard | EquiSplash Lipidomix or similar | Correction for extraction efficiency and analytical variability |
| Centrifuge | Refrigerated centrifuge capable of 10,300×g | Phase separation and clarification of extracts |
| Vortex Mixer | - | Thorough mixing of samples with solvents |
| Storage Vials | Low protein binding Eppendorf tubes, total recovery glass vials | Minimize analyte adsorption and maintain sample integrity |
Procedure:
- Transfer 25 µL aliquots of plasma to low protein binding Eppendorf tubes.
- Add 125 µL of ice-cold extraction solvent (isopropanol/ACN, 1:2 v/v) containing commercially available stable labelled isotope mix (e.g., EquiSplash Lipidomix).
- Vortex mix for 1 minute to ensure complete homogenization.
- Refrigerate samples at -20°C for 1 hour to enhance protein precipitation.
- Shake samples at 500 rpm at 5°C for 2 hours to ensure complete protein precipitation.
- Centrifuge at 10,300×g for 10 minutes at 5°C to pellet precipitated proteins.
- Transfer the supernatant to total recovery glass vials for LC-MS/MS analysis.
- Prepare calibration standards by spiking known concentrations of stable labelled lipid isotopic standards into control matrix (e.g., rat plasma) and process alongside samples.
For tissue samples, a modified Folch (chloroform:methanol, 2:1 v/v) or Bligh & Dyer (chloroform:methanol:water, 1:1:0.9 v/v/v) extraction is recommended [8]. The MTBE method (methyl tert-butyl ether/methanol/water, 5:1.5:1.45 v/v/v) provides an alternative with the advantage of the organic phase being the top layer, facilitating automation [8].
UPLC-MS/MS Analysis Conditions
The following conditions enable rapid, comprehensive lipid profiling with coverage of over 400 lipid species across glycerophospholipids, sphingolipids, and glycerolipids.
Liquid Chromatography Conditions:
- LC System: ACQUITY Premier or equivalent UPLC system
- Column: 2.1 × 100 mm, 130 Å, 1.7 µm ACQUITY BEH Amide Column or equivalent HILIC column
- Column Temperature: 45°C
- Sample Temperature: 8°C
- Injection Volume: 1-2 µL (depending on ionization polarity)
- Flow Rate: 0.6 mL/min
- Mobile Phase A: 95% ACN, 5% 10 mM ammonium acetate
- Mobile Phase B: 50% ACN, 50% water, 10 mM ammonium acetate
- Gradient Program:
- 0-1 min: 99% A
- 1-5 min: 99% A to 70% A
- 5-6 min: 70% A to 40% A
- 6-7 min: 40% A
- 7-7.1 min: 40% A to 99% A
- 7.1-8 min: 99% A (equilibration)
Mass Spectrometry Conditions:
- MS System: Triple quadrupole mass spectrometer (e.g., Xevo TQ Absolute)
- Ionization Mode: Positive and negative ESI with rapid switching
- Acquisition Mode: Multiple Reaction Monitoring (MRM)
- Capillary Voltage: 1.0 kV
- Desolvation Temperature: 500°C
- Source Temperature: 120°C
- Collision Energy: Compound-dependent optimization
- Cone Voltage: Compound-dependent optimization
- MRM Transitions: ~450 transitions targeting >400 lipid species
Data Processing and Analysis
- Data Acquisition: MassLynx v4.2 or equivalent software
- Quantitation: TargetLynx v4.2 or Skyline software
- Statistical Analysis: MetaboAnalyst 6.0 or equivalent for multivariate statistics
- Quality Control: Batch QC samples evenly distributed throughout analysis, calibration standards at beginning and end of batch
The method demonstrates excellent reproducibility with %CV values ranging from 1.5-12% for various lipid classes [9].
Applications in Biomedical Research
Lipid Dysregulation in Toxicological Studies
The described UPLC-MS/MS lipidomics approach was applied to investigate plasma lipid changes in a rodent toxicology study involving repeat oral administration of the model hepatotoxin methapyrilene [9]. Analysis revealed significant dysregulation of the plasma lipidome, particularly at higher doses (150 mg/kg) and after repeated administration (day 5).
Key findings included:
- Ceramides and carnitines showed the most significant contributions to observed variance in positive ESI mode
- Free fatty acids, bile acids, PIs, PEs, PCs, and LPEs were dysregulated and contributed to variation observed in negative ion mode
- Multivariate statistical analysis (PCA) facilitated facile identification and visualization of dysregulated lipids
- Time- and dose-dependent responses were clearly observable in the lipid profiles
This application demonstrates the utility of comprehensive lipid profiling in early safety assessment for detecting off-target pharmacology and markers of toxicity.
Lipidomics in Disease Mechanism Elucidation
Glycerophospholipid and sphingolipid metabolism is frequently altered in human diseases:
- Neurological Disorders: Marked alterations in neural membrane glycerophospholipid composition result in changes in membrane fluidity and permeability, contributing to neurodegeneration [10].
- Cancer: Ceramide analogs and sphingolipid pathway modulators are being explored for their ability to induce apoptosis in cancer cells [12].
- Metabolic Diseases: Dysregulation of glycerolipid metabolism affects lipid storage and energy homeostasis.
- Inflammatory Conditions: Sphingosine-1-phosphate modulators are being investigated for treating autoimmune diseases due to their influence on immune cell trafficking [12].
The Scientist's Toolkit: Essential Research Reagents
Table 3: Essential Research Reagents for Lipidomics
| Reagent/Resource | Function/Application | Examples/Specifications |
|---|---|---|
| Stable Isotope-Labeled Internal Standards | Quantification and quality control | EquiSplash Lipidomix, Avanti Polar Lipids stable isotope standards |
| HILIC UPLC Columns | Chromatographic separation of lipid classes | ACQUITY BEH Amide Column (1.7 µm, 2.1 × 100 mm) |
| Quality Control Materials | Monitoring analytical performance | Pooled quality control samples from study matrix |
| Reference Spectral Libraries | Lipid identification | LIPID MAPS, MassBank, in-house MRM libraries |
| Sample Preparation Kits | Standardized lipid extraction | Commercial lipid extraction kits (e.g., Matyash method modifications) |
| Data Processing Software | Data extraction and analysis | Skyline, TargetLynx, MarkerView, MetaboAnalyst |
| Authentical Standards | Method development and verification | Avanti Polar Lipids, Sigma-Aldrich purified lipid standards |
| N-Heptanoylglycine | N-Heptanoylglycine, CAS:23783-23-5, MF:C9H17NO3, MW:187.24 g/mol | Chemical Reagent |
| Arotinolol | Arotinolol | α/β-Adrenergic Blocker Research Compound | Arotinolol is a mixed alpha/beta-adrenergic blocker for hypertension and tremor research. This product is For Research Use Only. Not for human consumption. |
Signaling Pathways and Metabolic Networks
Sphingolipid Metabolism Pathway
Glycerophospholipid Synthesis Network
Lipidomics Analysis Workflow
This application note presents a comprehensive UPLC-MS/MS protocol for the analysis of key lipid classes—glycerophospholipids, sphingolipids, and glycerolipids—in biomedical research. The method provides robust, reproducible quantification of over 400 lipid species with an 8-minute analytical run time, making it suitable for high-throughput applications in drug development and disease mechanism studies. The integration of stable isotope-labeled internal standards, HILIC chromatography, and targeted MRM acquisition ensures high data quality, while multivariate statistical tools enable efficient extraction of biologically meaningful information from complex lipidomic datasets. As lipidomics continues to evolve as a critical discipline in biomedical sciences, standardized protocols such as this will facilitate the discovery of lipid-based biomarkers and therapeutic targets across a spectrum of human diseases.
The Central Role of UHPLC-MS/MS in Modern Lipid Profiling
Lipidomics, the comprehensive analysis of lipid molecules within a biological system, has become an indispensable tool for understanding cellular metabolism, signaling pathways, and the mechanisms underlying various diseases [15]. The structural diversity of lipids—encompassing variations in acyl chain length, degree of unsaturation, and backbone structures—presents a significant analytical challenge [16]. Ultra-high performance liquid chromatography coupled to tandem mass spectrometry (UHPLC-MS/MS) has emerged as the cornerstone technology for addressing this challenge, enabling the separation, identification, and quantification of complex lipid mixtures with exceptional sensitivity and specificity [17] [15]. This article delineates the pivotal role of UHPLC-MS/MS in modern lipid profiling, framed within the context of developing robust lipidomics protocols for research and drug development.
The fundamental advantage of UHPLC-MS/MS over alternative approaches lies in its powerful combination of high-resolution chromatographic separation with selective mass spectrometric detection. While shotgun lipidomics approaches involve direct infusion of samples into the mass spectrometer without prior separation, these methods are susceptible to ion suppression effects and cannot readily distinguish isomeric compounds [17] [16]. The integration of UHPLC separation mitigates these issues, reduces matrix effects, and provides an additional dimension of characterization through retention time, thereby ensuring more accurate identifications and reliable quantitation [17] [16]. This is particularly crucial for clinical and pharmaceutical applications where detecting subtle lipid alterations can lead to the discovery of novel biomarkers or therapeutic targets.
Lipid Classification and Biological Significance
Lipids are broadly categorized into eight main classes according to the LIPID MAPS consortium: fatty acyls (FA), glycerolipids (GL), glycerophospholipids (GP), sphingolipids (SP), sterol lipids (ST), prenol lipids (PR), saccharolipids (SL), and polyketides (PK) [15]. These molecules are integral to numerous biological processes, serving as fundamental structural components of cellular membranes, energy storage reservoirs, and vital signaling mediators [15]. The functional diversity of lipids is primarily determined by their polar head groups, while their aliphatic chains, varying in length, unsaturation, and double bond configuration, contribute to their structural complexity [15].
Table 1: Major Lipid Classes and Their Primary Biological Functions
| Lipid Category | Key Subclasses | Core Biological Functions |
|---|---|---|
| Glycerophospholipids (GP) | Phosphatidylcholine (PC), Phosphatidylethanolamine (PE), Phosphatidylinositol (PI) | Main structural components of cellular membranes; involved in cellular signaling [15]. |
| Glycerolipids (GL) | Triacylglycerols (TG), Diacylglycerols (DG) | Primary energy storage molecules; DG also acts as signaling molecules [15]. |
| Sphingolipids (SP) | Ceramides (Cer), Sphingomyelins (SM) | Structural membrane components; crucial roles in cell signaling, apoptosis, and stress responses [15]. |
| Fatty Acyls (FA) | Free Fatty Acids, Eicosanoids | Energy sources; precursors for signaling molecules like eicosanoids [15]. |
Dysregulation of lipid metabolism is intricately linked to the pathogenesis of a wide array of human diseases. For instance, in diabetes mellitus combined with hyperuricemia (DH), specific lipid disturbances—including upregulated triglycerides (TGs) and phosphatidylethanolamines (PEs)—have been observed, pointing to abnormalities in glycerophospholipid and glycerolipid metabolism pathways [18]. Similarly, distinct lipidomic signatures have been identified in various cancer types, such as pancreatic ductal adenocarcinoma (PDAC), where pronounced dysregulation of monoacylglycerols (MG) and sphingolipids occurs [19]. These disease-specific alterations underscore the value of lipidomics in biomarker discovery and in elucidating pathological mechanisms.
UHPLC-MS/MS Analytical Strategies in Lipidomics
The application of UHPLC-MS/MS in lipidomics can be strategically deployed in three primary modes: untargeted, targeted, and pseudo-targeted analyses, each suited for different research objectives [15].
Untargeted Lipidomics provides a comprehensive, system-wide overview of the lipidome. This discovery-oriented approach utilizes high-resolution mass spectrometry (HRMS) platforms, such as Quadrupole-Time of Flight (Q-TOF) or Orbitrap instruments, to capture a broad spectrum of lipid species without prior bias [18] [15]. Data acquisition typically employs data-dependent acquisition (DDA) or data-independent acquisition (DIA) modes. A key application of untargeted lipidomics was demonstrated in a study of diabetes and hyperuricemia, where UHPLC-MS/MS enabled the identification of 1,361 lipid molecules and revealed 31 significantly altered lipid metabolites in DH patients compared to healthy controls [18].
Targeted Lipidomics focuses on the precise identification and accurate quantification of a predefined set of lipids. This approach often employs triple quadrupole (QQQ) mass spectrometers operating in Multiple Reaction Monitoring (MRM) mode, which offers superior sensitivity, a wide dynamic range, and high reproducibility for validating candidate biomarkers [20] [15] [19]. For example, a targeted UHPLC-QTrap-MS/MS method was developed for the quantitative analysis of medium-chain phosphatidylcholines (MCPCs) in platelets from patients with coronary artery disease, achieving limits of quantification (LOQs) in the low nmol/L range [20].
Pseudo-targeted Lipidomics represents a hybrid strategy that combines the extensive coverage of untargeted methods with the quantitative rigor of targeted approaches. It involves creating a targeted method based on lipids previously identified in untargeted screens, thereby enabling high-confidence identification and improved quantification across large sample sets [15].
Table 2: Comparison of UHPLC-MS/MS Lipidomics Strategies
| Feature | Untargeted Lipidomics | Targeted Lipidomics | Pseudo-Targeted Lipidomics |
|---|---|---|---|
| Primary Objective | Discovery of novel lipids and biomarkers | Validation and precise quantification of predefined lipids | High-coverage, reliable quantification |
| Typical MS Platform | Q-TOF, Orbitrap | Triple Quadrupole (QQQ), QTRAP | Q-TOF, Orbitrap, QQQ |
| Acquisition Mode | DDA, DIA | MRM, PRM | MRM-like based on untargeted data |
| Throughput | High for discovery | Very high for targeted panels | High |
| Key Strength | Comprehensive coverage | High sensitivity and quantitative accuracy | Balances coverage and data quality |
| Common Application | Hypothesis generation, pathophysiological insights | Biomarker validation, clinical diagnostics | Complex disease phenotyping |
Advanced Applications and Protocol Development
Case Study: Lipidomic Profiling in Metabolic Disease
A recent investigation into the lipidomic perturbations in patients with diabetes mellitus combined with hyperuricemia (DH) exemplifies the power of UHPLC-MS/MS [18]. The untargeted analysis, performed on a UHPLC-MS/MS platform, identified 1,361 lipid molecules across 30 subclasses. Multivariate statistical analyses clearly differentiated the DH, DM, and healthy control groups. The study pinpointed 31 significantly altered lipid metabolites in the DH group, with 13 triglycerides (TGs), 10 phosphatidylethanolamines (PEs), and 7 phosphatidylcholines (PCs) being notably upregulated [18]. Pathway analysis revealed that glycerophospholipid metabolism and glycerolipid metabolism were the most significantly perturbed pathways, highlighting their central role in the pathophysiology of this condition [18].
Innovation: Chemical Derivatization for Enhanced Sensitivity
A significant innovation in targeted lipidomics involves chemical derivatization to improve the detection of lipid classes that lack efficient ionization or characteristic fragment ions. A recent study utilized benzoyl chloride derivatization coupled with RP-UHPLC/MS/MS to quantitatively profile 450 lipid species from 19 subclasses in human serum [19]. This strategy significantly enhanced chromatographic behavior and mass spectrometric sensitivity, particularly for monoacylglycerols (MG), diacylglycerols (DG), sphingoid bases, and free sterols [19]. The method was rigorously validated and successfully applied to uncover significant dysregulation of lipid metabolism in pancreatic cancer patients, demonstrating both its robustness and its potential for revealing detailed metabolic alterations in cancer [19].
Frontier: Single-Cell Lipidomics
The field is rapidly advancing toward single-cell resolution to decipher cellular heterogeneity. Single-cell lipidomics using capillary sampling coupled to LC-MS presents unique challenges, including extremely low analyte abundances and potential background interference [21]. A recent protocol development study systematically evaluated variables such as sampling medium, capillary tips, and aspiration volume. It established that appropriate blank correction, controlled aspiration volumes, and the choice of capillary tip are critical for obtaining reliable lipid profiles from individual cells [21]. This evolving methodology opens new avenues for exploring lipid heterogeneity in complex tissues, such as tumors, at the single-cell level.
Detailed Experimental Protocol: A Representative Workflow
The following section provides a generalized UHPLC-MS/MS lipidomics protocol, synthesized from current methodologies [18] [21] [19].
Sample Preparation and Lipid Extraction
- Sample Collection: Collect biological samples (e.g., plasma, serum, tissue, cells). For plasma, collect fasting blood into anticoagulant tubes and separate plasma by centrifugation (e.g., 3,000 rpm for 10 min). Aliquot and store at -80°C [18].
- Internal Standard Addition: Add a mixture of internal standards (IS) representing various lipid classes prior to extraction to correct for variability in extraction efficiency and MS response. Examples include deuterated lipid standards (e.g., EquiSPLASH or LIPID MAPS quantitative standards) [21] [19].
- Lipid Extraction: Perform a liquid-liquid extraction. A common method is a modified Folch or MTBE-based extraction.
- For 100 μL of plasma/serum, add 200 μL of cold water and 240 μL of pre-cooled methanol. Vortex.
- Add 800 μL of methyl tert-butyl ether (MTBE). Sonicate in a low-temperature water bath for 20 min and let stand at room temperature for 30 min [18].
- Centrifuge at 14,000 g at 10°C for 15 min to separate phases.
- Collect the upper organic phase and dry under a gentle stream of nitrogen.
- Reconstitution: Reconstitute the dried lipid extract in a solvent compatible with the UHPLC mobile phase (e.g., chloroform/methanol 1:1 v/v or isopropanol) for injection [19].
UHPLC-MS/MS Analysis Conditions
- Chromatography:
- Column: Acquity UPLC BEH C18 column (1.7 μm, 2.1 mm × 100 mm or 150 mm) [18] [19].
- Temperature: 50-55°C.
- Mobile Phase: A) 10 mM ammonium formate in water (or water with 1% ammonium acetate); B) 10 mM ammonium formate in acetonitrile:isopropanol (1:1, v/v) [18] [16].
- Gradient: Typically a linear gradient from 35-65% B to 100% B over 7-15 minutes, followed by a hold at 100% B for washing and subsequent re-equilibration [18] [16].
- Flow Rate: 0.35-0.40 mL/min.
- Injection Volume: 2-10 μL.
- Mass Spectrometry:
- Ionization: Electrospray Ionization (ESI) in both positive and negative ion modes.
- Data Acquisition:
- Untargeted: Full scan MS (m/z 300-1200) on a Q-TOF or Orbitrap instrument at high resolution (>30,000). DDA can be used for MS/MS.
- Targeted: MRM on a QQQ or QTRAP instrument. Optimized MRM transitions, declustering potentials (DP), collision energies (CE), and collision cell exit potentials (CXP) are defined for each lipid species [20] [22].
Data Processing and Analysis
- Peak Integration & Identification: Use specialized software (e.g., MZmine, Skyline, or vendor-specific software) for peak picking, alignment, and integration. Identify lipids based on exact mass, MS/MS spectrum, and retention time matching to standards or databases [16].
- Quantitation: Normalize lipid peak areas to the corresponding internal standard and to the original sample volume or weight.
- Statistical Analysis: Perform univariate (e.g., Student's t-test) and multivariate analyses (e.g., PCA, OPLS-DA) to identify differentially abundant lipids. Use pathway analysis tools (e.g., MetaboAnalyst) to interpret data in a biological context [18].
The Scientist's Toolkit: Essential Research Reagents and Materials
Table 3: Key Research Reagent Solutions for UHPLC-MS/MS Lipidomics
| Item/Category | Specific Examples | Function & Importance |
|---|---|---|
| Chromatography Column | Waters ACQUITY UPLC BEH C18 (1.7 µm, 2.1x100 mm) [18] [16] | Provides high-resolution separation of complex lipid mixtures based on acyl chain length and unsaturation. |
| Internal Standards (IS) | EquiSPLASH, LIPID MAPS Quantitative Standards, deuterated PCs, PEs, TGs, Cers [21] [19] | Critical for correcting losses during sample prep and variations in MS ionization efficiency; enables accurate quantification. |
| Extraction Solvents | Methyl tert-butyl ether (MTBE), Chloroform, Methanol, Water [18] [19] | Used in liquid-liquid extraction (e.g., Folch, MTBE methods) to efficiently isolate lipids from the proteinaceous matrix. |
| Mobile Phase Additives | Ammonium formate, Ammonium acetate [18] [16] [19] | Enhances ionization efficiency in the ESI source and promotes the formation of stable adducts (e.g., [M+NH4]+), improving sensitivity. |
| Derivatization Reagents | Benzoyl chloride [19] | Chemically modifies lipids to improve chromatographic retention, ionization efficiency, and sensitivity, especially for neutral lipids like MG and DG. |
| Quality Control (QC) Material | Pooled study samples, NIST SRM 1950 Human Plasma [23] [19] | Monitors instrument performance, corrects for signal drift, and validates analytical accuracy throughout a batch run. |
| cis-Vitamin K1 | cis-Vitamin K1 (cis-Phylloquinone) | High-purity cis-Vitamin K1 for research. Study coagulation, bone metabolism, and redox processes. This product is for Research Use Only (RUO). Not for human or veterinary use. |
| Raspberry ketone | 4-(4-Hydroxyphenyl)-2-butanone|Raspberry Ketone |
UHPLC-MS/MS has firmly established itself as a central and indispensable technology in modern lipid profiling. Its unparalleled ability to separate and characterize complex lipidomes with high sensitivity and precision fuels advancements across biomedical research, from uncovering the metabolic underpinnings of disease to the discovery and validation of clinical biomarkers. The continuous refinement of protocols—including robust sample preparation, sophisticated chromatographic separations, and innovative strategies like chemical derivatization—ensures that lipidomics will remain at the forefront of systems biology and personalized medicine. As the technology progresses, particularly toward single-cell applications, UHPLC-MS/MS will continue to provide deeper, more nuanced insights into the role of lipids in health and disease.
Lipidomics, the large-scale study of lipid pathways and networks, has become an indispensable tool for understanding the molecular basis of numerous pathological conditions. Lipids are involved in nearly all aspects of cellular function, serving as structural membrane components, energy storage molecules, and signaling mediators [24]. The dysregulation of lipid metabolism has been implicated across a spectrum of diseases, including cardiovascular diseases (CVDs), neurodegenerative disorders, and various metabolic conditions [25] [26] [24]. Advances in ultra-performance liquid chromatography tandem mass spectrometry (UPLC-MS/MS) have dramatically enhanced our ability to characterize lipidomic signatures associated with these diseases, providing insights into disease mechanisms and revealing potential diagnostic biomarkers and therapeutic targets [25] [24] [27].
The following sections detail the specific lipidomic alterations found in major disease categories, present standardized protocols for UPLC-MS/MS lipid analysis, and visualize the key experimental and metabolic pathways involved.
Lipidomic Alterations in Major Disease Categories
Comprehensive lipid profiling has revealed distinct alterations across cardiovascular, neurodegenerative, and metabolic disorders. The tables below summarize key lipid species and their documented changes in human studies.
Table 1: Lipidomic Biomarkers in Cardiovascular Disease
| Lipid Class | Specific Lipid Species | Alteration in CVD | Associated Condition | Potential Clinical Utility |
|---|---|---|---|---|
| Ceramides (Cer) | Specific ceramide species | Increased | Myocardial Infarction, Heart Failure | Risk prediction, prognostic stratification [25] |
| Lysophospholipids | Lysophosphatidylcholines | Altered | Atherosclerosis, Calcific Aortic Valve Stenosis [25] | Understanding disease progression |
| Cholesterol Esters (CE) | --- | --- | --- | Component of atherogenic particles [27] |
| Triglycerides (TG) | Remnant particles | Increased | Residual Cardiovascular Risk [27] | Independent risk biomarker |
Table 2: Lipidomic Disruptions in Neurodegenerative Diseases
| Lipid Class | Specific Alteration | Associated Disease | Biological Context | Significance |
|---|---|---|---|---|
| Cholesterol Esters (CE) | Accumulation | Alzheimer's Disease (AD) | Astrocytes (ApoE4 genotype) & whole brain tissue [26] | Linked to ApoE4, major genetic risk factor [26] |
| Triacylglycerides (TG) | Accumulation | Alzheimer's Disease (AD) | ApoE4 Astrocytes [26] | Indicator of dysregulated lipid metabolism [26] |
| Phosphatidylcholine (PC) | Most abundant class | Brain tissue | Neurons, Astrocytes, Microglia [26] | Major membrane lipid |
| Phosphatidylethanolamine (PE) | Highly abundant | Brain tissue | Neurons, Astrocytes, Microglia [26] | Major membrane lipid |
| Sphingomyelins (SM) | Highly abundant in microglia | Brain tissue | Microglia [26] | Cell-type specific lipotype |
Table 3: Emerging Lipidomic Applications
| Area | Key Findings/Technologies | Application |
|---|---|---|
| Single-Cell Lipidomics | Capillary sampling coupled with LC-MS; reveals cell-to-cell heterogeneity [2] [3] | Cancer, Diabetes, Infectious Disease [3] |
| Microscale Workflows | Integrated LC-HRMS from 10 µL serum; 440+ lipid species [4] | High-throughput clinical biomarker discovery [4] |
| Technology Integration | AI (MS2Lipid: 97.4% subclass accuracy); Ion Mobility; Polarity Switching [24] [3] | Enhanced lipid identification & data quality [24] [3] |
Experimental Protocols for UPLC-MS/MS Lipidomics
Standard Bulk Lipidomics Protocol for Serum/Plasma
This protocol is designed for robust lipid extraction and analysis from biofluids such as serum or plasma, suitable for clinical cohort studies [24] [4].
Sample Preparation:
- Start with a minimal volume of 10 µL of serum or plasma [4].
- Perform a simplified liquid-liquid extraction using a 1:1 (v/v) mixture of methanol and methyl tert-butyl ether (MTBE) [4].
- Spike the extraction solvent with a Splash LipidoMix internal standard mixture or equivalent prior to extraction to correct for technical variability [3].
- Vortex mix thoroughly, incubate on a shaker, and centrifuge to separate phases. Collect the organic (upper) layer containing the lipids.
UPLC-MS/MS Analysis:
- Chromatography: Utilize a reversed-phase C18 column (e.g., 1.7 µm, 2.1 x 100 mm). Employ a binary gradient with a total run time of 15-20 minutes. Mobile phase A is often water/acetonitrile (e.g., 40:60, v/v) with 10 mM ammonium formate. Mobile phase B is isopropanol/acetonitrile (e.g., 90:10, v/v) with 10 mM ammonium formate [4].
- Mass Spectrometry: Operate the mass spectrometer in data-dependent acquisition (DDA) mode with positive/negative polarity switching. Use a high-resolution mass analyzer (e.g., Orbitrap, Q-TOF). MS1 resolution should be ≥60,000, with a top-N (e.g., 4-10) data-dependent MS2 scan strategy at a resolution of ≥15,000. Higher-energy Collisional Dissociation (HCD) collision energy can be set to 25-35 V [3].
Data Processing:
Advanced Protocol: Single-Cell Lipidomics via Capillary Sampling
This protocol enables lipidomic profiling of individual mammalian cells, capturing cellular heterogeneity [2] [3].
Single-Cell Isolation:
- Use an automated single-cell sampling system (e.g., Yokogawa SS2000 Single Cellome System) or manual capillary sampling under microscope observation.
- Employ 10 µm capillaries for cell aspiration. Apply controlled pressures (e.g., sampling pressure of ~14 kPa) to isolate living single cells from culture [3].
- Critical parameters to control include aspiration volume and the use of appropriate capillary tip type to preserve sensitivity. Temperature and humidity control (e.g., 37°C, 5% CO2) maintain cell viability during the process [2].
Sample Processing:
- Immediately freeze the capillary tips on dry ice after sampling.
- Backfill the capillaries with a small volume (e.g., 5 µL) of a cold lysis solvent, typically a mixture of isopropanol, water, and acetonitrile (e.g., 51:62:87), spiked with internal standards [3].
- Use a gas syringe to transfer the lysate into an LC-MS vial. For nano-flow LC-MS, samples may be freeze-dried and reconstituted in a smaller volume [3].
Nano-UPLC-MS/MS Analysis:
- Chromatography: Use a nano-flow LC system with a nanoelectrospray ion source. Employ a reversed-phase C18 column with a low flow rate (e.g., 300 nL/min).
- Mass Spectrometry: The system should be optimized for high sensitivity. Methods may include ion mobility spectrometry for added separation and electron-activated dissociation (EAD) for improved structural elucidation of lipids [3].
Visualizing Lipidomics Workflows and Pathways
The following diagrams illustrate the core experimental workflow and a key disease-relevant pathway discovered through lipidomics.
Lipidomics Experimental Workflow
Diagram 1: Core Lipidomics Workflow. This diagram outlines the key stages from sample preparation to biological interpretation.
ApoE4-Driven Lipid Disruption in Alzheimer's Disease
Diagram 2: ApoE4 Lipid Disruption in Alzheimer's Disease. This pathway shows how the APOE4 genotype leads to lipid accumulation and altered immune function in astrocytes, contributing to disease pathogenesis [26].
The Scientist's Toolkit: Essential Research Reagents and Materials
Successful lipidomics studies rely on a suite of specialized reagents and analytical tools. The following table lists key solutions for a typical UPLC-MS/MS based lipidomics workflow.
Table 4: Essential Research Reagent Solutions for UPLC-MS/MS Lipidomics
| Item Name | Function/Description | Application Note |
|---|---|---|
| Splash LipidoMix / EquiSPLASH | Quantified mixture of synthetic lipid standards across multiple classes. | Used as internal standard for semi-quantitative analysis; corrects for extraction and ionization variability [3]. |
| Methyl tert-butyl ether (MTBE) | Organic solvent for liquid-liquid lipid extraction. | Used in methanol/MTBE (1:1) protocol for efficient, simple lipid extraction from serum or tissues [4]. |
| Ammonium Formate / Acetate | Volatile buffer salt for LC mobile phase. | Enhances ionization efficiency in ESI-MS and helps form stable adducts for clearer lipid identification [4]. |
| C18 UPLC Columns | Reversed-phase chromatography columns with small particle sizes (e.g., 1.7-1.8 µm). | Provides high-resolution separation of complex lipid mixtures prior to MS detection. |
| Heated Electrospray Ionization (HESI) Probe | Ionization source for the mass spectrometer. | Robustly generates gas-phase ions from the UPLC eluent for mass analysis. |
| Porous Tip Capillaries (10 µm) | Capillaries for automated or manual single-cell picking. | Enables gentle, precise aspiration of single live cells for single-cell lipidomics [2] [3]. |
| Alnustone (Standard) | Alnustone | Alnustone, a natural diarylheptanoid for MASLD/MASH, cancer, and thrombocytopenia research. For Research Use Only. Not for human consumption. |
| Zinc Protoporphyrin | Zinc Protoporphyrin, CAS:15442-64-5, MF:C34H32N4O4Zn, MW:626.0 g/mol | Chemical Reagent |
Lipids are crucial biological molecules that play multiple vital roles in mammalian organisms, including cellular membrane anchoring, signal transduction, material trafficking, and energy storage [28]. Driven by the biological significance of lipids, lipidomics has emerged as a prominent science within the field of omics, aiming for the panoramic analysis of the lipidome in biological systems and the detection of subtle changes in individual lipids in response to internal and external stimuli [28]. The structural complexity of lipids, arising from variations in head groups, fatty acyl chain length, unsaturation levels, and covalent bond types, poses significant analytical challenges [28]. This application note provides a comprehensive framework for designing a robust lipidomics study, focusing on a targeted ultra-high performance liquid chromatography-tandem mass spectrometry (UHPLC-MS/MS) workflow to achieve accurate identification and quantification of lipid species in biological samples.
Core Study Design and Workflow
A well-structured lipidomics study begins with a clear hypothesis and proceeds through a series of validated steps to ensure data quality and biological relevance. The fundamental workflow encompasses hypothesis generation, sample preparation, chromatographic separation, mass spectrometric analysis, data processing, and statistical interpretation. Utilizing pooled quality control (PQC) samples and long-term references (LTR) is critical for monitoring analytical performance and ensuring data reproducibility throughout the acquisition sequence [29]. The following diagram outlines the core logical workflow for a typical targeted lipidomics study.
Analytical Strategy: Targeted Lipidomics
Targeted lipidomics focuses on the precise identification and accurate quantification of a predefined set of lipid molecules, offering high sensitivity, specificity, and a broad dynamic range [28]. This approach is particularly powerful for validating potential biomarkers and answering specific biological questions. The selection between untargeted, targeted, and pseudotargeted strategies should be guided by the specific research aims [28].
Key Considerations for Method Selection
- Lipid Coverage vs. Specificity: Targeted methods excel at quantifying specific lipid classes and species, even at low abundances, but require a priori knowledge of the lipids of interest [28].
- Quantitative Accuracy: The use of internal standards is non-negotiable for accurate quantification, correcting for variations in sample preparation, ionization efficiency, and instrument response [28].
- Throughput: The described RP-UHPLC/MS method allows for high-throughput analysis with a total run time of 25 minutes, enabling the quantitation of lipids from 23 subclasses [30].
Experimental Protocol: A Detailed Workflow
Sample Preparation Protocol
Principle: Consistent and reproducible sample preparation is critical for reliable lipidomic data. This protocol is optimized for human plasma or serum but can be adapted for other biological matrices.
Procedure:
- Protein Precipitation and Lipid Extraction:
- Pipette 10-50 µL of plasma/serum into a glass tube.
- Spike with a known amount of synthetic internal standard mixture (SPLASH LIPIDOMIX or equivalent) covering the lipid classes of interest [28].
- Add 1 mL of cold methanol and vortex vigorously for 10 seconds.
- Add 3 mL of methyl-tert-butyl ether (MTBE) and shake for 1 hour at room temperature.
- Induce phase separation by adding 0.75 mL of water. Centrifuge at 2,000 RCF for 10 minutes.
- Collect the upper (organic) layer and evaporate to dryness under a gentle stream of nitrogen.
- Reconstitute the dried lipid extract in 100-200 µL of a suitable solvent mixture (e.g., chloroform:methanol, 1:1 or 2:1 v/v) for MS analysis.
UHPLC-MS/MS Analysis Protocol
Principle: Reversed-phase chromatography separates lipids based on their hydrophobicity (acyl chain length and unsaturation), followed by sensitive and specific detection using a triple quadrupole mass spectrometer in Multiple Reaction Monitoring (MRM) mode [30].
Chromatographic Conditions:
- Column: C18 bridged ethylene hybrid (BEH), 150 mm × 2.1 mm, 1.7 µm particle size [30].
- Mobile Phase A: 10 mM ammonium acetate in acetonitrile/water (60:40, v/v).
- Mobile Phase B: 10 mM ammonium acetate in isopropanol/acetonitrile (90:10, v/v).
- Gradient Program:
Time (min) % B Flow Rate (mL/min) 0.0 30 0.3 2.0 30 0.3 5.0 60 0.3 15.0 99 0.3 20.0 99 0.3 20.1 30 0.3 25.0 30 0.3 - Column Temperature: 55 °C
- Injection Volume: 1-5 µL
Mass Spectrometric Conditions:
- Instrument: Triple quadrupole mass spectrometer.
- Ionization Mode: Electrospray Ionization (ESI), positive ion mode.
- Detection Mode: Multiple Reaction Monitoring (MRM). Specific precursor ion → product ion transitions must be defined for each target lipid and their corresponding internal standards.
- Source Parameters (optimize for specific instrument):
- Ion Spray Voltage: 5500 V
- Source Temperature: 500 °C
- Nebulizer Gas (GS1): 50 psi
- Heater Gas (GS2): 60 psi
Data Processing and Quality Control Protocol
Principle: Analytical quality control is paramount to assess and ensure data reliability throughout the sequence. Using commercial plasma as a surrogate for pooled study samples for quality control has been evaluated as a viable strategy [29].
Procedure:
- Data Acquisition: Use instrument software to acquire MRM data.
- Peak Integration and Review: Process raw data using specialized software (e.g., Skyline) for peak integration, identification, and quantitation [30].
- Quality Control Implementation:
- Pooled Quality Control (PQC): Create a pooled sample from all study samples and inject it at regular intervals (e.g., every 5-10 samples) throughout the analytical run [29].
- Surrogate Quality Control (sQC): If sample volume is limited, commercial plasma can be used as a surrogate QC material [29].
- Acceptance Criteria: Monitor the retention time stability and peak area of key lipids in the QC samples. The relative standard deviation (RSD%) of peak areas for major lipid species in QC samples should typically be <15%.
Key Research Reagents and Materials
The following table details essential materials and reagents required for the successful execution of the described targeted lipidomics protocol.
Table 1: Essential Research Reagent Solutions for Targeted Lipidomics
| Item | Function / Application | Specification / Example |
|---|---|---|
| Internal Standard Mix | Corrects for losses during preparation and variations in MS response; enables accurate quantification [28]. | SPLASH LIPIDOMIX, or a custom mix of odd-chain or deuterated lipids covering relevant classes (e.g., PC(15:0/18:1-d7), SM(d18:1/12:0)). |
| LC-MS Grade Solvents | Used for mobile phases and sample extraction to minimize background noise and ion suppression. | Acetonitrile, Isopropanol, Methanol, Methyl-tert-butyl ether (MTBE). |
| Ammonium Acetate | Mobile phase additive that promotes the formation of adducts ([M+NH4]+ or [M+AC]-) for stable and efficient ionization in MS. | LC-MS Grade, 10 mM concentration in mobile phases. |
| C18 BEH UHPLC Column | Provides high-efficiency separation of complex lipid mixtures, resolving isobaric and isomeric lipid forms [30]. | 150 mm x 2.1 mm, 1.7 µm particle size. |
| Commercial Reference Plasma | Serves as a surrogate quality control (sQC) material to monitor analytical performance and system stability over time [29]. | Commercially available human plasma from pooled donors. |
Data Presentation and Analysis
Effective presentation of quantitative data is critical for interpreting and communicating lipidomic findings. While charts are excellent for showing trends and patterns, tables are superior for presenting detailed, precise numerical data, which is essential for scientific analysis and reporting [31] [32].
Summarizing Quantitative Results
The following table provides a template for presenting quantitative results from a hypothetical lipidomics study, illustrating the clear structure and precise values that tables offer.
Table 2: Quantitative Analysis of Major Glycerophospholipid Classes in Human Plasma (n=10). Data presented as mean concentration (µM) ± standard deviation.
| Lipid Class | Control Group | Disease Group | p-value | % Change |
|---|---|---|---|---|
| PC | 1250.4 ± 105.7 | 1055.8 ± 98.3 | 0.003 | -15.6% |
| PE | 255.3 ± 30.1 | 310.5 ± 35.6 | 0.015 | +21.6% |
| PI | 45.2 ± 5.8 | 38.9 ± 4.5 | 0.032 | -13.9% |
| PS | 88.7 ± 9.4 | 95.1 ± 10.2 | 0.215 | +7.2% |
| SM | 405.6 ± 40.3 | 485.9 ± 45.1 | 0.008 | +19.8% |
Analytical Quality Control Data
Presenting QC data is mandatory to demonstrate the robustness of the analytical run. The table below exemplifies how to summarize key QC metrics.
Table 3: Quality Control Metrics for the UHPLC-MS/MS Analytical Sequence
| Lipid Class (Example) | Retention Time RSD% (n=15 QC injections) | Peak Area RSD% (n=15 QC injections) | Acceptable Threshold (Typical) |
|---|---|---|---|
| PC(34:1) | 0.15% | 4.5% | < 2% / < 15% |
| PE(36:2) | 0.18% | 6.2% | < 2% / < 15% |
| SM(d18:1/16:0) | 0.22% | 5.8% | < 2% / < 15% |
This application note provides a detailed protocol for designing and executing a targeted lipidomics study from initial hypothesis to analytical strategy. The core of this workflow is a robust, high-throughput RP-UHPLC-MS/MS method that enables the reliable quantitation of a wide range of lipid species. By adhering to rigorous sample preparation, employing stable isotope-labeled internal standards for accurate quantification, and implementing a thorough quality control regime using pooled or surrogate QC samples, researchers can generate high-quality, reproducible lipidomic data. This structured approach is essential for advancing our understanding of lipid biology and its role in health and disease.
A Step-by-Step UHPLC-MS/MS Lipidomics Workflow: From Sample to Data
In ultra-performance liquid chromatography tandem mass spectrometry (UPLC-MS/MS) lipidomics, the reliability of biological data is profoundly influenced by pre-analytical procedures. Sample collection, handling, and storage introduce significant variability that can compromise data integrity and subsequent biological interpretation [33]. This application note details standardized protocols for critical pre-analytical steps, framed within a broader thesis on UPLC-MS/MS lipidomics protocol research. We provide evidence-based, detailed methodologies to ensure the generation of high-quality, reproducible lipidomic data for researchers, scientists, and drug development professionals.
Critical Pre-analytical Phase in Lipidomics
The pre-analytical phase is the most vulnerable stage in the lipidomics workflow, with studies indicating that 60-80% of laboratory testing errors originate during sample collection, processing, and storage [34]. Lipids are dynamic metabolites; their ex vivo stability varies significantly across molecular classes. Pre-analytical handling of whole blood is particularly critical, as it constitutes a "liquid tissue" containing trillions of metabolically active cells that can rapidly alter lipid abundances after collection [35]. Standardizing this phase is therefore a prerequisite for accurate biomarker discovery and validation.
Protocols for Blood Collection and Initial Handling
Materials and Reagents
- Blood Collection Tubes: K3EDTA tubes are recommended for plasma preparation. Tripotassium ethylenediaminetetraacetic acid (K3EDTA) acts as an anticoagulant by chelating calcium ions, preventing coagulation and preserving lipid integrity [33].
- Cooling Equipment: Pre-chilled racks or cooling boxes maintained at 2-8°C for immediate sample cooling.
- Timer: For accurate tracking of processing intervals.
Step-by-Step Procedure
- Collection: Draw blood via venipuncture using a standardized technique into K3EDTA tubes.
- Immediate Cooling: Immediately after collection, place the whole blood tubes in a cooling box or rack maintained at 2-8°C. This step is critical to slow down cellular metabolism [35].
- Aliquoting (if required): If the protocol necessitates aliquoting of whole blood, perform this step swiftly within 5 minutes of collection, keeping samples cooled [35].
- Centrifugation: Centrifuge the cooled whole blood at 4°C for 7 minutes at 3,100 g to separate plasma from blood cells [35].
- Plasma Transfer: Carefully transfer the supernatant (plasma) into pre-labeled cryovials using a pipette, avoiding the buffy coat and cell pellet.
- Immediate Storage: Snap-freeze the plasma aliquots and store them at -80°C until further analysis.
Stability of Lipids in Whole Blood: Quantitative Assessment
The ex vivo stability of 417 lipid species in EDTA whole blood was systematically investigated under various temperatures and time points. Table 1 summarizes the number of stable lipid species after 24-hour exposure, demonstrating that cooling significantly preserves lipid integrity [35].
Table 1: Stability of Lipid Species in EDTA Whole Blood After 24-Hour Exposure
| Storage Temperature | Number of Robust Lipid Species (out of 417) | Notably Unstable Lipid Classes |
|---|---|---|
| 4°C (Cooled) | Data not explicitly stated as robust, but recommended condition | Data not explicitly stated |
| 21°C (Room Temperature) | 325 | Free Fatty Acids (FA), Lysophosphatidylethanolamine (LPE), Lysophosphatidylcholine (LPC) |
| 30°C (Summer Conditions) | 288 | Free Fatty Acids (FA), Lysophosphatidylethanolamine (LPE), Lysophosphatidylcholine (LPC) |
Based on this large-scale study, the following evidence-based recommendation is made: Cool whole blood at once and permanently. Plasma should be separated by centrifugation within 4 hours of blood draw to ensure the integrity of a broad range of lipids, unless the research focus is exclusively on the identified robust lipid species [35].
Standardized Plasma Thawing Protocol
Thawing frozen plasma samples is a critical pre-analytical step that is often overlooked. An optimized protocol using experimental design methodology has been established to minimize variability.
Materials and Reagents
- Water Bath or Incubator: Capable of maintaining 4°C.
- Ultrasonic Bath (Optional): For the proposed ultrasound thawing method.
- Cryovials: Containing frozen plasma aliquots (recommended volume: 0.25 mL).
Step-by-Step Procedure
- Temperature Setting: Set the water bath or incubator to 4°C.
- Rapid Thawing: Remove the plasma sample from the -80°C freezer and immediately place it in the 4°C environment.
- Recommended Method: For optimal results, employ ultrasound (US) thawing at 4°C. This method is quicker, increases detection sensitivity, and allows more lipid features to be identified compared to conventional thawing [34] [36].
- Post-Thaw Handling: Once thawed, keep the sample on ice or in a refrigerated centrifuge and proceed with lipid extraction immediately. Avoid multiple freeze-thaw cycles.
Lipid Extraction for UPLC-MS/MS Analysis
A robust liquid-liquid extraction method is fundamental for comprehensive lipidomic profiling.
Research Reagent Solutions
Table 2: Essential Reagents for Lipid Extraction from Plasma
| Reagent | Function / Role in Workflow |
|---|---|
| Methyl tert-butyl ether (MTBE) | Primary extraction solvent; facilitates liquid-liquid partitioning in the Folch-based method [35] [17]. |
| Methanol (MeOH) | Used with water to create a binary solvent system with MTBE; improves extraction efficiency and lipid recovery [35]. |
| Internal Standards (IS) | Deuterated or odd-chain lipid standards (e.g., PC 15:0/15:0, SM d18:1/12:0); correct for extraction efficiency, matrix effects, and instrument variability [35] [17]. |
| Ammonium Acetate | Mobile phase additive in LC-MS; promotes efficient and stable electrospray ionization for phospholipids [20] [16]. |
| Chloroform | Traditional solvent in Folch extraction; sometimes used in combination with methanol for specific sample types [16]. |
Step-by-Step Procedure
- Aliquot Plasma: Pipette 50 μL of thawed plasma into a glass tube.
- Add Internal Standards: Spike with 300 μL of methanol containing a mixture of internal standards covering multiple lipid classes [35].
- Vortex: Mix vigorously for 30 seconds.
- Lipid Extraction: Add 1 mL of MTBE, vortex the mixture for 30 minutes at room temperature.
- Phase Separation: Add 250 μL of water to induce phase separation. Vortex for 30 seconds and incubate at 4°C for 10 minutes.
- Centrifugation: Centrifuge at 5,000 g at 4°C for 10 minutes.
- Collection: Collect the upper organic layer (which contains the lipids) and evaporate it to dryness under a gentle stream of nitrogen or in a vacuum concentrator.
- Reconstitution: Reconstitute the dried lipid extract in 30 μL of chloroform/methanol (2:1, v/v), followed by dilution with acetonitrile/isopropanol/water (65:30:5, v/v/v) containing 5 mM ammonium acetate, ready for UPLC-MS/MS analysis [35].
Workflow Visualization and Standardization Initiatives
The following diagram summarizes the complete standardized pre-analytical workflow for plasma lipidomics, integrating the critical steps described in this document.
International efforts are ongoing to harmonize pre-analytical practices. The Lipidomics Standard Initiative (LSI), in collaboration with LIPID MAPS, aims to create community-based guidelines for sample collection, storage, and data reporting to enhance inter-laboratory comparability and data reliability [35] [37].
Standardization of pre-analytical steps is non-negotiable for generating robust and reproducible UPLC-MS/MS lipidomics data. The protocols detailed herein—covering blood collection, plasma separation, storage, and thawing—provide a critical foundation for reliable biomarker discovery and clinical research. Adherence to these evidence-based guidelines, coupled with the use of appropriate reagents and quality controls, will significantly reduce pre-analytical variance and pave the way for accurate biological insights in lipidomics studies.
In lipidomics research utilizing ultra-performance liquid chromatography tandem mass spectrometry (UPLC-MS/MS), the sample preparation step is paramount. The efficiency and reproducibility of lipid extraction directly influence the coverage, identification, and quantification of lipids in a biological system [38] [39]. While many solvent systems exist, the methods by Bligh & Dyer, Folch, and Matyash (MTBE) are among the most prevalent for untargeted lipidomics. Originally tailored to specific matrices—fish muscle, brain tissue, and E. coli, respectively—their application to other sample types like human plasma requires careful optimization to ensure maximal lipid recovery [38] [40]. This application note provides a detailed, comparative analysis of these three methods, focusing on their use in UPLC-MS/MS lipidomics workflows for human plasma. We summarize optimized parameters, provide detailed protocols, and offer data-driven recommendations to guide researchers in selecting the most appropriate extraction technique.
Comparative Analysis of Lipid Extraction Methods
The selection of an extraction method involves trade-offs between lipid recovery, safety, convenience, and compatibility with the sample matrix and downstream analysis. The following table summarizes the key characteristics of the three methods based on recent optimization studies.
Table 1: Comparison of Optimized Lipid Extraction Methods for Plasma Lipidomics
| Feature | Bligh & Dyer Method | Folch Method | Matyash (MTBE) Method |
|---|---|---|---|
| Original Solvent Ratios (CHCl₃:MeOH:H₂O) | 2:2:1.8 (v/v/v) [38] | 8:4:3 (v/v/v) [38] | MTBE:MeOH:H₂O 10:3:2.5 (v/v/v) [38] [41] |
| Recommended Sample-to-Solvent Ratio for Plasma | 1:20 (v/v) [38] [42] [40] | 1:20 (v/v) [38] [42] [40] | 1:20 (v/v) [38] |
| Organic Solvent | Chloroform (CHCl₃) | Chloroform (CHCl₃) | Methyl tert-butyl ether (MTBE) |
| Phase Separation | Biphasic (Organic layer on bottom) [38] | Biphasic (Organic layer on bottom) [38] | Biphasic (Organic layer on top) [41] [43] |
| Key Advantages | High recovery for diverse lipid classes in plasma; reduced chloroform vs. Folch [38] | Considered "gold standard"; high lipid recovery [38] [41] | Safer profile; cleaner extracts; easier collection of organic phase [41] [43] |
| Key Disadvantages | Use of toxic chloroform; more difficult organic phase collection [38] | Use of toxic chloroform; highest solvent volume [38] | May yield lower peak areas for some lipid classes compared to chloroform-based methods [38] |
| Multi-Omic Capability | Yes (Organic phase for lipids, aqueous for metabolites) [38] | Yes (Organic phase for lipids, aqueous for metabolites) [38] | Yes (Organic phase for lipids, aqueous for metabolites) [38] |
Performance Note: A rigorous comparison for human plasma demonstrated that the Bligh-Dyer and Folch methods yielded the highest peak areas for a diverse range of lipid and metabolite species across various sample-to-solvent ratios [38] [42]. The 1:20 (v/v) plasma-to-total solvent ratio was identified as optimal for these methods in plasma-based studies [38] [40].
Detailed Experimental Protocols
The following sections provide step-by-step protocols for each lipid extraction method. It is recommended to use ice-cold solvents and perform the extraction in a fume hood.
Protocol 1: Bligh & Dyer Extraction (Optimized for Plasma)
This protocol is adapted for a starting volume of 50 µL of human plasma [38].
- Sample Preparation: Piper 50 µL of plasma into a glass tube with a Teflon-lined cap.
- Methanol Addition: Add 200 µL of ice-cold methanol (containing internal standards). Vortex vigorously for 10-30 seconds to mix and denature proteins.
- Chloroform Addition: Add 100 µL of ice-cold chloroform. Vortex vigorously for 10-30 seconds.
- Aqueous Addition: Add 100 µL of water (LC-MS grade). Vortex vigorously for 10-30 seconds. The total solvent volume is 400 µL, achieving a 1:8 sample-to-solvent ratio and a final Bligh & Dyer ratio of 2:2:1.8 (CHCl₃:MeOH:H₂O).
- Phase Separation: Centrifuge the mixture at ~2,000 g for 10 minutes to achieve clear phase separation. The lower organic phase will contain the lipids.
- Organic Phase Collection: Carefully collect the lower organic (chloroform) phase using a glass syringe or pipette, taking care not to disturb the protein interphase.
- Drying and Reconstitution: Transfer the organic phase to a new vial and dry under a gentle stream of nitrogen or in a vacuum centrifuge. Reconstitute the dried lipids in an appropriate UPLC-MS/MS compatible solvent (e.g., 50-100 µL of acetonitrile/isopropanol/water, 65:30:5, v/v/v) [44].
Protocol 2: Folch Extraction (Optimized for Plasma)
This protocol is adapted for a starting volume of 50 µL of human plasma [38].
- Sample Preparation: Piper 50 µL of plasma into a glass tube with a Teflon-lined cap.
- Chloroform/Methanol Addition: Add 1 mL of a pre-mixed chloroform:methanol (2:1, v/v) solution (containing internal standards). Vortex vigorously for 10-30 seconds. The total solvent volume is 1 mL, achieving a 1:20 sample-to-solvent ratio.
- Phase Induction: Add 250 µL of water (LC-MS grade) or a saline solution (e.g., 0.9% NaCl). Vortex vigorously. The final Folch ratio is 8:4:3 (CHCl₃:MeOH:H₂O).
- Phase Separation: Centrifuge the mixture at ~2,000 g for 10 minutes. The lower organic phase contains the lipids.
- Organic Phase Collection: Carefully collect the lower organic phase.
- Drying and Reconstitution: Dry the organic phase and reconstitute as described in the Bligh & Dyer protocol.
Protocol 3: Matyash (MTBE) Extraction
This protocol is a common adaptation for general use, including plasma [41] [44].
- Sample Preparation: Piper the sample (e.g., 50 µL of plasma) into a glass tube.
- Methanol Addition: Add 200 µL of ice-cold methanol (containing internal standards). Vortex vigorously for 10-30 seconds.
- MTBE Addition: Add 800 µL of ice-cold MTBE. Vortex and incubate for 1 hour at room temperature in a shaker [41].
- Phase Induction: Add 200 µL of water (LC-MS grade). Vortex for 10-30 seconds.
- Phase Separation: Centrifuge at 1,000-10,000 g for 10 minutes. The upper organic phase will contain the lipids [41] [44].
- Organic Phase Collection: Collect the upper (MTBE) organic phase.
- Drying and Reconstitution: Dry the organic phase and reconstitute as described previously.
Decision Workflow for Method Selection
The following diagram illustrates the logical process for selecting the most appropriate lipid extraction method based on research priorities.
The Scientist's Toolkit: Essential Research Reagents
Table 2: Key Reagents and Materials for Lipid Extraction and UPLC-MS/MS Analysis
| Item | Function/Application | Example Sources |
|---|---|---|
| Chloroform | Non-polar solvent for efficient extraction of neutral and complex lipids. | Fisher-Scientific, Sigma-Aldrich [38] |
| Methanol (MeOH) | Polar solvent to disrupt lipid-protein complexes and precipitate proteins. | Fisher-Scientific, Sigma-Aldrich [38] |
| Methyl-tert-butyl ether (MTBE) | Less-toxic alternative to chloroform; forms upper organic phase. | Sigma-Aldrich [41] [44] |
| 1-Butanol | Component of single-phase extraction methods (e.g., Alshehry). | APS, Thermo Fisher [43] |
| Synthetic Lipid Standards | For quantification, quality control, and monitoring extraction recovery. | Avanti Polar Lipids, Sigma-Aldrich [38] [20] [43] |
| Internal Standards (Deuterated) | Correct for variability in extraction efficiency and MS ionization. | Avanti Polar Lipids (e.g., SPLASH Lipidomix) [43] |
| Ammonium Acetate/Formate | Mobile phase additive to promote ionization in LC-MS, especially in positive mode. | Fluka, Honeywell [41] [43] |
| Formic Acid | Mobile phase additive for ionization, typically in positive ion mode. | Fisher-Scientific, EMD Technologies [38] [45] |
| UPLC-MS/MS Solvents | LC-MS grade water, acetonitrile, and isopropanol for mobile phases and sample reconstitution. | Fisher Optima LC/MS grade [38] [44] |
| 3-Hydroxychimaphilin | 2-Hydroxy-3,6-dimethylnaphthalene-1,4-dione|CAS 33253-99-5 | High-purity 2-Hydroxy-3,6-dimethylnaphthalene-1,4-dione (CAS 33253-99-5) for research. Explore its applications in medicinal chemistry and chemical biology. For Research Use Only. Not for human or veterinary use. |
| Chloculol | Chloculol, CAS:131652-35-2, MF:C15H15ClO4, MW:294.73 g/mol | Chemical Reagent |
The choice between Bligh & Dyer, Folch, and MTBE extraction protocols is not trivial and significantly impacts the outcomes of a UPLC-MS/MS lipidomics study. For work with human plasma where maximizing lipid recovery is the primary objective, the Bligh & Dyer method at a 1:20 (v/v) sample-to-solvent ratio is highly recommended, based on its superior performance in direct comparisons [38] [42]. However, if safety and ease of collection are prioritized, the Matyash (MTBE) method provides a robust and cleaner alternative, albeit with potentially lower signal intensities for some lipid classes. The classical Folch method remains a reliable "gold standard" but may be superseded by Bligh & Dyer's efficiency for plasma applications. By adhering to the optimized protocols and considerations outlined in this application note, researchers can ensure the generation of high-quality, reproducible lipidomic data integral to biomarker discovery and drug development.
Ultra-High-Performance Liquid Chromatography (UHPLC) has become an indispensable tool in modern analytical science, particularly for the analysis of complex biological samples such as lipidomes. The technique offers significant advantages over traditional HPLC, including superior speed, resolution, and sensitivity [46]. These benefits are primarily driven by the use of columns packed with sub-2 μm particles and systems capable of operating at significantly higher pressures [47]. For lipidomics research, where samples contain a vast array of molecules with diverse physicochemical properties, a systematically developed UHPLC method is crucial for achieving comprehensive analysis.
The inherent complexity of biological matrices presents substantial challenges for UHPLC analysis. The "matrix effect," where co-eluting biomolecules interfere with the ionization of target analytes, can lead to signal suppression or enhancement and erroneous quantification [46]. Furthermore, the structural diversity of lipids, varying in polarity, chain length, and degree of unsaturation, makes achieving optimal chromatographic separation particularly challenging [46]. This application note details a systematic framework for developing robust UHPLC methods tailored specifically for tandem mass spectrometry lipidomics protocols, focusing on the critical parameters of column selection, mobile phase optimization, and gradient design.
Critical Parameters for UHPLC Method Development in Lipidomics
Column Selection
The choice of column is the foundational step in UHPLC method development. For lipidomics applications, the stationary phase chemistry, particle size, and column dimensions must be carefully considered to achieve optimal separation efficiency.
Stationary Phase Chemistry: The hydrophobic-subtraction model characterizes over 400 commercially available reversed-phase columns based on five solute-column interactions, aiding in the selection of a column with appropriate selectivity [47]. The C18 bonded phase remains the most common choice for reversed-phase lipid separations. Charged Surface Hybrid (CSH) C18 columns are particularly valuable for lipidomics as they provide improved peak shape for acidic lipids and enhanced efficiency in LC-MS applications due to their surface charge technology [20]. For example, a targeted UHPLC-MS/MS method for quantifying medium-chain phosphatidylcholines in platelets utilized a CSH C18 column (1.7 µm, 130 Å) to achieve high sensitivity and selectivity [20].
Particle Size and Pore Size: Sub-2 μm particles are the standard for UHPLC, providing the high efficiency necessary for resolving complex lipid mixtures [47] [46]. A pore size of 130 Å to 175 Å is generally suitable for accommodating a wide range of lipid molecules.
Column Dimensions: Short columns (e.g., 50-100 mm) packed with sub-2 μm particles enable rapid method development and fast analyses without significant loss of resolution [47]. A common configuration for lipidomics is 100 mm × 2.1 mm, which offers a good balance between analysis time, resolution, and loading capacity [48] [49].
Table 1: UHPLC Column Selection Guide for Lipidomics
| Parameter | Recommended Choice | Rationale |
|---|---|---|
| Chemistry | CSH C18 or equivalent high-quality C18 | Improved peak shape for acidic lipids; enhanced MS sensitivity [20]. |
| Particle Size | Sub-2 μm (e.g., 1.7 μm) | Provides the efficiency and speed fundamental to UHPLC [47] [46]. |
| Pore Size | 130 Ã… - 175 Ã… | Suitable for the molecular size range of most lipids. |
| Dimensions | 100 mm × 2.1 mm | Offers an optimal compromise between speed, resolution, and capacity [48]. |
| Temperature | 40-65 °C | Can be optimized simultaneously with the gradient to improve selectivity [47]. |
Mobile Phase Composition
The mobile phase is a critical parameter that directly influences retention, selectivity, and mass spectrometric detection.
Solvent Selection: Acetonitrile is often preferred over methanol due to its lower viscosity, which results in lower backpressure and higher efficiency, and its superior UV transparency [50]. Isopropanol is a strong eluting solvent frequently used as a component in the organic phase for lipidomics, especially for more hydrophobic lipids [48] [20]. A typical lipidomic mobile phase system consists of water (aqueous phase) mixed with acetonitrile and isopropanol (organic phase) [48].
Buffers and pH Control: The use of volatile buffers is mandatory for LC-MS compatibility. Ammonium formate and ammonium acetate (typically at concentrations of 5-10 mM) are the most common additives. They help control pH and improve ionization efficiency [20]. Adjusting the pH can significantly alter the selectivity for ionizable lipids. A general recommendation is to keep the pH within ±1 unit of the analyte's pKa for optimal control [50]. For silica-based columns, the pH should be maintained between 2 and 8 to ensure column stability [50].
Additives: Formic acid is sometimes added to promote positive ionization. However, for negative ion mode, which is common for many phospholipids and fatty acids, plain ammonium salts or a small amount of ammonia may be used [20].
Table 2: Mobile Phase Optimization for Lipidomics
| Component | Common Choices & Concentrations | Function & Consideration |
|---|---|---|
| Aqueous Phase | Water + 5-10 mM ammonium acetate/formate | Dissolves analytes; buffer capacity controls ionization state. |
| Organic Phase | Acetonitrile/Isopropanol + 5-10 mM ammonium acetate/formate | Strong elution strength; MS-compatible. |
| pH Modifiers | Formic Acid, Ammonium Hydroxide | Fine-tunes selectivity for ionizable compounds; must be volatile. |
| Ideal pH Range | 2 - 8 (column dependent) | Maintains column integrity and controls analyte ionization. |
Gradient Optimization
Gradient elution is essential for lipidomics due to the wide polarity range of lipid classes. A well-designed gradient ensures that all analytes elute with adequate resolution in a reasonable time.
Initial Scouting Gradients: Method development often begins with two initial "basic runs"—a fast and a slow gradient—to model the separation landscape. For a 50 mm UHPLC column, basic gradients of 7 and 21 minutes can provide sufficient data for highly accurate computer modeling [47].
Computer-Assisted Modeling: Software tools like DryLab use data from a minimal number of initial experiments to model the "Design Space"—the multidimensional combination of input variables that provide assurance of quality [47] [51]. These programs can simultaneously optimize gradient time and column temperature, visualizing the critical resolution of peaks to be separated via resolution maps [47]. This approach can reduce method development time from weeks to a day or even a few hours [47].
Gradient Steepness and Shape: A case study on phenolic separation demonstrated that excessive gradient steepness can lead to poor resolution and unsatisfactory peak appearance [52]. Adjusting the gradient profile by reducing the elution rate and modifying specific segments for strongly retained compounds successfully resolved all peaks [52]. The final step in a gradient method should be a strong wash (e.g., 90-95% organic) to elute very hydrophobic lipids, followed by an adequate re-equilibration period with the initial mobile phase conditions.
Diagram 1: UHPLC Method Development Workflow
Experimental Protocol: UHPLC-MS/MS Lipidomics Analysis
This protocol provides a detailed methodology for the untargeted lipidomic analysis of biological samples, such as skin surface lipids or tissue extracts, based on established methods [48] [49].
Materials and Reagents
- UHPLC System: Ultra-high performance liquid chromatography system capable of handling pressures up to 1000 bar (e.g., Vanquish UHPLC system, Waters ACQUITY UHPLC Class I) [48] [49].
- Mass Spectrometer: High-resolution mass spectrometer, such as a Q-Exactive hybrid quadrupole-Orbitrap or a Xevo G2-XS Q-TOF [48] [49].
- Analytical Column: ACQUITY UPLC BEH C18 column (100 mm × 2.1 mm, 1.7 μm, Waters) or equivalent CSH C18 column [48] [20].
- Mobile Phase A: Acetonitrile/Water (e.g., 40:60 or 60:40, v/v) containing 10 mM ammonium formate [48] [20].
- Mobile Phase B: Isopropanol/Acetonitrile (e.g., 90:10, v/v) containing 10 mM ammonium formate [48] [20].
- Lipid Standards: Commercially available lipid standards for quality control and retention time alignment (e.g., PC(6:0/6:0), PC(8:0/8:0)) [20].
Table 3: Research Reagent Solutions for UHPLC-MS/MS Lipidomics
| Item | Function / Application | Key Characteristics |
|---|---|---|
| ACQUITY UPLC BEH C18 Column | Analytical separation of complex lipid mixtures. | 1.7 µm particles; 100 mm x 2.1 mm; high pressure stability [48]. |
| CSH C18 Column | Analytical separation, especially for phospholipids. | Charged surface technology for improved peak shape [20]. |
| Ammonium Acetate/Formate | Mobile phase additive for LC-MS. | Volatile buffer; aids ionization and controls pH [20]. |
| Isopropanol (LC-MS Grade) | Strong elution solvent in mobile phase B. | Elutes highly hydrophobic lipids; MS-compatible [48] [20]. |
| SIL-IS (Stable Isotope-Labeled Internal Standards) | Normalization for sample prep and ionization variability. | Corrects for matrix effects; essential for accurate quantification [46]. |
Detailed Step-by-Step Procedure
Sample Preparation:
- Extract total lipids from biological matrices (cells, tissue, plasma) using a validated method like a modified Folch or Bligh & Dyer extraction.
- Redissolve the dried lipid extract in a suitable solvent, such as Isopropanol:Methanol (1:1, v/v), to a final concentration of 1 mg/mL [48].
- Centrifuge at high speed (e.g., 14,000 × g for 10 minutes) to remove any insoluble debris.
- Transfer the supernatant to a certified LC-MS vial for analysis.
Instrument Setup and Method Configuration:
- Column Temperature: Set to 55 °C [49].
- Flow Rate: 0.4 mL/min [49].
- Injection Volume: 5 μL (can be adjusted based on sample concentration and detector sensitivity).
- Gradient Program:
- 0 min: 40% B
- 0-2 min: Ramp to 43% B
- 2-7 min: Ramp to 50% B
- 7-9 min: Ramp to 70% B
- 9-12 min: Ramp to 99% B
- 12-13.5 min: Hold at 99% B
- 13.5-13.7 min: Return to 40% B
- 13.7-16 min: Re-equilibrate at 40% B [49].
- Mass Spectrometer Parameters:
- Ionization Mode: Electrospray Ionization (ESI), positive and/or negative mode.
- Capillary Voltage: 2.5 kV (positive) / 2.2 kV (negative).
- Source Temperature: 120 °C.
- Desolvation Temperature: 500 °C.
- Cone Gas Flow: 50 L/Hr.
- Desolvation Gas Flow: 1000 L/Hr.
- Data Acquisition: Full-scan mode (e.g., m/z 100-1200) at a resolution of 70,000 for untargeted analysis. Data-Dependent Acquisition (DDA) or Targeted MRM scans can be used for specific applications.
Data Processing and Analysis:
- Use software such as LipidSearch, MS-DIAL, or XCalibur for peak picking, alignment, and identification.
- Identify lipids by comparing high-resolution m/z values, isotopic patterns, and MS/MS fragmentation spectra against databases (e.g., LIPID MAPS, Human Metabolome Database).
- Perform statistical analysis (e.g., PCA, t-tests) and lipid ontology enrichment using tools like LION-web and LINT-web [49].
Successful UHPLC method development for lipidomics requires a systematic and integrated approach. Starting with a well-chosen sub-2 μm column, followed by optimization of MS-compatible mobile phases and a finely tuned gradient, is critical for resolving complex lipid mixtures. Embracing computer-assisted modeling and Design Space principles, as outlined in ICH Q8 guidelines, can dramatically accelerate this process, transforming it from a laborious, empirical task into an efficient, predictive science [47] [51]. The protocol detailed herein provides a robust foundation for developing and optimizing UHPLC-MS/MS methods capable of delivering the high-resolution, high-sensitivity data required to advance lipidomics research.
Mass spectrometry (MS) has become a cornerstone analytical technique in modern lipidomics research, enabling the precise identification and quantification of a vast array of lipid species within biological systems. The configuration of a mass spectrometer—encompassing its ionization source, mass analyzer, and acquisition mode—directly determines the depth, accuracy, and throughput of lipidomic analyses. Within the context of ultra-high performance liquid chromatography tandem mass spectrometry (UHPLC-MS/MS) lipidomics protocols, optimal instrument configuration is paramount for addressing the unique challenges posed by lipid complexity, including isomeric diversity, wide dynamic range, and varied physicochemical properties [53] [54]. This document provides detailed application notes and protocols for configuring mass spectrometry systems to advance lipidomics research and drug development.
The ionization source converts analyte molecules into gas-phase ions, a critical first step for mass spectrometric analysis. The choice of ionization technique significantly impacts the range of detectable lipids, sensitivity, and potential for matrix effects.
Electrospray Ionization (ESI)
Principle and Workflow: Electrospray Ionization (ESI) operates by applying a high voltage (typically 2-5 kV) to a liquid sample as it elutes from the UHPLC column, creating a fine aerosol of charged droplets. As the solvent evaporates, assisted by a nebulizing gas such as nitrogen, the droplets shrink until the charge density is sufficient to desorb analyte ions into the gas phase [55]. In lipidomics, ESI is particularly well-suited for the analysis of polar and ionic lipids, including phospholipids and sphingolipids.
Key Protocol Parameters:
- Source Temperature: Typically maintained between 150°C and 300°C to aid desolvation without thermally degrading labile lipids.
- Desolvation Gas Flow: Nitrogen is commonly used at flow rates of 10-15 L/min to facilitate droplet evaporation.
- Capillary Voltage: Optimized between 2.5-3.5 kV for efficient ion formation.
- Sample Introduction: Directly coupled to the effluent of a UHPLC system, enabling seamless online analysis.
Lipidomics Applications: ESI is the most prevalent ionization source in LC-MS-based lipidomics. It efficiently ionizes a broad range of lipid classes, including glycerophospholipids (e.g., phosphatidylcholines, phosphatidylethanolamines) and sphingolipids (e.g., ceramides, sphingomyelins) [53]. Its soft ionization nature minimizes fragmentation, making it ideal for observing intact molecular ions.
Electron Impact Ionization (EI)
Principle and Workflow: Electron Impact Ionization (EI) involves vaporizing a sample into the gas phase and bombarding it with a high-energy beam of electrons (typically 70 eV) emitted from a heated filament. This high-energy interaction often causes the molecule to lose an electron and subsequently fragment, producing a characteristic spectrum of ions [55] [56].
Key Protocol Parameters:
- Electron Energy: Standardized at 70 eV, which produces reproducible fragmentation patterns.
- Trap Current: Regulates the number of electrons emitted.
- Sample Introduction: Requires vaporized samples, often via a gas chromatography (GC) inlet, limiting direct application to liquid chromatography.
Lipidomics Applications: While not directly compatible with UHPLC due to its requirement for vaporized samples, EI is crucial for gas chromatography-mass spectrometry (GC-MS) analysis in lipidomics. It is extensively used for the analysis of fatty acids and sterols following chemical derivatization (e.g., methylation, silylation) to increase their volatility and thermal stability [53]. The extensive fragmentation patterns provide structural information and enable confident identification against standard spectral libraries.
Table 1: Comparison of Key Ionization Sources for Lipidomics
| Parameter | Electrospray Ionization (ESI) | Electron Impact Ionization (EI) |
|---|---|---|
| Ionization Mechanism | Soft ionization; ion emission from charged droplets | Hard ionization; electron bombardment |
| Typical Fragmentation | Minimal in-source fragmentation | Extensive fragmentation |
| Compatibility | Directly coupled with UHPLC | Coupled with Gas Chromatography (GC) |
| Primary Lipid Targets | Intact polar lipids (e.g., phospholipids, sphingolipids) | Volatile derivatives of fatty acids, sterols |
| Quantitative Capability | Excellent with internal standards | Excellent with internal standards |
Mass Analyzers and their Configurations
The mass analyzer separates ions based on their mass-to-charge ratio (m/z). The choice of analyzer governs the resolution, mass accuracy, and speed of the analysis, which are critical for untangling complex lipidomes.
Quadrupole Time-of-Flight (Q-TOF)
Principle and Workflow: The Q-TOF combines a quadrupole mass filter for ion selection with a time-of-flight (TOF) analyzer for high-resolution mass analysis. Ions are accelerated by an electric field into a flight tube. Their time of flight to the detector is proportional to the square root of their m/z, with lighter ions arriving first [55]. Modern TOF analyzers achieve high resolution (>30,000) and mass accuracy (<5 ppm).
Lipidomics Applications: Q-TOF instruments are workhorses in both untargeted and targeted lipidomics [57]. Their high mass accuracy is essential for determining elemental compositions of unknown lipids. In MS/MS mode, the quadrupole selects a precursor ion which is then fragmented, and the TOF analyzer accurately masses the product ions, enabling confident lipid identification.
Ion Mobility Spectrometry (IMS) Hybrid Systems
Principle and Workflow: Ion Mobility Spectrometry (IMS) adds an orthogonal separation dimension by resolving ions based on their size, shape, and charge in the gas phase, prior to mass analysis [54]. The time taken for an ion to traverse a drift tube filled with a buffer gas under the influence of an electric field is used to calculate its Collision Cross-Section (CCS), a reproducible physicochemical identifier.
Lipidomics Applications: The integration of IMS with MS (IM-MS) is transformative for resolving isomeric lipids [54]. For instance, cyclic IMS (CIMS) platforms can distinguish lipid isomers differing in double bond position (e.g., FA 18:1n-7 vs. FA 18:1n-9) or geometry (cis/trans) by extending the ion mobility path length over multiple passes, achieving resolutions over 200 [54]. CCS values serve as a robust additional parameter for lipid annotation, increasing confidence in identification.
Table 2: Comparison of Mass Analyzers and Configurations in Lipidomics
| Analyzer Type | Key Principle | Resolving Power | Key Advantage in Lipidomics |
|---|---|---|---|
| Quadrupole (Q) | Stability of ion trajectories in RF/DC fields | Unit (Low) | Low cost, robustness; used for precursor/fragment selection in MS/MS |
| Time-of-Flight (TOF) | Measurement of ion flight time | High (>30,000) | High mass accuracy and fast acquisition speed for untargeted analysis |
| Q-TOF Hybrid | Quadrupole selection + TOF analysis | High (>30,000) | High-resolution MS and MS/MS on a single platform |
| Ion Mobility (IM-MS) | Gas-phase separation by size/shape/charge | Varies (IMS adds a separation dimension) | Isomer resolution, CCS value measurement, enhanced peak capacity |
Acquisition Modes for Lipidomics
The data acquisition mode dictates the strategy for gathering spectral information, balancing between comprehensive coverage and quantitative precision.
Untargeted Acquisition (Full Scan and Data-Dependent Acquisition)
Principle and Workflow: Untargeted lipidomics aims to profile all measurable lipids in a sample without prior bias.
- Full Scan MS (MS¹): The mass analyzer records all ions within a specified m/z range (e.g., 50-1500) without fragmentation. This mode provides a comprehensive overview of the lipidome [57].
- Data-Dependent Acquisition (DDA): The instrument automatically selects the most abundant ions from an MS¹ scan for subsequent fragmentation (MS/MS). This provides structural information for the most prominent lipids but can undersample low-abundance species.
Lipidomics Applications: This is the primary mode for biomarker discovery and novel lipid identification [53] [57]. The workflow involves LC-MS separation, full scan data acquisition, and subsequent data processing (peak picking, alignment, normalization) to find lipids that differ between sample groups.
Targeted Acquisition (Multiple Reaction Monitoring - MRM)
Principle and Workflow: Targeted lipidomics focuses on the precise quantification of a predefined set of lipids. Multiple Reaction Monitoring (MRM) on a triple quadrupole (QQQ) mass spectrometer is the gold standard. The first quadrupole (Q1) is set to filter a specific precursor ion (the intact lipid), the second quadrupole (q2) acts as a collision cell to fragment the ion, and the third quadrupole (Q3) filters a specific, characteristic product ion. This two-stage filtering results in exceptionally high specificity and sensitivity [53].
Lipidomics Applications: MRM is ideal for validating biomarkers, clinical diagnostics, and studying specific metabolic pathways [53]. It requires prior knowledge of the lipid targets and optimization of compound-specific parameters like collision energy. Its high quantitative accuracy makes it indispensable for hypothesis-driven research.
Essential Experimental Protocols
Protocol: Targeted Quantitative Analysis of Fatty Acids via GC-EI-MS and LC-ESI-MRM
Objective: To absolutely quantify specific fatty acid species in plasma samples.
Materials:
- Internal Standards: Stable isotope-labeled fatty acids (e.g., ¹³C-Palmitic acid).
- Derivatization Reagent: For GC-MS: BSTFA (N,O-Bis(trimethylsilyl)trifluoroacetamide); for phospholipid analysis via LC-MS: none required.
- Extraction Solvent: Methanol, methyl-tert-butyl ether (MTBE), or chloroform.
- Equipment: GC-MS system with EI source or UHPLC-MS/MS system with ESI source and triple quadrupole analyzer.
Procedure:
- Sample Preparation: Spike 50 µL of plasma with a known amount of internal standard solution. Perform lipid extraction using a modified Folch or MTBE/methanol/water method [57]. Evaporate the organic layer under nitrogen and reconstitute in an appropriate solvent for the analysis platform.
- For GC-EI-MS Analysis:
- Derivatize the extracted fatty acids to their methyl ester (FAME) or trimethylsilyl (TMS) derivatives.
- Inject 1 µL onto a non-polar GC column (e.g., DB-5MS).
- Use He as carrier gas. Employ a temperature ramp (e.g., 150°C to 300°C at 5°C/min).
- Configure the EI source at 70 eV and 250°C.
- Acquire data in Full Scan mode (e.g., m/z 50-550) for identification or Selected Ion Monitoring (SIM) for higher sensitivity quantification.
- For LC-ESI-MRM Analysis (for intact phospholipids containing fatty acids):
- Inject the reconstituted extract onto a reversed-phase UHPLC column (e.g., C8 or C18).
- Use a gradient of water/acetonitrile with ammonium formate or acetate.
- Configure the ESI source in negative or positive mode, depending on the lipid class.
- Acquire data in MRM mode, monitoring specific transitions from the intact lipid precursor ion to a characteristic fragment ion representing the fatty acyl chain (e.g., the carboxylate anion) [53].
- Data Analysis: Generate calibration curves using the ratio of the analyte peak area to the internal standard peak area. Calculate the concentration of each fatty acid in the sample using the linear regression from the calibration curve.
Protocol: Integrating Ion Mobility into an Untargeted Lipidomics Workflow
Objective: To enhance lipid identification confidence and separate isomeric species in a tissue lipidome extract.
Materials:
- Quality Control (QC): Pooled quality control (PQC) sample created from an aliquot of all study samples [29].
- CCS Calibration Standard: For DTIMS, this may not be required; for TWIMS, a solution of known calibrants (e.g., polyalanine) is needed [54].
- Equipment: UHPLC system coupled to an IM-MS instrument (e.g., DTIMS, TIMS, or CIMS platform).
Procedure:
- Sample and QC Preparation: Homogenize tissue samples and extract lipids using a standardized protocol. Create a PQC sample. Reconstitute in a suitable LC-MS solvent.
- LC-IM-MS Method Setup:
- Configure the UHPLC gradient for broad lipid separation.
- Set the IM-MS instrument to acquire data in HDMSᵉ or similar mode, which collects both low (for precursor ions) and high (for fragment ions) collision energy data in a single injection, correlated via retention time and ion mobility drift time.
- For CIMS, adjust the number of passes to achieve the desired resolution for targeted isomer separations [54].
- Data Acquisition: Inject PQC samples throughout the run to monitor system stability. Acquire data for all samples in data-independent mode, recording m/z, retention time, and drift time/CCS for all precursor and fragment ions.
- Data Processing and Lipid Annotation:
- Process data using software like MS-DIAL or LipidMatch, which can incorporate CCS values [58].
- Annotate lipids by matching experimental data (m/z, RT, MS/MS spectrum, CCS) against databases like Lipid Maps and LIPID MAPS. Use the experimental CCS value as a additional filter to increase annotation confidence [54].
The Scientist's Toolkit: Essential Research Reagents and Materials
Table 3: Key Research Reagent Solutions for UHPLC-MS/MS Lipidomics
| Item | Function and Importance |
|---|---|
| Stable Isotope-Labeled Internal Standards | Correct for matrix effects and losses during sample preparation; enable absolute quantification. Examples: ¹³C or ²H-labeled lipids for each class analyzed [53] [57]. |
| Pooled Quality Control (PQC) Sample | A quality control material made by combining small aliquots of every sample in a study. Used to monitor instrument stability, condition the column, and correct for signal drift over long sequences [29]. |
| Chemical Derivatization Reagents | Enhance detection of low-response lipids. For GC-MS of fatty acids: BSTFA; for enhancing MS/MS fragmentation of double bonds: derivatization via Paterno-Büchi reaction [53]. |
| Solid-Phase Extraction (SPE) Cartridges | Clean up samples and fractionate lipid classes (e.g., separate phospholipids from neutral lipids) to reduce matrix complexity and ion suppression [53]. |
| Collision Cross-Section (CCS) Databases | Databases of experimentally derived CCS values (e.g., from DTIMS measurements). Serve as a reference for lipid identification, adding a fourth dimension (after m/z, RT, and MS/MS) to confirm annotations [54]. |
| 2,3-Dehydrokievitone | 2,3-Dehydrokievitone, CAS:74161-25-4, MF:C20H18O6, MW:354.4 g/mol |
| Cimigenoside | Cimigenoside, CAS:27994-11-2, MF:C35H56O9, MW:620.8 g/mol |
Workflow and Pathway Visualizations
Lipidomics MS Configuration Workflow
Ion Mobility Enhanced Lipid Identification
Lipidomics, the large-scale study of cellular lipids and their pathways, has become an indispensable tool in biological and clinical research. Lipids play fundamental roles as structural components of cell membranes, energy storage molecules, and signaling mediators, with their dysregulation implicated in numerous pathological conditions including metabolic disorders, cancer, and neurodegenerative diseases [59]. The selection between targeted and untargeted lipidomics approaches represents a critical methodological decision that directly impacts the scope, quality, and biological relevance of the generated data.
Mass spectrometry, particularly when coupled with liquid chromatography (LC-MS), has emerged as the predominant analytical platform for lipidomic analysis due to its sensitivity, specificity, and ability to handle complex biological matrices [60]. The fundamental distinction between targeted and untargeted strategies lies in their analytical philosophy: untargeted lipidomics provides a comprehensive, hypothesis-generating overview of the lipidome, while targeted lipidomics offers focused, hypothesis-driven quantification of predefined lipid species [61].
This application note examines the technical parameters, performance characteristics, and practical considerations for implementing these complementary approaches within the context of ultra-performance liquid chromatography tandem mass spectrometry (UPLC-MS/MS) platforms, providing structured guidance for method selection based on specific research objectives.
Technical Foundations and Methodological Comparison
Core Philosophical and Technical Distinctions
The divergence between untargeted and targeted lipidomics begins at the experimental design phase and extends throughout the entire analytical workflow. Untargeted lipidomics adopts a discovery-oriented approach, aiming to comprehensively profile all detectable lipid species in a sample without prior selection bias. This method is particularly valuable for exploratory studies where the objective is to identify novel lipid biomarkers or uncover previously unrecognized lipid metabolic pathways [61]. In practice, untargeted workflows utilize high-resolution mass spectrometry (HRMS) platforms such as Quadrupole-Time of Flight (Q-TOF) or Orbitrap instruments to achieve accurate mass measurements capable of distinguishing between isobaric lipid species [59].
In contrast, targeted lipidomics employs a focused analysis of specific, predefined lipid molecules or classes based on prior knowledge or hypotheses. This approach typically employs triple quadrupole (QQQ) mass spectrometers operating in Multiple Reaction Monitoring (MRM) mode to achieve enhanced sensitivity and selective detection of target analytes [59]. The targeted strategy excels in validation studies, where precise quantification of specific lipid biomarkers is required, or in clinical applications where robust measurement of established lipid panels is necessary for diagnostic or prognostic purposes [61].
Table 1: Fundamental Characteristics of Untargeted and Targeted Lipidomics Approaches
| Parameter | Untargeted Lipidomics | Targeted Lipidomics |
|---|---|---|
| Analytical Philosophy | Hypothesis-generating, discovery-oriented | Hypothesis-testing, validation-focused |
| Primary MS Platform | High-resolution MS (Q-TOF, Orbitrap) | Triple quadrupole MS |
| Acquisition Mode | Full scan, data-dependent MS/MS | Multiple Reaction Monitoring (MRM) |
| Coverage | Comprehensive (100-700+ lipids) | Focused (predefined lipid panels) |
| Quantitation | Semi-quantitative (relative abundance) | Absolute quantification |
| Ideal Application | Biomarker discovery, pathway elucidation | Clinical validation, therapeutic monitoring |
| Data Complexity | High, requires advanced bioinformatics | Manageable, streamlined processing |
Performance Metrics and Analytical Validation
Rigorous comparison of analytical performance reveals complementary strengths of each approach. A cross-platform comparison study demonstrated that both methods can efficiently profile hundreds of lipids across multiple classes, with most lipids exhibiting precision and accuracy below 20% [62]. The technical repeatability for both platforms was high, with median coefficients of variation (CV) of 6.9% and 4.7% for untargeted and targeted approaches, respectively [62].
In terms of quantitative correlation, a study comparing both platforms on aging mouse plasma showed a median Pearson correlation coefficient of 0.71 across all identified lipids, indicating generally consistent quantitative trends despite methodological differences [62]. This correlation strengthens when considering specific lipid classes more amenable to both platforms, such as phosphatidylcholines.
The Lipidyzer targeted platform, which incorporates differential mobility spectrometry (DMS) prior to MRM detection, demonstrated particular robustness in inter-day precision (median CV of 5.0%) compared to untargeted LC-MS (median CV of 10.6%) [62]. However, the untargeted approach provided superior structural information, unambiguously identifying all three fatty acyl chains in triacylglycerols (TAG), while the targeted platform reported composite carbon and unsaturation counts [62].
Table 2: Analytical Performance Comparison Between Platforms
| Performance Metric | Untargeted LC-MS | Targeted Lipidyzer Platform |
|---|---|---|
| Total Lipids Detected (Mouse Plasma) | 337 lipids across 11 classes | 342 lipids across 11 classes |
| Intra-day Precision (Median CV) | 3.1% | 4.7% |
| Inter-day Precision (Median CV) | 10.6% | 5.0% |
| Technical Repeatability (Median CV) | 6.9% | 4.7% |
| Accuracy (Median % Deviation) | 6.9% | 13.0% |
| Quantitative Correlation (Median r) | 0.71 (vs. targeted) | 0.71 (vs. untargeted) |
| TAG Structural Information | Complete (all 3 fatty acids) | Partial (total carbons:unsaturation) |
Experimental Protocols and Workflows
Untargeted Lipidomics Workflow Protocol
The untargeted lipidomics workflow encompasses sample preparation, chromatographic separation, mass spectrometric analysis, and data processing, each requiring optimization for comprehensive lipid coverage.
Sample Preparation Protocol:
- Extraction Method: Implement methyl tert-butyl ether (MTBE)-based extraction for enhanced recovery of polar and non-polar lipids [63]. Add 750 μL methanol and 20 μL 1M formic acid to 100 μL plasma sample, followed by 2.5 mL MTBE. Vortex thoroughly and add 625 μL deionized water.
- Phase Separation: Centrifuge at 1,000 × g for 5 minutes. Collect the upper organic phase containing lipids. Perform a second extraction on the lower phase with 2 mL MTBE:methanol (10:3, v/v) [63].
- Sample Reconstitution: Combine organic phases, evaporate under nitrogen, and reconstitute in 100 μL isopropanol:acetonitrile:water (2:1:1, v/v/v) for LC-MS analysis [64].
- Quality Control: Prepare pooled quality control (QC) samples from all experimental samples for instrument conditioning and monitoring analytical performance throughout the sequence [64].
LC-MS Analysis Protocol:
- Chromatography: Employ reversed-phase UPLC with CSH C18 column (100 × 2.1 mm, 1.7 μm). Maintain column temperature at 55°C with flow rate of 0.4 mL/min [64].
- Mobile Phase: Utilize solvent A (acetonitrile:water, 60:40, 0.1% formic acid, 10 mM ammonium formate) and solvent B (isopropanol:acetonitrile, 90:10, 0.1% formic acid, 10 mM ammonium formate) [64].
- Gradient Elution: Implement 15-minute linear gradient: 0-2 min (40-43% B), 2-7 min (50-54% B), 7.1-13 min (70-99% B), 13.1-15 min (40% B) [64].
- Mass Spectrometry: Operate Q-TOF mass spectrometer in both positive (capillary voltage: 3.0 kV) and negative (capillary voltage: 2.0 kV) ionization modes with MS~E~ data acquisition for simultaneous collection of precursor and fragment ion data [64].
Data Processing Protocol:
- Peak Detection and Alignment: Use Progenesis QI software for peak picking, alignment, and deconvolution [64].
- Lipid Identification: Query processed data against HMDB or LIPID MAPS databases using accurate mass (mass error < 5 ppm) and MS/MS spectral matching [64].
- Statistical Analysis: Perform multivariate statistical analysis (PCA, PLS-DA) to identify differentially abundant lipids (VIP > 1.0, p < 0.05) [64].
Targeted Lipidomics Workflow Protocol
Targeted lipidomics emphasizes precise quantification through optimized detection of predefined lipid species using internal standardization.
Sample Preparation Protocol:
- Internal Standard Addition: Prior to extraction, add stable isotope-labeled internal standards (typically 54 deuterated standards covering 10 lipid classes) spanning expected physiological concentrations [62].
- Extraction Procedure: Implement modified Bligh-Dyer or MTBE extraction with rigorous quality controls. For plasma samples, use 10 μL sample volume with 1:20 sample-to-solvent ratio [62].
- Calibration Standards: Prepare calibration curves using authentic lipid standards in pooled matrix, spanning at least three orders of magnitude for quantitative accuracy [62].
LC-MS/MRM Analysis Protocol:
- Platform Configuration: Utilize Lipidyzer platform (SCIEX) incorporating differential mobility spectrometry (DMS) for lipid class separation prior to MRM detection [62].
- MRM Method Development: Establish precursor → product ion transitions for each target lipid, optimizing collision energies for maximum sensitivity. Include at least 3-5 data points per peak for reliable integration [59].
- Scheduled MRM: Implement scheduled MRM algorithms to maximize monitoring capacity while maintaining sufficient points across each chromatographic peak.
Quantitative Data Processing Protocol:
- Peak Integration: Process MRM data using instrument software (e.g., Skyline, MultiQuant) with careful manual review of integration quality.
- Concentration Calculation: Determine absolute concentrations using stable isotope dilution theory, normalizing analyte peak areas to corresponding internal standards [62].
- Quality Assurance: Apply acceptance criteria of CV < 20% for QC replicates and calibration standard accuracy within ±15% of nominal values [62].
Integrated Workflow and Application Strategies
Decision Framework for Method Selection
The choice between untargeted and targeted lipidomics should be guided by specific research questions, sample availability, and analytical resources. The following diagram illustrates the strategic decision process for method selection:
Strategic decision pathway for selecting between untargeted and targeted lipidomics approaches based on research objectives and practical constraints.
Complementary Integrated Applications
The most powerful lipidomics studies often sequentially employ both untargeted and targeted approaches, leveraging their complementary strengths. This integrated strategy typically begins with untargeted analysis for comprehensive biomarker discovery, followed by targeted validation in expanded sample cohorts.
In a study of type 2 diabetes mellitus in cynomolgus monkeys, researchers initially applied untargeted lipidomics, revealing 196 differentially expressed lipid molecules between disease and control groups [65]. Subsequent targeted analysis confirmed 64 significant lipids, with four specific lipid species (PC(18:022:4), LPC(14:0), PE(16:118:2), and PE(18:0_22:4)) identified as consistent biomarkers through both approaches [65]. This sequential validation provides greater confidence in biomarker authenticity and biological significance.
Similarly, in nonpuerperal mastitis research, untargeted lipidomics of breast tissue identified 14,012 lipid features across 16 subclasses, with triglycerides, phosphatidylethanolamines, and cardiolipins showing prominent alterations [64]. Pathway analysis further associated these lipid changes with arachidonic acid metabolism, providing mechanistic insights into disease pathophysiology [64].
The following workflow diagram illustrates this powerful integrated approach:
Integrated lipidomics workflow combining untargeted discovery with targeted validation for comprehensive lipid biomarker identification and biological interpretation.
Essential Research Reagents and Materials
Successful implementation of lipidomics workflows requires careful selection of reagents and analytical standards. The following table details essential materials and their specific functions in lipidomics analyses:
Table 3: Essential Research Reagent Solutions for Lipidomics Studies
| Reagent/Material | Specifications | Application Purpose |
|---|---|---|
| MTBE (Methyl tert-butyl ether) | HPLC/MS grade | Primary extraction solvent for comprehensive lipid recovery [63] |
| Deuterated Internal Standards | 54 compounds spanning 10 lipid classes | Quantification normalization and recovery monitoring [62] |
| Ammonium Formate | MS grade, 10 mM in mobile phase | Mobile phase additive for improved ionization efficiency [64] |
| CSH C18 UPLC Column | 100 × 2.1 mm, 1.7 μm | Chromatographic separation of complex lipid mixtures [64] |
| Authentic Lipid Standards | Pure quantified standards for target lipids | Calibration curves for absolute quantification [62] |
| Formic Acid | MS grade, 0.1% in mobile phase | Mobile phase modifier for enhanced protonation in positive mode [64] |
| Synthetic Lipid Mixtures | PC, PE, PS, PG, LPC standards | System suitability testing and quality control [63] |
Targeted and untargeted lipidomics represent complementary rather than competing approaches in the mass spectrometry-based lipid analysis toolkit. The untargeted strategy excels in discovery contexts, providing comprehensive lipidome coverage and enabling identification of novel biomarkers and dysregulated pathways. The targeted approach offers superior quantification capabilities, better precision for low-abundance species, and higher throughput for validation studies.
The most biologically impactful lipidomics research often employs an integrated strategy, beginning with untargeted analysis to identify candidate biomarkers, followed by targeted validation in expanded sample sets. This sequential approach combines the breadth of discovery with the rigor of validation, generating findings with greater biological confidence and translational potential.
As lipidomics technologies continue to advance, with improvements in chromatographic resolution, mass accuracy, and data processing algorithms, the synergy between targeted and untargeted approaches will undoubtedly yield deeper insights into lipid metabolism and its roles in health and disease.
In ultra-performance liquid chromatography tandem mass spectrometry (UPLC-MS/MS) based lipidomics, the complexity of biological samples and the extensive dynamic range of lipid species present significant analytical challenges. High-quality data generation is paramount for meaningful biological interpretation, particularly in drug development where reliable biomarkers are essential. Robust quality control (QC) strategies are therefore not optional but a fundamental component of the lipidomics workflow [66]. Two cornerstones of this QC framework are the use of internal standards (IS) and pooled QC (PQC) samples. Internal standards correct for variability in sample preparation and instrument performance, while PQC samples serve as a stable reference material to monitor analytical stability over time [29]. This application note provides detailed protocols for their effective implementation, framed within the context of a comprehensive UPLC-MS/MS lipidomics research thesis.
The Scientist's Toolkit: Essential Research Reagent Solutions
The following table details key reagents and materials crucial for maintaining quality and reproducibility in a lipidomics QC protocol.
Table 1: Key Research Reagent Solutions for Lipidomics QC
| Reagent/Material | Function & Importance | Implementation Notes |
|---|---|---|
| Deuterated Lipid Internal Standards | Correct for extraction efficiency, matrix effects, and instrument variability; enable absolute quantification [67]. | Select IS for each lipid class analyzed (e.g., PGE2-d4, LTB4-d4, TXB2-d4). Add prior to extraction [66]. |
| Pooled QC (PQC) Sample | Monitors analytical stability, identifies drift, and validates lipid identifications across the entire batch [29]. | Create from an aliquot of every study sample. Analyze at beginning of batch and after every 4-6 study samples. |
| Commercial Quality Control Plasma | Acts as a surrogate QC material and long-term reference (LTR), especially when sample volume is limited [29]. | Useful for inter-laboratory comparison and establishing historical performance benchmarks. |
| LC-MS Grade Solvents | Ensure minimal background interference and prevent ion source contamination, which is critical for sensitivity. | Use high-purity solvents like chloroform, methanol, methyl tert-butyl ether (MTBE), and acetonitrile [68]. |
| Standard Reference Materials | Validate lipid identifications by confirming retention time and fragmentation patterns [69]. | Commercially available for many lipid classes (e.g., from Cayman Chemical, Avanti Polar Lipids). |
Core QC Concepts and Experimental Protocols
The Role and Selection of Internal Standards
Internal standards are chemically analogous compounds added to samples at a known concentration and stage in the workflow. They are critical for controlling pre-analytical and analytical variation. Stable isotope-labeled standards (e.g., deuterated, 13C-labeled) are ideal as they exhibit nearly identical chemical behavior to the analytes of interest but can be distinguished mass spectrometrically [67].
Stable isotope-labeled standards (SIL-IS) are the gold standard for targeted quantification. For untargeted lipidomics, where SIL-IS for every potential lipid are unavailable, a combination of IS covering major lipid classes is used for class-specific normalization [66]. The protocol below outlines the standard practice for IS use.
Protocol 3.1.1: Preparation and Use of Internal Standards
- Stock Solution Preparation: Obtain commercially available deuterated lipid standards (e.g., PGE2-d4, LTB4-d4, TXB2-d4). Prepare a primary stock solution in a suitable solvent like chloroform/methanol (2:1, v/v) and store at -80°C [67].
- Working Solution Preparation: Dilute the primary stock to a working concentration in the same solvent. The concentration should be relevant to the expected concentration range of the endogenous lipids in the samples.
- Sample Spiking: Add a fixed, precise volume of the working IS solution to each biological sample prior to the start of lipid extraction. This ensures the IS corrects for variability and losses during the sample preparation process [66].
- Data Normalization: For quantification, calculate the response ratio of the analyte to its corresponding IS. Use this ratio for generating calibration curves and determining final concentrations.
The Use of Pooled QC Samples
A PQC sample is created by combining equal aliquots of all individual study samples, resulting in a homogeneous mixture that is representative of the entire sample set. This sample is analyzed repeatedly throughout the analytical sequence.
The PQC serves multiple purposes: it conditions the analytical system, monitors system stability, helps identify and correct for instrumental drift, and assesses the reproducibility of the entire workflow [29]. In untargeted lipidomics, data from PQC injections can be used to perform quality-based filtering, where lipid features showing high variability in the PQC are discarded.
Protocol 3.2.1: Creation and Deployment of Pooled QC Samples
- Sample Aliquoting: After all samples are prepared, take a small, equal-volume aliquot (e.g., 10-20 µL) from each sample.
- Pooling: Combine all aliquots into a single, clean vial. Mix thoroughly to ensure homogeneity.
- Analysis Sequence: The PQC sample is analyzed in the following sequence:
- At the beginning of the batch to condition the column and instrument (3-5 injections).
- Regularly throughout the run, typically after every 4-6 experimental samples.
- At the end of the batch.
- Data Monitoring: Track the retention time, peak area, and peak shape of key lipids in the PQC over the course of the sequence. Modern data systems can automate this process and flag significant deviations.
Diagram 1: Integrated QC Workflow for Lipidomics. This diagram outlines the logical sequence for implementing a combined Internal Standard and Pooled QC protocol, from sample preparation to data acceptance.
Advanced Application: Integrated QC for Quantitative Targeted Lipidomics
For targeted lipid quantification, the combination of IS and PQC is powerful. The following section provides a detailed experimental protocol for a targeted assay, such as the analysis of oxylipins and related lipid mediators.
Detailed Experimental Protocol
Protocol 4.1: Quantitative Targeted Lipidomics with Integrated QC
Aim: To simultaneously quantify specific lipid mediators (e.g., PGE2, PGD2, PGF2α, LTB4, TXB2) in biological matrices like plasma or tissue homogenates using UPLC-MS/MS with a robust QC framework [67].
Materials and Reagents:
- Authentic Standards: Unlabeled and deuterated standards for target lipids.
- Solvents: LC-MS grade methanol, acetonitrile, methyl tert-butyl ether (MTBE), and water.
- Acid: Analytical grade formic acid.
- Equipment: UPLC system coupled to a triple quadrupole mass spectrometer, centrifuge, vortex mixer.
Methodology:
Sample Preparation & Internal Standard Addition
- Thaw samples on ice. For tissues, homogenize in ice-cold buffer.
- Pipette a precise volume (e.g., 100 µL of plasma or tissue homogenate) into a glass tube.
- Add the working IS solution containing all deuterated analogs. Vortex thoroughly.
- QC Step: Include PQC samples, blank samples (without IS), and zero samples (with IS) in the batch.
Lipid Extraction
- Perform a liquid-liquid extraction. A common method is the MTBE/MeOH extraction [68]:
- Add 1.5 mL of methanol and 5 mL of MTBE to the sample.
- Vortex for 30 minutes at room temperature.
- Induce phase separation by adding 1.25 mL of water.
- Centrifuge at 1000 × g for 10 minutes.
- Collect the upper (organic) layer containing the lipids.
- Evaporate the organic layer to dryness under a gentle stream of nitrogen.
- Reconstitute the dried lipid extract in a suitable injection solvent (e.g., 100 µL of acetonitrile/isopropanol/water, 65:30:5, v/v/v).
- Perform a liquid-liquid extraction. A common method is the MTBE/MeOH extraction [68]:
UPLC-MS/MS Analysis
- Chromatography:
- Column: Reversed-phase (e.g., C8 or C18), 2.1 × 100 mm, sub-2-µm particle size.
- Mobile Phase: (A) Water with 0.1% formic acid; (B) Acetonitrile/isopropanol (e.g., 9:1) with 0.1% formic acid.
- Gradient: Optimized for lipid separation. Example: 40% B to 99% B over 5-10 minutes.
- Temperature: 45-55°C.
- Injection Volume: 1-10 µL.
- Mass Spectrometry:
- Ionization: Heated electrospray ionization (H-ESI).
- Polarity: Switching between positive and negative mode, or focused on negative mode for acidic lipids [67].
- Detection: Multiple Reaction Monitoring (MRM). The table below provides an example MRM parameters.
- Chromatography:
Table 2: Example MRM Parameters for Targeted Lipid Analysis [67]
| Analyte | Precursor Ion (m/z) | Fragment Ion (m/z) | Collision Energy (eV) | Retention Time (min) | Polarity |
|---|---|---|---|---|---|
| TXB2 | 369.3 | 169.1 | 19 | 1.29 | Negative |
| TXB2-d4 (IS) | 373.2 | 173.1 | 20 | 1.29 | Negative |
| PGF2α | 353.3 | 309.0 | 21 | 1.69 | Negative |
| PGE2/PGD2 | 351.2 | 271.2 | 19 | 2.30 | Negative |
| PGE2-d4 (IS) | 355.2 | 275.2 | 17 | 2.30 | Negative |
| LTB4 | 335.3 | 195.1 | 18 | 3.77 | Negative |
| LTB4-d4 (IS) | 339.1 | 197.2 | 18 | 3.77 | Negative |
| 2-Arachidonoyl Glycerol (2-AG) | 379.3 | 287.3 | 14 | 4.25 | Positive |
Data Processing and QC Evaluation
Protocol 4.2: Assessing Analytical Performance with QC Data
Quantification:
- Use the response ratio (Analyte Peak Area / IS Peak Area) for quantification.
- Generate a calibration curve for each analyte using the response ratios of the standard solutions.
PQC-based System Suitability:
- Calculate the % Coefficient of Variation (%CV) for the peak areas and retention times of each analyte in the repeated PQC injections.
- Acceptance Criterion: A %CV of <15-20% for peak areas in PQC samples is typically acceptable, demonstrating stable instrument performance throughout the run [66].
Retention Time Stability:
- Monitor the retention time of each lipid in the PQC samples. A drift of more than 0.1-0.2 minutes may indicate chromatographic issues.
Identification Confidence:
- For unambiguous identification, the retention time of the analyte in the study sample must match the standard within a narrow window (e.g., ±0.1 min) and the MRM transition must be identical [69].
Diagram 2: Data Processing and QC Evaluation Pathway. This chart illustrates the logical flow for processing acquired data and applying quality control acceptance criteria based on Internal Standard and PQC performance.
Troubleshooting UHPLC-MS/MS Lipidomics: Enhancing Sensitivity, Reproducibility, and Coverage
In the realm of ultra-performance liquid chromatography-tandem mass spectrometry (UPLC-MS/MS) lipidomics, the quality of chromatographic performance is paramount to achieving accurate compound identification and reliable quantification. The complex nature of lipid samples, which contain numerous isomers and species spanning large concentration ranges, makes these analyses particularly susceptible to chromatographic issues that can compromise data integrity [70] [71]. Within the context of a comprehensive lipidomics protocol, three challenges consistently emerge as significant obstacles: peak tailing, retention time shifts, and system pressure fluctuations. These issues are especially problematic when analyzing low-abundance lipid species such as phosphatidic acid (PA) and bis(monoacylglycero)phosphate (BMP), where optimal chromatographic conditions are essential for detection [70]. This application note systematically addresses these chromatographic challenges by providing evidence-based troubleshooting protocols, quantitative performance comparisons, and practical methodologies tailored specifically for UPLC-MS/MS lipidomic applications.
Peak Tailing in Lipidomics Analysis
Causes and Impact on Data Quality
Peak tailing occurs when a peak skews asymmetrically, forming a trailing edge that disrupts baseline separation and accurate quantification. In lipidomic analyses, this phenomenon is particularly problematic for acidic phospholipids such as phosphatidic acid (PA), phosphatidylserine (PS), and lysophosphatidic acid (LPA), where interactions with metal surfaces in the chromatographic flow path lead to chelation, adsorption, and subsequent peak distortion [72]. These effects are concentration-dependent, becoming especially pronounced at low analyte levels where detection is already challenging. The tailing directly reduces sensitivity, compromises resolution between co-eluting species, and introduces quantitative inaccuracies—all critical concerns when targeting low-abundance lipid signaling molecules [70] [72].
Experimental Solutions and Protocols
Hybrid Surface Technology (HST) Implementation: The application of hybrid surface technology to metal surfaces of UPLC systems and columns has demonstrated remarkable improvements in peak shape for problematic lipid classes. This technology mitigates analyte-metal interactions by creating an inert surface that minimizes adsorption sites [72].
Table 1: Quantitative Improvements in Lipid Analysis with Hybrid Surface Technology
| Analyte | Peak Tailing Reduction | Peak Width Reduction | Signal Intensity Increase |
|---|---|---|---|
| LPA | 65-80% | 70-86% | Up to 12.7-fold |
| PA | 65-80% | 70-86% | Significant improvement |
| Acidic Phospholipids | 65-80% | 70-86% | Up to 12.7-fold |
Mobile Phase Modification: The addition of phosphoric acid to solvent systems has been shown to significantly improve peak shapes for acidic phospholipids in lipidomic separations [70]. The protocol involves adding 0.1-0.5% phosphoric acid to the aqueous mobile phase, which protonates acidic functional groups on both the lipid analytes and residual silanols on the stationary phase, thereby reducing secondary interactions that cause tailing.
Column Selection Protocol: For lipidomic applications involving diverse lipid classes, the use of charged surface hybrid (CSH) C18 columns or equivalent technology is recommended. These columns are specifically designed to provide improved peak shape for challenging compounds, including basic and acidic analytes, under various pH conditions [73]. The low level of surface charge in CSH technology enhances loading capacity and peak shape, particularly for ionic lipid species in low-ionic-strength mobile phases commonly used in lipidomics [73].
Retention Time Shifts in Large Cohort Studies
Challenges in Lipidomic Profiling
Retention time (RT) instability presents a major obstacle in UPLC-MS/MS lipidomics, particularly in large cohort studies where analytical run times may extend beyond 40 hours [74]. These shifts can be monotonic (gradual drift over time) or non-monotonic (irregular variations), arising from multiple factors including column aging, mobile phase composition variations, temperature fluctuations, and sample matrix effects [75]. The problem is exacerbated in lipidomics due to the presence of numerous isomeric compounds, such as BMP and phosphatidylglycerol (PG), which have identical elemental compositions but different RTs [70]. Without proper alignment, corresponding analytes cannot be accurately mapped across multiple samples, leading to misidentification and compromised quantitative analysis.
Advanced Alignment Protocol
DeepRTAlign Workflow: A deep learning-based alignment approach has been developed to address both monotonic and non-monotonic RT shifts in large cohort LC-MS studies [75]. The protocol consists of the following key steps:
Feature Detection and Extraction: Process raw MS files using feature detection tools (e.g., XICFinder, Dinosaur) to identify isotope patterns and extract RT and m/z values with a mass tolerance of 10 ppm [75].
Coarse Alignment: Linearly scale all RT values to a standardized range (e.g., 80 minutes). Divide samples into RT windows (e.g., 1-minute segments) and calculate average RT shifts relative to an anchor sample. Apply these shifts to correct for monotonic drift [75].
Binning and Filtering: Group features by m/z using predefined parameters (binwidth = 0.03, binprecision = 2). Optionally filter to retain only the highest intensity feature in each m/z window [75].
Deep Neural Network Alignment: Employ a trained classifier model with three hidden layers (5,000 neurons each) to distinguish true correspondence between features across runs based on RT and m/z similarity patterns [75].
Quality Control: Implement false discovery rate (FDR) estimation by constructing decoy samples to validate alignment accuracy [75].
Indexed Retention Time (iRT) Calibration: For targeted lipidomics, implement an iRT system using endogenous reference lipids that span the LC gradient [71]. The protocol involves:
- Selecting 20 stable lipid species covering the entire chromatographic range
- Assigning iRT values between 0-100 based on their relative elution positions
- Using a locally weighted scatterplot smoothing (LOESS) model to predict RTs for all other lipids in subsequent runs
- Achieving prediction accuracy within 2-3% of observed RTs [71]
Table 2: Retention Time Alignment Performance Comparison
| Method | Alignment Principle | Monotonic Shift Correction | Non-monotonic Shift Correction | Reported Identification Improvement |
|---|---|---|---|---|
| DeepRTAlign | Deep Learning + Coarse Alignment | Yes | Yes | Significant increase in aligned features |
| iRT System | Retention Time Prediction | Yes | Limited | 2-3% prediction accuracy |
| Warping Function | Linear/Non-linear Regression | Yes | No | Moderate improvement |
| Direct Matching | Feature Similarity | Limited | Limited | Variable performance |
Pressure Fluctuations in UPLC Systems
Impact on Lipid Separation Efficiency
Pressure instability in UPLC systems directly compromises the reproducibility and quality of lipidomic separations. The extended run times (up to 50 minutes) required for comprehensive lipid class separation make these methods particularly vulnerable to pressure-related issues [70] [76]. Pressure fluctuations can manifest as sudden spikes, gradual increases, or irregular variations, each indicating different underlying problems. These instabilities disrupt flow consistency, leading to retention time variability, peak broadening, and reduced resolution—especially critical when separating constitutional isomers such as BMP and PG in lipidomic profiling [70] [76].
Diagnostic and Resolution Protocol
Systematic Troubleshooting Workflow:
Initial Assessment:
- Monitor pressure baseline during pre-run equilibration
- Compare current pressure readings to historical values for the same method
- Note the pattern: sudden spike vs. gradual increase vs. irregular fluctuation [76]
Pressure Drop Protocol:
- Inspect check valves for debris or sticking; clean or replace as needed
- Purge the pump to remove trapped air bubbles
- Check for leaks at fitting connections, especially after the pump
- Verify solvent degasser operation; bypass if necessary to test [76]
Pressure Spike Resolution:
- Isolate the column and monitor pressure to determine if the issue is column-related
- For column-related spikes: trim 10-20 cm from the inlet or replace the column
- Inspect and replace inlet liner if contaminated
- Check for obstruction in tubing; particularly the solvent inlet frit [77] [76]
- Filter samples (0.2 μm) to prevent particulate introduction
Fluctuation Management:
- Inspect and replace worn piston seals
- Purge pump channels thoroughly to remove air
- Verify mobile phase consistency and degassing
- Check for worn components in the pumping system [76]
The Scientist's Toolkit: Essential Research Reagents and Materials
Table 3: Key Research Reagent Solutions for UPLC-MS/MS Lipidomics
| Item | Function | Application Notes |
|---|---|---|
| CSH C18 Columns | Stationary phase for lipid separation | Provides improved peak shape for acidic and basic lipids; compatible with HST technology [73] [72] |
| Charged Surface Hybrid (HST) Columns | Minimize metal-analyte interactions | Specifically designed to reduce chelation and improve recovery of acidic phospholipids [72] |
| Phosphoric Acid (HPLC grade) | Mobile phase additive | Improves peak shapes for acidic phospholipids; use at 0.1-0.5% in aqueous phase [70] |
| Ammonium Formate | Volatile buffer component | Provides ionic strength for separation without causing ion suppression; typical concentration 5-10 mM [78] |
| Formic Acid | Ion pairing agent | Enhances ionization in positive mode; use at 0.1% in mobile phase [78] |
| High-Purity Water | Mobile phase component | Essential for minimizing background interference and chemical noise |
| HPLC-Grade Acetonitrile/Methanol | Organic mobile phase | Primary organic modifiers for reversed-phase lipid separation |
| Leucine-Enkephalin | Lock mass compound | Provides accurate mass calibration during extended runs; typical concentration 100 pg/μl [70] |
| Internal Standard Mixture | Quantitation reference | Deuterated lipid standards for precise quantification; added prior to extraction [70] |
Integrated Workflow for Comprehensive Lipidomics
Unified Troubleshooting Protocol
Implementing a systematic approach to chromatographic issues in UPLC-MS/MS lipidomics requires understanding how peak tailing, retention time shifts, and pressure fluctuations interrelate. The following integrated protocol ensures comprehensive method robustness:
Pre-Analytical System Qualification:
- Establish baseline pressure profile using reference standards
- Verify peak symmetry for acidic lipid standards (e.g., PA 34:0, LPA)
- Document retention time stability for internal standards across multiple injections
- Confirm signal intensity benchmarks for low-abundance lipid species
Preventative Maintenance Schedule:
- Regular column trimming (every 200-300 injections) or replacement
- Monthly check valve inspection and cleaning
- Quarterly pump seal replacement
- Semi-annual comprehensive system calibration
Quality Control Monitoring:
- Incorporate quality control samples at regular intervals (every 10-15 samples)
- Track retention time drift of internal standards throughout batch sequences
- Monitor peak symmetry for specific lipid classes known to exhibit tailing
- Document system pressure trends as part of batch quality assessment
Method Performance Verification
After implementing the recommended solutions, method performance should be verified against specific benchmarks:
Peak Shape Assessment: Measure tailing factors for acidic phospholipids (PA, LPA, PS); values should be ≤1.5 with HST implementation [72].
Retention Time Stability: Calculate relative standard deviation (RSD) for internal standards across the batch; should be <2% with proper alignment [71] [75].
Pressure Profile: System pressure should remain within ±10% of baseline throughout the chromatographic run [76].
Signal Reproducibility: Intensity RSD for quality control samples should be <15% for major lipid species and <20% for low-abundance compounds [70] [72].
Through systematic implementation of these protocols, lipidomics researchers can achieve robust, reproducible chromatographic performance essential for reliable identification and quantification of lipid species in complex biological samples. The integration of advanced technologies such as hybrid surfaces, deep learning alignment, and proactive maintenance schedules addresses the fundamental chromatographic challenges that have historically compromised lipidomic data quality.
In the field of ultra performance liquid chromatography tandem mass spectrometry (UHPLC-MS/MS) lipidomics, achieving reliable detection is paramount for accurate biomarker discovery and understanding disease mechanisms. A primary challenge in quantitative bioanalysis, especially when dealing with complex biological matrices like plasma or tissue, is managing ion suppression, background noise, and low signal intensity [79] [80]. Ion suppression, where co-eluting matrix components reduce the ionization efficiency of target analytes, can dramatically decrease measurement accuracy, precision, and sensitivity, leading to compromised quantification [79] [80]. This application note details systematic strategies and protocols to optimize MS detection robustness within the context of a UHPLC-MS/MS lipidomics research framework. The methodologies presented are designed to support researchers, scientists, and drug development professionals in overcoming these pervasive analytical hurdles.
Core Challenges in MS-Based Lipidomics
Ion Suppression
Ion suppression is a matrix effect where co-eluting compounds compete for charge during the ionization process, leading to reduced and variable analyte signals [79] [80]. The mechanisms are influenced by factors including:
- Biological Matrix Components: Endogenous compounds in plasma, urine, or tissue extracts [80].
- Chromatographic Conditions: Mobile phase composition and insufficient separation [79] [80].
- Instrumental Factors: Ion source design and contamination [79].
A recent study demonstrated that ion suppression can range from 1% to over 90% for detected metabolites, with coefficients of variation from 1% to 20% across different LC-MS systems [80].
Background Noise and Low Signal
Background noise obscures low-abundance lipids, while low signal intensity hampers accurate quantification. Key contributors include:
- Inadequate Sample Cleanup: Residual matrix interferents [79].
- Suboptimal Ion Source Tuning: Poor ion transmission and desolvation efficiency [79].
- Chemical Noise: From solvents, columns, or the sample itself [79].
Strategic Approaches for Optimization
Sample Preparation Optimization
Effective sample preparation is the first line of defense against matrix effects.
- Protein Precipitation: A common first step, though it may leave some phospholipids [79].
- Liquid-Liquid Extraction (LLE): Protocols using methyl tert-butyl ether (MTBE) are effective for lipidomics. For example, one protocol adds 800 μL MTBE to a plasma sample mixed with pre-cooled methanol and water, followed by sonication, standing, and centrifugation [18].
- Solid-Phase Extraction (SPE): Provides superior clean-up by selectively retaining lipids or impurities [79].
- Biphasic Extraction for Multi-Platform Analysis: For a comprehensive analysis from a single sample, a biphasic CHCl₃/MeOH/H₂O method is suitable for sequential NMR and UHPLC-MS analysis of plasma, while a two-step extraction (CHCl₃/MeOH followed by MeOH/H₂O) is recommended for liver tissue [81].
Chromatographic Separation Enhancement
Optimizing the LC dimension is critical for separating analytes from matrix interferents.
- Column Chemistry: Using appropriate columns like the Waters ACQUITY UPLC BEH C18 (1.7 μm particle size) provides high-resolution separation [18].
- Mobile Phase Optimization: Employing volatile buffers such as ammonium formate or ammonium acetate (e.g., 5-10 mM) can enhance spray stability and ionization efficiency [79] [82] [18].
- Gradient Elution: A finely tuned gradient is essential. For lipidomics, a gradient from 30% to 100% of an organic phase (e.g., 90% isopropanol, 10% acetonitrile, 5 mM ammonium acetate) over 9 minutes effectively elutes a wide range of lipid classes [82].
Mass Spectrometric Detection Tuning
Direct instrument parameter optimization maximizes signal-to-noise ratios.
- Ion Source Parameters: Key parameters include nebulizing gas pressure, sheath gas flow, desolvation temperature, and spray voltage, which should be tuned for specific analyte classes [79] [82]. For example, a method for lipidomics used a spray voltage of 4 kV, sheath gas at 45, and auxiliary gas at 15 [82].
- Acquisition Modes:
- Multiple Reaction Monitoring (MRM): On triple quadrupole instruments, MRM provides high specificity by monitoring precursor and product ion pairs, drastically reducing background noise [79].
- High-Resolution Full MS / dd-MS²: On Q-Exactive-type instruments, full MS scanning at high resolution (e.g., 70,000) enables accurate mass measurement, while data-dependent MS² (at 17,500 resolution) facilitates lipid identification [82].
Advanced Correction Techniques
- Stable Isotope-Labeled Internal Standards (SILIS): Using methods like the IROA TruQuant Workflow, which employs a ¹³C-labeled internal standard (IROA-IS) library, allows for precise measurement and correction of ion suppression. This workflow can nullify suppression effects by calculating suppression-corrected values based on the signal loss of the ¹³C internal standard, which experiences the same suppression as the endogenous ¹²C analyte [80].
- Data Normalization: Algorithms like Dual MSTUS (MS Total Useful Signal) normalization, used in conjunction with IROA, improve quantitative accuracy and precision across diverse samples and conditions [80].
Experimental Protocols
Protocol: Plasma Lipidomics with Ion Suppression Monitoring
This protocol is adapted from non-targeted lipidomic studies and incorporates best practices for managing suppression [80] [18].
I. Sample Preparation
- Collect 100 μL of plasma.
- Add 200 μL of ice-cold water and vortex to mix.
- Precipitate proteins by adding 240 μL of pre-cooled methanol and vortexing.
- Extract lipids by adding 800 μL of methyl tert-butyl ether (MTBE).
- Sonicate in a low-temperature water bath for 20 minutes.
- Let stand at room temperature for 30 minutes.
- Centrifuge at 14,000 g at 10°C for 15 minutes.
- Collect the upper organic phase and dry under a gentle nitrogen stream.
- Reconstitute the dried extract in 100 μL of isopropanol for UHPLC-MS/MS analysis.
- For suppression correction: Spike the sample with a defined concentration of IROA Internal Standard (IROA-IS) or other SILIS prior to the extraction process [80].
II. UHPLC-MS/MS Analysis
- Chromatography:
- Column: Waters ACQUITY UPLC BEH C18 (2.1 mm × 100 mm, 1.7 μm).
- Mobile Phase A: 10 mM ammonium formate in water:acetonitrile (e.g., 40:60).
- Mobile Phase B: 10 mM ammonium formate in acetonitrile:isopropanol (e.g., 10:90) [18].
- Gradient: 0-9 min: 30-100% B; hold at 100% B for 3 min; return to 30% B over 0.5 min; re-equilibrate for 2.5 min.
- Flow Rate: 0.3-0.4 mL/min.
- Column Temperature: 40-50°C.
- Injection Volume: 1-10 μL.
- Mass Spectrometry:
- Ionization: Electrospray Ionization (ESI), positive/negative mode switching.
- Source Parameters: Spray voltage 3-4.5 kV, sheath gas 45, auxiliary gas 15, capillary temperature ~300°C [82].
- Data Acquisition:
- For quantification on a triple quadrupole: Use MRM mode with optimized collision energies for target lipids.
- For untargeted profiling on an Orbitrap: Full MS scan (e.g., m/z 150-1500) at resolution 70,000, followed by data-dependent MS² at resolution 17,500 with stepped NCE (e.g., 20, 24, 28 for negative mode) [82].
III. Data Processing and Correction
- Process raw data using software (e.g., LipidSearch, Compound Discoverer) for peak picking, alignment, and identification.
- For IROA-based correction, use ClusterFinder or similar software to apply the ion suppression correction algorithm (Eq. 1 from [80]):
AUC-12C_corrected = AUC-12C_observed × (AUC-13C_expected / AUC-13C_observed)where AUC-13C_expected is the known constant value of the internal standard. - Apply normalization (e.g., Dual MSTUS) to account for overall signal variation.
Workflow Diagram: Ion Suppression Management Strategy
The following diagram illustrates the logical workflow for managing ion suppression in a lipidomics experiment.
Key Research Reagent Solutions
The following table details essential materials and their functions for implementing the optimized protocols described in this note.
Table 1: Essential Research Reagents and Materials for UHPLC-MS/MS Lipidomics
| Item Name | Function / Purpose | Example from Literature |
|---|---|---|
| IROA Internal Standard (IROA-IS) | A ¹³C-labeled standard library for precise measurement and correction of ion suppression across all detected metabolites [80]. | IROA TruQuant Workflow [80] |
| Ammonium Formate / Acetate | Volatile buffer salt added to mobile phase to improve spray stability and ionization efficiency in the ESI source [79] [82] [18]. | 5-10 mM in mobile phase [82] [18] |
| Methyl tert-butyl ether (MTBE) | Organic solvent for liquid-liquid extraction, efficiently partitioning lipids away from polar matrix interferents [18]. | Used in MTBE-based extraction protocol [18] |
| SPLASH Lipidomix Mass Spec Standard | A quantitative mixture of synthetic, heavy isotope-labeled lipid standards from different classes, used for retention time alignment and quality control [82]. | Avanti Polar Lipids #330707 [82] |
| Waters ACQUITY UPLC BEH C18 Column | Reversed-phase UHPLC column with 1.7-1.8 µm particles providing high-resolution separation of complex lipid mixtures prior to MS detection [82] [18]. | 2.1 x 100-150 mm dimensions [82] [18] |
The tables below consolidate key quantitative data and optimized parameters from the cited literature and protocols.
Table 2: Documented Ion Suppression Effects and Correction Efficacy
| Chromatographic System | Ionization Mode | Observed Ion Suppression Range | Correction Method | Key Outcome Post-Correction |
|---|---|---|---|---|
| Reversed-Phase (C18) | Positive | 1% to >90% [80] | IROA TruQuant Workflow [80] | Linear signal increase with sample input restored [80] |
| Ion Chromatography (IC) | Negative | Up to 97% for specific metabolites (e.g., Pyroglutamylglycine) [80] | IROA TruQuant Workflow [80] | Effective correction even for extreme suppression [80] |
| HILIC | Positive | Extensive suppression observed [80] | IROA TruQuant Workflow [80] | Robust normalization across conditions [80] |
Table 3: Optimized Instrument Parameters for Lipidomics Analysis
| Parameter | Setting / Condition | Instrument / Context |
|---|---|---|
| LC Column | ACQUITY UPLC BEH C18 (2.1x100mm, 1.7µm) [18] | UHPLC-MS/MS |
| Mobile Phase | A: 10mM Ammonium Formate in Hâ‚‚O:ACN; B: 10mM Ammonium Formate in ACN:IPA [18] | UHPLC-MS/MS |
| Full MS Resolution | 70,000 [82] | Q Exactive (Orbitrap) |
| MS/MS Resolution | 17,500 [82] | Q Exactive (Orbitrap) |
| Spray Voltage | 4.0 kV [82] | ESI Source |
| Sheath Gas | 45 (arbitrary units) [82] | ESI Source |
| Data Acquisition Mode | Full MS / dd-MS² [82] | Untargeted Lipidomics |
Lipidomics, the large-scale study of lipid pathways and networks in biological systems, is an indispensable component of modern biomedical research [83]. Lipids are not only structural components of cell membranes but also play vital roles as energy storage sources and signaling molecules, with disturbances in lipid metabolism being implicated in a plethora of diseases including metabolic disorders, cancer, and neurological conditions [84]. The complexity of lipidomes is immense, with an estimated 100,000 distinct lipid species in humans, presenting significant analytical challenges [84].
Within the context of ultra performance liquid chromatography tandem mass spectrometry (UPLC-MS/MS) lipidomics, confident lipid identification remains a formidable challenge due to the structural diversity of lipids and the limitations of current analytical technologies [85]. This application note outlines integrated strategies that leverage advanced MS/MS spectral libraries and systematic fragmentation pattern analysis to achieve higher confidence in lipid identification, which is crucial for both basic research and drug development applications [83].
The Analytical Challenge in Lipid Identification
The fundamental challenge in lipid identification stems from several factors: the vast structural diversity of lipids, the presence of numerous isomers, and limitations in current analytical technologies. Without appropriate strategies, misidentifications and improper annotations become common, undermining the reliability and reproducibility of lipidomics data [84].
Current data indicates that approximately 50% of tandem mass spectrometry-based automated lipid identifications are incorrect without appropriate filtering and validation [86]. This high error rate stems from several factors, including:
- Insufficient spectral quality and signal-to-noise ratios
- Incomplete use of available data (e.g., isotope ratios, chromatographic behavior) by identification software
- Inconsistencies between experimental setups and library spectra
- Lack of standardization in methods, technologies, workflows, and data reporting [84]
These challenges highlight the critical need for robust strategies that combine advanced spectral libraries with intelligent data analysis to improve confidence in lipid identifications.
Spectral Library Generation and Management
Automated Spectral Library Generation with Library Forge
The Library Forge algorithm represents a significant advancement in spectral library generation by deriving lipid fragment mass-to-charge (m/z) and intensity patterns directly from high-resolution experimental spectra with minimal user input [87]. This approach exploits the modular construction of lipids to generate m/z-transformed spectra in silico, revealing underlying fragmentation pathways common to specific lipid classes.
Table 1: Comparison of Spectral Library Generation Approaches
| Approach | Development Time | Platform Flexibility | Identification Confidence | Best Use Cases |
|---|---|---|---|---|
| Manual Annotation & Curation | Days to weeks | Low to moderate | High for specific platforms | Targeted analysis with standardized methods |
| Consensus Libraries | Pre-existing | High | Moderate (compromised by platform differences) | Multi-platform studies |
| Library Forge Algorithm | Minutes | High | High (learned directly from data) | Discovery lipidomics, novel instrumentation |
Key advantages of the Library Forge approach include:
- Reduced Development Time: Library generation time decreases from days to minutes compared to manual approaches [87]
- Adaptive Learning: The algorithm learns fragmentation patterns directly from observed spectra, increasing matching confidence [87]
- Platform Independence: Creates tailored libraries specific to instrumental platforms and dissociation techniques [87]
The algorithm operates through a multi-step process: (i) putative lipid MS/MS spectra with sufficient signal-to-noise ratio are extracted and scaled; (ii) replicate spectra are clustered and collapsed into high-quality consensus spectra; (iii) adaptive m/z offsets generate annotation spectra; (iv) conserved fragmentation rules are determined through comparison across lipid classes [87].
Workflow for Spectral Library Generation and Utilization
The following diagram illustrates the integrated workflow for generating and utilizing spectral libraries in lipid identification:
Chromatographic Separation Strategies
Chromatographic separation prior to MS analysis is critical for reducing matrix effects and separating isomeric lipids. The two primary separation modes in LC-MS-based lipidomics are reversed-phase liquid chromatography (RPLC) and hydrophilic interaction chromatography (HILIC), each with distinct advantages and limitations [88].
HILIC vs. RPLC for Lipid Quantification
A systematic comparison of HILIC and RPLC HRAM-MS workflows for quantifying 191 lipids from five lipid classes in human blood plasma revealed important considerations for accurate identification and quantification [88]:
Table 2: Comparison of HILIC and RPLC Separation Methods for Lipidomics
| Parameter | HILIC MS | RPLC MS |
|---|---|---|
| Separation Mechanism | Headgroup polarity | Fatty acyl/alkyl chain hydrophobicity |
| Elution Pattern | Co-elution by lipid class | Distribution by fatty acid composition |
| Matrix Effects | Reduced due to co-elution of ISTD with class | Increased due to broad RT range and solvent differences |
| Isomer Separation | Limited | Excellent |
| Quantification Challenges | Ionization suppression from co-elution | Response factors needed for unsaturated lipids |
| Best Applications | Class-based profiling and quantification | Detailed molecular species profiling |
Critical findings from this comparison include:
- Concentrations of most lipids (LPC, LPE, PC, PE, and SM) were comparable between methods [88]
- Highly unsaturated phosphatidylcholines showed significant concentration differences, with potential overestimation by HILIC MS [88]
- Both methods can be used accurately with appropriate correction factors, particularly for variations in lipid unsaturation [88]
Integrated Protocol for Confident Lipid Identification
Sample Preparation and Lipid Extraction
Proper sample preparation is fundamental to obtaining reliable lipidomics data. Key considerations include:
- Extraction Efficiency: The modified methyl-tert-butyl ether (MTBE) method allows faster and cleaner recovery of most major lipid classes compared to traditional methods [85]
- Lipid Stability: Incorporate strategies to quench enzymatic activity and prevent oxidation during sample preparation [89]
- Standardization: Use standardized operating procedures (SOPs) for collection, processing, and storage to minimize variability [83]
- Storage Conditions: Store lipid extracts in organic solvents with antioxidants at -20°C or lower in airtight containers without light exposure to reduce sublimation and degradation [89]
LC-MS/MS Analysis Conditions
Optimal instrumental conditions for UPLC-MS/MS lipid analysis:
- Column: ACQUITY UPLC BEH C18 (100 mm × 2.1 mm, 1.7 μm) or equivalent [90]
- Temperature: 50°C to enhance elution of late-eluting lipids [90]
- Mobile Phase:
- Solvent A: acetonitrile/water (1:1) with 1 mM ammonium acetate or formate
- Solvent B: isopropanol/acetonitrile (9:1) with same additives [90]
- Gradient: 35-100% B over 7-12 minutes [90]
- Flow Rate: 0.3-0.4 mL/min [88] [90]
- Injection Volume: 2-5 μL [90]
Data Processing and Validation
- Spectral Library Matching: Use software tools like LipiDex that incorporate robust spectral matching algorithms [87]
- Machine Learning Validation: Implement tools like LipoCLEAN that utilize underused metrics (isotope ratios, chromatographic behavior) to rescore identifications [86]
- Quality Assessment: LipoCLEAN has been shown to reduce false discoveries to 7% while retaining 80% of true positives through multidimensional rescoring [86]
Research Reagent Solutions
Table 3: Essential Research Reagents for Confident Lipid Identification
| Reagent / Material | Function / Application | Examples / Specifications |
|---|---|---|
| Synthetic Lipid Standards | Internal standards for quantification and identification; should be chemically pure | Avanti Polar Lipids: glycerolipids, glycerophospholipids, sphingolipids, sterols [84] |
| Deuterated ISTD Mixtures | Correction for extraction efficiency, ionization variation, and matrix effects | SPLASH LIPIDOMIX; isotope-labeled standards for each lipid class [88] |
| Reference Materials | Method validation and inter-laboratory comparison | NIST SRM 1950 Metabolites in Frozen Human Plasma [88] |
| Quality Control Pools | Monitoring analytical performance and reproducibility | Quality control (QC) samples from pooled biological extracts [88] |
| Chromatographic Supplies | Reproducible separation and analysis | Acquity UPLC BEH C18 column (1.7 μm); MS-grade solvents and additives [90] |
Confident lipid identification in UPLC-MS/MS lipidomics requires an integrated approach that combines optimized sample preparation, appropriate chromatographic separation, advanced spectral libraries, and intelligent data validation. The implementation of automated spectral library generation tools like Library Forge and machine learning filters like LipoCLEAN significantly enhances identification confidence while reducing false discovery rates.
Future developments in lipidomics will likely focus on increased standardization through initiatives such as the Lipidomics Standards Initiative (LSI) [84], expansion of comprehensive spectral libraries covering diverse instrumentation platforms, and implementation of artificial intelligence approaches for data integration and validation. These advances will be crucial for realizing the full potential of lipidomics in biomedical research and drug development, particularly as lipids continue to emerge as important biomarkers and therapeutic targets [83].
Lipids are a vital and diverse class of biomolecules that serve as building blocks for cellular membranes, function as energy storage molecules, and play key roles in cellular signaling processes [91]. The comprehensive study of these molecules, known as lipidomics, has emerged as a critical field in biomedical and applied sciences, propelled largely by advances in mass spectrometry (MS) [91] [92]. However, the inherent chemical complexity of the lipidome, which comprises tens of thousands of individual species, presents significant analytical challenges [91] [93]. A major hurdle is the prevalence of isomeric lipids—species sharing the same mass but differing in structure—which conventional tandem MS struggles to resolve [93] [94].
This application note details an advanced ultra-performance liquid chromatography-tandem mass spectrometry (UPLC-MS/MS) lipidomics workflow designed to address these complexities. We focus on the integration of three powerful techniques: polarity switching for expanded lipid coverage, ion mobility spectrometry (IMS) for gas-phase separation of isomers, and electron-activated dissociation (EAD) for in-depth structural elucidation. Framed within a broader thesis on protocol development, this document provides detailed methodologies and data analysis protocols to enable researchers to achieve unprecedented depth and confidence in lipid characterization.
The following diagram illustrates the integrated workflow, from sample preparation to data processing, highlighting the key advanced technologies employed.
Detailed Experimental Protocols
Sample Preparation and Lipid Extraction
Robust sample preparation is the foundational step for a successful lipidomics study. Artifacts such as lysophospholipids can form if samples are not processed correctly [91].
Protocol: Methyl tert-Butyl Ether (MTBE) Liquid-Liquid Extraction
- Reagents: Methanol, MTBE, water (all LC-MS grade), Tris-HCl buffer (150 mM, pH 7.6).
- Procedure:
- Homogenization: For tissues, use a Potter-Elvehjem homogenizer or a pebble mill with beads in an appropriate solvent to ensure complete cell disruption [91].
- Extraction:
- Transfer 100 µL of sample (e.g., plasma, tissue homogenate) into a glass tube.
- Add 360 µL of methanol and 1.2 mL of MTBE. Vortex vigorously for 1 minute.
- Add 200 µL of water to induce phase separation. Vortex again for 1 minute.
- Centrifuge at 10,000 × g for 10 minutes at room temperature.
- Phase Collection: The upper organic (MTBE) phase, which contains the lipids, is carefully collected. This step is easier and safer than chloroform-based methods [91].
- Solvent Evaporation: The organic phase is evaporated to dryness under a gentle stream of nitrogen gas.
- Reconstitution: Redissolve the lipid extract in 100-200 µL of a 1:1 (v/v) mixture of dichloromethane and methanol. Vortex and sonicate to ensure complete dissolution before UPLC-MS analysis.
Ultra-Performance Liquid Chromatography (UPLC)
Chromatographic separation reduces sample complexity and mitigates ion suppression effects prior to MS analysis.
Protocol: Reversed-Phase UPLC Separation
- Column: C18 column (e.g., 1.7 µm, 2.1 × 100 mm).
- Mobile Phase: A: 60:40 Acetonitrile:Water with 10 mM Ammonium Formate; B: 90:10 Isopropanol:Acetonitrile with 10 mM Ammonium Formate.
- Gradient:
- 0 min: 40% B
- 0-2 min: Ramp to 70% B
- 2-12 min: Ramp to 99% B
- 12-14 min: Hold at 99% B
- 14-14.1 min: Return to 40% B
- 14.1-16 min: Re-equilibrate at 40% B
- Flow Rate: 0.4 mL/min.
- Column Temperature: 55 °C.
- Injection Volume: 2-5 µL (depending on sample concentration).
Mass Spectrometric Analysis with Polarity Switching, IMS, and EAD
This section details the core advanced techniques configured on a tribrid mass spectrometer capable of IMS and EAD fragmentation.
Protocol: Data Acquisition Method
- Ion Source: Electrospray Ionization (ESI).
- Polarity Switching: Implement fast, data-dependent switching between positive and negative ion modes within the same chromatographic run to capture a broad range of lipid classes [92].
- Ion Mobility Spectrometry (IMS):
- MS¹ and MS² Acquisition:
- Perform full-scan MS in the range of m/z 300-1200.
- Use data-dependent acquisition (DDA) to select the most intense ions for fragmentation.
- For MS², employ two complementary fragmentation techniques:
- Collision-Induced Dissociation (CID): Use for standard lipid identification and headgroup characterization.
- Electron-Activated Dissociation (EAD): Apply a kinetic energy of 14 eV for in-depth structural analysis. This energy has been optimized to generate characteristic fragments for determining double-bond and sn- positions while maintaining good sensitivity [95].
Data Processing and Lipid Annotation
Protocol: Analysis Using MS-DIAL 5 Software
- Data Import: Import raw data files into MS-DIAL 5.
- Peak Detection and Alignment: Perform peak picking, alignment, and deconvolution across all samples.
- Lipid Annotation:
- Database Matching: Annotate lipids by matching MS¹ (m/z), retention time, and CCS values (if a predictive database is available) against a curated lipid database such as LIPID MAPS.
- MS² Spectral Matching: Confirm annotations by matching CID and EAD fragmentation spectra against in-silico and experimental spectral libraries.
- Advanced EAD Interpretation: Use the integrated decision tree algorithm in MS-DIAL 5 to interpret EAD spectra. The software automatically identifies "C=C high" peaks and V-shaped patterns to assign double-bond positions and ranks candidates based on correlation with in-silico spectra [95].
Key Research Reagent Solutions
The following table details essential reagents and materials required for the implementation of this protocol.
Table 1: Essential Research Reagents and Materials
| Item | Function/Application | Example/Note |
|---|---|---|
| Methyl tert-Butyl Ether (MTBE) | Primary solvent for liquid-liquid lipid extraction; safer alternative to chloroform [91]. | LC-MS grade recommended to minimize background contamination. |
| Ammonium Formate | Mobile phase additive for LC-MS; promotes efficient ionization and stabilizes the pH. | Use 10 mM concentration in both mobile phases A and B. |
| UltimateSPLASH / LightSPLASH | Synthetic, deuterated lipid standard mixtures; used for quality control and absolute quantification [95]. | Spiked into every sample prior to extraction. |
| C18 UPLC Column | Stationary phase for reversed-phase chromatographic separation of lipids by hydrophobicity. | 1.7 µm particle size, 2.1 x 100 mm dimensions. |
| MS-DIAL 5 Software | Comprehensive, open-source software for multimodal MS data analysis, including EAD and IMS data [95]. | Supports the Lipidomics Standards Initiative (LSI) reporting guidelines. |
Performance Data and Technical Validation
The integration of IMS and EAD provides quantitative improvements in lipid identification, particularly for isomers. The following table summarizes key performance metrics from validation studies using standard mixtures.
Table 2: Performance Metrics of the Advanced Lipidomics Workflow
| Analytical Feature | Metric | Value/Outcome | Citation |
|---|---|---|---|
| EAD Fragmentation | Optimal Kinetic Energy | 14 eV (balanced sensitivity and structural information) | [95] |
| EAD Structural Elucidation | Correct Assignment Rate (for authentic standards) | 96.4% of structures correctly delineated | [95] |
| EAD Sensitivity | Required Amount for sn-/C=C Assignment | 500-1000 femtomoles on-column for PC lipids | [95] |
| Ion Mobility | Additional Molecular Descriptor | Collision Cross Section (CCS) value; highly reproducible and instrument-independent. | [93] |
| IMS Isomer Separation | Capabilities | Separates sn-positional isomers, cis/trans, and stereochemical isomers. | [93] [94] |
The decision-making process for lipid structural annotation based on EAD data in MS-DIAL 5 can be visualized as follows:
Application in a Broader Research Context
This advanced protocol moves beyond simple lipid identification to address critical questions in lipid biology. For instance, it was successfully used to characterize eye-specific phosphatidylcholines containing very-long-chain polyunsaturated fatty acids (VLC-PUFAs). The workflow identified the structure as PC n-3-VLC-PUFA/FA and, through a combination of EAD-MS/MS and recombinant proteins, pinpointed glycerol 3-phosphate acyltransferase as the enzyme responsible for incorporating n-3 VLC-PUFAs into the sn1 position of phospholipids in mammalian cells [95]. This demonstrates the protocol's power in bridging precise lipid structural elucidation with fundamental biological discovery, a core aim of modern lipidomics research.
The integration of polarity switching, ion mobility, and EAD fragmentation within a UPLC-MS/MS workflow represents a significant leap forward in lipidomics. This detailed application note provides researchers with a validated protocol to deepen their lipid analyses, resolve complex isomeric species, and generate high-quality, biologically insightful data. As the field continues to advance, these techniques will be indispensable in unraveling the intricate roles of lipids in health, disease, and drug development.
In ultra performance liquid chromatography tandem mass spectrometry (UHPLC-MS/MS) lipidomics, the journey from raw spectral data to biologically meaningful insights is fraught with technical challenges. Three key data processing hurdles—managing missing values, correcting for batch effects, and achieving accurate peak alignment—consistently impact data quality and reliability. These challenges become particularly critical in large-scale studies involving hundreds to thousands of samples analyzed over extended periods, where technical variance can easily obscure biological signals. This application note provides detailed protocols and analytical frameworks to address these critical processing challenges, enabling researchers to produce robust, reproducible lipidomic data suitable for drug development and clinical research applications.
Managing Missing Values in Lipidomic Datasets
Nature and Classification of Missing Data
Missing values represent a pervasive issue in lipidomics, potentially arising from various factors including instrumental detection limits, peak picking errors, integration artifacts, or matrix effects. Proper handling begins with understanding their nature, which falls into three categories:
- Missing Completely at Random (MCAR): Absence is unrelated to any measured or unmeasured variables (e.g., from random sample processing errors).
- Missing at Random (MAR): Absence relates to observed variables (e.g., ion suppression from co-eluting compounds).
- Missing Not at Random (MNAR): Absence relates to the unobserved value itself, most commonly occurring when lipid abundance falls below the instrument's limit of detection [96] [5].
Experimental Protocol for Missing Data Imputation
Procedure:
- Data Filtering: Prior to imputation, filter the dataset to remove lipid variables with an excessive proportion of missing values. A common threshold is >35% missingness across all samples [5].
- Diagnosis: Investigate potential causes for missingness. Examine whether missing values correlate with low-intensity signals or specific sample groups.
- Selection of Imputation Method: Choose an imputation strategy based on the diagnosed type of missing data. Table 1 summarizes the recommended methods and their applications.
- Implementation: Apply the selected method using appropriate software tools and parameters.
- Documentation: Clearly report the percentage of missing values, the imputation method used, and the software implementation in all publications.
Table 1: Performance and Application of Common Imputation Methods in Lipidomics
| Imputation Method | Best Suited For | Performance Notes | Protocol References |
|---|---|---|---|
| Half-Minimum (HM) | MNAR (values below LOD) | Recommended for shotgun lipidomics; consistently outperforms zero imputation [96] [97]. | Replace missing values with half of the minimum positive value for that lipid across all samples. |
| k-Nearest Neighbors (kNN-based) | MCAR, MAR, and MNAR | kNN-TN (truncated normal) and kNN-CR (correlation) perform well across all missingness types, ideal when the type is uncertain [96] [5] [97]. | Impute using the average value from the k most similar lipids (based on correlation or Euclidean distance) that have measured values. |
| Random Forest | MCAR, MAR | Powerful for MCAR; less effective for MNAR; handles complex, non-linear relationships between lipids [96] [5]. | Train a random forest model on observed data to predict missing values. |
| Mean/Median Imputation | MCAR | Simple but can distort data structure; mean imputation generally performs better than median for MCAR [96]. | Replace missing values with the mean or median of the measured values for that lipid. |
The following workflow diagram outlines the logical decision process for diagnosing and addressing missing values in a lipidomics dataset:
Correcting for Batch Effects
Batch effects are systematic technical variations introduced when samples are processed or analyzed in different batches, by different operators, or across different instrument runs. These effects can arise from numerous sources, including reagent lot variations, instrumental drift over time, column aging, and environmental fluctuations [98] [99]. In large-scale studies spanning weeks or months, such effects are inevitable and can severely reduce statistical power and lead to false conclusions if not properly addressed [98].
Systematic Error Removal Using Random Forest (SERRF) Protocol
The SERRF algorithm is a powerful QC-based normalization method that uses a random forest model to correct for systematic errors, leveraging the correlation structure between lipids in quality control (QC) samples [98].
Materials:
- Quality Control (QC) Samples: A pooled sample created by combining small aliquots of all study samples [98] [5].
- Instrument System: UHPLC-MS/MS system capable of analyzing hundreds of samples sequentially.
Experimental Workflow:
- Sample Sequence Design: Intersperse QC samples regularly throughout the analytical sequence (e.g., every 5-10 study samples) [98].
- Data Acquisition: Run the entire sample sequence, including all study samples and QCs, acquiring data in a randomized order to avoid confounding with biological groups.
- Data Preprocessing: Perform initial peak picking, alignment, and integration to generate a raw data matrix of lipid intensities.
- SERRF Normalization:
- Step 1: Autoscale all lipid intensity variables for both QCs and study samples.
- Step 2: For each lipid, train a random forest model using the QC sample data. The model uses the injection order, batch identifier, and intensities of all other lipids in the QCs as predictors to estimate the systematic error for the target lipid.
- Step 3: Apply the trained model to predict and correct the systematic error in both QC and study samples for that lipid.
- Step 4: Normalize each lipid's intensity using the equation: ( Ii' = \frac{Ii}{si} \bar{Ii} ), where ( Ii' ) is the normalized intensity, ( Ii ) is the raw intensity, ( si ) is the predicted systematic error, and ( \bar{Ii} ) is the median raw intensity [98].
- Validation: Assess normalization effectiveness by examining the reduction in technical variance (e.g., relative standard deviation of lipids in QCs) and the improved clustering of QC samples in PCA scores plots.
Ratio-Based Batch Effect Correction Protocol
For studies where batch effects are completely confounded with biological groups, a reference-material-based ratio method has proven highly effective [99].
Materials:
- Reference Materials: Commercially available or internally standardized reference samples (e.g., NIST Standard Reference Material 1950 for plasma) [5] [99].
- Instrument System: UHPLC-MS/MS system.
Experimental Workflow:
- Reference Sample Inclusion: In each analytical batch, include multiple replicates of the chosen reference material alongside the study samples.
- Data Acquisition: Run samples and reference materials concurrently.
- Ratio Calculation: For each lipid in every study sample, calculate a ratio value by dividing its absolute intensity by the mean intensity of the same lipid in the reference sample replicates from the same batch [99].
- Data Integration: Use these ratio-scale values for all downstream statistical analyses and data integration across batches.
Table 2: Comparison of Batch Effect Correction Methods
| Method | Principle | Best Application Scenario | Advantages | Limitations |
|---|---|---|---|---|
| SERRF [98] | Machine learning (Random Forest) using QC samples to model systematic error. | Large-scale studies with regularly interspersed QC samples; non-linear drifts. | Corrects for complex, non-linear drifts; uses correlation structure between lipids; handles p ≫ n data. | Requires many QC samples; model must be retrained for each study. |
| Ratio-Based [99] | Scaling feature values relative to a common reference material analyzed concurrently. | Confounded batch-group designs; multi-center studies; method transfer. | Highly effective in confounded scenarios; simple implementation; improves cross-lab comparability. | Requires sufficient reference material; assumes reference is stable and representative. |
| ComBat [99] | Empirical Bayes framework to adjust for batch effects. | Balanced batch-group designs; known batch factors. | Well-established; handles multiple batches; preserves biological variance in balanced designs. | Struggles with confounded designs; assumes parametric distributions. |
Achieving Accurate Peak Alignment
The Peak Alignment Challenge
Peak alignment ensures that the same lipid species detected across multiple samples are correctly matched, which is a prerequisite for reliable quantitative analysis. Misalignment leads to missing values and incorrect quantitation. This challenge is particularly acute in MALDI-TOF data but remains significant in UHPLC-MS/MS due to retention time shifts caused by column aging, mobile phase variations, and temperature fluctuations [100].
Rapid Peak Alignment Method (RPAM) Protocol
RPAM provides a streamlined approach for aligning peaks across multiple samples, balancing accuracy with processing time [100].
Materials:
- Software: Microsoft Excel 365 or compatible spreadsheet software.
- Input Data: A list of mass-to-charge (m/z) values and corresponding intensities for each sample.
Experimental Procedure: The RPAM protocol consists of three stages, as visualized in the workflow below:
Stage 1: Automated High-Throughput Alignment
- Input the m/z and intensity values for all samples into a structured Excel template.
- Round all m/z values to their nearest integer values.
- Automatically align peaks across samples based on these integer m/z values, placing peaks with the same integer in the same row.
Stage 2: Manual Fine-Tuning
- Identify instances where a single sample contains multiple peaks with the same integer m/z but different decimal values (e.g., 834.1 and 834.4).
- Insert new rows in the alignment table to accommodate these peaks.
- Manually place the correct m/z and intensity values into the proper rows for each affected sample.
Stage 3: Revision
- Calculate the standard deviation of m/z values for each aligned peak across samples.
- Identify rows with a standard deviation exceeding 0.25, which are highlighted for review.
- Check these rows for misaligned peaks and move them to the correct neighboring row (±1 Da) if necessary.
- For peaks that cannot be aligned to neighbors, insert additional rows as needed [100].
Performance Comparison of Alignment Methods
Table 3: Evaluation of Peak Alignment Methods for MALDI-TOF Lipidomics Data
| Method | Time Required | Number of Peaks Detected | Number of Lipids Identified | Standard Deviation of m/z |
|---|---|---|---|---|
| Manual Alignment | 8-10 hours | 2595 | 244 | 0.07 |
| RPAM [100] | 90 minutes | 2595 | 246 | 0.03 |
| ClinProTools | <1 minute | 2400 | 63 | 0.05 |
| R Software | <1 minute | 634 | 165 | 0.00 |
Data adapted from evaluation of 24 rat frontal lobe samples analyzed by MALDI-TOF MS [100].
The Scientist's Toolkit: Essential Research Reagents and Materials
Successful implementation of the protocols described in this note requires careful selection of quality materials and reagents. The following table details key solutions for a robust lipidomics workflow.
Table 4: Essential Research Reagent Solutions for UHPLC-MS/MS Lipidomics
| Reagent/Material | Function/Application | Protocol Examples |
|---|---|---|
| Quality Control (QC) Pool Sample | Monitor technical variance; correct batch effects using SERRF. | Created by pooling aliquots of all study samples; analyzed every 5-10 injections [98] [5]. |
| Certified Reference Material (e.g., NIST SRM 1950) | Standardize measurements across batches/labs; ratio-based batch correction. | Included in each batch as a reference for scaling study sample values [5] [99]. |
| Internal Standard Mixture (e.g., SPLASH Lipidomix) | Correct for extraction efficiency, ionization variation, and instrument response drift. | Added to each sample prior to lipid extraction; used for normalization and quantification [82] [66]. |
| Biphasic Extraction Solvents (MTBE/Chloroform, MeOH, Hâ‚‚O) | Comprehensive extraction of lipid classes from biological matrices. | Used in liquid-liquid extraction protocols (e.g., MTBE or Folch method) to isolate lipids [66] [81]. |
| Pierce Positive & Negative Ion Calibration Solutions | Calibrate mass accuracy of the MS instrument before data acquisition. | Essential for maintaining high mass accuracy required for lipid identification [82]. |
Integrated Data Processing Workflow
For an effective UHPLC-MS/MS lipidomics study, the individual protocols described above should be integrated into a comprehensive data processing pipeline. The following workflow provides a visual overview of how these steps connect, from raw data to a normalized, analysis-ready dataset.
Lipidomic Biomarker Validation and Platform Comparison: Ensuring Clinical Translation
In the development of a robust ultra performance liquid chromatography tandem mass spectrometry (UPLC-MS/MS) lipidomics protocol, establishing core analytical validation parameters is a critical prerequisite for generating reliable, reproducible, and high-quality scientific data. These parameters—linearity, limit of detection (LOD), limit of quantification (LOQ), precision, and accuracy—form the foundation of any method intended for the characterization of complex lipidomes in biological systems [101]. This document outlines detailed protocols and application notes for establishing these parameters, framed within a broader thesis on UPLC-MS/MS lipidomics protocol research. The workflows and values presented are synthesized from current, peer-reviewed methodologies to serve as a practical guide for researchers, scientists, and drug development professionals.
Experimental Protocols and Workflows
Key Experimental Protocols for Validation
A typical validation workflow for a UPLC-MS/MS lipidomics method involves a series of structured experiments. The following protocols are adapted from established methodologies in the literature [22] [101] [102].
Protocol 1: Sample Preparation for Calibration, Precision, and Accuracy This protocol is crucial for generating the samples needed to validate linearity, LOD, LOQ, precision, and accuracy.
- Stock and Working Solutions: Prepare a primary stock solution of a certified lipid standard (e.g., Arachidonic Acid) in a suitable solvent like ethanol. Serially dilute this stock to create a series of working standard solutions covering the expected concentration range in the biological matrix [102].
- Calibration Standards: Spike the working standards into a surrogate matrix (e.g., Bovine Serum Albumin solution) or a blank authentic matrix (e.g., pooled human serum) to create matrix-matched calibration standards. A zero-calibrator (blank with internal standard) and a zero-blank (blank without internal standard) should also be prepared [102].
- Quality Control (QC) Samples: Prepare QC samples at a minimum of three concentration levels (low, medium, high) in the same matrix as the calibration standards. These are used to assess accuracy and precision [102].
- Lipid Extraction: For complex lipidomic profiling, employ a liquid-liquid extraction. The methyl-tert-butyl ether (MTBE) method is widely used for its efficiency and reproducibility [101].
- Add a mixture of methanol and MTBE to the sample.
- Vortex and centrifuge to induce phase separation.
- Collect the upper organic layer containing the lipids.
- Evaporate the solvent under a gentle stream of nitrogen and reconstitute the dried extract in a starting mobile phase solvent compatible with the UPLC-MS/MS method [21] [101].
Protocol 2: Method Validation Experiment for LOD and LOQ Determination
- Sample Preparation: Prepare a series of samples with progressively lower concentrations of the analyte of interest in the biological matrix.
- Data Acquisition: Analyze these low-concentration samples using the developed UPLC-MS/MS method. The LOD and LOQ can be determined based on signal-to-noise ratio (S/N) or standard deviation of the response [102].
- Calculation via S/N: Inject the samples and measure the S/N for the analyte peak.
- LOD: The concentration at which the S/N is at least 3:1.
- LOQ: The concentration at which the S/N is at least 10:1.
- Calculation via Standard Deviation: Analyze multiple replicates (n≥5) of a blank matrix and a low-concentration sample.
- LOD = 3.3 * σ / S, where σ is the standard deviation of the response of the blank, and S is the slope of the calibration curve.
- LOQ = 10 * σ / S [102].
Protocol 3: Intra-day and Inter-day Precision and Accuracy Assessment
- Sample Preparation: Prepare QC samples at low, medium, and high concentrations (as in Protocol 1) in multiple replicates (e.g., n=5).
- Intra-day Assay: Analyze all replicates of the three QC levels within a single analytical run on the same day.
- Inter-day Assay: Analyze replicates of the three QC levels over three separate, non-consecutive days.
- Data Analysis:
- Precision: Calculate the relative standard deviation (RSD%) of the measured concentrations for the QC replicates at each level, for both intra-day and inter-day assays. The RSD% should generally not exceed 15% [101] [102].
- Accuracy: Calculate the percentage of the measured mean concentration relative to the nominal (theoretical) concentration for each QC level. The result should typically be within 85-115% of the nominal value [102].
The logical flow of the overall validation process, integrating these protocols, is summarized in the diagram below.
The Scientist's Toolkit: Essential Research Reagents and Materials
The table below lists key reagents and materials critical for executing the validation protocols in UPLC-MS/MS lipidomics.
Table 1: Key Research Reagent Solutions for Lipidomics Validation
| Item | Function/Application | Example Specifications/Citations |
|---|---|---|
| Synthetic Lipid Standards | Used for preparing calibration curves, QC samples; essential for quantifying target lipids. | High-purity (>97%) standards from commercial suppliers (e.g., Avanti Polar Lipids). Examples: Arachidonic Acid [102]. |
| Stable Isotope-Labeled Internal Standards (IS) | Correct for analyte loss during sample preparation and matrix effects during ionization; critical for accuracy and precision. | Deuterated analogs (e.g., Arachidonic acid-d8) [102]. Commercial mixes (e.g., EquiSPLASH) contain multiple IS for different lipid classes [21] [3]. |
| LC-MS Grade Solvents | Used for mobile phase preparation and lipid extraction; high purity minimizes background noise and ion suppression. | Methanol, Acetonitrile, Isopropanol, Chloroform, MTBE [101] [102]. |
| Additives for Mobile Phase | Modify mobile phase to improve chromatographic separation and ionization efficiency. | Ammonium formate, Ammonium acetate, Formic acid [101] [102]. |
| Surrogate Matrix | Used for preparing calibration standards when a true blank matrix is unavailable. | Bovine Serum Albumin (BSA) at physiologically relevant concentrations (e.g., 55 g/L) [102]. |
Data Presentation: Summarized Validation Parameters
The following tables consolidate typical validation data and parameters from recent lipidomics studies, providing a benchmark for expected outcomes.
Table 2: Summarized Linear Range, LOD, and LOQ from Validation Studies
| Analyte / Study Focus | Matrix | Linear Range | LOD | LOQ | Citation |
|---|---|---|---|---|---|
| Arachidonic Acid | Human Serum | 0.5 - 5.0 µg/mL | 0.046 µg/mL | 0.133 µg/mL | [102] |
| Complex Lipidome Profiling | Grape Reference Sample | Not explicitly stated, but 412 lipids were semi-quantified. | Method designed for a wide dynamic range to cover lipid concentrations from "attomole to nanomole" levels. | [22] [103] | |
| Untargeted Lipidomics | Plasma & Extracellular Vesicles | Broad, untargeted profiling. | Relies on high-sensitivity MS for detecting low-abundance lipids. | [101] |
Table 3: Summarized Precision and Accuracy Data from Validation Studies
| Analyte / Study Focus | Matrix | Precision (RSD%) | Accuracy (%) | Citation |
|---|---|---|---|---|
| Arachidonic Acid | Human Serum | Intra-day and Inter-day: < 14% | Reported as acceptable per ICH M10 guideline | [102] |
| Enhanced Lipidomics Workflow | Plasma & EVs | Implied requirement for high reproducibility in complex matrices. | Improved quantitative accuracy via advanced extraction and internal standardization. | [101] |
| Single-Cell Lipidomics | Single PANC-1 Cells | Critical due to minimal sample volume; requires robust protocols. | Highlighted as a key challenge; dependent on careful blank correction and standardized sampling. | [21] [3] |
The rigorous establishment of linearity, LOD, LOQ, precision, and accuracy is not a mere procedural formality but the cornerstone of a credible UPLC-MS/MS lipidomics protocol. As demonstrated by the referenced studies, adherence to structured experimental protocols and the use of high-quality reagents are paramount. The quantitative benchmarks provided here, derived from current research, offer a framework for validating methods intended to unravel the complexity of biological lipidomes, from bulk tissue analysis down to the single-cell level. A properly validated method ensures that subsequent biological interpretations and potential diagnostic or drug development applications are built upon a foundation of reliable and analytically sound data.
A Framework for Biological and Clinical Biomarker Validation
Biomarker validation is a critical process that determines the reliability and utility of a biomarker for its intended clinical or biological purpose. In the context of lipidomics, which involves the comprehensive analysis of lipids in biological systems, biomarker validation establishes a foundation for understanding disease mechanisms, identifying therapeutic targets, and developing diagnostic tools [104]. The complexity of lipid biochemistry, with its hundreds of thousands of distinct molecular species, presents unique challenges for validation that require sophisticated analytical approaches such as ultra-performance liquid chromatography tandem mass spectrometry (UPLC-MS/MS) [104] [16].
Lipidomics falls under the larger umbrella of metabolomics but represents a distinct discipline due to the special physical and chemical characteristics of lipids compared to water-soluble metabolites [104]. The structural diversity of lipids arises from variations in acyl chain lengths, degrees of unsaturation, locations of double bonds, and functional groups, creating analytical challenges that must be addressed through rigorous validation frameworks [104]. Within precision medicine, validated lipid biomarkers can inform clinical decision-making, improve diagnosis, and serve as useful prognostic and predictive factors for clinical outcomes [105].
This application note outlines a comprehensive framework for biological and clinical biomarker validation, with specific emphasis on lipid biomarkers identified through UPLC-MS/MS lipidomics protocols. We detail experimental methodologies, analytical considerations, and statistical approaches necessary to establish biomarkers as fit-for-purpose in both research and clinical settings.
Theoretical Foundation: The V3 Framework
The validation of biomarkers, including lipid biomarkers, requires a structured approach to ensure they are fit-for-purpose. The V3 framework—comprising Verification, Analytical Validation, and Clinical Validation—provides a robust foundation for this process [106].
Verification
Verification constitutes the initial stage where hardware manufacturers systematically evaluate sample-level sensor outputs. This process occurs computationally (in silico) and at the bench (in vitro), establishing that the hardware components meet specified technical requirements [106]. In lipidomics, this includes verifying that UPLC-MS/MS instruments can detect and resolve lipid species within the expected concentration ranges and structural diversity.
Analytical Validation
Analytical validation forms the bridge between engineering and clinical expertise, translating evaluation procedures from the bench to in vivo applications. This stage focuses on assessing data processing algorithms that convert sample-level sensor measurements into physiologically meaningful metrics [106]. For lipid biomarkers, this involves demonstrating that the analytical method can accurately identify and quantify specific lipid molecular species in relevant biological matrices.
Clinical Validation
Clinical validation demonstrates that the biomarker acceptably identifies, measures, or predicts a clinical, biological, physical, or functional state within a defined context of use [106]. This stage is typically performed by clinical trial sponsors on patient cohorts with and without the phenotype of interest. For lipid biomarkers, this establishes the relationship between lipid measurements and clinical endpoints.
Lipidomics-Specific Validation Workflow
The validation of lipid biomarkers requires specialized workflows that address the unique challenges of lipid analysis. The following diagram illustrates the comprehensive workflow from sample preparation to clinical validation:
Sample Preparation Protocol
Proper sample preparation is critical for reliable lipidomic analysis. The following protocol details the optimized steps for lipid extraction:
Materials:
- Inhibition Mixture: 2 mM EDTA (ethylenediaminetetraacetic acid) and 100 μM BHT (butylated hydroxytoluene) in methanol
- Extraction Solvent: HPLC-grade chloroform and methanol (2:1 ratio) or methyl tert-butyl ether (MTBE)
- Glassware: Glass tubes or vials (to prevent plasticizer contamination)
- Centrifuge: Capable of maintaining 4°C and achieving 3500 RCF
Procedure:
- Sample Stabilization:
- For tissues: Flash-freeze in liquid nitrogen and minimize handling before extraction
- For cell pellets: Process directly to avoid changes in lipid composition
- Add inhibition mixture to prevent unsaturated lipid oxidation and lipase activity
Lipid Extraction:
- Mix sample (e.g., 100 mg flash-frozen tissue homogenate or 1×10ⷠcells) with equal volume of methanol
- Vortex for 1 minute
- Add chloroform (typically same volume as buffer plus methanol)
- Repeat extraction three times
- Centrifuge at 4°C for 10 minutes at 3500 RCF after each extraction to separate organic and aqueous phases
Sample Concentration and Storage:
- Combine lower chloroform phases
- Evaporate to dryness using nitrogen gas evaporator
- Store under argon atmosphere at -80°C until analysis [107]
UPLC-MS/MS Analysis Method
Chromatographic separation of lipids is challenging due to their structural diversity and varied chemical properties. The following UPLC-MS/MS method provides comprehensive lipid analysis:
Chromatographic Conditions:
- Column: Reversed-phase C18 column (e.g., 100 mm × 2.1 mm, 1.7-μm particles)
- Column Temperature: 50°C
- Mobile Phase A: 10 mM ammonium acetate or formate solution in 40% acetonitrile in water
- Mobile Phase B: 10 mM ammonium acetate or formate solution in 10% acetonitrile in isopropanol
- Gradient Program:
- Start at 65% A and 35% B
- Reach 80% B in 2 minutes
- Reach 100% B in 7 minutes
- Hold at 100% B for 7 minutes
- Flow Rate: 0.400 mL/min
- Injection Volume: 2.0 μL
- Total Run Time: 27 minutes [107] [16]
Mass Spectrometric Conditions:
- Ionization Mode: Electrospray ionization (ESI) in positive and/or negative mode
- Mass Analyzer: Quadrupole time-of-flight (QTOF) or orbital trap mass spectrometer
- Mass Range: m/z 300-1200
- Scan Duration: 0.2 seconds
- Mass Resolution: Target resolution of R = 60,000 for accurate mass measurement
- Tandem MS: MSâ¿ capability with normalized collision energy of 30% for structural identification [16]
Analytical Validation Parameters for Lipid Biomarkers
Analytical validation establishes that the biomarker assay is reliable, reproducible, and fit-for-purpose. The following table summarizes key validation parameters for lipid biomarkers:
Table 1: Analytical Validation Parameters for Lipid Biomarkers
| Validation Parameter | Acceptance Criteria | Experimental Approach |
|---|---|---|
| Linearity | >4 orders of magnitude with R² > 0.99 | Calibration curves using authentic standards at 5-7 concentrations [17] |
| Accuracy | 85-115% of true value | Spike-recovery experiments using known amounts of lipid standards [17] |
| Precision | Intra-day and inter-day CV < 15% | Repeated analysis of QC samples (n=5) across multiple days [17] |
| Limit of Quantification (LOQ) | Few femtomoles on column | Signal-to-noise ratio ≥10 with accuracy 80-120% and precision <20% CV [17] [20] |
| Selectivity | No interference from matrix components | Analysis of blank matrix samples and assessment of ion suppression/enhancement [17] |
| Carryover | < 0.5% of previous sample peak area | Injection of blank solvent after high concentration sample [16] |
Method Validation Protocol
The following protocol details the experimental procedures for establishing key validation parameters:
Linearity and Calibration:
- Prepare calibration standards using authentic lipid standards at 5-7 concentrations covering the expected biological range
- Include internal standards (e.g., deuterated lipids) for normalization
- Analyze standards in triplicate using the UPLC-MS/MS method
- Plot peak area ratios (analyte to internal standard) against concentration
- Calculate correlation coefficient (R²) and linear regression parameters
Accuracy and Precision:
- Prepare quality control (QC) samples at low, medium, and high concentrations
- Analyze five replicates of each QC level in a single day (intra-day precision)
- Analyze each QC level once daily for five days (inter-day precision)
- Calculate percent coefficient of variation (% CV) for precision
- Calculate percent deviation from nominal concentration for accuracy
Sensitivity Determination:
- Prepare serial dilutions of lipid standards approaching the detection limit
- Analyze samples with decreasing concentrations
- Determine Limit of Detection (LOD) as concentration with signal-to-noise ratio ≥ 3
- Determine Limit of Quantification (LOQ) as the lowest concentration with signal-to-noise ratio ≥ 10, accuracy 80-120%, and precision < 20% CV [20]
Clinical Validation and Statistical Considerations
Clinical validation establishes the relationship between the biomarker measurement and clinical endpoints. This requires careful study design and appropriate statistical analysis to avoid common pitfalls.
Biomarker Study Design
Prognostic vs. Predictive Biomarkers:
- Prognostic Biomarkers: Identified through main effect test of association between biomarker and outcome in properly conducted retrospective studies
- Predictive Biomarkers: Identified through interaction test between treatment and biomarker in randomized clinical trials [105]
Case Study: IPASS Clinical Trial The IPASS study provides a classic example of predictive biomarker validation. Patients with advanced pulmonary adenocarcinoma were randomly assigned to receive gefitinib or carboplatin plus paclitaxel. EGFR mutation status was determined retrospectively. The interaction between treatment and EGFR mutation was highly statistically significant (P<0.001), demonstrating that EGFR mutation status predicts response to gefitinib treatment [105].
Statistical Considerations and Multiplicity
Statistical concerns such as confounding and multiplicity are common in biomarker validation studies and must be addressed to ensure reproducible findings [108].
Table 2: Statistical Metrics for Biomarker Evaluation
| Metric | Description | Interpretation |
|---|---|---|
| Sensitivity | Proportion of cases that test positive | Ability to correctly identify true positives |
| Specificity | Proportion of controls that test negative | Ability to correctly identify true negatives |
| Positive Predictive Value | Proportion of test positive patients who have the disease | Function of disease prevalence |
| Negative Predictive Value | Proportion of test negative patients who truly do not have the disease | Function of disease prevalence |
| Area Under ROC Curve | How well the marker distinguishes cases from controls | Ranges from 0.5 (coin flip) to 1 (perfect discrimination) |
| Calibration | How well a marker estimates the risk of disease or event | Agreement between predicted and observed outcomes [105] |
Addressing Multiplicity:
- Control false discovery rate (FDR) when evaluating multiple biomarkers
- Use methods such as Tukey, Bonferroni, Scheffe, or Benjamini-Hochberg for multiple testing corrections
- Prioritize outcomes or develop composite endpoints to reduce multiple comparisons [108] [105]
Within-Subject Correlation:
- Account for correlated results when multiple observations are collected from the same subject
- Use mixed-effects linear models to account for dependent variance-covariance structure
- Inflated type I error rates can result from analyzing correlated data as independent observations [108]
Essential Research Reagents and Materials
The following table details key reagents and materials essential for successful lipid biomarker validation studies:
Table 3: Essential Research Reagents for Lipid Biomarker Validation
| Reagent/Material | Function | Specifications |
|---|---|---|
| Internal Standards | Quantification normalization | Deuterated or ¹³C-labeled lipid standards (e.g., PC(16:1/0:0-D3), TG(16:0/16:0/16:0-¹³C₃)) [16] |
| Lipid Extraction Solvents | Lipid extraction from biological matrices | HPLC-grade chloroform, methanol, methyl tert-butyl ether (MTBE) [17] [107] |
| Antioxidants | Prevent oxidation of unsaturated lipids | EDTA (2 mM final concentration), BHT (100 μM final concentration) [107] |
| UPLC Mobile Phase Additives | Enhance ionization and separation | Ammonium acetate or formate (10 mM) [17] [16] |
| Chromatography Columns | Lipid separation | Reversed-phase C18 column (e.g., 100 mm × 2.1 mm, 1.7-μm particles) [17] [16] |
| Quality Control Materials | Method validation | Pooled biological matrix (plasma, serum, tissue homogenate) [20] |
Case Study: Validation of Medium-Chain Phosphatidylcholines as CAD Biomarkers
A recent study demonstrates the complete workflow for lipid biomarker validation. Medium-chain phosphatidylcholines (MCPCs) with C8 and C10 fatty acyl residues were found to be significantly upregulated in patients with acute coronary syndrome (ACS) compared to chronic coronary syndrome (CCS) and healthy controls [20].
Validation Workflow:
- Discovery Phase: Untargeted lipidomics identified MCPCs as potential biomarkers
- Targeted Method Development: Optimized UPLC-QTrap-MS/MS method with multiple reaction monitoring (MRM)
- Analytical Validation: Established linearity, precision, accuracy, and LOQs in the range of 0.5-5 nmol/L
- Clinical Validation: Applied the method to platelet samples from CAD patients to confirm differential expression
Methodology Details:
- Column: Charged surface hybrid (CSH) C18 (1.7 μm, 130 Å)
- Mobile Phase: Fine-tuned gradient elution with 2-propanol/acetonitrile and ammonium acetate
- Quantification: Matrix-matched calibration with MCPC standards as surrogate calibrants
- Internal Standard: PC 6:0/6:0(d22)
- Innovation: Organic solvent and fatty acyl carbon number-corrected response factor approach for MCPCs without commercially available standards [20]
This case study illustrates the complete transition from biomarker discovery to validated analytical method ready for clinical application.
The validation of lipid biomarkers requires a comprehensive framework that addresses both analytical and clinical considerations. The V3 framework—encompassing verification, analytical validation, and clinical validation—provides a structured approach to establish biomarkers as fit-for-purpose. UPLC-MS/MS-based lipidomics offers the sensitivity, selectivity, and structural elucidation capabilities necessary for comprehensive lipid biomarker validation. By implementing the protocols, statistical considerations, and validation parameters outlined in this application note, researchers can advance lipid biomarkers from discovery to clinical application, ultimately supporting precision medicine initiatives through robust biomarker-driven clinical decision making.
Lipidomics, the comprehensive analysis of lipids in biological systems, requires sophisticated analytical platforms to address the immense structural diversity and wide concentration range of lipid molecules. Ultra-high-performance liquid chromatography coupled to tandem mass spectrometry (UHPLC-MS/MS) has become the cornerstone of modern lipidomics, with several platform configurations offering distinct capabilities. The UHPLC-QTrap system, characterized by its exceptional sensitivity in Multiple Reaction Monitoring (MRM) mode, is predominantly used for targeted lipid quantification. The UHPLC-Q-TOF (Quadrupole Time-of-Flight) platform offers high mass accuracy and resolution, making it ideal for untargeted lipid discovery and identification. More recently, Ion Mobility (IM) systems integrated with UHPLC and MS have introduced an additional separation dimension based on the rotationally averaged collision cross-section (CCS) of ions, providing enhanced isomer separation and improved peak capacity.
The selection of an appropriate platform is critical for research outcomes, as each technology offers distinct trade-offs in coverage, sensitivity, throughput, and structural elucidation power. This analysis provides a detailed comparison of these three platform types, supported by experimental data and practical protocols, to guide researchers in selecting the optimal configuration for specific lipidomics applications in drug development and biomedical research.
Platform Comparison and Performance Characteristics
Technical Specifications and Performance Metrics
Table 1: Comparative Performance of Lipidomics Platforms
| Platform Feature | UHPLC-QTrap | UHPLC-Q-TOF | Ion Mobility MS |
|---|---|---|---|
| Mass Accuracy | Moderate (ppm range) | High (<5 ppm) | High (<5 ppm) |
| Resolving Power | Unit resolution | High (≥30,000) | High (≥30,000) |
| Optimal Analysis Mode | Targeted quantification | Untargeted profiling | Untargeted/Targeted |
| Isomer Separation | Limited | Limited | Excellent (CCS values) |
| Lipidome Coverage | Hundreds of targeted lipids | 800-1000+ lipids | 1000+ lipids |
| Quantitation | Excellent (Linear range >4 orders) | Good (Semi-quantitative) | Good to Excellent |
| Throughput | High (Fast MRM transitions) | Moderate | Fast (8 min methods) |
| Key Strength | High sensitivity quantification | Broad lipid discovery | Isomer resolution & confidence |
Application-Specific Performance Data
Table 2: Documented Lipid Identification Performance Across Platforms
| Platform | Application Context | Lipids Identified | Key Metrics | Citation |
|---|---|---|---|---|
| UHPLC-QTrap | Fermented sheep milk analysis | 887 lipids across 30 subclasses | Semi-quantitative; 91 significantly different lipids | [109] |
| UHPLC-QTrap | Polar lipids in dairy colostrum | 206 polar lipids across 11 subclasses | Rigorous statistical screening (VIP>1, p<0.05) | [110] |
| Ion Mobility MS | Colorectal cancer plasma | 115 significantly changed lipids | 8-minute method; 1000+ lipids per analysis | [111] |
| LC-MS (Various) | Single-cell lipidomics | Variable by platform | Enhanced coverage with polarity switching, IM, EAD | [3] |
| UHPLC-Q-TOF | Global lipid profiling | ~800 lipid species | 12-minute method; 100 samples/day throughput | [16] |
Detailed Experimental Protocols
Sample Preparation Protocol
A standardized sample preparation protocol ensures reproducible lipid extraction across all platforms:
Sample Homogenization: For tissue samples (∼10 mg), homogenize with 200 μL of water using a mechanical homogenizer (e.g., Precellys 24). For liquid samples (e.g., plasma), dilute 60 μL to 400 μL with water. [111]
Lipid Extraction: Implement modified MTBE (methyl-tert-butyl ether) method:
- Add 960 μL of extraction solvent (MTBE:MeOH = 5:1, v/v) containing appropriate internal standards (e.g., SPLASH LIPIDOMIX Mass Spec Standard).
- Vortex for 60 seconds, sonicate for 10 minutes in a water bath (4°C), and centrifuge at 3000 rpm for 15 minutes (4°C).
- Collect 500 μL of the upper organic layer.
- Repeat extraction twice more with 500 μL MTBE each time to ensure high recovery.
- Pool organic layers and evaporate to dryness using a vacuum concentrator at 4°C.
- Store dried extract at -80°C and reconstitute with 100 μL of DCM:MeOH (1:1, v/v) before analysis. [111]
Quality Control: Prepare pooled quality control (QC) samples by combining aliquots of all samples. Inject QC samples at regular intervals (every 10-12 samples) throughout the analytical sequence to monitor instrument performance. [111]
UHPLC-QTrap Method for Targeted Lipid Quantification
The QTrap platform excels in sensitive, targeted quantification of specific lipid classes:
Chromatography:
- Column: Charged surface hybrid (CSH) C18 (1.7 μm, 130 Å) or equivalent.
- Mobile Phase A: Acetonitrile/water (60:40, v/v) with 10 mM ammonium acetate.
- Mobile Phase B: Acetonitrile/isopropanol (10:90, v/v) with 10 mM ammonium acetate.
- Gradient: Optimize from 20% B to 95% B over 15-20 minutes.
- Flow Rate: 0.2-0.4 mL/min; Temperature: 50°C. [20] [110]
Mass Spectrometry:
- Ionization: ESI positive/negative mode with polarity switching.
- Source Parameters: Temperature 500°C; Ion source gas 1: 0.31 MPa; Ion source gas 2: 0.38 MPa; Curtain gas: 0.24 MPa; Ionspray voltage: ±5500 V.
- Acquisition: Multiple Reaction Monitoring (MRM) mode with optimized collision energies for each lipid transition.
- Scheduled MRM: Use retention time windows to maximize monitoring points across peaks. [110]
Quantification:
- Use matrix-matched calibration curves with stable isotope-labeled internal standards.
- Apply organic solvent and fatty acyl carbon number-corrected response factors for accurate quantification. [20]
UHPLC-Q-TOF Method for Untargeted Lipidomics
The Q-TOF platform provides comprehensive lipid profiling:
Chromatography:
- Column: Acquity UPLC BEH C18 (100 mm × 2.1 mm, 1.7 μm) or equivalent.
- Mobile Phase A: Water with 1% 1M ammonium acetate, 0.1% formic acid.
- Mobile Phase B: Acetonitrile-isopropanol (1:1) with 1% 1M ammonium acetate, 0.1% formic acid.
- Gradient: 35% B to 100% B over 7-20 minutes, hold at 100% B.
- Flow Rate: 0.4 mL/min; Temperature: 50°C. [16]
Mass Spectrometry:
- Ionization: ESI positive and negative modes (separate runs recommended).
- Mass Range: m/z 300-1200 for global lipidomics.
- Acquisition Mode: Data-dependent acquisition (DDA) with MS/MS on top intense ions.
- Mass Resolution: ≥30,000; Mass Accuracy: <5 ppm with lock mass correction.
- Collision Energies: Ramped energies (e.g., 20-40 eV) for comprehensive fragmentation. [16]
Ion Mobility-MS Method for Enhanced Separations
Ion mobility adds a separation dimension that resolves isomeric lipids and reduces spectral complexity:
Chromatography:
- Column: Phenomenex Kinetex C8 (2.6 μm, 50 mm × 2.1 mm) for fast separations.
- Mobile Phase A: Water/acetonitrile (60:40, v/v) with 10 mM ammonium formate and 0.1% formic acid.
- Mobile Phase B: Acetonitrile/isopropanol (10:90, v/v) with 10 mM ammonium formate and 0.1% formic acid.
- Fast Gradient: 8-minute methods possible while maintaining coverage of >1000 lipids.
- Flow Rate: 0.4 mL/min; Temperature: 55°C. [111]
Ion Mobility-Mass Spectrometry:
- Mobility Separation: Trapped ion mobility spectrometry (TIMS) or structures for lossless ion manipulation (SLIM) with ~13 m path length.
- CCS Calibration: Use polyalanine or tune mix for CCS value calibration.
- Acquisition: Parallel accumulation-serial fragmentation (PASEF) method for enhanced MS/MS coverage.
- Adduct Formation: Use sodium or silver ion doping to enhance separation of isomeric lipids. [112] [111]
Data Processing:
- Utilize CCS databases (LipidCCS, AllCCS) for additional identification confidence.
- Align m/z, retention time, and CCS values for comprehensive lipid annotation. [111]
Visualized Workflows
Lipidomics Analysis Workflow
Figure 1: Generalized workflow for lipidomics analysis across platforms, showing common sample preparation followed by platform-specific separation and detection, culminating in integrated data analysis.
IM-MS Multi-dimensional Separation
Figure 2: Ion Mobility-MS workflow demonstrating the orthogonal separation dimensions that provide additional resolving power for complex lipid mixtures.
The Scientist's Toolkit: Essential Research Reagents
Table 3: Essential Research Reagents for Lipidomics
| Reagent/Standard | Function | Application Examples |
|---|---|---|
| SPLASH LIPIDOMIX | Quantitative internal standard mix | Across all platforms for quantification [111] |
| Avanti Polar Lipids Standards | Method development & calibration | Platform optimization & validation [111] [110] |
| MTBE (Methyl-tert-butyl ether) | Lipid extraction solvent | High-recovery extraction from various matrices [111] |
| Ammonium acetate/formate | Mobile phase additives | Enhanced ionization & adduct formation [20] [16] |
| Silver salts | Ion mobility enhancers | Separation of double bond isomers [112] |
| Polyalanine/Tune Mix | CCS calibration | IM-MS platform calibration [111] |
The comparative analysis of lipidomics platforms reveals distinct application niches for each technology. UHPLC-QTrap systems provide superior performance for targeted quantification studies requiring high sensitivity and precise measurement of specific lipid panels, particularly in clinical biomarker validation. UHPLC-Q-TOF platforms excel in discovery lipidomics where comprehensive coverage and accurate mass measurements are prioritized for novel lipid identification. Ion Mobility-MS systems represent the cutting edge, offering enhanced isomer separation and increased confidence in lipid identifications through collision cross-section values, making them ideal for studying structural lipidomics and complex biological matrices.
Platform selection should be driven by specific research questions: QTrap for high-throughput targeted quantification in clinical applications; Q-TOF for untargeted biomarker discovery and comprehensive lipid profiling; and IM-MS for advanced structural elucidation and isomer resolution. As lipidomics continues to evolve, the integration of these complementary technologies will provide the most comprehensive insights into lipid metabolism in health and disease.
Coronary artery disease (CAD) remains a leading cause of global mortality, creating an urgent need for biomarkers that enable early detection and risk stratification before cardiovascular events occur [113]. Lipidomics has emerged as a powerful approach for discovering such biomarkers, revealing the intricate roles lipids play in atherosclerosis pathogenesis [114] [115]. Medium-chain phosphatidylcholines (MC-PCs)—specifically those containing C8 and C10 fatty acyl residues—were recently identified through untargeted lipidomics as potential biomarkers distinguishing acute coronary syndrome (ACS) from chronic coronary syndrome (CCS) and healthy controls [20]. This case study details the targeted validation of these MC-PCs using ultra-high performance liquid chromatography tandem mass spectrometry (UPLC-MS/MS), framing the work within a broader thesis on advanced lipidomics protocols for cardiovascular biomarker development.
Background and Biological Rationale
Phospholipids in CAD Pathogenesis
Phospholipids, particularly phosphatidylcholines (PCs), are fundamental components of plasma lipoprotein surfaces and cellular membranes [114]. They play crucial roles in lipoprotein metabolism by regulating the binding of apolipoproteins and enzymes to lipoprotein surfaces [114]. In atherosclerosis development, the subendothelial retention and modification of apolipoprotein B-containing lipoproteins represent initiating events, during which phospholipid hydrolysis contributes to lipoprotein aggregation and macrophage foam cell formation [114].
The chain length of fatty acids esterified to phospholipids varies significantly, with most physiological PCs containing long-chain fatty acids (C14-C24) [114]. The discovery that MC-PCs with C8 and C10 fatty acyl residues are significantly upregulated in platelets of ACS patients suggests potential roles in platelet activation or heightened metabolic states associated with acute coronary events [20].
LPCAT1 Genetic Variants and Phospholipid Metabolism
Trans-omics analyses integrating genomic and metabolomic data have identified a specific LPCAT1 haplotype associated with CAD progression [115]. LPCAT1 (lysophosphatidylcholine acyltransferase 1) catalyzes the reacylation of lysophosphatidylcholine to form phosphatidylcholine, playing a key role in remodeling the fatty acyl composition of PCs. Genetic variants in LPCAT1 influence phospholipid metabolism and have been associated with CAD risk through integrated analyses of genomic and lipidomic data [115]. This enzyme represents a potential mechanistic link between genetic susceptibility and the altered MC-PC profiles observed in CAD patients.
Diagram 1: Genetic and metabolic pathway linking LPCAT1 to CAD through MC-PCs. LPCAT1 genetic variants influence phospholipid metabolism, which alters MC-PC levels that serve as biomarkers for CAD.
Materials and Methods
Research Reagent Solutions
Table 1: Essential research reagents and materials for MC-PC biomarker validation
| Reagent/Material | Specification | Function/Application |
|---|---|---|
| UHPLC System | Waters ACQUITY I-Class | High-resolution chromatographic separation |
| Mass Spectrometer | QTrap MS/MS with MRM | Sensitive detection and quantification |
| Analytical Column | Charged Surface Hybrid (CSH) C18 (1.7 µm, 130 Å) | Superior lipid separation efficiency |
| Mobile Phase A | 2-propanol/acetonitrile with ammonium acetate | Chromatographic elution |
| Mobile Phase B | Acetonitrile/water (60:40) with ammonium acetate and formic acid | Chromatographic elution |
| Internal Standard | PC 6:0/6:0(d22) | Quantification normalization |
| Calibration Standards | PC 6:0/6:0, PC 8:0/8:0, PC 10:0/10:0, PC 12:0/12:0 | Quantification reference |
| Lipid Extraction Solvent | Pre-cooled methanol-containing formic acid | Protein precipitation and lipid extraction |
| Sample Solvent | Methanol/toluene (9:1 v/v) | Sample reconstitution for analysis |
Sample Preparation Protocol
Platelet Isolation from Whole Blood:
- Collect whole blood using EDTA-treated tubes and centrifuge at 3,000 rpm for 20 minutes at 4°C to separate plasma and cellular components
- Carefully collect the platelet-rich plasma layer, avoiding contamination with other blood cells
- Wash platelets with pre-cooled isotonic phosphate-buffered saline (PBS, pH 7.4) and centrifuge at 5,000 rpm for 15 minutes at 4°C
- Repeat washing step three times to ensure platelet purity [20]
Lipid Extraction from Platelets:
- Add 200 µL of platelet sample to 800 µL of pre-cooled extraction solution (methanol with 1% formic acid)
- Vortex the mixture vigorously for 2 minutes
- Sonicate on ice for 10 minutes to ensure complete lipid extraction
- Centrifuge at 12,000 rpm for 10 minutes at 4°C
- Collect supernatant and vacuum dry
- Reconstitute dried lipid extract in 50 µL methanol/toluene (9:1 v/v) for UPLC-MS/MS analysis [20]
Targeted UPLC-MS/MS Analysis
Chromatographic Conditions:
- Column: CSH C18 (1.7 µm, 130 Å), maintained at 40°C
- Flow Rate: 0.35 mL/min
- Injection Volume: 4 µL
- Mobile Phase:
- A: 2-propanol/acetonitrile with 10 mM ammonium acetate
- B: Acetonitrile/water (60:40, vol/vol) with 10 mM ammonium acetate and 0.1% formic acid
- Gradient Program:
- 0-2.00 min: 40% B
- 2.00-2.10 min: 43-50% B
- 2.10-11.00 min: 50-54% B
- 11.00-11.10 min: 54-70% B
- 11.10-15.00 min: 70-99% B
- 15.10-18.00 min: return to 40% B [20]
Mass Spectrometric Parameters:
- Ionization Mode: ESI negative mode
- Detection: Multiple reaction monitoring (MRM)
- Ion Source Temperature: 100°C
- Capillary Voltage: -2.5 kV
- Mass Range: 50-1000 Da [20]
Diagram 2: UPLC-MS/MS workflow for MC-PC analysis. The process begins with sample preparation, progresses through chromatographic separation, followed by MS detection and quantification, culminating in data analysis.
Quantification Approach
Two quantification methods were employed to ensure accuracy:
Surrogate Calibrant Method:
- Use four commercially available MC-PC standards (PC 6:0/6:0, PC 8:0/8:0, PC 10:0/10:0, PC 12:0/12:0) as surrogate calibrants
- Generate matrix-matched calibration curves using PC 6:0/6:0(d22) as internal standard
- Apply response factors based on structural similarity to target analytes [20]
Corrected Response Factor Method:
- Apply organic solvent and fatty acyl carbon number-corrected response factors
- Account for systematic variations in ionization efficiency
- Validate accuracy against bioanalytical validation guidelines [20]
Results and Analytical Validation
Method Performance Characteristics
Table 2: Analytical performance parameters for MC-PC quantification
| Parameter | Performance Value | Acceptance Criteria |
|---|---|---|
| Linearity Range | 0.5-500 nmol/L | R² > 0.99 |
| Limit of Quantification (LOQ) | 0.5-5 nmol/L | Signal-to-noise ratio > 10 |
| Accuracy | Within ±15% of nominal values | Meeting bioanalytical guidelines |
| Precision (CV) | <15% for intra- and inter-day | Meeting bioanalytical guidelines |
| Recovery | Consistent across extraction batches | CV < 20% |
| Matrix Effects | Minimal ion suppression | Signal variation < 15% |
The optimized targeted UPLC-QTrap-MS/MS assay demonstrated significantly improved sensitivity and selectivity compared to the previous untargeted RPLC-ESI-QTOF-MS/MS method used for discovery [20]. The limits of quantification (LOQs) in the range of 0.5-5 nmol/L enabled reliable detection of low-abundance MC-PCs in platelet samples.
Clinical Validation Findings
The validated method was applied to analyze platelet samples from CAD patients, revealing:
- PC 10:0/8:0, PC 16:0/8:0, PC 10:0/20:4, and PC 10:0/10:0 were significantly upregulated in ACS patients compared to CCS patients and healthy controls
- The MC-PC signature distinguished ACS from CCS with higher specificity than traditional lipid parameters
- The biomarker panel maintained diagnostic accuracy after adjusting for conventional risk factors [20]
Discussion
Analytical Advancements in Lipidomics
This validated UPLC-MS/MS method addresses several challenges in clinical lipidomics, including the need for:
- High sensitivity to detect low-abundance lipid species in limited sample volumes
- Specificity to distinguish structurally similar lipid isomers
- Reproducibility for reliable clinical biomarker application [20] [29]
- Throughput suitable for large-scale clinical validation studies
The direct injection liquid chromatography-mass spectrometry (DI-LC-MS) approach represents a promising alternative for lipidomics, eliminating sample preparation steps and reducing solvent use while maintaining precision [116]. However, for platelet MC-PC analysis, the optimized extraction protocol remains essential for removing interfering compounds and concentrating analytes.
Integration with Multi-Omics Biomarker Discovery
This targeted validation study exemplifies the complete workflow from initial discovery to clinical application. The initial untargeted lipidomics identified MC-PCs as differentially expressed in CAD progression [20], while trans-omics analyses have independently connected genetic variants in LPCAT1 to phospholipid alterations in CAD [115]. Together, these findings suggest a compelling model where genetic predisposition influences phospholipid metabolism, resulting in measurable MC-PC changes that track with disease severity.
Machine learning approaches integrating lipidomic signatures with traditional risk factors have demonstrated enhanced CAD prediction, particularly in healthy-weight individuals where conventional risk scoring performs poorly [113]. The Lipid Risk Score (LRS) developed from comprehensive lipid profiling identified residual risk not captured by the Framingham Risk Score [113], highlighting the potential clinical utility of lipidomic biomarkers.
Future Directions and Clinical Implementation
For successful translation into clinical practice, several steps remain:
- Prospective validation in larger, diverse cohorts to establish clinical utility
- Standardization of pre-analytical variables and analytical protocols
- Automation of sample preparation and data analysis workflows
- Regulatory approval through established pathways for laboratory-developed tests
The analytical validation presented here provides a foundation for these future developments, demonstrating that precise quantification of MC-PCs in platelets is feasible using UPLC-MS/MS technology.
This case study demonstrates a validated UPLC-MS/MS method for quantifying MC-PCs in human platelets, confirming their potential as biomarkers for distinguishing ACS from CCS. The analytical protocol shows excellent sensitivity, precision, and accuracy, meeting rigorous bioanalytical validation criteria. The successful transition from untargeted discovery to targeted validation illustrates a complete lipidomics workflow applicable to CAD biomarker development. Integration of these lipidomic biomarkers with genetic and clinical data represents a promising path toward improved CAD risk stratification and personalized prevention strategies.
Liquid chromatography coupled to mass spectrometry (LC-MS) has become the gold standard methodology for comprehensive lipidome profiling, essential for understanding biological systems and disease mechanisms in drug development [117]. However, the selection of an appropriate instrumental platform presents a significant challenge, requiring careful balancing of performance metrics—including sensitivity, analytical throughput, and lipid coverage—against experimental goals and resource constraints. This application note provides a structured, evidence-based benchmark of current LC-MS lipidomics technologies. We synthesize performance data from multiple recent studies to guide researchers and scientists in selecting and optimizing platforms for robust lipidomic analysis, framed within the broader context of developing ultra-performance liquid chromatography tandem mass spectrometry (UPLC-MS/MS) lipidomics protocols.
Experimental Protocols for Cross-Platform Lipidomics
Standard Flow Reversed-Phase LC-HRMS for Plasma Lipidome Profiling
This protocol details the creation of a highly curated lipid database for human plasma using reversed-phase ultra-high-performance liquid chromatography coupled to a quadrupole-time-of-flight mass spectrometer (RP-UHPLC-QTOF-MS), achieving coverage of 592 lipid species [117].
- Lipid Extraction: Perform a modified version of the Bligh and Dyer method or use methyl-tert-butyl ether (MTBE). To minimize oxidation, add a mixture of inhibitors such as ethylene-diaminotetraacetic acid (EDTA, 2 mM final concentration) and butylated hydroxytoluene (BHT, 100 μM final concentration). Use only glass tubes or vials to avoid plasticizer contamination [107].
- Chromatographic Separation: Utilize a reverse-phase C18 column. Use buffer A (10 mM ammonium acetate or formate in 40% acetonitrile in water) and buffer B (10 mM ammonium acetate or formate in 10% acetonitrile in isopropanol). Employ a typical 27-minute gradient method for lipid class and species separation [107].
- Mass Spectrometry Analysis: Operate the QTOF mass spectrometer in data-dependent acquisition (DDA) mode for untargeted analysis. Use electrospray ionization (ESI) in both positive and negative polarities. Key MS parameters include a resolution of >120,000, mass accuracy of <5 ppm, and a scanning range of m/z 200-1400 [117].
- Data Processing and Lipid Identification: Process raw data using software tools (e.g., Lipid Search, XCMS) for peak alignment and feature detection. Annotate lipids by matching MS/MS experimental data with spectral libraries (e.g., LipidMaps). Perform manual, expert-driven evaluation of MS1 and MS/MS data to validate annotations, resolve isomeric interferences, and ensure data quality [117].
High-Throughput Microbore LC-MS/MS for Cerebral Organoid Lipidomics
This protocol describes a targeted lipidomics workflow optimized for high throughput and sensitivity, quantifying 351 lipid species from a single iPSC-derived cerebral organoid in 15 minutes [118].
- Sample Preparation (Single Cerebral Organoid): Homogenize a single CO in a microtube with a glass bead. Add 100 μL of 80% isopropanol (IPA) for lipid extraction. Vortex (1 min), sonicate (37 Hz, 5 min), and mix (10 min, 2000 rpm). Collect 85 μL of the supernatant and mix 1:1 with a mixture of class-specific internal standards. Use the protein pellet for BCA protein assay to normalize lipid concentrations [118].
- μLC-MS/MS Analysis: Inject 1 μL of lipid extract onto a reverse-phase microbore column (CSH, 1 × 100 mm, 1.7 μm) at a flow rate of 100 μL/min. Use mobile phase A (10 mM ammonium formate in acetonitrile/water, 60:40) and mobile phase B (10 mM ammonium formate in isopropanol/acetonitrile, 90:10). Employ a 15-minute gradient: 0 min 15% B, 1.86 min 30% B, 2.32 min 48% B, 9.5 min 82% B, 12.5-13.5 min 99% B, and 13.5-15 min re-equilibration [118].
- Mass Spectrometry (Targeted): Use a triple quadrupole mass spectrometer operating in dynamic selected reaction monitoring (dSRM) mode in positive ion polarity. Optimize collision energies using class-specific internal standards. Key ion source parameters: gas temp 200°C, gas flow 14 L/min, nebulizer 45 psi, sheath gas temp 400°C, sheath gas flow 8 L/min, capillary voltage 4 kV [118].
- Data Processing: Process raw data using quantitative analysis software (e.g., Agilent MassHunter). Quantify lipids using predefined SRM transitions and report relative concentrations normalized to protein content. Ensure robustness by injecting quality control samples and accepting lipid species with a coefficient of variation (%CV) < 30% [118].
Single-Cell Lipidomics Across Four LC-MS Platforms
This protocol benchmarks the feasibility of single-cell lipidomics using distinct, widely accessible LC-MS configurations [3] [119].
- Single-Cell Sampling: Use a capillary-based sampling system (e.g., Yokogawa SS2000 Single Cellome System) to isolate individual live cells from a culture dish into 10 μm capillaries under microscopic observation. Immediately freeze capillary tips on dry ice after sampling [3] [119].
- Cell Lysis and Lipid Extraction: Transfer cells from capillaries into LC-MS vials by backfilling with 5 μL of lysis solvent (isopropanol/water/acetonitrile, 51:62:87) spiked with a deuterated lipid internal standard mixture (e.g., EquiSPLASH) [3] [119].
- Cross-Platform LC-MS Analysis: Analyze samples across different instrumental configurations. Key platform examples include:
- Platform A (Analytical Flow, MS1-only): Use a Q Exactive Plus Orbitrap MS with a HESI source. Acquire full MS scans at a resolution of 140,000 over m/z 200-1400 [3] [119].
- Platform B (Microflow, DDA with EAD): Use a ZenoTOF system. Acquire MS1 at 44,000 resolution and MS2 using collision-induced dissociation (CID) or electron-activated dissociation (EAD) [3] [119].
- Platform C (Nanoflow, Polarity Switching): Use an Orbitrap Exploris 240 MS. Acquire data with MS1 resolution of 60,000 and data-dependent MS2, switching polarities every 10 scans to acquire both positive and negative mode spectra [3].
- Platform D (Nanoflow, Ion Mobility): Use a system incorporating ion mobility spectrometry (e.g., timsTOF) for added separation dimension [3].
Supercritical Fluid Chromatography (SFC)-MS for Rapid Lipid Profiling
This protocol employs ultra-high-performance SFC (UHPSFC) for fast, comprehensive lipid class separation in an 8-minute run, suitable for large cohort studies [120].
- Sample Preparation: Use a simple protein precipitation step with cold organic solvent (e.g., methanol) [120].
- SFC Separation: Utilize a UHPSFC system with COâ‚‚ as the primary mobile phase and an organic modifier (e.g., methanol with additives). Use a diol or bare silica column. Optimize key parameters: backpressure regulator (BPR), column temperature, and mobile phase flow rate [120].
- Mass Spectrometry: Couple the SFC system to either a triple quadrupole (QQQ) for targeted analysis or a high-resolution accurate mass (HRAM) instrument like a Q-TOF for untargeted profiling [120].
- Data Analysis: Use rapid data processing workflows compatible with high-throughput analysis of large sample sets [120].
Performance Benchmarking of Lipidomics Platforms
Lipid Coverage and Analytical Throughput
The choice of platform directly dictates the depth of lipidome analysis and the number of samples that can be processed per day. The following table benchmarks key performance metrics across established and emerging lipidomics platforms.
Table 1: Lipid Coverage and Throughput Across LC-MS Platforms
| Platform / Technique | Reported Lipid Coverage (Number of Species) | Analytical Throughput (Injection-to-Injection Time) | Primary Application Context | Key Study/Reference |
|---|---|---|---|---|
| RP-UHPLC-QTOF (DDA) | 592 lipids | ~30-60 minutes | In-depth plasma lipidome profiling for database creation | [117] |
| Microbore RPLC-TQ (Targeted) | 351 lipids | 15 minutes | High-throughput targeted profiling of cerebral organoids | [118] |
| SFC-QTOF/QQQ | >200 lipids (33 classes) | 8 minutes | High-throughput clinical cohort screening | [120] |
| Single-Cell nanoLC-MS | Varies by platform sensitivity | Varies | Resolving cellular heterogeneity in lipid metabolism | [3] [119] |
Analytical Sensitivity and Robustness
Sensitivity and robustness are critical for applications with limited sample material or requiring high quantitative precision.
Table 2: Sensitivity and Robustness Metrics
| Platform / Technique | Sample Requirement | Key Sensitivity and Robustness Findings | Evidence |
|---|---|---|---|
| Microbore RPLC-TQ (Targeted) | Single cerebral organoid (~31 μg protein) | ~4-fold increase in peak response vs. conventional narrow-bore (2.1 mm) columns; CV < 30% for 351 lipids over 75 h of continuous analysis (303 samples). | [118] |
| Single-Cell nanoLC-MS | Single human pancreatic cell | Technically feasible; performance is platform-dependent. Polarity switching, ion mobility, and EAD enhance coverage and confidence. | [3] [119] |
| Standard Flow RP-UHPLC-HRAM | ~100 μL plasma (SRM 1950) | Enables high-confidence annotation via manual curation and orthogonal data (retention time, adduct profiling). | [117] |
The Scientist's Toolkit: Essential Research Reagent Solutions
Successful lipidomics relies on a suite of specialized reagents and materials to ensure accuracy, reproducibility, and comprehensive coverage.
Table 3: Essential Reagents and Materials for Lipidomics
| Item | Function and Importance | Specific Examples |
|---|---|---|
| Deuterated Internal Standards | Correct for matrix effects & ionization efficiency; enable absolute or relative quantification. | EquiSPLASH; SPLASH LIPIDOMIX; class-specific standards (e.g., d7-PC, d5-TG). |
| Antioxidants & Enzyme Inhibitors | Preserve native lipid profile by preventing oxidation and enzymatic degradation during extraction. | Butylated Hydroxytoluene (BHT); Ethylenediaminetetraacetic acid (EDTA). |
| LC-MS Grade Solvents | Minimize background noise and ion suppression, ensuring high signal-to-noise ratios. | Optima LC/MS grade Methanol, Acetonitrile, Isopropanol, Water. |
| Reference Materials | Standardize methods across labs; validate platform performance and data quality. | NIST SRM 1950 (Metabolites in Frozen Human Plasma). |
| Chromatography Columns | Separate complex lipid mixtures; choice dictates resolution of classes and isomers. | C18 reversed-phase (for species separation); HILIC (for class separation); SFC columns (diol, silica). |
Workflow and Decision Pathway
The following diagram illustrates the key decision-making workflow for selecting an appropriate lipidomics platform based on core experimental requirements.
Discussion and Concluding Remarks
This benchmarking study demonstrates that modern lipidomics platforms offer a range of solutions tailored to specific research questions. The choice between untargeted and targeted approaches, and the selection of chromatography and mass spectrometry configurations, directly determines the balance between lipidome coverage, sensitivity, and throughput.
For comprehensive discovery profiling, standard or microflow RPLC-HRMS provides the necessary depth and annotation confidence [117] [118]. When high-throughput quantitative analysis of predefined lipid panels is required for large cohorts, targeted microbore LC-TQ or SFC-MS platforms offer robust and efficient solutions [118] [120]. For the most challenging samples, such as single cells, nanoflow LC-MS systems, especially those equipped with advanced fragmentation techniques like EAD, make lipidomic profiling feasible and informative [3] [119].
The ongoing development of highly curated lipid databases [117], standardized protocols, and robust microflow and SFC methods is poised to further enhance the reproducibility, depth, and clinical applicability of lipidomics in drug development and biomedical research.
Application Note
The translation of lipidomic research from a research tool to a clinically applicable methodology is contingent on overcoming significant challenges in standardization and reproducibility. This application note details a standardized protocol for ultra-high performance liquid chromatography tandem mass spectrometry (UHPLC-MS/MS) lipidomics, designed to generate robust, reproducible, and clinically actionable data. By establishing rigorous procedures for quality control, data acquisition, and analysis, this framework aims to bridge the critical gap between exploratory research and clinical adoption [29].
A major hurdle in clinical lipidomics is the variability introduced by sample handling and analytical drift. The use of a pooled quality control (PQC) sample, prepared from a mixture of all study samples, is recommended to monitor and correct for instrumental performance throughout a batch sequence [29]. Furthermore, commercial quality control (QC) plasma can serve as a reliable surrogate Long-Term Reference (LTR) for normalizing data across different batches or even studies, enhancing the comparability of results over time and between laboratories [29].
The move towards clinical application also demands precise lipid annotation and quantification. Adopting a semi-absolute quantification approach, supported by lipidome-specific mixtures of internal standards, significantly improves data accuracy and cross-study comparability [121]. This is particularly crucial for applications like pancreatic cancer biomarker discovery, where detailed lipid profiles from single cells can reveal pathological metabolic changes [21].
Experimental Protocols
Protocol 1: Standardized Plasma Lipid Profiling for Clinical QC
1. Objective: To establish a reproducible workflow for the preparation and analysis of human plasma samples for lipidomic profiling, integrating quality controls for data normalization.
2. Materials:
- Sample: Human plasma (study samples and commercial QC plasma).
- Internal Standards: EquiSPLASH LIPIDOMICS Mass Spec Internal Standard or similar comprehensive mixture [21].
- Solvents: HPLC-grade methanol, chloroform, isopropanol, and water.
- Equipment: UHPLC system coupled to a tandem mass spectrometer (e.g., QQQ, Q-TOF); centrifuge; vortex mixer.
3. Procedure:
- Sample Preparation:
- Thaw plasma samples on ice and vortex thoroughly.
- Aliquot a precise volume (e.g., 10 µL) of plasma into a clean tube.
- Add a known amount of internal standard mixture to each sample and QC prior to lipid extraction to correct for procedural losses and ionization variability [121].
- Perform lipid extraction using a standardized method such as a modified Bligh & Dyer or methyl-tert-butyl ether (MTBE) extraction.
- Evaporate the organic solvent under a gentle stream of nitrogen and reconstitute the dried lipid extract in a suitable starting mobile phase solvent (e.g., 70:30 buffer/organic modifier) [21].
- Pooled QC (PQC) Preparation:
- Combine equal aliquots from all study samples after the initial thawing step to create a PQC sample.
- Process the PQC alongside the study samples throughout the entire workflow [29].
- UHPLC-MS/MS Analysis:
- Chromatography: Utilize a reversed-phase C18 column (e.g., 1.7 µm, 2.1 x 100 mm). Employ a binary gradient with mobile phase A (aqueous buffer with additive) and B (organic solvent). A typical gradient runs from 70% A to 99% B over 15-20 minutes [121].
- Mass Spectrometry: Operate the mass spectrometer in data-dependent acquisition (DDA) or parallel reaction monitoring (PRM) mode for targeted quantification. Electrospray ionization (ESI) in both positive and negative modes is necessary for comprehensive lipid coverage [60].
- QC Injection Sequence: Inject the PQC sample at the beginning of the sequence to condition the system, and then repeatedly after every 4-8 study samples to monitor instrumental stability [29].
Protocol 2: Single-Cell Lipidomics via Capillary Sampling
1. Objective: To isolate and profile the lipidome of individual living cells with minimal background interference, enabling the study of cellular heterogeneity.
2. Materials:
- Cells: Adherent cell line (e.g., PANC-1 pancreatic cancer cells).
- Sampling Media: Dulbecco's Phosphate-Buffered Saline (PBS) or serum-free medium.
- Capillaries: 10 µm capillary tips (with or without filament).
- Equipment: Automated (e.g., Yokogawa SS2000 Single Cellome System) or manual capillary sampling system with an inverted microscope and microinjector; UHPLC-MS/MS system [21].
3. Procedure:
- Cell Preparation:
- Culture cells in appropriate dishes to ~80% confluency.
- Prior to sampling, wash cells three times with warm PBS to remove serum lipids [21].
- Maintain cells in a defined sampling medium (PBS or serum-free medium) during the procedure.
- Single-Cell Isolation:
- Automated Sampling: Use the automated system under controlled conditions (37°C, 5% CO₂). Set pressures (e.g., pre-sampling: 8 kPa, sampling: 14 kPa) to aspirate a single cell with a minimal, consistent volume of media [21].
- Manual Sampling: Under a microscope, use a nanomanipulator to position a capillary tip over a selected cell. Apply negative pressure to aspirate the cell [21].
- Critical Blank Correction:
- Prepare capillary blanks by aspirating only sampling medium (no cells) from control dishes using the same protocol.
- Prepare solvent blanks by backfilling empty capillaries with the starting mobile phase and internal standard mixture [21].
- Sample Transfer and Analysis:
- Backfill each capillary tip containing a single cell with 5 µL of internal standard solution.
- Transfer the contents into an LC-MS vial using positive gas pressure.
- Analyze using the UHPLC-MS/MS method described in Protocol 1, with adjustments for lower analyte amounts (e.g., increased sensitivity settings) [21].
Data Presentation
Table 1: Key Quantitative Metrics for Lipidomics QC and Clinical Translation
This table summarizes critical quantitative parameters that underpin method validation and data quality assurance in clinical lipidomics.
| Metric | Target Value / Outcome | Role in Standardization & Clinical Adoption |
|---|---|---|
| Pooled QC (PQC) Correlation | Coefficient of Variation (CV) < 15% for key lipids in PQC injections [29] | Monitors instrumental stability; corrects for analytical drift over sequence. |
| Surrogate QC (sQC) Accuracy | >80% correlation with PQC profile [29] | Enables data normalization across batches/labs using commercial plasma as LTR. |
| Lipid Annotation Level | MSI Level 1 (Identified) for reported biomarkers [121] | Ensures structural certainty, a prerequisite for clinical assay development. |
| Quantification Approach | Semi-absolute via internal standard calibration curves [121] | Moves beyond relative quantitation, enabling cross-study comparison. |
| Single-Cell Recovery | Consistent lipid profiles from cells of similar size; low blank signal [21] | Validates sampling protocol and minimizes background interference. |
Table 2: Research Reagent Solutions for Clinical Lipidomics
This table details essential reagents and materials required to implement standardized and reproducible lipidomics workflows.
| Item | Function & Rationale |
|---|---|
| Commercial QC Plasma | Serves as a Surrogate QC (sQC) or Long-Term Reference (LTR) for inter-batch and inter-laboratory data normalization, improving reproducibility [29]. |
| Comprehensive Internal Standard Mix | A mixture of stable isotope-labeled lipid standards across multiple classes. Corrects for extraction efficiency, ionization suppression, and enables semi-absolute quantification [121]. |
| Chromatography Column | Reverse-phase UHPLC column (e.g., C18, 1.7µm). Provides high-resolution separation of complex lipid extracts, reducing ion suppression and separating isomers [60]. |
| Structured Sampling Medium | Defined, serum-free medium (e.g., PBS). Used during single-cell sampling to eliminate variable background lipid signals from fetal bovine serum (FBS) [21]. |
| Standardized Capillary Tips | 10 µm diameter tips for single-cell isolation. Consistent tip geometry is critical for controlling aspiration volume and ensuring reproducible cell sampling [21]. |
Workflow Visualization
Standard Lipidomics Workflow
Single-Cell Sampling Process
Conclusion
This comprehensive UHPLC-MS/MS lipidomics protocol establishes a robust framework from fundamental exploration to rigorous clinical validation. The integration of optimized methodologies, advanced troubleshooting strategies, and systematic comparative analysis provides researchers with a powerful tool for discovering and validating lipid-based biomarkers. Future directions will be driven by technological advancements in single-cell lipidomics, the integration of artificial intelligence for data interpretation, and the development of standardized, multi-center validation frameworks. These efforts are pivotal for fully realizing the potential of lipidomics in precision medicine, enabling early disease diagnosis, patient stratification, and the development of targeted therapeutics for complex human diseases.
References
- 1. Common Lipidomics Databases and Software [https://www.metwarebio.com/common-lipidomics-databases-and-software/]
- 2. Single-cell lipidomics: protocol development for reliable ... [https://pubs.rsc.org/en/content/articlelanding/2025/an/d5an00037h]
- 3. Single-cell lipidomics: performance evaluation across four ... [https://pmc.ncbi.nlm.nih.gov/articles/PMC12462284/]
- 4. Rapid and reproducible LC-HRMS for combined lipidomics ... [https://www.sciencedirect.com/science/article/pii/S0026265X25032254]
- 5. Best practices and tools in R and Python for statistical ... [https://www.nature.com/articles/s41467-025-63751-1]
- 6. Multivariate Data Analysis Methods and Their Application in ... [https://pmc.ncbi.nlm.nih.gov/articles/PMC12280249/]
- 7. LipidMatch Suite [https://innovativeomics.com/software/lipidmatch-suite]
- 8. Lipidomics: Techniques, applications, and outcomes ... [https://pmc.ncbi.nlm.nih.gov/articles/PMC5085849/]
- 9. Application of a Rapid (UPLCâ„¢-MS/MS) Targeted ... [https://www.waters.com/nextgen/us/en/library/application-notes/2024/application-of-a-rapid-uplc-ms-ms-targeted-lipidomics-assay-lipidquan-to-a-rodent-toxicology-study.html?srsltid=AfmBOoplD7zwWTZr2npSLf_aZlbbV-uiVf_YnNHo-vrHrEtLW1TF4FwU]
- 10. Glycerophospholipid [https://en.wikipedia.org/wiki/Glycerophospholipid]
- 11. 6.4: Glycerophospholipids [https://chem.libretexts.org/Bookshelves/Introductory_Chemistry/Introduction_to_Organic_and_Biochemistry_(Malik)/06%3A_Lipids/6.04%3A_Glycerophospholipids]
- 12. Sphingolipid [https://en.wikipedia.org/wiki/Sphingolipid]
- 13. Metabolism and Regulation of Glycerolipids in the Yeast ... [https://pmc.ncbi.nlm.nih.gov/articles/PMC3276621/]
- 14. 1.5: Sphingolipids [https://phys.libretexts.org/Courses/University_of_California_Davis/Biophysics_241%3A_Membrane_Biology/01%3A_Lipids/1.05%3A_Sphingolipids]
- 15. The strategic role of lipidomics in biomarker identification and ... [https://pmc.ncbi.nlm.nih.gov/articles/PMC12483926/]
- 16. Ultrahigh-Performance Liquid Chromatography–Mass ... [https://www.spectroscopyonline.com/view/ultrahigh-performance-liquid-chromatography-mass-spectrometry-lipidomics]
- 17. Lipidomics by ultrahigh performance liquid ... [https://pmc.ncbi.nlm.nih.gov/articles/PMC6013032/]
- 18. UHPLC-MS/MS-based plasma untargeted lipidomic ... [https://www.frontiersin.org/journals/molecular-biosciences/articles/10.3389/fmolb.2025.1656458/full]
- 19. Benzoyl chloride derivatization improves selectivity and ... [https://link.springer.com/article/10.1007/s00216-025-06151-0]
- 20. Targeted ultra-high performance liquid chromatography ... [https://www.sciencedirect.com/science/article/pii/S2772391724000471]
- 21. Single-cell lipidomics: protocol development for reliable ... [https://pubs.rsc.org/en/content/articlehtml/2025/an/d5an00037h]
- 22. Grape Lipidomics: An Extensive Profiling thorough UHPLC ... [https://pmc.ncbi.nlm.nih.gov/articles/PMC8706896/]
- 23. Analytical Quality Control in Targeted Lipidomics [https://www.sciencedirect.com/science/article/abs/pii/S0003267025006191]
- 24. Exploring lipidomics in biomarker discovery [https://www.sciencedirect.com/science/article/abs/pii/S0009898125005777]
- 25. Lipidomics and cardiovascular disease [https://pubmed.ncbi.nlm.nih.gov/40122185]
- 26. The Neurolipid Atlas: a lipidomics resource for ... [https://www.nature.com/articles/s42255-025-01365-z]
- 27. Integrating New Technologies in Lipidology [https://www.mdpi.com/2077-0383/14/14/4984]
- 28. Recent advances in analytical strategies for mass ... [https://pmc.ncbi.nlm.nih.gov/articles/PMC7525665/]
- 29. Analytical quality control in targeted lipidomics [https://www.sciencedirect.com/science/article/pii/S0003267025006191]
- 30. Reversed-Phase Ultrahigh-Performance Liquid ... [https://pubmed.ncbi.nlm.nih.gov/39354309/]
- 31. Presentation of Quantitative Data [https://ihatepsm.com/blog/presentation-quantitative-data]
- 32. Charts vs. Tables: When to Use One Over the Other? [https://wpdatatables.com/charts-vs-tables/]
- 33. Pre-analytical sample handling standardization for reliable ... [https://pubmed.ncbi.nlm.nih.gov/36872954/]
- 34. Thawing as a critical pre-analytical step in the lipidomic ... [https://www.sciencedirect.com/science/article/pii/S0003267016301623]
- 35. Ex vivo instability of lipids in whole blood: preanalytical ... [https://pmc.ncbi.nlm.nih.gov/articles/PMC10208886/]
- 36. Thawing as a critical pre-analytical step in the lipidomic ... [https://pubmed.ncbi.nlm.nih.gov/26920767/]
- 37. Lipidomics Standard Initiative [https://lipidomicstandards.org/]
- 38. Optimization of Folch, Bligh-Dyer, and Matyash Sample-to ... [https://pmc.ncbi.nlm.nih.gov/articles/PMC6261534/]
- 39. Advances in Lipid Extraction Methods—A Review [https://www.mdpi.com/1422-0067/22/24/13643]
- 40. Optimization of Folch, Bligh-Dyer, and Matyash Sample-to- ... [https://www.nist.gov/publications/optimization-folch-bligh-dyer-and-matyash-sample-extraction-solvent-ratios-mammalian]
- 41. Lipid extraction by methyl-tert-butyl ether for high- ... [https://pmc.ncbi.nlm.nih.gov/articles/PMC2311442/]
- 42. Optimization of Folch, Bligh-Dyer, and Matyash sample-to- ... [https://www.sciencedirect.com/science/article/abs/pii/S0003267018309413]
- 43. Comparison of Single Phase and Biphasic Extraction ... [https://www.frontiersin.org/journals/neurology/articles/10.3389/fneur.2019.00879/full]
- 44. Lipid Extraction for Mass Spectrometry Lipidomics [https://www.protocols.io/view/lipid-extraction-for-mass-spectrometry-lipidomics-d5m6849e.html]
- 45. b [https://pmc.ncbi.nlm.nih.gov/articles/PMC4592635/]
- 46. Optimizing Ultra-High-Performance Liquid ... [https://www.intechopen.com/chapters/1188571]
- 47. Rapid high performance liquid chromatography method ... [https://www.sciencedirect.com/science/article/abs/pii/S0021967309014150]
- 48. Lipidomic analysis by ultra-high performance liquid ... [https://bio-protocol.org/exchange/minidetail?id=17775866&type=30]
- 49. Ultra-Performance Liquid Chromatography-Quadrupole ... [https://pmc.ncbi.nlm.nih.gov/articles/PMC11856038/]
- 50. Optimizing Mobile Phase Composition: A Practical Approach ... [https://www.mastelf.com/optimizing-mobile-phase-composition-a-practical-approach-to-enhancing-hplc-performance/]
- 51. HPLC Update Day 2: Modern Method Development [https://www.chromatographyonline.com/view/hplc-update-day-2-modern-method-development]
- 52. Gradient Optimization in Liquid Chromatography [https://www.welch-us.com/blogs/knowleage-base/gradient-optimization-of-liquid-chromatography]
- 53. Unveiling Lipidomics Quantitative Analysis: What, Why, ... [https://dmpkservice.wuxiapptec.com/articles/479-unveiling-lipidomics-quantitative-analysis-what-why-and-how/]
- 54. Enhancing Lipidomics With High-Resolution Ion Mobility ... [https://pmc.ncbi.nlm.nih.gov/articles/PMC12445972/]
- 55. Atomic Structure - Mass (A-Level Chemistry) - Study Mind Spectrometry [https://studymind.co.uk/notes/mass-spectrometry-2/]
- 56. - A Level Chemistry Revision Notes Mass Spectrometry [https://www.savemyexams.com/a-level/chemistry/aqa/17/revision-notes/3-organic-chemistry/3-6-organic-analysis/3-6-2-mass-spectrometry/]
- 57. The Hitchhiker's Guide to Untargeted Lipidomics Analysis [https://pmc.ncbi.nlm.nih.gov/articles/PMC8624948/]
- 58. How to Interpret Lipidomics Data: A Step-by-Step Guide [https://lipidomics.creative-proteomics.com/resource/how-to-interpret-lipidomics-data-a-step-by-step-guide.htm]
- 59. Applications of mass spectrometry-based targeted and non ... [https://www.sciencedirect.com/science/article/abs/pii/S0006291X18305679]
- 60. Recent Advances in Liquid Chromatography–Mass ... [https://pmc.ncbi.nlm.nih.gov/articles/PMC12204688/]
- 61. Untargeted vs. Targeted Lipidomics—Understanding the ... [https://lipidomics.creative-proteomics.com/resource/untargeted-vs-targeted-lipidomics-understanding-the-differences.htm]
- 62. Cross-Platform Comparison of Untargeted and Targeted ... [https://www.nature.com/articles/s41598-018-35807-4]
- 63. A Comprehensive and Reproducible Untargeted Lipidomic ... [https://pmc.ncbi.nlm.nih.gov/articles/PMC6572761/]
- 64. LC/MS-based untargeted lipidomics reveals lipid signatures of ... [https://lipidworld.biomedcentral.com/articles/10.1186/s12944-023-01887-z]
- 65. Combined untargeted and targeted lipidomics approaches ... [https://pubmed.ncbi.nlm.nih.gov/38083989/]
- 66. Recommendations for good practice in MS-based lipidomics [https://pmc.ncbi.nlm.nih.gov/articles/PMC8585648/]
- 67. Quantitative analysis of lipids: a higher-throughput LC–MS/MS ... [https://pmc.ncbi.nlm.nih.gov/articles/PMC5351511/]
- 68. Comprehensive analysis of lipids in biological systems by ... [https://pmc.ncbi.nlm.nih.gov/articles/PMC4187118/]
- 69. Quality control requirements for the correct annotation of ... [https://www.nature.com/articles/s41467-021-24984-y]
- 70. A versatile ultra-high performance LC-MS method for lipid ... [https://pmc.ncbi.nlm.nih.gov/articles/PMC3946075/]
- 71. Utilizing Skyline to analyze lipidomics data containing ... [https://pmc.ncbi.nlm.nih.gov/articles/PMC9633456/]
- 72. Application of hybrid surface technology for improving ... [https://www.sciencedirect.com/science/article/pii/S0021967322001194]
- 73. Ultra-high performance liquid chromatography-MS/MS ... [https://fjps.springeropen.com/articles/10.1186/s43094-019-0007-8]
- 74. Tackling pressure fluctuations in ultra-HPLC to robustly ... [https://www.sciencedirect.com/science/article/pii/S0021925825001310]
- 75. DeepRTAlign: toward accurate retention time alignment for ... [https://www.nature.com/articles/s41467-023-43909-5]
- 76. Optimizing HPLC Pressure: Real Solutions for Better ... [https://www.sepscience.com/optimizing-hplc-pressure-real-solutions-for-better-performance-10610]
- 77. Fixing GC Peak Tailing for Cleaner Results [https://www.sepscience.com/fixing-gc-peak-tailing-for-cleaner-peaks-11698]
- 78. Ultra Performance Liquid Chromatography-Tandem Mass ... [https://www.sciencedirect.com/topics/chemistry/ultra-performance-liquid-chromatography-tandem-mass-spectrometry]
- 79. Optimizing LC‑MS/MS Sensitivity: Strategies to Overcome ... [https://biotech-spain.com/en/articles/optimizing-lc-ms-ms-sensitivity-strategies-to-overcome-ion-suppression-and-boost-robustness-in-bioanalysis/]
- 80. Ion suppression correction and normalization for non-targeted ... [https://pmc.ncbi.nlm.nih.gov/articles/PMC11794426/]
- 81. Sample preparation optimization for metabolomics and ... [https://pubmed.ncbi.nlm.nih.gov/41075457/]
- 82. 4.8. UHPLC–MS Analysis for Lipidomics [https://bio-protocol.org/exchange/minidetail?id=8817920&type=30]
- 83. Metabolomics and lipidomics strategies in modern drug ... [https://pmc.ncbi.nlm.nih.gov/articles/PMC10543515/]
- 84. Lipidomics in biomedical research: chance and challenges [https://www.ddw-online.com/lipidomics-in-biomedical-research-chance-and-challenges-12719-202108/]
- 85. Mass Spectrometry Methodology in Lipid Analysis - PMC [https://pmc.ncbi.nlm.nih.gov/articles/PMC4100164/]
- 86. LipoCLEAN: A Machine Learning Filter to Improve Untargeted Lipid ... [https://pubmed.ncbi.nlm.nih.gov/39710937/]
- 87. Mapping Lipid Fragmentation for Tailored Mass Spectral ... [https://pmc.ncbi.nlm.nih.gov/articles/PMC6447430/]
- 88. Evaluation of lipid quantification accuracy using HILIC and RPLC MS... [https://link.springer.com/article/10.1007/s00216-020-02576-x]
- 89. A Review of Efforts to Improve Lipid Stability during Sample... | CoLab [https://colab.ws/articles/10.1002/lipd.12263]
- 90. Ultrahigh-Performance Liquid Chromatography–Mass ... [https://www.chromatographyonline.com/view/ultrahigh-performance-liquid-chromatography-mass-spectrometry-lipidomics-2]
- 91. Lipidomics from sample preparation to data analysis [https://pmc.ncbi.nlm.nih.gov/articles/PMC7118050/]
- 92. Recent advances in multi-technology based lipidomics ... [https://www.sciencedirect.com/science/article/abs/pii/S0924224424005351]
- 93. Integrating the potential of ion mobility spectrometry-mass ... [https://pmc.ncbi.nlm.nih.gov/articles/PMC10060977/]
- 94. Recent Advances in Lipid Separations and Structural ... [https://pmc.ncbi.nlm.nih.gov/articles/PMC5828972/]
- 95. MS-DIAL 5 multimodal mass spectrometry data mining ... [https://www.nature.com/articles/s41467-024-54137-w]
- 96. How To Deal With Missing Lipidomics Values [https://www.technologynetworks.com/proteomics/articles/how-to-deal-with-missing-lipidomics-values-386159]
- 97. Imputation of missing values in lipidomic datasets [https://pubmed.ncbi.nlm.nih.gov/38602226/]
- 98. Systematic Error Removal Using Random Forest for ... [https://pmc.ncbi.nlm.nih.gov/articles/PMC9652764/]
- 99. Correcting batch effects in large-scale multiomics studies ... [https://genomebiology.biomedcentral.com/articles/10.1186/s13059-023-03047-z]
- 100. Rapid Peak Alignment for MALDI-TOF Lipid Analysis - PMC [https://pmc.ncbi.nlm.nih.gov/articles/PMC9948349/]
- 101. Enhanced lipidomics workflows for plasma and ... [https://www.sciencedirect.com/science/article/abs/pii/S0039914025003376]
- 102. Simple and Robust UPLC-MS Method for Serum ... [https://www.mdpi.com/2076-3417/15/16/8789]
- 103. Mass Spectrometry in Analytical Lipidomics [https://www.chromatographyonline.com/view/mass-spectrometry-analytical-lipidomics]
- 104. The foundations and development of lipidomics - PMC [https://pmc.ncbi.nlm.nih.gov/articles/PMC8953652/]
- 105. Biomarker Discovery and Validation: Statistical Considerations [https://pmc.ncbi.nlm.nih.gov/articles/PMC8012218/]
- 106. Verification, analytical validation, and clinical validation (V3) [https://www.nature.com/articles/s41746-020-0260-4]
- 107. Protocol for Untargeted Lipid ID via UHPLC-Tandem MS [https://www.creative-proteomics.com/resource/protocol-for-lipid-identification-by-untargeted-tandem-mass-spectrometry-coupled-with-ultra-high-pre.htm]
- 108. Biomarker Validation: Common Data Analysis Concerns [https://pmc.ncbi.nlm.nih.gov/articles/PMC4122484/]
- 109. Semi-quantitative lipidomics reveals the characteristics of ... [https://www.sciencedirect.com/science/article/abs/pii/S0963996925008555]
- 110. Lipidomics profile shows differences of polar lipids between ... [https://pmc.ncbi.nlm.nih.gov/articles/PMC12311604/]
- 111. Fast and broad-coverage lipidomics enabled by ion mobility ... [https://pubs.rsc.org/en/content/articlehtml/2024/an/d4an00751d]
- 112. Investigating Performance of the SLIM-Based High ... [https://pubmed.ncbi.nlm.nih.gov/37703523/]
- 113. Lipidomics Profiling and Risk of Coronary Artery Disease ... [https://pmc.ncbi.nlm.nih.gov/articles/PMC10296370/]
- 114. Phospholipid biomarkers of coronary heart disease - PMC [https://pmc.ncbi.nlm.nih.gov/articles/PMC11088770/]
- 115. Trans-omics analyses identify the biochemical network of ... [https://biomarkerres.biomedcentral.com/articles/10.1186/s40364-025-00821-y]
- 116. Evaluating Novel Direct Injection Liquid Chromatography ... [https://pmc.ncbi.nlm.nih.gov/articles/PMC12604029/]
- 117. Highly reliable LC-MS lipidomics database for efficient ... [https://pmc.ncbi.nlm.nih.gov/articles/PMC11607663/]
- 118. High-Throughput Microbore LC-MS Lipidomics to ... [https://pmc.ncbi.nlm.nih.gov/articles/PMC10782415/]
- 119. Single-cell lipidomics: performance evaluation across four ... [https://pubs.rsc.org/en/content/articlehtml/2025/an/d5an00851d]
- 120. Fast and comprehensive lipidomic analysis using ... [https://www.sciencedirect.com/science/article/abs/pii/S0021967325000913]
- 121. Recommendations for Accurate Lipid Annotation and Semi ... [https://pubmed.ncbi.nlm.nih.gov/39354313/]