Lipidomics Biomarker Discovery in Diabetes and Hyperuricemia: From Pathophysiological Insights to Clinical Translation
This article provides a comprehensive exploration of lipidomics in the context of the co-occurrence of diabetes mellitus (DM) and hyperuricemia (HUA), a prevalent and clinically significant metabolic constellation.
Lipidomics Biomarker Discovery in Diabetes and Hyperuricemia: From Pathophysiological Insights to Clinical Translation
Abstract
This article provides a comprehensive exploration of lipidomics in the context of the co-occurrence of diabetes mellitus (DM) and hyperuricemia (HUA), a prevalent and clinically significant metabolic constellation. We synthesize foundational research identifying distinct lipidomic signatures, including upregulated triglycerides (TGs), phosphatidylethanolamines (PEs), and diacylglycerols (DAGs), and the central disruption of glycerophospholipid and glycerolipid metabolism pathways. The content details advanced methodological approaches, such as UHPLC-MS/MS, for biomarker discovery and validation, while also addressing key challenges in reproducibility and clinical integration. Furthermore, we examine comparative studies that stratify lipidomic profiles across disease stages and patient subgroups, and discuss the translational potential of these findings for developing diagnostic tools, informing therapeutic strategies like dietary interventions, and advancing personalized medicine for complex metabolic disorders.
Unraveling the Lipidomic Landscape: Core Signatures and Pathways in Diabetes-Hyperuricemia Comorbidity
In the evolving landscape of metabolic disease research, lipidomics has emerged as a powerful tool for uncovering the complex alterations in lipid metabolism that underpin conditions like diabetes mellitus and hyperuricemia. The comprehensive analysis of lipid classes—including triglycerides (TGs), phosphatidylethanolamines (PEs), phosphatidylcholines (PCs), and diacylglycerols (DAGs)—provides critical insights into disease mechanisms and potential biomarker discovery [1]. These lipid classes are not merely energy storage molecules but play active roles in cellular signaling, membrane integrity, and metabolic regulation, making them prime targets for investigation in the context of diabetes and its common comorbidities [1] [2].
The integration of lipidomic data with clinical parameters offers a multidimensional perspective on disease pathophysiology. For instance, the triglyceride-glucose (TyG) index, calculated from fasting triglycerides and glucose levels, has gained recognition as a reliable surrogate marker of insulin resistance and predictor of diabetic complications [3] [4] [5]. This intersection of traditional clinical measures with advanced lipidomic profiling creates a powerful framework for understanding the complex interplay between lipid metabolism and metabolic diseases, potentially leading to improved diagnostic, prognostic, and therapeutic strategies.
Key Altered Lipid Classes in Diabetes and Hyperuricemia
Quantitative Alterations in Lipid Classes
Table 1: Key Lipid Class Alterations in Diabetes and Hyperuricemia
| Lipid Class | Specific Molecular Species | Alteration Trend | Biological Context | Potential Functional Impact |
|---|---|---|---|---|
| Triglycerides (TGs) | TG(16:0/18:1/18:2) and 12 other TGs [6] | Significantly upregulated [6] | Diabetes with hyperuricemia (DH) vs. healthy controls | Hepatic steatosis, insulin resistance, ectopic fat deposition [7] [2] |
| Phosphatidylethanolamines (PEs) | PE(18:0/20:4) and 9 other PEs [6] | Significantly upregulated [6] | DH vs. healthy controls | Membrane fluidity alterations, signaling pathway disruption |
| Phosphatidylcholines (PCs) | PC(36:1) and 6 other PCs [6] | Significantly upregulated [6] | DH vs. healthy controls | Impaired cell signaling, membrane integrity compromise |
| Diacylglycerols (DAGs) | 1,3-DAG species [2] | Accumulated in skeletal muscle | Prediabetic insulin resistance | PKC activation, impaired insulin signaling [2] |
| Ceramides (CERs) | CER(18:0, 22:0, 24:0, 24:1) [2] | Significantly increased | Skeletal muscle in prediabetes | Attenuated insulin signaling, insulin resistance [2] |
| Phosphatidylinositol (PI) | Not specified [6] | Downregulated | DH vs. healthy controls | Disrupted cellular signaling processes |
Table 2: Lipid Ratios and Derived Indices in Metabolic Research
| Parameter | Calculation Method | Clinical/Research Utility | Association with Disease States |
|---|---|---|---|
| TyG Index | Ln[fasting TGs (mg/dL) × fasting glucose (mg/dL)/2] [3] [4] | Surrogate marker of insulin resistance [3] [4] | Predictor of diabetic retinopathy (OR: 1.57-1.89) [3], cerebrovascular diseases [4] |
| HOMA-IR | (Fasting insulin × fasting glucose)/405 [5] | Assessment of insulin resistance | Limited value in insulin-treated patients [5] |
| DAG Species Ratio | 1,3-DAG/1,2-DAG [2] | Marker of lipotoxicity | Associated with skeletal muscle insulin resistance [2] |
Pathophysiological Significance of Altered Lipid Classes
The dysregulation of specific lipid classes represents not merely a secondary consequence but an active contributor to metabolic disease progression. Triglycerides serve as the most abundant energy reservoir, yet their ectopic accumulation in non-adipose tissues induces lipotoxicity, a fundamental mechanism driving insulin resistance and beta-cell dysfunction in diabetes [7] [2]. The recently recognized TyG index, incorporating both triglyceride and glucose measurements, has demonstrated significant predictive value for microvascular complications such as diabetic retinopathy, with pooled odds ratios of 1.89 (categorical) and 1.57 (continuous) according to a recent meta-analysis [3].
Phosphatidylethanolamines and phosphatidylcholines are fundamental structural components of cellular membranes, and their alteration directly impacts membrane fluidity, signaling transduction, and cellular integrity. The simultaneous upregulation of both PE and PC subclasses in diabetes with hyperuricemia suggests profound membrane remodeling occurs in this comorbid condition [6]. Diacylglycerols function as crucial signaling molecules that activate protein kinase C (PKC) isoforms, leading to the phosphorylation and inhibition of insulin receptor substrate-1 (IRS-1), thereby disrupting the insulin signaling cascade at a critical node [2]. This mechanism establishes DAGs as central mediators of insulin resistance in peripheral tissues, particularly skeletal muscle.
Experimental Methodologies in Lipidomics Research
Sample Preparation and Lipid Extraction
Table 3: Key Research Reagent Solutions and Their Functions
| Reagent/Equipment | Function in Lipidomics | Application Context |
|---|---|---|
| Ultra Performance Liquid Chromatography (UHPLC) | Separation of complex lipid mixtures prior to mass analysis [6] | Untargeted lipidomics of plasma samples [6] |
| Tandem Mass Spectrometry (MS/MS) | Structural identification and quantification of lipid species [6] [1] | Differential lipid molecule identification [6] |
| Methyl tert-butyl ether (MTBE) | Lipid extraction from biological samples [6] | Plasma lipid extraction in diabetes with hyperuricemia study [6] |
| Quadrupole Time-of-Flight (Q-TOF) Mass Spectrometer | High-resolution mass accuracy for lipid identification [8] | Lipidomic profiling in diabetic kidney disease [8] |
| C18 Chromatography Column | Reverse-phase separation of lipid molecules [6] | UHPLC separation of lipid classes [6] |
| Precooled Methanol | Protein precipitation and lipid stabilization [6] | Sample pre-processing in plasma lipidomics [6] |
The foundation of reliable lipidomics research lies in robust sample preparation protocols. For plasma lipid analysis, the recommended approach involves collecting fasting blood samples in appropriate anticoagulant tubes, followed by immediate centrifugation at 3,000 rpm for 10 minutes at room temperature to separate plasma [6]. The resulting plasma supernatant should be aliquoted and stored at -80°C until analysis to prevent lipid degradation. For lipid extraction, the methyl tert-butyl ether (MTBE) method has demonstrated excellent performance: briefly, 100 μL of plasma is mixed with 200 μL of 4°C water, followed by addition of 240 μL of pre-cooled methanol and 800 μL of MTBE [6]. After low-temperature sonication for 20 minutes and room temperature incubation for 30 minutes, centrifugation at 14,000 g for 15 minutes at 10°C yields distinct phases, with the upper organic phase containing the extracted lipids ready for nitrogen drying and subsequent analysis [6].
Lipidomic Analysis Techniques
Untargeted lipidomics employing ultra-performance liquid chromatography-tandem mass spectrometry (UHPLC-MS/MS) represents the gold standard for comprehensive lipid profiling. The analytical conditions typically utilize a Waters ACQUITY UPLC BEH C18 column (2.1 mm × 100 mm, 1.7 μm particle size) with a mobile phase consisting of acetonitrile-water (10 mM ammonium formate) and acetonitrile-isopropanol (10 mM ammonium formate) in a gradient elution [6]. Mass spectrometry parameters should be optimized for broad lipid coverage, with both positive and negative ionization modes to capture the diverse lipid classes. Data processing utilizes specialized software platforms (e.g., MS DIAL, Lipostar) for peak alignment, identification, and quantification, though recent studies indicate concerning variability, with agreement rates as low as 14-36% across different platforms [1].
For specific investigation of diacylglycerol and ceramide species in tissues, additional methodologies are required. Skeletal muscle samples should be powdered under liquid nitrogen and extracted in dichloromethane-methanol, followed by thin-layer chromatography separation using hexane-diethylether-acetic acid (70:30:1) as the solvent system [2]. The isolated DAG bands can then be scraped, extracted, and quantified enzymatically, providing specific information about different DAG isomers that may have distinct signaling roles in insulin resistance [2].
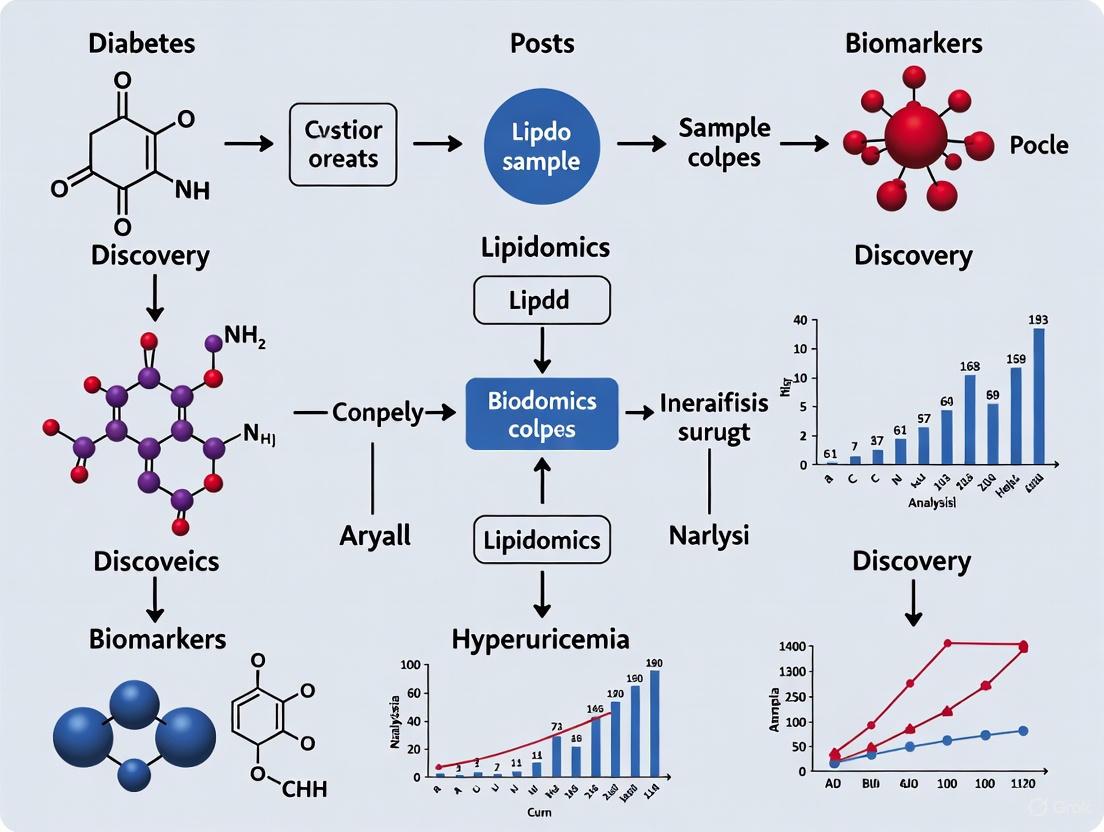
Diagram 1: Comprehensive Lipidomics Workflow and Key Lipid Classes. This diagram illustrates the standardized experimental workflow for lipidomics research, from sample collection to biomarker validation, and highlights the four key lipid classes frequently altered in diabetes and hyperuricemia.
Metabolic Pathways and Signaling Mechanisms
Disrupted Metabolic Pathways
Lipidomic analyses of diabetes with hyperuricemia have identified two primary metabolic pathways consistently disrupted: glycerophospholipid metabolism (impact value: 0.199) and glycerolipid metabolism (impact value: 0.014) [6]. These pathways represent the core metabolic disturbances underlying the observed lipid class alterations, with glycerophospholipid metabolism being particularly significantly perturbed. The integration of these pathway analyses with quantitative lipid data provides a systems-level understanding of how diabetes and hyperuricemia jointly disrupt lipid homeostasis, creating a metabolically detrimental environment that promotes disease progression and complication development.
The accumulation of specific lipid species activates multiple intracellular signaling cascades that impair insulin action. Diacylglycerols activate protein kinase C (PKC) isoforms, particularly PKCε and PKCθ, which phosphorylate insulin receptor substrate-1 (IRS-1) on inhibitory serine residues, reducing its ability to activate downstream PI3K/Akt signaling [2]. Concurrently, ceramides activate protein phosphatase 2A (PP2A) and protein kinase C ζ (PKCζ), which further attenuate Akt activation and promote insulin resistance through multiple mechanisms [2]. These parallel pathways create a self-reinforcing cycle of metabolic dysfunction that characterizes advanced diabetes and its complications.
Diagram 2: Lipid-Mediated Insulin Resistance Signaling Pathways. This diagram illustrates how accumulated lipid species (DAGs, ceramides) activate signaling kinases that disrupt normal insulin signal transduction, leading to insulin resistance. The TyG index, derived from triglycerides and glucose, serves as a clinical indicator of this metabolic dysfunction.
Implications for Biomarker Discovery and Therapeutic Development
The consistent alteration patterns in specific lipid classes offer promising avenues for biomarker development in diabetes and hyperuricemia. The TyG index has already demonstrated clinical utility as a simple, cost-effective biomarker for insulin resistance and diabetic complications [3] [4] [5]. However, more sophisticated lipidomic signatures incorporating specific TG, PE, PC, and DAG species may provide enhanced diagnostic and prognostic precision. For instance, the identification of 31 significantly altered lipid molecules in diabetes with hyperuricemia, including 13 specific triglycerides, 10 phosphatidylethanolamines, and 7 phosphatidylcholines, provides a foundation for developing specialized biomarker panels for this common comorbidity [6].
From a therapeutic perspective, targeting lipid metabolism pathways represents a promising strategy. Interventions that reduce ectopic lipid accumulation, such as very low-calorie diets or bariatric surgery, have demonstrated efficacy in reversing insulin resistance and normalizing metabolic parameters, at least partially through reduction of intracellular DAG content and ectopic fat deposition [7]. Pharmacological approaches targeting specific enzymes in glycerophospholipid or glycerolipid metabolism pathways may offer more precise interventions for restoring lipid homeostasis in diabetes and hyperuricemia.
The comprehensive analysis of triglyceride, phosphatidylethanolamine, phosphatidylcholine, and diacylglycerol classes provides invaluable insights into the pathological mechanisms underlying diabetes and hyperuricemia. The standardized methodologies presented here for lipidomic analysis, from sample preparation through mass spectrometric analysis and data processing, provide a rigorous framework for advancing research in this field. The integration of these lipidomic approaches with clinical indices like the TyG index creates a powerful multidimensional perspective on metabolic disease pathophysiology, offering promising avenues for improved diagnosis, risk stratification, and therapeutic development in diabetes and its related metabolic disorders.
The integration of lipidomics into metabolic disease research has revolutionized our understanding of pathological mechanisms underlying conditions like diabetes and hyperuricemia. Lipidomics, a specialized branch of metabolomics, enables the comprehensive analysis of lipid molecules within biological systems, providing crucial insights into their structural, functional, and dynamic roles in health and disease [1]. The molecular structures of the majority of lipids determine their functions, with the Lipid Metabolites and Pathways Strategy (LIPID MAPS) classification system organizing lipids into eight key categories: fatty acyls, glycerolipids, glycerophospholipids, sphingolipids, sterol lipids, prenol lipids, saccharolipids, and polyketides [1]. Understanding how lipids are affected in various disorders provides essential information about disease mechanisms, potential biomarkers for diagnosis, and possible therapeutic targets [1].
Within the context of diabetes and hyperuricemia research, lipidomic approaches have revealed significant disruptions in specific metabolic pathways, particularly glycerophospholipid and glycerolipid metabolism. These perturbations are not merely consequences of disease states but may represent fundamental mechanistic links between these interconnected metabolic disorders. The transition of lipid research from bench to bedside relies heavily on the discovery of biomarkers that are clinically reliable, repeatable, and validated across various populations [1]. This technical guide explores the current state of knowledge regarding perturbed glycerophospholipid and glycerolipid metabolism pathways within the broader thesis of lipidomics biomarker discovery for diabetes and hyperuricemia research, providing researchers with methodological frameworks, analytical approaches, and contextual interpretation for advancing this critical field.
Analytical Methodologies in Lipidomics
Untargeted versus Targeted Approaches
Lipidomics methodologies have advanced significantly with the development of targeted, untargeted, and pseudotargeted techniques that improve structural lipid profiling, resolution, and quantification. Untargeted lipidomics represents a powerful discovery-oriented approach that aims to detect and quantify all lipid species present in a biological sample, regardless of whether the lipid species of interest are known or unknown. This method provides a comprehensive picture of a sample's lipid profile, although it may be limited by lower sensitivity for low-abundance lipids and challenges in structural identification [1]. In contrast, targeted lipidomics focuses on precise identification and absolute quantification of a predefined set of lipids, offering higher sensitivity, accuracy, and reproducibility for specific lipid classes of interest [9]. The pseudotargeted approach represents a middle ground, beginning with untargeted analysis to identify differential lipids, then developing targeted methods for more accurate quantification of these specific candidates [1].
The complementary nature of these approaches is particularly valuable in diabetes and hyperuricemia research. Untargeted methods can reveal novel lipid signatures associated with disease states, while targeted validation ensures robust, reproducible quantification of promising biomarkers. For instance, in a study investigating hyperuricemia patients with hyperlipidaemia, researchers initially employed untargeted analysis to identify differential metabolites, followed by targeted validation to confirm these findings [10]. This sequential approach leverages the strengths of both methodologies while mitigating their respective limitations.
Technical Platforms and Instrumentation
Ultra-high-performance liquid chromatography coupled with tandem mass spectrometry (UHPLC-MS/MS) has emerged as the cornerstone technology for comprehensive lipidomic analysis in diabetes and hyperuricemia research. The technical specifications for lipidomic analysis typically involve:
Chromatographic Separation: Reversed-phase chromatography using C18 columns (e.g., Waters ACQUITY UPLC BEH C18, 2.1 × 100 mm, 1.7 μm) provides excellent separation of complex lipid mixtures. Mobile phases commonly consist of acetonitrile/water mixtures with ammonium formate or formic acid modifiers (mobile phase A) and isopropanol/acetonitrile mixtures with similar modifiers (mobile phase B) [11] [6]. The gradient elution typically progresses from higher aqueous content to predominantly organic solvent over 10-30 minutes, effectively separating lipid classes based on their hydrophobicity.
Mass Spectrometric Detection: High-resolution mass spectrometers, particularly Q-TOF (Quadrupole-Time of Flight) and Orbitrap instruments, provide accurate mass measurements crucial for lipid identification [6]. Multiple reaction monitoring (MRM) on triple quadrupole instruments offers superior sensitivity for targeted quantification [9]. Electrospray ionization (ESI) in both positive and negative ion modes enables comprehensive detection of various lipid classes, with specific lipid species exhibiting preferential ionization in particular modes [11].
Table 1: Core Instrumentation for Lipidomic Analysis in Metabolic Disease Research
| Component | Specifications | Application in Diabetes/Hyperuricemia Research |
|---|---|---|
| Liquid Chromatography | UHPLC system with C18 column (2.1×100mm, 1.7μm); column temperature 45°C; flow rate 0.2-0.3 mL/min | Separation of complex lipid mixtures from biological samples |
| Mass Spectrometry | Q-TOF, Orbitrap, or QqQ mass analyzers; ESI source; resolution >20,000 for TOF/Orbitrap | Identification and quantification of lipid species |
| Ionization Source | Electrospray ionization; positive/negative mode switching; source temperature 300-450°C; sheath gas flow 45 arb | Efficient ionization of diverse lipid classes |
| Data Acquisition | Data-dependent acquisition (DDA) for untargeted; MRM for targeted; mass range 200-1800 m/z | Comprehensive lipid profiling and targeted validation |
Sample Preparation Protocols
Standardized sample preparation is critical for reliable lipidomic results. The methyl tert-butyl ether (MTBE) extraction method has gained prominence for its efficiency in extracting a broad range of lipid classes [11] [6]. The protocol typically involves:
- Protein Precipitation: Addition of cold methanol to serum/plasma samples (typically 100μL sample + 300μL methanol) to precipitate proteins and initiate lipid extraction.
- Liquid-Liquid Extraction: Introduction of MTBE (800μL) followed by vortex mixing and sonication in a low-temperature water bath to facilitate complete lipid extraction.
- Phase Separation: Centrifugation (14,000g, 15min, 10°C) to separate organic and aqueous phases, with the upper organic phase containing the extracted lipids.
- Concentration and Reconstitution: Collection of the organic phase, drying under nitrogen gas, and reconstitution in isopropanol/acetonitrile mixtures compatible with reversed-phase LC-MS analysis [6].
This extraction method demonstrates excellent recovery for diverse lipid classes including glycerophospholipids, glycerolipids, and sphingolipids, all relevant to diabetes and hyperuricemia research. Quality control measures should include pooled quality control (QC) samples from all study samples, inserted regularly throughout the analytical sequence to monitor instrument stability and data quality [9].
Lipidomic Alterations in Hyperuricemia and Diabetes
Glycerophospholipid Metabolism Disruptions
Glycerophospholipids, essential components of cellular membranes and signaling molecules, demonstrate consistent alterations in both hyperuricemia and diabetes. Multiple studies have identified significant perturbations in glycerophospholipid metabolism pathways in these metabolic disorders. In a comprehensive investigation of hyperuricemia patients, 33 differential lipid metabolites were significantly upregulated, with these metabolites prominently involved in arachidonic acid metabolism, glycerophospholipid metabolism, linoleic acid metabolism, glycosylphosphatidylinositol (GPI)-anchor biosynthesis, and alpha-linolenic acid metabolism pathways [11]. The interconnection between these lipid alterations and immune factors was further established, with IL-10, CPT1, IL-6, SEP1, TGF-β1, Glu, TNF-α, and LD showing associations with glycerophospholipid metabolism [11].
In diabetes mellitus combined with hyperuricemia (DH), more pronounced disturbances emerge. A targeted lipidomic analysis of 2247 middle-aged and elderly Chinese participants revealed 123 lipids significantly associated with uric acid levels, predominantly glycerolipids and glycerophospholipids [9]. Specific molecular species including diacylglycerols (DAG (16:0/22:5), DAG (16:0/22:6), DAG (18:1/20:5), DAG (18:1/22:6)), phosphatidylcholines (PC (16:0/20:5)), and triacylglycerols (TAG (53:0)) emerged as the most significant lipid signatures positively associated with hyperuricemia risk, while lysophosphatidylcholine (LPC (20:2)) was inversely associated with hyperuricemia risk [9]. Network analysis further strengthened these findings, showing a positive association between TAGs/PCs/DAGs contained module and hyperuricemia risk [9].
Table 2: Key Lipid Classes and Species Altered in Diabetes and Hyperuricemia
| Lipid Class | Specific Species | Change in Disease | Biological Implications |
|---|---|---|---|
| Phosphatidylcholines (PCs) | PC (16:0/20:5), PC (36:1) | Upregulated in DH [6] [9] | Membrane integrity, signaling precursors |
| Phosphatidylethanolamines (PEs) | PE (18:0/20:4) | Upregulated in DH [6] | Membrane curvature, cellular signaling |
| Diacylglycerols (DAGs) | DAG (16:0/22:5), DAG (16:0/22:6), DAG (18:1/20:5) | Upregulated in HUA/DH [9] | Insulin resistance, protein kinase C activation |
| Triacylglycerols (TAGs) | TAG (53:0) | Upregulated in HUA [9] | Energy storage, lipid droplet formation |
| Lysophosphatidylcholines (LPCs) | LPC (20:2) | Downregulated in HUA [9] | Anti-inflammatory signaling, metabolic regulation |
Glycerolipid Metabolism Perturbations
Glycerolipids, particularly triacylglycerols and diacylglycerols, show marked alterations in combined diabetes and hyperuricemia. In a UHPLC-MS/MS-based plasma untargeted lipidomic analysis comparing patients with diabetes mellitus combined with hyperuricemia (DH) against those with diabetes alone (DM) and healthy controls (NGT), researchers identified 1,361 lipid molecules across 30 subclasses [6]. Multivariate analyses revealed significant separation trends among the DH, DM, and NGT groups, confirming distinct lipidomic profiles. Specifically, 31 significantly altered lipid metabolites were pinpointed in the DH group compared to NGT controls [6]. Among the most relevant individual metabolites, 13 triglycerides (TGs), 10 phosphatidylethanolamines (PEs), and 7 phosphatidylcholines (PCs) were significantly upregulated, while one phosphatidylinositol (PI) was downregulated [6].
Pathway analysis of these differential metabolites revealed their enrichment in six major metabolic pathways, with glycerophospholipid metabolism (impact value: 0.199) and glycerolipid metabolism (impact value: 0.014) identified as the most significantly perturbed pathways in DH patients [6]. The comparison between DH and DM groups further identified 12 differential lipids that were also predominantly enriched in these same core pathways, underscoring their central role in the pathophysiology of hyperuricemia complicating diabetes [6]. These findings highlight the synergistic disruption of glycerophospholipid and glycerolipid metabolism in the comorbidity of diabetes and hyperuricemia, suggesting potential amplified metabolic dysfunction beyond either condition alone.
Pathway Interconnections and Network Analysis
The perturbations in glycerophospholipid and glycerolipid metabolism do not occur in isolation but rather within complex metabolic networks. Advanced network analysis has revealed significant associations between HUA-related lipids and de novo lipogenesis fatty acids, particularly 16:1n-7 (Spearman correlation coefficients = 0.32–0.41, p < 0.001) [9]. These correlations suggest coordinated regulation between lipid metabolic pathways in hyperuricemia, potentially mediated through transcription factors such as sterol regulatory element-binding protein-1c (SREBP-1c), which has been shown to be activated by uric acid in hepatocyte models [12].
Mediation analyses further suggest that lipid-HUA associations are partially mediated by retinol-binding protein 4 (RBP4), with mediation proportions ranging from 5–14% [9]. RBP4, an adipokine linked with dyslipidemia and insulin resistance, may represent an important mechanistic connection between disturbed lipid metabolism and hyperuricemia. Dietary factors also modify these associations, with increased aquatic product intake correlated with elevated HUA risk and HUA-associated lipids, while high dairy consumption correlated with lower levels of HUA-associated lipids [9]. These findings highlight the multifactorial nature of lipid disruptions in hyperuricemia and diabetes, involving interactions between metabolic, endocrine, and dietary factors.
Experimental Workflows and Protocols
Comprehensive Lipidomic Workflow
Diagram 1: Lipidomics workflow for biomarker discovery.
Detailed Methodological Protocols
Sample Collection and Preparation Protocol:
- Collect fasting venous blood samples in EDTA-containing tubes
- Centrifuge at 3,000 rpm for 15 minutes at 4°C to separate plasma/serum
- Aliquot and store at -80°C until analysis
- For lipid extraction, thaw samples on ice and vortex mix
- Precipitate proteins with cold methanol (sample:methanol ratio 1:3)
- Perform liquid-liquid extraction with MTBE (sample:MTBE ratio 1:8)
- Sonicate in low-temperature water bath for 20 minutes
- Centrifuge at 14,000g for 15 minutes at 10°C
- Collect upper organic phase and dry under nitrogen stream
- Reconstitute in 100μL isopropanol/acetonitrile (1:1, v/v) for LC-MS analysis [11] [6]
LC-MS Analysis Conditions:
- Chromatography: UHPLC system with ACQUITY UPLC CSH C18 column (2.1 × 100 mm, 1.7 μm)
- Mobile Phase: A: 10mM ammonium formate in acetonitrile/water (6:4, v/v); B: 10mM ammonium formate in acetonitrile/isopropanol (2:9, v/v)
- Gradient Program: 30% B (0-2 min), 30-100% B (2-25 min), 100% B (25-30 min), 30% B (30-35 min)
- Flow Rate: 0.3 mL/min; Column Temperature: 45°C; Injection Volume: 3-5μL
- Mass Spectrometry: Q-Exactive Plus mass spectrometer with ESI source
- Ionization Parameters: Sheath gas flow: 45 arb, Aux gas flow: 15 arb, Spray voltage: 3.0 kV (positive), 2.5 kV (negative), Capillary temperature: 350°C
- Scan Range: 200-1800 m/z; Resolution: 70,000 (MS1), 17,500 (MS2) [11] [6]
Data Processing and Statistical Analysis:
- Convert raw data to appropriate format (e.g., mzML)
- Perform peak detection, alignment, and retention time correction
- Normalize data using quality control-based robust LOESS signal correction
- Conduct multivariate statistical analysis including PCA and OPLS-DA
- Identify significant features with VIP >1.0 and p<0.05 (Student's t-test)
- Annotate lipids using LIPID MAPS and HMDB databases
- Perform pathway analysis using MetaboAnalyst 5.0 [6] [10]
Pathway Mapping and Metabolic Interconnections
Glycerophospholipid and Glycerolipid Pathway Disruptions
Diagram 2: Glycerophospholipid and glycerolipid metabolic pathways.
The diagram above illustrates the complex metabolic network of glycerophospholipid and glycerolipid metabolism, highlighting key enzymatic steps and intermediates. In both diabetes and hyperuricemia, multiple nodes within this network demonstrate significant alterations. The conversion of phosphatidic acid (PA) to diacylglycerol (DAG), catalyzed by phosphatidic acid phosphohydrolase (PAP), represents a critical branch point that is dysregulated in these metabolic disorders [6] [9]. The subsequent conversion of DAG to triacylglycerol (TAG) by diacylglycerol acyltransferase (DGAT) is also significantly impacted, as evidenced by the elevated TAG species observed in hyperuricemia and diabetes [9].
The glycerophospholipid biosynthesis branch from CDP-diacylglycerol to various phospholipid classes, including phosphatidylglycerol, cardiolipin, and phosphatidylinositol, also shows substantial perturbations. Specifically, phosphatidylcholines (PC) and phosphatidylethanolamines (PE) are consistently elevated in diabetes with hyperuricemia [6]. The remodeling of phosphatidylcholine to lysophosphatidylcholine (LPC) by phospholipase A2 (PLA2) is similarly affected, with specific LPC species demonstrating inverse associations with hyperuricemia risk [9]. These coordinated alterations suggest systemic dysregulation of lipid metabolic pathways rather than isolated enzyme defects, potentially reflecting broader disruptions in cellular energy metabolism, membrane biosynthesis, and signaling processes in diabetes and hyperuricemia.
Cross-Talk with Other Metabolic Pathways
The perturbations in glycerophospholipid and glycerolipid metabolism do not occur in isolation but exhibit significant cross-talk with other metabolic pathways. In hyperuricemia patients, lipidomic analyses have revealed concurrent disruptions in arachidonic acid metabolism, linoleic acid metabolism, and glycosylphosphatidylinositol (GPI)-anchor biosynthesis [11]. This metabolic network extends to amino acid metabolism pathways, including alanine, aspartate, and glutamate metabolism, as well as phenylalanine, tyrosine, and tryptophan biosynthesis [10]. The interconnection between lipid metabolism and immune signaling is further highlighted by associations between specific lipid species and inflammatory cytokines, including IL-6, IL-10, TNF-α, and TGF-β1 [11].
The mediation of lipid-hyperuricemia associations by retinol-binding protein 4 (RBP4) further demonstrates the endocrine dimension of these metabolic disruptions [9]. RBP4, primarily secreted from adipose tissue and liver, has been implicated in insulin resistance and represents a potential mechanistic link between dyslipidemia and hyperuricemia. The influence of dietary factors, including aquatic products and dairy consumption, on both lipid profiles and hyperuricemia risk underscores the multifactorial nature of these metabolic interrelationships [9]. This complex network of metabolic, endocrine, and dietary factors highlights the need for integrated, systems-level approaches to understanding lipid disruptions in diabetes and hyperuricemia.
The Scientist's Toolkit: Essential Research Reagents and Materials
Table 3: Essential Research Reagents and Materials for Lipidomics in Metabolic Disease Research
| Category | Specific Items | Purpose/Function | Examples/Specifications |
|---|---|---|---|
| Sample Collection | EDTA blood collection tubes | Plasma preparation with minimized degradation | K2EDTA Vacutainers (BD) |
| Cryogenic vials | Long-term sample storage at -80°C | Nunc CryoStorage Tubes | |
| Lipid Extraction | Methyl tert-butyl ether (MTBE) | Liquid-liquid lipid extraction | HPLC grade, ≥99% purity |
| Methanol, acetonitrile, isopropanol | Solvent system for lipid extraction | LC-MS grade, 99.9% purity | |
| Ammonium formate | Mobile phase additive for LC-MS | MS-grade, 99.99% purity | |
| LC-MS Analysis | UPLC C18 columns | Chromatographic separation of lipids | Waters ACQUITY UPLC BEH C18 (2.1×100mm, 1.7μm) |
| Mass spec standards | Quality control and quantification | SPLASH LIPIDOMIX Mass Spec Standard | |
| Internal standards | Quantification normalization | Ceramide (d18:1-d7/15:0), Oleic acid-d9 | |
| Data Analysis | Reference standards | Lipid identification and confirmation | Avanti Polar Lipids standards |
| Software packages | Data processing and statistical analysis | MS-DIAL, Lipostar, SIMCA-P, MetaboAnalyst | |
| 6-Methoxypyridine-3-carbaldehyde | 6-Methoxypyridine-3-carbaldehyde, CAS:65873-72-5, MF:C7H7NO2, MW:137.14 g/mol | Chemical Reagent | Bench Chemicals |
| Erythronic acid potassium | Erythronic acid potassium, CAS:88759-55-1, MF:C4H7KO5, MW:174.19 g/mol | Chemical Reagent | Bench Chemicals |
The mapping of perturbed glycerophospholipid and glycerolipid metabolism pathways in diabetes and hyperuricemia represents a significant advancement in our understanding of the metabolic interconnections between these conditions. Lipidomics has revealed consistent alterations in specific lipid classes and species, providing insights into potential mechanistic links and biomarker candidates. The technical methodologies outlined in this guide, including standardized sample preparation, advanced LC-MS platforms, and comprehensive data analysis workflows, provide researchers with robust tools for further investigation in this field.
Future directions in this research area will likely focus on several key aspects. First, the integration of lipidomics with other omics technologies, including genomics, proteomics, and metagenomics, will provide more comprehensive insights into the systemic metabolic disruptions in diabetes and hyperuricemia [13]. Second, the implementation of artificial intelligence and machine learning approaches for lipidomic data analysis shows promise for enhanced biomarker discovery and pathway analysis [1]. Finally, larger-scale validation studies across diverse populations will be essential for translating lipidomic findings into clinically applicable biomarkers and therapeutic targets. As these advancements unfold, the continued refinement of analytical methodologies and bioinformatic tools will further accelerate progress in understanding and addressing the complex metabolic disruptions in diabetes and hyperuricemia.
Linking Lipid Dysregulation to Pathophysiological Mechanisms
Lipid dysregulation represents a critical pathophysiological mechanism underlying a spectrum of metabolic, cardiovascular, neurological, and inflammatory disorders. This technical review examines the intricate interplay between disrupted lipid metabolism and disease pathogenesis, with particular emphasis on diabetes-hyperuricemia comorbidity as a model system. We synthesize evidence from lipidomic studies to elucidate how specific alterations in lipid species—including triglycerides, glycerophospholipids, and sphingolipids—drive disease processes through inflammatory signaling, oxidative stress, and immune-metabolic cross-talk. The integration of advanced lipidomic methodologies with biochemical and clinical data provides a powerful framework for identifying novel biomarkers and therapeutic targets, ultimately advancing personalized medicine approaches for complex metabolic diseases.
Lipids constitute a diverse class of hydrophobic molecules essential for cellular structure, energy storage, and signaling processes. Lipid dysregulation, characterized by imbalances in lipid synthesis, metabolism, or trafficking, has emerged as a cornerstone pathology in numerous disease states [14]. Beyond its established role in cardiovascular disease, lipid dysregulation demonstrates significant involvement in neurological disorders, metabolic conditions, and immune-inflammatory pathologies through mechanisms that remain incompletely understood [14] [15] [16].
The pathophysiological impact of lipid dysregulation extends far beyond circulating cholesterol levels to encompass complex alterations in lipid species composition, membrane dynamics, and bioactive lipid signaling. Technological advances in lipidomics have revealed that specific lipid metabolites and profiles serve as sensitive indicators of disease states, often preceding clinical symptom onset [1]. This review examines how dysregulated lipid metabolism initiates and perpetuates disease processes across multiple organ systems, with special attention to the diabetes-hyperuricemia nexus as a paradigm for understanding broader lipid-mediated pathophysiological mechanisms.
Core Pathophysiological Mechanisms
Inflammatory Signaling and Immune Activation
Lipid dysregulation directly fuels inflammatory processes through multiple interconnected mechanisms. Elevated levels of specific lipid species, particularly ceramides and modified low-density lipoprotein (LDL) particles, activate the NLRP3 inflammasome, triggering caspase-1-mediated production of pro-inflammatory cytokines IL-1β and IL-18 [15]. This inflammatory cascade establishes a self-perpetuating cycle wherein cytokines further disrupt lipid homeostasis, amplifying tissue damage [15] [16].
In the context of metabolic disease, dyslipidemia characterized by elevated triglycerides and reduced high-density lipoprotein (HDL) promotes monocyte migration and endothelial activation through lysophosphatidylcholine-mediated G protein-coupled receptor signaling [15]. Clinical studies demonstrate that patients with major depressive disorder exhibiting lipid dysregulation show elevated pro-inflammatory cytokines including IL-6 and TNF-α, establishing a direct connection between lipid abnormalities and systemic inflammation [15]. Similar mechanisms operate in Alzheimer's disease, where lipid-driven microglial activation perpetuates neuroinflammation and accelerates neurodegeneration [16].
Metabolic Inflexibility and Insulin Resistance
Lipid dysregulation directly impairs insulin sensitivity through several well-characterized mechanisms. Excess circulating free fatty acids and intracellular accumulation of diacylglycerols and ceramides activate inflammatory kinases such as JNK and IKKβ, which phosphorylate insulin receptor substrate proteins on serine residues, blunting insulin signal transduction [17]. This metabolic inflexibility creates a pathological feedback loop wherein insulin resistance further exacerbates lipid abnormalities [17] [18].
In diabetes-hyperuricemia comorbidity, dysregulated lipid metabolism intersects with purine metabolism, creating a mutually reinforcing cycle of metabolic dysfunction. The uric acid-to-HDL cholesterol ratio (UHR) has emerged as a composite biomarker capturing this dysmetabolic state, with elevated UHR values significantly associated with abdominal aortic calcification and cardiovascular complications in diabetic patients [18]. Lipidomic analyses reveal that this metabolic synergy involves specific alterations in glycerophospholipid and glycerolipid metabolism pathways [19].
Neuroinflammatory Pathways
The central nervous system exhibits particular vulnerability to lipid dysregulation, given its high lipid content and metabolic demands. Disruptions in brain cholesterol homeostasis and sphingolipid metabolism impair synaptic function, reduce membrane fluidity, and trigger neuroinflammatory responses [15] [16]. In major depressive disorder, patients demonstrate altered phospholipid metabolism with increased lysophosphatidylcholine and decreased alkyl phosphatidylethanolamine, creating a pro-oxidant, pro-inflammatory cerebral environment [15].
Lipid-mediated blood-brain barrier dysfunction represents another critical neuroinflammatory mechanism. Peripheral lipid abnormalities compromise barrier integrity through inflammatory cytokine release and oxidative stress, permitting infiltration of immune cells and inflammatory mediators into the CNS [15]. Once within the brain parenchyma, these factors activate microglia and astrocytes, establishing chronic neuroinflammation that disrupts mood regulation, cognitive function, and neuronal survival [15] [16].
Table 1: Lipid Species and Their Pathophysiological Roles in Specific Diseases
| Lipid Category | Specific Lipid Species | Alteration in Disease | Associated Pathophysiological Mechanisms | Relevant Diseases |
|---|---|---|---|---|
| Sphingolipids | Ceramides (e.g., Cer, SM) | Increased | NLRP3 inflammasome activation, mitochondrial dysfunction, insulin resistance | MDD, CVD, T2DM [1] [15] |
| Glycerophospholipids | Phosphatidylcholines (PC), Phosphatidylethanolamines (PE) | Increased in DH | Membrane disruption, inflammatory signaling | Diabetes-Hyperuricemia, MDD [15] [19] |
| Glycerolipids | Triglycerides (TG) | Increased | Pro-inflammatory cytokine release, ectopic fat accumulation | CVD, T2DM, HUA [14] [19] |
| Sterol Lipids | Cholesterol, HDL, LDL | LDL increased/HDL decreased | Atherosclerotic plaque formation, impaired reverse cholesterol transport | CVD, AD, T2DM [14] [16] |
| Fatty Acyls | Free Fatty Acids (FFA) | Increased | Insulin resistance, endothelial dysfunction | T2DM, Metabolic Syndrome [17] |
Abbreviations: MDD (Major Depressive Disorder), CVD (Cardiovascular Disease), T2DM (Type 2 Diabetes Mellitus), DH (Diabetes-Hyperuricemia), HUA (Hyperuricemia), AD (Alzheimer's Disease)
Lipidomic Methodologies for Investigating Pathophysiological Mechanisms
Analytical Platforms and Workflows
Comprehensive lipid analysis employs integrated chromatographic and mass spectrometric platforms to characterize lipid dysregulation at molecular levels. Ultra-high performance liquid chromatography tandem mass spectrometry (UHPLC-MS/MS) has emerged as the gold standard for lipidomic profiling, enabling simultaneous quantification of hundreds of lipid species across multiple classes [1] [19]. The typical workflow encompasses sample preparation, chromatographic separation, mass spectrometric detection, data processing, and statistical analysis [1] [19].
Two complementary approaches dominate the field: untargeted lipidomics provides a comprehensive assessment of global lipid profiles without prior hypothesis, while targeted lipidomics enables precise quantification of predefined lipid panels with enhanced sensitivity and accuracy [1] [20]. The integration of these approaches facilitates both discovery and validation phases in biomarker development, as demonstrated in hyperuricemia research where untargeted analysis identified 50 differential metabolites, with 12 subsequently verified through targeted quantification [20].
Diagram 1: Integrated lipidomics workflow for pathophysiological investigation
Key Analytical Considerations
Robust lipidomic analysis requires careful optimization of multiple parameters throughout the analytical pipeline. Sample preparation must efficiently extract diverse lipid classes while minimizing degradation, with methyl tert-butyl ether (MTBE)/methanol systems providing comprehensive coverage [19]. Chromatographic separation typically employs reversed-phase (C18) columns with acetonitrile/water/isopropanol gradients to resolve lipid species by hydrophobicity [19].
Mass spectrometric detection leverages both high-resolution accurate mass instruments (Q-TOF, Orbitrap) for untargeted discovery and triple quadrupole platforms for targeted quantification using multiple reaction monitoring (MRM) [1] [20]. Data processing incorporates specialized bioinformatic tools (MS DIAL, Lipostar) for peak detection, alignment, and identification, though inconsistent results across platforms remain a challenge, with agreement rates as low as 14-36% [1]. Rigorous validation through standards, quality controls, and orthogonal methods is essential for reliable biological interpretation.
Diabetes-Hyperuricemia Comorbidity: A Paradigm of Integrated Lipid Pathophysiology
Clinical and Metabolic Interrelationships
The frequent co-occurrence of diabetes and hyperuricemia represents an instructive model for understanding how lipid dysregulation propagates across metabolic pathways. Clinical evidence demonstrates that approximately 81.6% of patients with uncontrolled type 2 diabetes exhibit combined dyslipidemia and hyperuricemia, creating a high-risk metabolic phenotype [17]. This convergence is mechanistically grounded in shared pathophysiological processes including insulin resistance, oxidative stress, and chronic inflammation [17] [18].
The uric acid-to-HDL cholesterol ratio (UHR) quantitatively captures this metabolic intersection, with elevated UHR values significantly associated with abdominal aortic calcification in diabetic patients (OR: 1.43 per 1-unit increase in log2-UHR) [18]. Mediation analysis indicates that diabetes accounts for 7.5-14% of the association between UHR and vascular calcification, highlighting the partial independence of lipid-uric acid interactions from glycemic status [18]. These findings position UHR as a simple but informative composite biomarker reflecting integrated metabolic risk.
Lipidomic Signatures and Pathway Alterations
Comprehensive lipid profiling of patients with diabetes-hyperuricemia comorbidity reveals distinct molecular signatures that illuminate underlying pathophysiological mechanisms. UHPLC-MS/MS analysis identifies 1,361 lipid molecules across 30 subclasses, with 31 significantly altered species in diabetes-hyperuricemia compared to healthy controls [19]. The most prominent changes include upregulation of 13 triglyceride species, 10 phosphatidylethanolamines, and 7 phosphatidylcholines, along with downregulation of select phosphatidylinositols [19].
Pathway analysis of these alterations identifies glycerophospholipid metabolism (impact value: 0.199) and glycerolipid metabolism (impact value: 0.014) as the most significantly perturbed pathways in diabetes-hyperuricemia patients [19]. These pathway disturbances reflect fundamental disruptions in membrane biology, signaling transduction, and energy storage that jointly contribute to disease progression. The lipidomic profile further differentiates diabetes-hyperuricemia from diabetes alone, with 12 discriminatory lipids highlighting the specific metabolic impact of uric acid dysregulation on lipid homeostasis [19].
Table 2: Experimentally Validated Lipid Alterations in Diabetes-Hyperuricemia Comorbidity
| Analytical Method | Sample Size | Key Lipid Alterations | Pathway Enrichment | Statistical Significance | Reference |
|---|---|---|---|---|---|
| UHPLC-MS/MS (Untargeted) | 17 DH, 17 DM, 17 HC | ↑ 13 TGs, ↑ 10 PEs, ↑ 7 PCs, ↓ 1 PI | Glycerophospholipid metabolism (impact: 0.199), Glycerolipid metabolism (impact: 0.014) | OPLS-DA: R2Y=0.909, Q2=0.840 (ESI+) | [19] |
| UPLC-TQ-MS (Targeted) | 20 HUA, 20 HC | 12 validated biomarkers including palmitic acid, lactic acid, valine | Glycerophospholipid metabolism, Glycosylphosphatidylinositol anchor biosynthesis | AUC > 0.9 for validated biomarkers | [20] |
| Clinical Biobank Analysis | 304 T2DM patients | Elevated UHR (UA/HDL-C ratio) strongly associated with dyslipidemia-hyperuricemia co-occurrence | Integrated purine and lipid metabolism | OR: 1.43 for AAC per 1-unit log2-UHR increase | [17] [18] |
Abbreviations: DH (Diabetes-Hyperuricemia), DM (Diabetes Mellitus), HC (Healthy Controls), HUA (Hyperuricemia), TGs (Triglycerides), PEs (Phosphatidylethanolamines), PCs (Phosphatidylcholines), PI (Phosphatidylinositol), UHR (Uric acid-to-HDL cholesterol Ratio), AAC (Abdominal Aortic Calcification)
The Scientist's Toolkit: Essential Research Reagents and Platforms
Table 3: Key Research Reagent Solutions for Lipid Dysregulation Studies
| Reagent/Platform Category | Specific Examples | Function in Lipid Dysregulation Research | Technical Notes |
|---|---|---|---|
| Chromatography Systems | UHPLC with C18 columns (e.g., Waters ACQUITY) | Separation of complex lipid mixtures prior to detection | Mobile phases: acetonitrile/water/isopropanol with ammonium formate [19] |
| Mass Spectrometry Platforms | Q-TOF (SCIEX, Thermo), Triple Quadrupole (TQ-MS) | Untargeted discovery (Q-TOF) and targeted quantification (TQ-MS) | MRM mode essential for precise quantification of low-abundance species [20] |
| Lipid Extraction Reagents | Methyl tert-butyl ether (MTBE), Methanol | Efficient extraction of diverse lipid classes with minimal degradation | MTBE/methanol/water (10:3:2.5) provides comprehensive coverage [19] |
| Internal Standards | Stable isotope-labeled lipid analogs | Quantification normalization and quality control | Deuterated or 13C-labeled PC, PE, TG, Cer recommended [20] |
| Data Processing Software | MS DIAL, Lipostar, MetaboAnalyst | Peak detection, alignment, identification, and pathway analysis | Platform discrepancies necessitate cross-validation [1] |
| Cell Culture Models | Primary hepatocytes, adipocytes, neuronal cells | In vitro mechanistic studies of lipid metabolism | Enable genetic and pharmacological manipulation of lipid pathways [15] |
| 7-Methoxycoumarin-3-carboxylic Acid | 7-Methoxycoumarin-3-carboxylic Acid, CAS:20300-59-8, MF:C11H8O5, MW:220.18 g/mol | Chemical Reagent | Bench Chemicals |
| NBD dodecanoic acid N-succinimidyl ester | NBD dodecanoic acid N-succinimidyl ester, MF:C22H29N5O7, MW:475.5 g/mol | Chemical Reagent | Bench Chemicals |
Lipid dysregulation represents a unifying pathophysiological mechanism that transcends traditional disease boundaries, connecting metabolic, cardiovascular, neurological, and inflammatory disorders through shared molecular pathways. The diabetes-hyperuricemia model exemplifies how integrated lipidomic approaches can decode complex pathophysiological interactions, revealing specific lipid species and metabolic pathways that drive disease progression.
Future research directions should prioritize the translation of lipidomic discoveries into clinical applications, including validated biomarker panels for early risk stratification and personalized intervention. Advancements in artificial intelligence and machine learning (e.g., MS2Lipid with 97.4% subclass prediction accuracy) promise to enhance lipid annotation and biomarker discovery [1]. Simultaneously, standardization of pre-analytical protocols, analytical platforms, and data processing pipelines remains essential to overcome current reproducibility challenges [1].
The developing recognition of lipid-mediated immunometabolic cross-talk opens new therapeutic opportunities for modulating immune function through lipid-targeted interventions [16]. As our understanding of lipid dysregulation continues to evolve, multi-omics integration and systems biology approaches will be crucial for deciphering the complex networks linking lipid metabolism to pathophysiological processes across diverse disease contexts.
Cross-species validation serves as a critical bridge between basic research and clinical application in metabolic disease studies. In the interconnected fields of hyperuricemia and type 2 diabetes mellitus (T2DM), this approach enables researchers to decipher complex pathophysiology and evaluate therapeutic interventions through a coordinated pipeline of animal models and human validation studies. The convergence of lipidomics, gut microbiome analysis, and machine learning with traditional biochemical approaches has generated unprecedented opportunities for biomarker discovery and mechanistic elucidation. This whitepaper examines current methodologies, data integration frameworks, and experimental protocols that facilitate robust cross-species validation in hyperuricemia-diabetes research, providing drug development professionals with validated approaches for translational science.
The pathophysiological interconnection between hyperuricemia and diabetes is well-established, with epidemiological studies indicating that hyperuricemia increases the risk of T2DM by 1.6 to 2.5 times [21]. This relationship is bidirectional: insulin resistance contributes to elevated uric acid levels, while hyperuricemia exacerbates insulin resistance through mechanisms including chronic inflammation, oxidative stress, and endothelial dysfunction [21]. Within this complex metabolic cross-talk, lipidomic disturbances emerge as a central feature, with glycerophospholipid and glycerolipid metabolism pathways significantly perturbed in patients with combined diabetes and hyperuricemia [19].
Animal Models in Hyperuricemia-Diabetes Research
Model Selection Criteria
Animal models provide controlled systems for investigating hyperuricemia-diabetes pathophysiology and screening therapeutic candidates. An ideal model should recapitulate key aspects of human disease while permitting experimental manipulation impossible in human subjects. Selection criteria include genetic relevance to human pathophysiology, metabolic similarity, reproducibility, and practical considerations regarding cost and handling [22].
Table 1: Hyperuricemia Animal Models and Their Applications
| Model Type | Induction Method | Key Characteristics | Research Applications |
|---|---|---|---|
| Chemically Induced Rodent | Uricase inhibitors (potassium oxonate) + purine-rich diet [22] | Rapid induction, reversible, mimics renal excretion impairment | Drug screening, acute metabolic studies [22] |
| Genetic Rodent Model | Urate oxidase gene knockout [23] | Spontaneous hyperuricemia, resembles human metabolism | Long-term pathophysiology, complication studies [23] |
| Poultry Models | High-purine diet (chickens, quails) [22] | Natural absence of uricase, human-like purine metabolism | Uric acid production and excretion studies [22] |
Rodents, particularly rats and mice, remain the most widely used animals due to their clear genetic background, strong reproductive capacity, and physiological similarity to humans [22]. A significant limitation in rodent models is the presence of uricase, which further breaks down uric acid into allantoin, differing from human metabolic characteristics. Researchers commonly address this through uricase inhibition or genetic modification [22]. Sex-based considerations are crucial in model selection, as female rodents exhibit protective effects against hyperuricemia likely due to estrogen influence, which lowers hepatic xanthine oxidase activity and modulates urate transporters [22]. Consequently, adult male rodents are typically preferred for modeling to ensure stability and reproducibility, though female or ovariectomized models are valuable for studying postmenopausal or age-related hyperuricemia [22].
Established Model Systems
Gene-edited models, particularly urate oxidase knockout mice, have emerged as valuable tools for studying spontaneous hyperuricemia and its natural progression. These models demonstrate sustained elevated serum uric acid levels without chemical induction, effectively mimicking the human metabolic state [23]. Recent research utilizing such models has revealed that persistent hyperuricemia promotes metabolic disturbances, including increased blood glucose, insulin resistance, and pancreatic β-cell damage following streptozotocin challenge [23].
Poultry animals, including chickens and quails, offer a distinct advantage due to their natural absence of uricase genes, resulting in purine metabolism that closely resembles humans [22]. These models rely on similar uric acid transporters (BCRP, MRP4, and GLUT9) for excretion, providing a physiologically relevant system for studying uric acid handling without requiring genetic or chemical manipulation [22].
Analytical Frameworks for Cross-Species Validation
Lipidomics Approaches
Lipidomics has revolutionized metabolic disease research by enabling comprehensive characterization of lipid profiles and their alterations in disease states. This approach is particularly valuable for identifying subtle metabolic disturbances that precede clinical manifestation of hyperuricemia-diabetes comorbidity.
Table 2: Lipidomics Methodologies in Hyperuricemia-Diabetes Research
| Methodology | Technical Approach | Applications | Key Findings |
|---|---|---|---|
| Untargeted Lipidomics | UHPLC-MS/MS comprehensive profiling [19] | Discovery phase biomarker identification | Revealed 31 significantly altered lipid metabolites in DH patients [19] |
| Targeted Lipidomics | Focused MS analysis of specific lipid classes [1] | Validation and quantification | Ceramides and phosphatidylcholines association with cardiovascular risk [1] |
| Pseudotargeted Approach | Combined untargeted and targeted strategies [1] | Enhanced coverage and quantification | Improved reproducibility in clinical validation [1] |
Ultra-high performance liquid chromatography-tandem mass spectrometry (UHPLC-MS/MS) has identified distinct lipidomic signatures in patients with combined diabetes and hyperuricemia (DH) compared to those with diabetes alone or healthy controls [19]. Specifically, 1,361 lipid molecules across 30 subclasses have been characterized, with 31 significantly altered lipid metabolites pinpointed in DH patients [19]. These include 13 triglycerides (e.g., TG 16:0/18:1/18:2), 10 phosphatidylethanolamines (e.g., PE 18:0/20:4), and 7 phosphatidylcholines (e.g., PC 36:1) that were significantly upregulated, while one phosphatidylinositol was downregulated [19]. Pathway analysis has revealed enrichment in glycerophospholipid metabolism and glycerolipid metabolism as the most significantly perturbed pathways in DH patients [19].
Gut Microbiome Analysis
The gut microbiome represents a crucial interface between host metabolism and environmental influences, with emerging evidence establishing its significant role in hyperuricemia and diabetes pathophysiology. Microbial community analysis through 16S rRNA sequencing has demonstrated consistent alterations in gut microbiota composition in hyperuricemia and gout patients compared to healthy controls [24] [25].
Studies have observed a dramatic decreasing trend in microbial richness and diversity in hyperuricemic patients, characterized by reduced abundance of butyrate-producing genera including Faecalibacterium, Coprococcus, and Enterococcus [24]. Concurrently, opportunistic pathogens such as Proteobacteria and Fusobacterium are enriched in the hyperuricemia group [24]. These microbial disturbances appear to progress with disease severity, with gout patients exhibiting significantly reduced microbial diversity compared to asymptomatic hyperuricemic individuals, marked by decreased richness of Dialister, Ruminococcus, and Faecalibacterium genera [24] [25].
Machine learning algorithms applied to microbiome data have demonstrated remarkable diagnostic potential. Random Forest models achieved prediction accuracy of 82-96% for distinguishing healthy controls, hyperuricemia, and gout patients based on microbial features [25]. Metabolic function predictions from these analyses indicate that purine metabolism pathway alterations contribute most significantly to distinguishing gout from other groups [25].
Integration of Machine Learning in Metabolic Research
Advanced computational methods have become indispensable for handling the multidimensional datasets generated in cross-species validation studies. Machine learning algorithms, particularly tree-based models like Random Forest and eXtreme Gradient Boosting, have demonstrated superior performance in analyzing complex microbiome and lipidomic data [25]. These approaches consider changes in bacterial populations or lipid species within the context of other community members, rather than assessing relative abundance in isolation [25].
Interpretable machine learning frameworks, such as Shapley Additive exPlanations (SHAP), facilitate identification of core features contributing to predictive models, enabling researchers to move beyond correlation to mechanistic insight [25]. For environmental risk prediction, models like Extreme Gradient Boosting have been successfully applied to identify key chemical exposures associated with hyperuricemia development, providing insights into modifiable risk factors [26].
Experimental Protocols for Cross-Species Investigation
Lipidomics Workflow
A standardized lipidomics protocol ensures reproducible and biologically meaningful results across species:
Sample Preparation:
- Collect biological samples (plasma/serum/tissues) following standardized procedures
- For plasma: Draw fasting blood samples, centrifuge at 3,000 rpm for 10 minutes at room temperature, aliquot supernatant, and store at -80°C [19]
- For extraction: Thaw samples on ice, vortex, aliquot 100μL into 1.5mL centrifuge tube
- Add 200μL of 4°C water, mix, then add 240μL pre-cooled methanol
- Add 800μL methyl tert-butyl ether (MTBE), sonicate in low-temperature water bath for 20 minutes
- Incubate at room temperature for 30 minutes, centrifuge at 14,000g for 15 minutes at 10°C
- Collect upper organic phase, dry under nitrogen stream [19]
UHPLC-MS/MS Analysis:
- Use Waters ACQUITY UPLC BEH C18 column (2.1mm × 100mm, 1.7μm)
- Mobile phase A: 10mM ammonium formate acetonitrile solution in water
- Mobile phase B: 10mM ammonium formate acetonitrile isopropanol solution [19]
- Employ gradient elution with increasing organic phase
- Utilize both positive and negative ionization modes for comprehensive lipid coverage
- Include quality control samples (pooled samples) throughout sequence [19]
Data Processing and Analysis:
- Perform peak detection, alignment, and identification using specialized software (MS-DIAL, Lipostar)
- Apply multivariate statistical analysis (PCA, OPLS-DA) to identify group separations
- Conduct univariate analysis (Student's t-test, fold change) to determine significant alterations
- Execute pathway analysis using platforms such as MetaboAnalyst 5.0 [19]
Gut Microbiome Analysis Protocol
Sample Collection and DNA Extraction:
- Collect fresh stool samples, freeze immediately at -80°C
- Extract bacterial genomic DNA using commercial kits (e.g., Magen Hipure Soil DNA Kit)
- Quantify DNA using Qubit dsDNA HS Assay Kit [24]
16S rRNA Gene Amplification and Sequencing:
- Amplify V4 region using primer pair 515F (5'-GTGCCAGCMGCCGCGGTAA-3') and 806R (5'-GGACTACHVGGGTWTCTAAT-3')
- Incorporate adapter sequences and indexing barcodes for multiplexing
- Verify PCR products via agarose gel electrophoresis
- Purify and pool amplicons at equimolar ratios
- Sequence using Illumina MiSeq platform or similar [24] [25]
Bioinformatic Analysis:
- Perform quality control, adapter trimming, and chimera removal using Trimmomatic and UCHIME
- Cluster sequences into operational taxonomic units (OTUs) at 97% similarity threshold using USEARCH
- Taxonomically classify sequences using SILVA database
- Conduct α-diversity (Shannon, Simpson indices) and β-diversity (PCoA, OPLS-DA) analyses
- Identify differentially abundant taxa using LEfSe or similar methods
- Apply machine learning algorithms for feature selection and classification [25]
Integrated Cross-Species Validation Framework
A proposed three-dimensional conceptual framework maps animal models according to pathogenic mechanism, modeling strategy, and translational goal [22]. This framework organizes models based on whether they primarily recapitulate excess urate production, impaired excretion, or inflammatory sequelae along the mechanistic axis [22]. Methodologically, models are classified as chemical induction, gene editing, environmental/exercise challenge, or microbiota modulation [22]. Finally, the translational axis aligns each model with its contribution to drug validation, target discovery, or biomarker development [22].
This integrated approach facilitates appropriate model selection for specific research questions and enhances translational predictability by highlighting complementary strengths across different systems.
The Scientist's Toolkit
Table 3: Essential Research Reagents and Resources
| Reagent/Resource | Application | Function | Example Specifications |
|---|---|---|---|
| Potassium Oxonate | Chemical induction of hyperuricemia [22] | Uricase inhibitor, reduces uric acid conversion to allantoin | Typically administered at 100-300mg/kg/day for 7-21 days [22] |
| Streptozotocin (STZ) | β-cell ablation, diabetes induction [23] | Selective pancreatic β-cell toxicity, induces insulin deficiency | Multiple intraperitoneal injections at 40mg/kg for 5 consecutive days [23] |
| UHPLC-MS/MS System | Lipidomic profiling [19] | Comprehensive lipid separation, identification, and quantification | Waters ACQUITY UPLC BEH C18 column; electrospray ionization [19] |
| 16S rRNA Primers | Microbiome analysis [24] [25] | Amplification of variable regions for bacterial community profiling | 515F/806R targeting V4 region; Illumina adapter-modified [24] |
| Methyl tert-Butyl Ether (MTBE) | Lipid extraction [19] | Liquid-liquid extraction of lipid molecules from biological samples | 800μL added to 240μL methanol + 100μL sample [19] |
| Ethyl Tetradecanoate-d27 | Ethyl Tetradecanoate-d27, CAS:1113009-11-2, MF:C16H32O2, MW:283.59 g/mol | Chemical Reagent | Bench Chemicals |
| H(-Asn-Pro-Asn-Ala)2-OH | H(-Asn-Pro-Asn-Ala)2-OH, MF:C32H50N12O13, MW:810.8 g/mol | Chemical Reagent | Bench Chemicals |
Signaling Pathways and Metabolic Cross-Talk
Diagram 1: Hyperuricemia-Diabetes Pathophysiological Cross-Talk. This diagram illustrates the key mechanistic interactions between hyperuricemia, insulin resistance, lipid disturbances, gut dysbiosis, and inflammation. SCFA: short-chain fatty acids; TG: triglycerides; PC: phosphatidylcholines; PE: phosphatidylethanolamines.
The pathophysiological relationship between hyperuricemia and diabetes involves complex, bidirectional interactions. Elevated uric acid promotes insulin resistance through oxidative stress mechanisms, while also activating the NLRP3 inflammasome, driving chronic inflammation [22] [21]. Concurrently, hyperuricemia induces lipid disturbances characterized by elevated triglycerides, phosphatidylcholines, and phosphatidylethanolamines [19]. Gut dysbiosis, marked by reduced SCFA-producing bacteria and enrichment of opportunistic pathogens, contributes to both hyperuricemia and inflammation [24]. Insulin resistance further exacerbates hyperuricemia by impairing renal uric acid excretion, completing a vicious cycle of metabolic dysfunction [21].
Cross-species validation represents a powerful paradigm for advancing hyperuricemia-diabetes research, integrating complementary data from controlled animal models and human clinical studies. The convergence of lipidomics, gut microbiome analysis, and machine learning provides multidimensional insights into disease pathophysiology beyond traditional biochemical parameters. Standardized experimental protocols for lipidomic and microbiome analyses ensure reproducibility across research platforms, while interpretable machine learning frameworks extract biologically meaningful patterns from complex datasets. As research in this field evolves, the continued refinement of cross-species validation approaches will accelerate biomarker discovery and therapeutic development for these interconnected metabolic disorders.
Advanced Lipidomics Technologies: From UHPLC-MS/MS Workflows to Diagnostic Applications
Lipidomics, defined as the large-scale study of pathways and networks of cellular lipids in biological systems, has emerged as a crucial discipline for understanding metabolic diseases such as diabetes mellitus (DM) and hyperuricemia (HUA) [27] [28]. Lipids are diverse biological molecules that play essential roles in cell structure, energy storage, and signaling processes, with their dysregulation increasingly linked to disease pathogenesis [29]. The structural diversity of lipids is immense—the LIPID MAPS Structure Database has enrolled over 44,000 unique lipid structures distributed across eight main categories, creating significant analytical challenges [29]. In the context of diabetes and hyperuricemia, lipidomics offers unprecedented opportunities to discover novel biomarkers and elucidate pathological mechanisms, as lipid abnormalities are frequently associated with both conditions [6] [12] [30]. Advances in mass spectrometry (MS) platforms, particularly when coupled with ultra-high-performance liquid chromatography (UHPLC), have enabled researchers to comprehensively characterize lipid metabolic disruptions that precede and accompany these metabolic disorders [6] [29].
UHPLC-MS/MS Technology Platform
Fundamental Principles and Technical Advantages
Ultra-high-performance liquid chromatography coupled with tandem mass spectrometry (UHPLC-MS/MS) represents the analytical cornerstone of modern lipidomics due to its superior separation efficiency, sensitivity, and specificity compared to conventional techniques [6] [31] [29]. The UHPLC component separates complex lipid mixtures using specialized columns with sub-2μm particles under high pressure, providing exceptional resolution of lipid species based on their hydrophobicity prior to mass analysis [6] [31]. The tandem mass spectrometer then detects and identifies separated lipids with high mass accuracy, enabling both qualitative and quantitative analysis [31] [32]. This platform's technical advantages include its ability to resolve isobaric and isomeric lipids, detect low-abundance lipid species, and provide structural information through fragmentation patterns [29]. These capabilities are particularly valuable in diabetes and hyperuricemia research, where subtle alterations in lipid metabolism may signal early disease stages or progression [6] [12].
Key System Components and Configurations
A typical UHPLC-MS/MS system for lipidomics comprises several integrated components optimized for lipid analysis. The UHPLC subsystem typically utilizes reversed-phase C18 columns (e.g., Waters ACQUITY UPLC BEH C18, 1.7μm) for separation based on fatty acyl chain properties [6] [31]. Mobile phases commonly consist of acetonitrile/water and isopropanol/acetonitrile mixtures with modifiers such as ammonium formate or acetic acid to enhance ionization efficiency [6] [31]. The mass spectrometry component may employ triple quadrupole, time-of-flight (TOF), or Orbitrap mass analyzers, each offering distinct advantages for different lipidomics applications [27] [29]. Triple quadrupole instruments operating in multiple reaction monitoring (MRM) mode provide exceptional sensitivity for targeted quantification, while high-resolution instruments like Orbitrap and Q-TOF enable comprehensive lipid profiling in untargeted approaches [27] [32] [29]. Ionization is typically achieved via electrospray ionization (ESI) sources, which efficiently generate lipid ions for mass analysis [31].
Table 1: Key UHPLC-MS/MS Components for Lipidomics
| System Component | Typical Specifications | Lipidomics Application |
|---|---|---|
| UHPLC Column | Waters ACQUITY UPLC BEH C18 (2.1×100mm, 1.7μm) | Separation of complex lipid mixtures |
| Mobile Phase | Acetonitrile/water and acetonitrile/isopropanol with 10mM ammonium formate | Optimal lipid separation and ionization |
| Mass Analyzer | Triple quadrupole, Q-TOF, or Orbitrap | Targeted quantification or untargeted profiling |
| Ionization Source | Electrospray ionization (ESI) | Efficient generation of lipid ions |
| Data Acquisition | MRM for targeted; Full scan/data-dependent MS/MS for untargeted | Lipid identification and quantification |
Targeted vs. Untargeted Lipidomics Strategies
Untargeted Lipidomics: Comprehensive Biomarker Discovery
Untargeted lipidomics is a comprehensive, unbiased approach aimed at identifying and quantifying as many lipid species as possible within a biological sample without predefining targets [27]. This exploratory technique is ideal for hypothesis generation and discovery of novel lipid biomarkers, making it particularly valuable for initial investigations into the lipidomic alterations associated with diabetes and hyperuricemia [27] [29]. The methodology typically involves high-resolution mass spectrometry (HRMS) platforms such as Q-TOF, Orbitrap, or Fourier Transform Ion Cyclotron Resonance MS, which provide the mass accuracy and resolution needed for unknown lipid identification [27] [29]. Sample preparation for untargeted lipidomics requires meticulous extraction using solvents like methyl tert-butyl ether (MTBE) or chloroform-methanol to recover a broad range of lipid classes while removing proteins and other interferents [6] [27]. Chromatographic separation, typically using UHPLC, reduces ion suppression and enables separation of isomeric lipids before mass analysis [32] [29]. Data processing involves sophisticated bioinformatics tools for peak detection, alignment, and lipid identification using databases such as LIPID MAPS and HMDB [27] [29].
The applications of untargeted lipidomics in diabetes and hyperuricemia research include comprehensive biomarker discovery, disease mechanism elucidation, and novel lipid species identification [27]. For example, in a study comparing patients with diabetes mellitus combined with hyperuricemia (DH), diabetes mellitus alone (DM), and healthy controls (NGT), untargeted lipidomics revealed 1,361 lipid molecules across 30 subclasses, with 31 significantly altered lipid metabolites in the DH group compared to controls [6]. These included upregulated triglycerides (TGs), phosphatidylethanolamines (PEs), and phosphatidylcholines (PCs), highlighting the profound lipid dysregulation in this patient population [6]. Similarly, another study on hyperuricemia and gout patients identified significant alterations in glycerophospholipids, with the most pronounced dysregulation found in early-onset patients [12].
Targeted Lipidomics: Hypothesis-Driven Validation
Targeted lipidomics represents a focused, hypothesis-driven approach that quantifies specific, predefined lipid species with high precision and accuracy [27]. This method is ideal for validating findings from untargeted studies, clinical diagnostics, and therapeutic monitoring, where precise quantification of specific lipid biomarkers is required [27] [32]. The methodology employs triple quadrupole mass spectrometers operating in multiple reaction monitoring (MRM) mode, which monitors specific precursor-product ion transitions for each target lipid with exceptional sensitivity and selectivity [27] [32]. Sample preparation incorporates stable isotope-labeled internal standards added prior to extraction to correct for variations in extraction efficiency, ionization suppression, and instrument performance [27] [12]. Chromatographic conditions are optimized for the specific lipid panel of interest, often providing faster analysis times than untargeted approaches [32]. Data processing is more straightforward than in untargeted lipidomics, with automated integration and quantification relative to internal standards [27] [32].
In diabetes and hyperuricemia research, targeted lipidomics enables accurate quantification of candidate biomarkers in large patient cohorts, facilitating clinical validation and potential translation to diagnostic applications [27] [12]. For instance, in a study of hyperuricemia and gout patients, targeted lipidomic analysis semi-quantified 608 lipids in plasma, revealing significant dysregulation of phosphatidylethanolamines and lysophosphatidylcholine plasmalogens/plasmanyls [12]. This approach also demonstrated the corrective effect of urate-lowering treatment (ULT) on lipid imbalances, particularly in early-onset patients [12]. Another cross-platform comparison study demonstrated that targeted approaches could quantify hundreds of lipids across multiple classes with high precision (median CV < 5%) and strong correlation with untargeted methods (median r = 0.71) [32].
Table 2: Comparison of Untargeted and Targeted Lipidomics Approaches
| Characteristic | Untargeted Lipidomics | Targeted Lipidomics |
|---|---|---|
| Primary Objective | Comprehensive biomarker discovery, novel lipid identification | Hypothesis testing, precise quantification of predefined lipids |
| Analytical Approach | Unbiased, global profiling | Focused analysis of specific lipids |
| MS Platform | High-resolution MS (Q-TOF, Orbitrap) | Triple quadrupole MS with MRM |
| Data Complexity | High, requires advanced bioinformatics | Manageable, streamlined processing |
| Quantification | Semi-quantitative (relative abundance) | Absolute quantification with internal standards |
| Throughput | Lower due to complex data analysis | Higher, automated processing |
| Ideal Application | Initial discovery phase, pathway analysis | Clinical validation, therapeutic monitoring |
Integrated Workflow for Diabetes and Hyperuricemia Research
An effective lipidomics strategy for diabetes and hyperuricemia research often integrates both untargeted and targeted approaches in a complementary workflow [27] [32]. The typical pipeline begins with untargeted lipidomics to comprehensively profile lipid alterations and identify candidate biomarkers distinguishing disease states from healthy controls or between patient subgroups [6] [27]. Following statistical analysis and biomarker prioritization, targeted methods are developed and validated for precise quantification of the most promising lipid candidates in larger cohort studies [27] [32]. This integrated approach leverages the strengths of both strategies—the discovery power of untargeted methods and the quantitative rigor of targeted approaches—to generate biologically meaningful and analytically robust data [27] [32]. For example, in a study of diabetes with hyperuricemia, untargeted screening identified 31 significantly altered lipids, which were then mapped to disturbed metabolic pathways including glycerophospholipid and glycerolipid metabolism [6]. These findings could be validated in expanded cohorts using targeted methods and potentially developed into clinical diagnostic panels.
Applications in Diabetes and Hyperuricemia Research
Lipidomic Alterations in Disease Pathogenesis
Lipidomics has revealed profound alterations in lipid metabolism associated with both diabetes and hyperuricemia, providing insights into disease mechanisms and potential therapeutic targets [6] [12] [30]. In patients with diabetes mellitus combined with hyperuricemia (DH), multivariate analyses of lipidomic data show significant separation from both diabetic patients and healthy controls, confirming distinct lipidomic profiles [6]. Specifically, researchers have identified 31 significantly altered lipid metabolites in DH patients compared to healthy controls, with notable upregulation of 13 triglycerides (TGs), 10 phosphatidylethanolamines (PEs), and 7 phosphatidylcholines (PCs), along with downregulation of certain phosphatidylinositols (PIs) [6]. Pathway analysis has demonstrated that glycerophospholipid metabolism (impact value 0.199) and glycerolipid metabolism (impact value 0.014) are the most significantly perturbed metabolic pathways in DH patients [6]. These findings suggest that integrated lipidomic approaches can capture the complex metabolic interplay between hyperglycemia and hyperuricemia, potentially revealing novel aspects of their shared pathophysiology.
In hyperuricemia and gout patients, targeted lipidomic analyses have identified particularly pronounced dysregulation of glycerophospholipids, with the most significant changes observed in early-onset patients (age ≤ 40 years) [12]. Specifically, researchers observed upregulation of phosphatidylethanolamines and downregulation of lysophosphatidylcholine plasmalogens/plasmanyls in these patient groups [12]. Multivariate statistics successfully differentiated early-onset hyperuricemia and gout groups from healthy controls with >95% accuracy, highlighting the diagnostic potential of lipidomic signatures [12]. Additionally, urate-lowering treatment appeared to correct some of these lipid imbalances, suggesting that lipidomics may also monitor treatment response [12]. Cross-sectional studies in older adults have further demonstrated significant associations between various lipid indices (RC, AIP, CRI-I, CRI-II, LCI) and hyperuricemia, with the atherogenic index of plasma (AIP) showing optimal diagnostic accuracy for HUA in the overall cohort [30].
Metabolic Pathway Analysis
Lipidomic studies in diabetes and hyperuricemia have identified specific metabolic pathways that are consistently dysregulated, providing mechanistic insights into disease pathogenesis [6] [12]. The integration of lipidomic data with pathway analysis tools such as MetaboAnalyst has been instrumental in identifying these perturbed pathways [6]. In diabetes with hyperuricemia, glycerophospholipid metabolism emerges as the most significantly affected pathway, reflecting alterations in membrane phospholipid composition and signaling [6]. Glycerolipid metabolism, particularly triglyceride and diglyceride metabolism, also shows significant disruption, consistent with the well-established association between diabetes and dyslipidemia [6]. These pathway disturbances align with the identified lipid alterations, including increased triglycerides and modified phospholipid profiles, which may contribute to insulin resistance, β-cell dysfunction, and inflammatory processes characteristic of both diabetes and hyperuricemia [6] [12].
Experimental Protocols and Methodologies
Sample Preparation Protocol for Plasma Lipidomics
Proper sample preparation is critical for reliable lipidomic results, particularly when studying diabetes and hyperuricemia where lipid alterations may be subtle [6] [12]. The following protocol has been successfully applied in clinical lipidomic studies of these conditions:
Sample Collection: Collect fasting blood samples (e.g., 5mL) into appropriate anticoagulant tubes [6]. Centrifuge at 3,000 rpm for 10 minutes at room temperature to separate plasma [6]. Aliquot plasma (e.g., 0.2mL) and store at -80°C until analysis [6].
Lipid Extraction: Thaw samples on ice and vortex thoroughly [6]. Transfer 100μL plasma to a 1.5mL centrifuge tube [6]. Add 200μL of 4°C water and mix thoroughly [6]. Add 240μL of pre-cooled methanol with internal standards (for targeted analysis) and mix [6]. Add 800μL methyl tert-butyl ether (MTBE) and mix thoroughly [6]. Sonicate in a low-temperature water bath for 20 minutes [6]. Let stand at room temperature for 30 minutes [6]. Centrifuge at 14,000g for 15 minutes at 10°C [6]. Collect the upper organic phase and dry under nitrogen [6]. Reconstitute in appropriate solvent (e.g., 100μL isopropanol) for analysis [6].
Quality Control: Prepare quality control (QC) samples by pooling equal aliquots from all samples [6] [31]. Insert QC samples randomly throughout the analysis sequence to monitor instrument stability and data quality [6] [31].
UHPLC-MS/MS Analysis Conditions
The following typical UHPLC-MS/MS conditions have been employed in lipidomic studies of diabetes and hyperuricemia:
- Column: Waters ACQUITY UPLC BEH C18 (2.1mm i.d. × 100mm length, 1.7μm particle size)
- Mobile Phase A: 10mM ammonium formate in acetonitrile/water
- Mobile Phase B: 10mM ammonium formate in acetonitrile/isopropanol
- Gradient: Optimized for comprehensive lipid separation (e.g., 5-100%B over 15-20 minutes)
- Flow Rate: 0.3-0.4mL/min
- Column Temperature: 45-55°C
- Injection Volume: 1-10μL
- Ionization Mode: Electrospray ionization (ESI) in positive and/or negative mode
- Source Temperature: 500-550°C
- Ion Spray Voltage: 5,000-5,500V
- Curtain Gas: 25-35psi
- Collision Gas: Medium to high
- Data Acquisition: MRM for targeted analysis; Full scan/data-dependent MS/MS for untargeted analysis
Data Processing and Statistical Analysis
Lipidomic data processing and analysis workflows differ between targeted and untargeted approaches:
Untargeted Data Processing [27] [29]:
- Peak Detection and Alignment: Use software (e.g., MS-DIAL, XCMS) to detect lipid features across samples
- Lipid Identification: Match accurate mass, retention time, and MS/MS spectra to lipid databases (LIPID MAPS, HMDB)
- Data Normalization: Correct for systematic variation using internal standards, QC samples, or statistical methods
- Statistical Analysis: Employ multivariate methods (PCA, OPLS-DA) to identify group differences and univariate statistics to determine significance
Targeted Data Processing [27] [32]:
- Peak Integration: Quantify peak areas for each target lipid and corresponding internal standard
- Concentration Calculation: Determine concentrations using calibration curves with internal standard correction
- Quality Assessment: Ensure precision (CV < 15-20%) and accuracy for all quantified lipids
- Statistical Analysis: Apply appropriate parametric or non-parametric tests to identify significant differences between groups
The Scientist's Toolkit: Essential Research Reagents and Materials
Table 3: Essential Research Reagents and Materials for Lipidomics
| Category | Specific Items | Application Purpose |
|---|---|---|
| Internal Standards | SPLASH LIPIDOMIX Mass Spec Standard, deuterated lipid standards [12] [32] | Quantification accuracy, correction of extraction and ionization variability |
| Solvents | Methyl tert-butyl ether (MTBE), chloroform, methanol, isopropanol, acetonitrile (all LC-MS grade) [6] [12] | Lipid extraction, mobile phase preparation |
| UHPLC Columns | Waters ACQUITY UPLC BEH C18 (1.7μm), CSH columns [6] [31] | High-resolution separation of lipid species |
| Additives | Ammonium formate, ammonium acetate, acetic acid [6] [31] | Mobile phase modifiers for improved ionization |
| Quality Controls | NIST SRM 1950 - Metabolites in Frozen Human Plasma [12] | Method validation, inter-laboratory comparison |
| Sample Preparation | Schirmer strips (for tear analysis), various collection tubes [33] | Standardized biological sample collection |
| Chloroacetamido-C-PEG3-C3-NHBoc | Chloroacetamido-C-PEG3-C3-NHBoc, MF:C17H33ClN2O6, MW:396.9 g/mol | Chemical Reagent |
| Trisulfo-Cy5.5-Alkyne | Trisulfo-Cy5.5-Alkyne, MF:C44H47N3O13S4, MW:954.1 g/mol | Chemical Reagent |
UHPLC-MS/MS platforms, combined with appropriate targeted or untargeted strategies, provide powerful analytical frameworks for advancing our understanding of lipid dysregulation in diabetes and hyperuricemia [6] [12] [29]. The complementary nature of these approaches enables both comprehensive biomarker discovery and rigorous validation, offering a complete workflow for translational lipidomics research [27] [32]. As lipidomic technologies continue to evolve with improvements in separation power, mass resolution, sensitivity, and data processing capabilities, their applications in metabolic disease research will expand correspondingly [34] [29]. Future directions include standardized protocols for multi-center studies, integration with other omics datasets, and translation of lipidomic biomarkers into clinical practice for early detection, stratification, and monitoring of diabetes and hyperuricemia [34] [29]. The growing evidence of specific lipid alterations and pathway disturbances in these conditions highlights the potential of lipidomics to contribute significantly to personalized medicine approaches for metabolic disorders [6] [12] [30].
Lipidomics, the large-scale study of lipid pathways and networks, has emerged as a crucial tool for discovering biomarkers in metabolic diseases such as diabetes mellitus (DM) and hyperuricemia (HU) [1]. The transition of lipid research from bench to bedside relies on the discovery of biomarkers that are clinically reliable, repeatable, and validated across diverse populations [1]. A standardized workflow from sample preparation to data acquisition is fundamental to ensuring data quality, reproducibility, and meaningful biological interpretation, particularly when investigating the complex lipid metabolic disruptions in conditions like diabetes combined with hyperuricemia (DH) [6]. This guide details the essential protocols and considerations for a robust lipidomics workflow within this specific research context.
Sample Preparation Protocols
Proper sample preparation is the critical first step to ensure analytical reproducibility and accuracy.
Plasma Sample Collection and Pre-processing
Based on a study investigating lipid profiles in DH, DM, and normal glucose tolerance (NGT) groups, the following protocol is recommended [6]:
- Collection: Collect fasting blood samples (e.g., 5 mL) into appropriate anticoagulant tubes.
- Plasma Separation: Centrifuge at 3,000 rpm for 10 minutes at room temperature.
- Aliquoting: Aliquot the upper plasma layer (e.g., 0.2 mL) into sterile tubes.
- Storage: Immediately store at -80°C until analysis.
- Quality Control (QC) Preparation: Create pooled QC samples by combining equal volumes from all study samples. These are used to monitor instrument performance and data quality throughout the acquisition sequence.
Lipid Extraction
The modified methyl tert-butyl ether (MTBE) extraction method is widely used. The protocol from the DH study is as follows [6]:
- Thawing: Thaw plasma samples on ice.
- Aliquot: Transfer 100 μL of plasma into a 1.5 mL microcentrifuge tube.
- Dilution: Add 200 μL of 4°C purified water and vortex to mix.
- Protein Precipitation: Add 240 μL of pre-cooled methanol and vortex.
- Solvent Addition: Add 800 μL of MTBE and vortex thoroughly.
- Sonication: Sonicate in a low-temperature water bath for 20 minutes.
- Phase Separation: Allow the mixture to stand at room temperature for 30 minutes.
- Centrifugation: Centrifuge at 14,000 g for 15 minutes at 10°C.
- Collection: Collect the upper organic phase (which contains the lipids).
- Drying: Dry the organic phase under a gentle stream of nitrogen gas.
- Reconstitution: Reconstitute the dried lipid extract in a suitable solvent (e.g., 100 μL isopropanol) for mass spectrometry analysis.
Table 1: Key Reagents for Sample Preparation and Their Functions
| Reagent/Material | Function |
|---|---|
| Methyl tert-butyl ether (MTBE) | Primary solvent for liquid-liquid extraction of a broad range of lipids. |
| Methanol | Precipitates proteins and improves extraction efficiency. |
| Acetonitrile & Isopropanol | Reconstitution solvents compatible with reverse-phase UHPLC. |
| Ammonium Formate | Mobile phase additive that improves ionization efficiency in MS. |
| Internal Standard Mix | Corrects for variability in extraction and ionization; essential for quantification. |
Data Acquisition Techniques
Mass spectrometry, particularly coupled with liquid chromatography, is the cornerstone of modern lipidomics.
Liquid Chromatography Conditions
Chromatographic separation reduces sample complexity and ion suppression. A typical method for comprehensive lipidomic profiling uses a reversed-phase column [6]:
- Column: Waters ACQUITY UPLC BEH C18 (2.1 mm × 100 mm, 1.7 μm).
- Mobile Phase A: 10 mM ammonium formate in acetonitrile:water.
- Mobile Phase B: 10 mM ammonium formate in acetonitrile:isopropanol.
- Gradient: A linear gradient from high A to high B over a period of 15-30 minutes is standard.
- Temperature: Column temperature maintained at 45-55°C.
- Flow Rate: 0.2-0.4 mL/min.
Mass Spectrometry Analysis
Both untargeted (global) and targeted approaches are employed, often using tandem mass spectrometry (MS/MS) [1].
- Untargeted Lipidomics: A powerful technique for detecting and quantifying all lipid species in a sample, providing a complete picture of the lipid profile. It is particularly valuable for biomarker discovery but may be limited by the dynamic range and sensitivity for low-abundance species [1].
- Targeted Lipidomics: Focuses on specific lipids or lipid classes of interest (e.g., ceramides, phosphatidylcholines), offering higher sensitivity and quantitative accuracy for validation [1].
- High-Resolution MS: Platforms like Q-TOF (Quadrupole-Time of Flight) are preferred for untargeted work due to their high mass accuracy and resolution, enabling precise lipid identification [35].
The overall workflow from sample to data is summarized below.
Data Processing and Analysis
Post-acquisition, raw data must be processed to extract meaningful biological information. Standardized statistical workflows in R and Python are critical for transparency and reproducibility [36].
Key Processing Steps
- Peak Picking and Alignment: Identify lipid features and align them across samples.
- Normalization: Correct for technical variance using internal standards or robust algorithms like LOESS or SERRF (Systematic Error Removal using Random Forest) [36].
- Imputation: Handle missing data points by investigating the cause of missingness (e.g., missing completely at random vs. below detection limit) before applying appropriate imputation methods [36].
- Multivariate Statistics: Use Principal Component Analysis (PCA) and Orthogonal Projections to Latent Structures-Discriminant Analysis (OPLS-DA) to observe group separations and identify lipids contributing most to variance [6].
Visualization for Analysis
Effective visualization is key for interpreting complex lipidomic data. Recommended techniques include [36]:
- Volcano Plots: To visualize the combination of statistical significance and magnitude of change for each lipid.
- Heatmaps with Dendrograms: To show abundance patterns and clustering of samples and lipids.
- Violin/Box Plots: To depict data distributions of specific lipids across groups, preferable to simple bar charts.
- Lipidome Projector: A specialized tool that visualizes entire lipidomes in a 2D/3D vector space based on lipid structural similarity, enabling exploratory analysis and interpretation [37].
Application in Diabetes and Hyperuricemia Research
Applying this standardized workflow in a study of DH patients revealed significant lipidomic disruptions. A UHPLC-MS/MS-based untargeted lipidomics analysis identified 1,361 lipid molecules across 30 subclasses [6].
Multivariate analyses like PCA and OPLS-DA showed a clear separation trend among the DH, DM, and NGT groups, confirming distinct lipidomic profiles [6]. A total of 31 significantly altered lipid metabolites were pinpointed in the DH group compared to the NGT controls [6].
Table 2: Key Lipid Alterations in Diabetes with Hyperuricemia (DH) vs. Controls [6]
| Lipid Class | Example Molecule | Trend in DH | Biological Relevance |
|---|---|---|---|
| Triglycerides (TG) | TG (16:0/18:1/18:2) | Significantly Upregulated | Energy storage; associated with insulin resistance and cardiometabolic risk. |
| Phosphatidylethanolamines (PE) | PE (18:0/20:4) | Significantly Upregulated | Key membrane phospholipids; involved in membrane fusion and cell signaling. |
| Phosphatidylcholines (PC) | PC (36:1) | Significantly Upregulated | Abundant membrane phospholipids; precursors to signaling molecules. |
| Phosphatidylinositol (PI) | Not specified | Downregulated | Minor membrane phospholipids with key roles in cell signaling. |
Pathway analysis of these differential metabolites revealed their enrichment in specific metabolic pathways. Glycerophospholipid metabolism (impact value 0.199) and glycerolipid metabolism (impact value 0.014) were identified as the most significantly perturbed pathways in DH patients [6]. The diagram below illustrates the interconnected nature of these disrupted pathways.
Quality Control and Standardization
The lack of reproducibility across different platforms is a significant obstacle in lipidomics. Interlaboratory studies have shown low agreement rates (as low as 14–36%) in lipid identification and quantification [1] [35].
Strategies for Harmonization
- Use of Reference Materials: Incorporate commercially available, homogeneous reference materials like the NIST Standard Reference Material (SRM) 1950 – Metabolites in Frozen Human Plasma. These materials provide community-wide benchmarks for intra- and inter-laboratory quality control and method validation [35].
- Adherence to Standards: Follow guidelines from the Lipidomics Standards Initiative (LSI) and the Metabolomics Society for planning acquisition sequences, including the use of QC samples, blank injections, and system suitability standards [36].
- Standardized Data Analysis: Utilize modular, code-based frameworks in R and Python for statistical processing and visualization to ensure analytical choices are transparent, consistent, and reproducible [36].
Bioinformatics and Pathway Analysis with MetaboAnalyst and KEGG
Lipidomics, a specialized branch of metabolomics, has emerged as a powerful approach for discovering biomarkers and elucidating pathological mechanisms in complex metabolic diseases such as diabetes and hyperuricemia [1]. The integration of bioinformatics tools like MetaboAnalyst and KEGG pathway analysis has become indispensable for interpreting the vast datasets generated by modern lipidomics studies, transforming raw analytical data into biologically meaningful insights [38] [1]. This technical guide provides a comprehensive framework for applying these bioinformatics tools specifically within the context of lipidomics biomarker discovery for diabetes and hyperuricemia research, addressing the growing need for standardized methodologies in this rapidly advancing field [6] [39].
The convergence of diabetes and hyperuricemia represents a significant clinical challenge, with studies indicating that approximately 17.7% of participants in a large Chinese study were diagnosed with hyperuricemia, while the global prevalence of diabetes continues to rise dramatically [6]. Lipidomics investigations have revealed that these metabolic disorders are characterized by distinct alterations in lipid metabolic pathways, particularly glycerophospholipid and glycerolipid metabolism, which can serve as valuable sources for biomarker discovery [6] [39]. Through systematic bioinformatics analysis, researchers can now identify and validate these lipid signatures, paving the way for improved diagnostic strategies and therapeutic interventions [1].
Biological Foundations of Lipidomics in Metabolic Disease
Lipidomic Dysregulation in Diabetes and Hyperuricemia
Diabetes mellitus combined with hyperuricemia (DH) demonstrates characteristic lipidomic profiles that distinguish it from diabetes alone or healthy states [6]. Untargeted lipidomic analysis using UHPLC-MS/MS has identified 1,361 lipid molecules across 30 subclasses in patient plasma, with multivariate analyses revealing significant separation trends among DH, DM, and normal glucose tolerance (NGT) groups [6]. A comparative study identified 31 significantly altered lipid metabolites in the DH group compared to NGT controls, with 13 triglycerides (TGs), 10 phosphatidylethanolamines (PEs), and 7 phosphatidylcholines (PCs) significantly upregulated, while one phosphatidylinositol (PI) was downregulated [6].
The intersection of hyperuricemia and lipid metabolism extends beyond diabetes. A separate multi-omics study on hyperuricemia patients identified 33 significantly upregulated lipid metabolites involved in arachidonic acid metabolism, glycerophospholipid metabolism, linoleic acid metabolism, glycosylphosphatidylinositol (GPI)-anchor biosynthesis, and alpha-linolenic acid metabolism pathways [39]. These findings establish glycerophospholipid metabolism as a central pathway commonly disrupted in both conditions, with an impact value of 0.199 in DH patients [6].
Analytical Platforms for Lipidomics
Current lipidomics methodologies leverage several mass spectrometry approaches, each with distinct advantages for biomarker discovery:
Table 1: Lipidomics Methodologies for Biomarker Discovery
| Method Type | Key Characteristics | Applications in Diabetes/Hyperuricemia |
|---|---|---|
| Untargeted Lipidomics | Comprehensive detection of all lipid species; ideal for novel biomarker discovery | Identification of 1,361 lipid molecules across 30 subclasses in DH patients [6] |
| Targeted Lipidomics | Focused analysis of predefined lipids; superior quantification and reproducibility | Validation of specific lipid biomarkers in large cohorts [1] |
| Pseudotargeted Lipidomics | Combines breadth of untargeted with precision of targeted approaches | Improved coverage and quantification in complex samples [1] |
| UPLC-Q-TOF/MS | High resolution and sensitivity; exact mass measurements | Serum metabolic fingerprinting in hyperuricemic rat models [40] |
Ultra-performance liquid chromatography coupled with tandem mass spectrometry (UPLC-MS/MS) has proven particularly valuable for lipid separation and identification, with typical chromatographic conditions utilizing C18 columns (e.g., Waters ACQUITY UPLC BEH C18, 2.1 × 100 mm, 1.7 μm) and mobile phases consisting of acetonitrile/water mixtures with ammonium formate or formic acid additives [6] [40].
Experimental Design and Workflow
Sample Preparation Protocols
Standardized sample preparation is critical for reproducible lipidomics results. For plasma/serum samples, the following protocol has been successfully applied in diabetes-hyperuricemia research:
- Protein Precipitation: Add 300 μL of pre-cooled methanol to 100 μL of thawed serum, vortex mix, then centrifuge at 17,000 × g for 10 minutes at 4°C [6].
- Lipid Extraction: Transfer supernatant and add 800 μL methyl tert-butyl ether (MTBE), sonicate in low-temperature water bath for 20 minutes, then stand at room temperature for 30 minutes [6].
- Phase Separation: Centrifuge at 14,000 × g for 15 minutes at 10°C, collect upper organic phase [6].
- Concentration and Reconstitution: Dry under nitrogen stream at 30°C, reconstitute in 100 μL isopropanol or acetonitrile/isopropanol (1:1, v/v) [6] [40].
For tissue samples, additional homogenization steps are required prior to extraction. The entire process should include quality control (QC) samples created by pooling aliquots from all samples to monitor analytical performance [6].
Data Acquisition Parameters
Chromatographic separation is typically achieved using gradient elution with a flow rate of 0.2-0.3 mL/min and column temperature maintained at 45°C [40]. Mass spectrometry detection employs both positive and negative ionization modes with key parameters including:
- Capillary Voltage: 3.0 kV (positive), 2.5 kV (negative) [6]
- Ion Source Temperature: 300-450°C
- Scanning Range: m/z 200-1800
- Resolution: 70,000 for MS1, 17,500 for MS2 [39]
The use of data-dependent acquisition (DDA) enables collection of both precursor and fragment ion information for lipid identification.
Bioinformatics Processing Pipeline
Data Preprocessing and Quality Control
Raw mass spectrometry data requires extensive preprocessing before biological interpretation. The standard workflow includes:
- Peak Detection and Alignment: Software such as MS-DIAL, Progenesis QI, or XCMS performs peak picking, retention time alignment, and integration [6] [41].
- Noise Filtering and Normalization: Apply "80% rule" to remove features not present in most samples, followed by normalization using QC samples, internal standards, or probabilistic quotient normalization [40].
- Missing Value Imputation: Replace missing values using k-nearest neighbors (KNN) algorithm or minimum value substitution.
Quality control should include monitoring of retention time stability, mass accuracy, and signal intensity in QC samples throughout the analytical sequence.
Multivariate Statistical Analysis
Multivariate statistical methods are essential for identifying lipid signatures distinguishing disease states:
- Principal Component Analysis (PCA): Unsupervised method to assess overall data structure and identify outliers [6] [40]
- Orthogonal Partial Least Squares-Discriminant Analysis (OPLS-DA): Supervised method to maximize separation between predefined groups while separating predictive and non-predictive variation [6]
- Variable Importance in Projection (VIP): Rank lipids by their contribution to group separation, with VIP > 1.0 typically considered significant [40]
These analyses can be performed using SIMCA-P, MetaboAnalyst, or custom scripts in R or Python.
Pathway Analysis with MetaboAnalyst and KEGG
MetaboAnalyst Workflow
MetaboAnalyst provides a comprehensive web-based platform for metabolomic data analysis and pathway visualization. The standard workflow includes:
- Data Upload: Prepare a data table with lipids as rows and samples as columns, accompanied by sample information and experimental design metadata.
- Data Filtering and Normalization: Apply data filtering based on interquartile range, followed by normalization using a reference sample or specific normalization method.
- Pathway Analysis Module: Select the "Pathway Analysis" module and choose the appropriate organism (typically Homo sapiens for clinical studies).
- Pathway Enrichment and Topology Analysis: MetaboAnalyst performs both enrichment analysis (Fisher's exact test) and pathway topology analysis (relative-betweenness centrality) to identify biologically relevant pathways [40].
KEGG Pathway Mapping
The KEGG database provides reference metabolic pathways for systematic interpretation of lipidomic data. Key steps include:
- Lipid Identifier Conversion: Convert lipid names to standard identifiers (e.g., HMDB, LIPID MAPS, KEGG Compound) using the Chemical Translation Service or similar tools.
- Pathway Mapping: Input the list of significant lipids (typically with p < 0.05 and VIP > 1.0) into the KEGG Mapper search tool to visualize their positions in metabolic networks.
- Pathway Impact Assessment: Calculate pathway impact values based on the position of altered lipids within the pathway topology, with higher values indicating greater disruption.
Table 2: Experimentally Identified Lipid Pathways in Diabetes and Hyperuricemia
| Metabolic Pathway | Impact Value | Key Lipid Classes | Associated Diseases |
|---|---|---|---|
| Glycerophospholipid Metabolism | 0.199 [6] | Phosphatidylcholines, Phosphatidylethanolamines | DH, HUA [6] [39] |
| Glycerolipid Metabolism | 0.014 [6] | Triglycerides, Diglycerides | DH [6] |
| Arachidonic Acid Metabolism | N/R | Eicosanoids, Prostaglandins | HUA [39] |
| Linoleic Acid Metabolism | N/R | Linoleic acid derivatives | HUA [39] |
| GPI-Anchor Biosynthesis | N/R | Glycosylphosphatidylinositols | HUA [39] [40] |
N/R = Not Reported in Source
Case Studies in Diabetes and Hyperuricemia Research
Lipid Biomarkers for Diabetes with Hyperuricemia
A recent UHPLC-MS/MS-based plasma untargeted lipidomic analysis compared patients with diabetes mellitus combined with hyperuricemia (DH) against those with diabetes alone (DM) and healthy controls (NGT) [6]. The study identified 31 significantly altered lipid metabolites in the DH group, with collective analysis revealing enrichment in six major metabolic pathways. Crucially, glycerophospholipid metabolism (impact value 0.199) and glycerolipid metabolism (impact value 0.014) were identified as the most significantly perturbed pathways in DH patients [6]. Furthermore, comparison of DH versus DM groups identified 12 differential lipids also predominantly enriched in these same core pathways, underscoring their central role in the pathophysiology of hyperuricemia complicating diabetes.
Multi-Omics Analysis of Hyperuricemia
A comprehensive multi-omics study investigated lipid metabolism disorders in patients with hyperuricemia, analyzing serum from 60 healthy individuals and 60 hyperuricemia patients using LC-MS and HPLC [39]. The research identified 33 significantly upregulated lipid metabolites in hyperuricemia patients involved in five key metabolic pathways. Further integration with immune factor analysis revealed that IL-10, CPT1, IL-6, SEP1, TGF-β1, Glu, TNF-α, and LD were associated with glycerophospholipid metabolism [39]. The study demonstrated that CPT1, TGF-β1, SEP1, IL-6, Glu, and LD may increase fatty acid oxidation and mitochondrial oxidative phosphorylation in patients through the glycerophospholipid pathway, reducing glycolysis rates and promoting different cellular functions that affect disease progression in hyperuricemia patients.
Research Reagent Solutions
Table 3: Essential Research Reagents for Lipidomics in Metabolic Disease
| Reagent/Category | Specific Examples | Function/Application |
|---|---|---|
| Chromatography Columns | Waters ACQUITY UPLC BEH C18 (2.1 × 100 mm, 1.7 μm) [6] | Lipid separation prior to mass spectrometry |
| Internal Standards | Deuterated lipid standards (not specified in sources) | Quantification and quality control |
| Lipid Extraction Solvents | Methyl tert-butyl ether (MTBE) [6], Chloroform:MeOH (3:1, v/v) [40] | Liquid-liquid extraction of lipids from biological samples |
| Mobile Phase Additives | Ammonium formate [6], Formic acid [40] | Enhance ionization efficiency in mass spectrometry |
| Modeling Compounds | Potassium oxonate [40], Hypoxanthine, Adenine [42] | Induce hyperuricemia in animal models |
| Enzyme Assay Kits | UA, Cr, BUN reagent kits [42] | Measure biochemical parameters for model validation |
Advanced Integrative Approaches
Multi-Omics Integration
The most advanced lipidomics studies now integrate multiple omics technologies to obtain a comprehensive view of metabolic dysregulation. As highlighted in recent research, "Multi-omics integration reveals mechanistic links between metabolic dysregulation and complex diseases" [38]. This approach combines lipidomics with genomics, transcriptomics, and proteomics data to establish complete regulatory networks. For example, Mendelian randomization studies have identified 22 druggable genes significantly associated with hyperuricemia through integrated analysis of druggable genome data, blood, kidney, and intestinal expression quantitative trait loci (eQTLs), and HUA-associated genome-wide association study (GWAS) data [43].
Artificial Intelligence and Machine Learning
Machine learning and artificial intelligence are transforming lipidomic biomarker discovery, with frameworks like MS2Lipid demonstrating up to 97.4% accuracy in predicting lipid subclasses [1]. These approaches are particularly valuable for:
- Pattern Recognition: Identifying complex lipid signatures that distinguish disease subtypes or predict progression
- Integration of Heterogeneous Data: Combining lipidomic profiles with clinical variables for improved risk stratification
- Predictive Modeling: Developing models for disease onset or treatment response, as demonstrated in a study that used metabolomic profiles to improve prediction of gout incidence in hyperuricemia patients (AUC: 0.80 vs 0.78) [44]
Bioinformatics pathway analysis using MetaboAnalyst and KEGG represents a cornerstone of modern lipidomics research in diabetes and hyperuricemia. The standardized workflows presented in this technical guide provide researchers with robust methods for identifying and validating lipid biomarkers, elucidating disrupted metabolic pathways, and advancing our understanding of the complex interplay between these metabolic disorders. As the field continues to evolve, the integration of multi-omics data and artificial intelligence approaches will further enhance our ability to translate lipidomic discoveries into clinical applications, ultimately improving diagnosis, risk stratification, and targeted therapies for metabolic diseases.
The convergence of type 2 diabetes mellitus (T2DM) and hyperuricemia represents a significant clinical challenge, amplifying the risk of renal and cardiovascular complications [17] [45]. Stratifying patients within this comorbid population is crucial for implementing personalized treatment strategies to mitigate long-term health risks. Lipidomics, the large-scale study of lipid molecules, has emerged as a powerful platform for biomarker discovery, offering a rich source of molecular data that reflects underlying metabolic dysfunction [1] [46].
This technical guide details the workflow for translating raw spectral data into validated lipid biomarker panels for patient stratification, with a specific focus on the T2DM-hyperuricemia (DH) phenotype. We provide in-depth methodologies, data analysis protocols, and visualization tools to equip researchers in this rapidly advancing field.
The Clinical Problem: Dyslipidemia and Hyperuricemia in Diabetes
In patients with uncontrolled T2DM, the co-occurrence of dyslipidemia and hyperuricemia is highly prevalent, with one study reporting a rate of 81.6% [17]. This combination signifies a more advanced stage of metabolic dysregulation and is associated with accelerated vascular damage and adverse renal outcomes [17] [45]. The pathophysiological mechanisms are interconnected, sharing roots in insulin resistance, chronic low-grade inflammation, and oxidative stress [17].
Uric acid is not merely a bystander; it acts as a mediator of metabolic injury through the activation of the renin-angiotensin-aldosterone system (RAAS), promotion of oxidative stress, and stimulation of inflammatory pathways [45]. This complex interplay creates a distinct lipidomic signature that can be leveraged for precise patient stratification beyond conventional clinical biomarkers.
Table 1: Conventional Diagnostic Criteria for T2DM and Hyperuricemia
| Condition | Diagnostic Biomarker | Threshold | Key Limitations |
|---|---|---|---|
| Type 2 Diabetes (T2DM) [47] | Fasting Plasma Glucose (FPG) | ≥ 126 mg/dL | Requires fasting, high diurnal variability |
| HbA1c | ≥ 6.5% | Lower sensitivity, affected by erythrocyte lifespan | |
| Oral Glucose Tolerance Test (OGTT) | 2-h post-load ≥ 200 mg/dL | Time-consuming, labor-intensive, low reproducibility | |
| Hyperuricemia [17] | Serum Uric Acid | > 7 mg/dL (Males), > 6 mg/dL (Females) | Levels influenced by renal function; does not fully capture metabolic risk |
Analytical Workflows: From Sample to Spectrum
The journey from a biological sample to a quantitative lipid profile requires meticulous optimization at every step to ensure accuracy, reproducibility, and depth of coverage.
Sample Preparation and Lipid Extraction
Robust pre-analytical protocols are foundational. For plasma lipidomics, a modified methyl-tert-butyl ether (MTBE) extraction method is widely employed for its high recovery and reproducibility [19] [46].
Detailed Protocol: MTBE Lipid Extraction from Plasma [19]
- Aliquot: Combine 100 μL of thawed plasma with 200 μL of ice-cold water.
- Protein Precipitation: Add 240 μL of pre-cooled methanol and vortex mix.
- Liquid-Liquid Extraction: Add 800 μL of MTBE, followed by sonication in a low-temperature water bath for 20 minutes.
- Phase Separation: Allow the mixture to stand at room temperature for 30 minutes, then centrifuge at 14,000 g for 15 minutes at 10°C.
- Collection: Carefully collect the upper organic phase containing the lipids.
- Solvent Evaporation: Dry the organic phase under a gentle stream of nitrogen gas.
- Reconstitution: Redissolve the lipid pellet in a suitable solvent like isopropanol for MS analysis.
Advanced Lipid Separation and Detection
Ultra-High-Performance Liquid Chromatography (UHPLC) coupled with tandem mass spectrometry (MS/MS) is the cornerstone of modern lipidomics. The UHPLC step separates lipid molecules by class and fatty acyl composition, reducing ion suppression and complexity for the mass spectrometer [19] [46].
Standard UHPLC-MS/MS Conditions [19]
- Column: Waters ACQUITY UPLC BEH C18 (2.1 x 100 mm, 1.7 μm).
- Mobile Phase: A: 10 mM ammonium formate in water/acetonitrile; B: 10 mM ammonium formate in acetonitrile/isopropanol.
- Gradient: A complex multi-step gradient is used to elute lipids from non-polar (e.g., triglycerides) to more polar (e.g., phospholipids) species.
- Ionization: Electrospray Ionization (ESI) in both positive and negative modes to capture the full spectrum of lipid classes.
- Mass Analysis: High-resolution mass analyzers (e.g., Orbitrap, FT-ICR) are preferred for accurate mass measurement and distinguishing isobaric species [48] [49].
The field is being transformed by the integration of ion mobility-mass spectrometry (IM-MS), which adds a fourth dimension of separation based on the size, shape, and charge of ions. This is particularly powerful for resolving lipid isomers that are indistinguishable by mass alone [49]. Collision cross-section (CCS) values obtained from IM-MS serve as a robust, reproducible molecular descriptor for higher-confidence lipid identification [49].
Data Analysis: From Spectrum to Biomarker Candidate
The transformation of complex spectral data into biological insight involves a multi-stage computational pipeline.
Pre-processing and Lipid Identification
Raw spectral data is processed using software platforms (e.g., MS-DIAL, Lipostar) to perform peak picking, alignment, and deconvolution. Lipids are identified by matching experimental data against curated databases (e.g., LIPID MAPS) using multiple lines of evidence [1]:
- Accurate Mass: Matching m/z value within a specified tolerance (e.g., < 5 ppm).
- Retention Time: Comparison with authentic standards if available.
- MS/MS Fragmentation Pattern: Characteristic fragment ions and neutral losses confirm lipid class and often fatty acyl constituents.
- Collision Cross-Section (CCS): When using IM-MS, the experimental CCS value is matched against a database for additional identification confidence [49].
Statistical Analysis and Biomarker Discovery
Following identification and quantification, statistical modeling is used to pinpoint significant differences between patient groups (e.g., DH vs. DM-only).
- Univariate Analysis: Student's t-test and fold-change analysis to find individual lipids that are significantly altered [19].
- Multivariate Analysis:
- Principal Component Analysis (PCA): An unsupervised method to visualize overall group separation and identify outliers.
- Orthogonal Projections to Latent Structures-Discriminant Analysis (OPLS-DA): A supervised method that maximizes the separation between predefined groups and identifies the lipid species most responsible for this discrimination [19].
Lipid species that pass these statistical thresholds are considered biomarker candidates. Their biological relevance is further assessed through pathway analysis using tools like MetaboAnalyst, which maps dysregulated lipids onto known metabolic pathways (e.g., glycerophospholipid metabolism) to interpret the functional impact [19].
A Case Study: Lipidomics in Diabetes with Hyperuricemia
Recent research exemplifies the application of this workflow. An untargeted lipidomic study comparing patients with Diabetes and Hyperuricemia (DH) against those with Diabetes alone (DM) and healthy controls (NGT) revealed a distinct lipidomic signature associated with the comorbid condition [19].
The study identified 1,361 lipid molecules across 30 subclasses. Multivariate analysis showed clear separation between the DH, DM, and NGT groups. A panel of 31 significantly altered lipid metabolites was pinpointed in the DH group compared to NGT. The most prominent changes included the upregulation of 13 triglycerides (TGs), 10 phosphatidylethanolamines (PEs), and 7 phosphatidylcholines (PCs) [19].
Table 2: Select Dysregulated Lipid Species in Diabetes with Hyperuricemia (DH) vs. Controls [19]
| Lipid Class | Example Lipid Species | Trend in DH | Biological Relevance |
|---|---|---|---|
| Triglycerides (TG) | TG (16:0/18:1/18:2) | ↑ Upregulated | Energy storage; associated with insulin resistance and cardiometabolic risk. |
| Phosphatidylethanolamines (PE) | PE (18:0/20:4) | ↑ Upregulated | Key membrane phospholipids; precursors for signaling molecules; altered membrane fluidity. |
| Phosphatidylcholines (PC) | PC (36:1) | ↑ Upregulated | Abundant membrane phospholipids; involved in lipoprotein metabolism and signaling. |
| Phosphatidylinositols (PI) | Not specified | ↓ Downregulated | Minor membrane phospholipids with key roles in cell signaling (e.g., insulin signaling cascades). |
Pathway analysis established that glycerophospholipid metabolism and glycerolipid metabolism were the most significantly perturbed pathways in DH patients, highlighting the core metabolic processes disrupted in this high-risk population [19].
Building a Clinically Actionable Stratification Tool
The ultimate goal is to convert a research-based lipid signature into a clinically usable stratification tool.
From Panel to Prognostic Score
A single biomarker is often insufficient for robust stratification. Therefore, the identified lipid species are integrated into a multivariate biomarker panel. This panel can be leveraged to create a simplified prognostic score for clinical use.
For instance, a study developed a Renal–Metabolic Risk Score (RMRS) integrating renal (urea, eGFR) and lipid (TG/HDL ratio) parameters to identify uncontrolled T2DM patients at risk for combined hyperuricemia and dyslipidemia [17]. The score, derived from logistic regression coefficients and normalized to a 0–100 scale, showed good discrimination (AUC of 0.78). Patients in the highest RMRS quartile had a co-occurrence prevalence of 96.1%, compared to 64.5% in the lowest quartile [17]. This demonstrates the power of combining lipid markers with routine clinical chemistry for effective risk stratification.
Validation and Implementation
Before clinical adoption, any biomarker panel must undergo rigorous validation:
- Analytical Validation: Assessing the assay's precision, accuracy, sensitivity, and reproducibility.
- Biological Validation: Confirming the panel's performance in independent, larger, and more diverse cohorts.
- Clinical Validation: Demonstrating that the panel provides meaningful information that improves patient outcomes and is cost-effective.
The transition of lipidomic biomarkers into clinical practice is still in its early stages, hindered by challenges in standardization and the need for large-scale multi-center validation studies [1].
The Scientist's Toolkit: Essential Research Reagents & Materials
Table 3: Key Reagents and Materials for Lipidomics Workflows
| Item | Function / Application | Example / Note |
|---|---|---|
| Methyl-tert-butyl ether (MTBE) | Lipid extraction solvent in liquid-liquid separation from plasma/serum. | Preferred over chloroform for higher recovery and safety [19] [46]. |
| Ammonium Formate/Acetate | Mobile phase additive for LC-MS; improves ionization efficiency and adduct formation. | Used in water/acetonitrile and acetonitrile/isopropanol mobile phases [19]. |
| Synthetic Lipid Standards | Internal standards for absolute quantification; quality control for retention time and MS response. | Added at the beginning of extraction to correct for losses [46]. |
| C18 UHPLC Column | Reversed-phase chromatographic separation of lipid molecules by hydrophobicity. | e.g., Waters ACQUITY UPLC BEH C18 (1.7 μm particle size) [19]. |
| High-Resolution Mass Spectrometer | Accurate mass measurement and MS/MS fragmentation for lipid identification. | Orbitrap, FT-ICR, or Q-TOF instruments [48] [49]. |
| Rhodamine B isothiocyanate | Rhodamine B isothiocyanate, MF:C29H30ClN3O3S, MW:536.1 g/mol | Chemical Reagent |
| (D-Leu6,pro-nhet9)-lhrh (4-9) | (D-Leu6,Pro-NHEt9)-LHRH (4-9)|Research Peptide | (D-Leu6,Pro-NHEt9)-LHRH (4-9) is a polypeptide for research use. Explore its applications in biochemical assay development. For Research Use Only. Not for human consumption. |
The path from spectral data to biomarker panels for patient stratification is a complex but highly promising endeavor. Integrated approaches that combine advanced UHPLC-IM-MS/MS platforms, robust bioinformatics, and clinical insight are unveiling specific lipidomic signatures associated with high-risk conditions like diabetes with hyperuricemia. As standardization improves and validation in large cohorts progresses, lipid biomarker panels are poised to become indispensable tools for enabling precision medicine, guiding targeted therapies, and improving clinical outcomes for patients with complex metabolic diseases.
Navigating Analytical Challenges and Enhancing Biomarker Reproducibility
Lipidomics, the large-scale study of lipid pathways and networks, holds immense promise for discovering novel biomarkers in complex metabolic conditions like diabetes mellitus (DM) and hyperuricemia (HUA). However, the translational potential of lipidomic biomarkers is constrained by two fundamental challenges: the immense structural diversity of lipids and the significant variability across analytical platforms. This technical guide delineates the sources and impacts of these bottlenecks, supported by quantitative data, and presents standardized experimental protocols and emerging computational solutions to enhance reproducibility, accuracy, and clinical applicability in lipidomics research.
The Dual Challenge in Lipidomics Biomarker Discovery
The lipidome encompasses thousands of chemically distinct lipids, which are systematically classified into eight major categories—fatty acyls (FA), glycerolipids (GL), glycerophospholipids (GP), sphingolipids (SP), sterol lipids (ST), prenol lipids (PR), saccharolipids (SL), and polyketides (PK) [1] [50]. This structural complexity is a primary source of analytical difficulty. Simultaneously, methodological variability from sample preparation, instrumentation, and data processing introduces substantial noise, attenuating the statistical power to detect genuine associations in epidemiologic studies [51]. In the context of diabetes and hyperuricemia research, where specific lipid signatures show diagnostic potential, overcoming these bottlenecks is paramount for progressing from discovery to clinical validation.
Quantifying the Impact of Lipid Diversity and Analytical Variability
The Scale of Lipid Structural Diversity
The LIPID MAPS database catalogs the extensive structural variety of lipids, providing a framework for understanding the analytical challenge [52].
Table 1: Lipid Diversity as Cataloged in the LIPID MAPS Structure Database
| Lipid Category | Curated Structures | Computationally-Generated Structures | Total Structures |
|---|---|---|---|
| Fatty Acyls (FA) | 9,540 | 1,898 | 11,438 |
| Glycerolipids (GL) | 393 | 7,378 | 7,771 |
| Glycerophospholipids (GP) | 1,895 | 8,297 | 10,192 |
| Sphingolipids (SP) | 1,825 | 3,168 | 4,993 |
| Sterol Lipids (ST) | 4,026 | 0 | 4,026 |
| Prenol Lipids (PR) | 2,557 | 0 | 2,557 |
| Saccharolipids (SL) | 57 | 1,294 | 1,351 |
| Polyketides (PK) | 7,183 | 0 | 7,183 |
| TOTAL | 27,476 | 22,035 | 49,511 |
A large-scale analysis of serum samples from the Prostate, Lung, Colorectal, and Ovarian Cancer Screening Trial (PLCO) quantified the components of variance for 918 lipid species [51]. The results demonstrate that for the majority of lipids, pre-analytical and analytical variability constitute a major portion of the total measured variance, which can obscure true biological signals.
Table 2: Variance Components for Representative Lipid Classes [51]
| Lipid Class | Between-Individual Variance (%) | Within-Individual Variance (%) | Technical Variance (%) |
|---|---|---|---|
| Triacylglycerols (TAG) | 25 | 60 | 15 |
| Diacylglycerols (DAG) | 28 | 58 | 14 |
| Phosphatidylcholines (PC) | 32 | 55 | 13 |
| Phosphatidylethanolamines (PE) | 30 | 57 | 13 |
| Ceramides (CER) | 35 | 52 | 13 |
| Sphingomyelins (SM) | 38 | 50 | 12 |
This variability has a direct impact on study design. The same research estimated that a case-control study with 1,000 total participants would have only 57% power to detect a relative risk of 3.0 (comparing upper and lower quartiles) after correcting for multiple comparisons, underscoring the necessity for large sample sizes and rigorous standardization [51].
Experimental Protocols for Robust Lipidomic Analysis
The following protocol is synthesized from studies investigating lipidomic profiles in diabetes and hyperuricemia [19] [53].
Sample Collection and Pre-processing
- Sample Type: Fasting plasma or serum is recommended to minimize dietary confounding.
- Collection: Collect blood into EDTA tubes. Centrifuge at 3,000 rpm for 10-15 minutes at 4°C to separate plasma/serum.
- Aliquoting and Storage: Immediately aliquot the supernatant into cryovials and store at -80°C. Avoid multiple freeze-thaw cycles.
Lipid Extraction
The methyl tert-butyl ether (MTBE) method is widely used for its high coverage and reproducibility [19] [53].
- Thaw Samples: Thaw plasma samples on ice.
- Protein Precipitation: Add 100 μL of plasma to a 1.5 mL tube, followed by 200 μL of ice-cold water and 240 μL of pre-cooled methanol. Vortex thoroughly.
- Lipid Extraction: Add 800 μL of MTBE. Sonicate in a low-temperature water bath for 20 minutes.
- Phase Separation: Let the mixture stand at room temperature for 30 minutes. Centrifuge at 14,000 g at 10°C for 15 minutes.
- Collection: The upper organic phase (containing lipids) is collected and dried under a gentle stream of nitrogen gas.
- Reconstitution: Reconstitute the dried lipid extract in a suitable solvent (e.g., 100 μL isopropanol) for MS analysis.
Instrumental Analysis: UHPLC-MS/MS
- Chromatography: Utilize a UHPLC system with a reversed-phase C18 column (e.g., Waters ACQUITY UPLC BEH C18, 2.1 × 100 mm, 1.7 μm).
- Mobile Phase: Use a binary solvent system. Mobile phase A: 10 mM ammonium formate in acetonitrile/water; Mobile phase B: 10 mM ammonium formate in acetonitrile/isopropanol. Employ a linear gradient for separation.
- Mass Spectrometry: Operate a high-resolution tandem mass spectrometer (e.g., Q-TOF or Orbitrap) in both positive and negative electrospray ionization (ESI) modes to cover a broad range of lipid classes.
- Quality Control: Inject pooled quality control (QC) samples, created by combining small aliquots of all study samples, at regular intervals throughout the analytical sequence to monitor instrument stability.
Data Processing and Lipid Annotation
- Peak Picking and Alignment: Use software like MS-DIAL or LipidSearch for peak detection, alignment, and deconvolution.
- Lipid Identification: Annotate lipids by matching MS/MS spectra and retention times to authentic standards or curated databases like LIPID MAPS. Advanced tools like LipidIN can be employed; it uses a 168.5-million lipid fragmentation hierarchical library and AI models to improve annotation accuracy and coverage, including for isomers [54].
- Quantification: Perform relative quantification based on peak area or absolute quantification using internal standards.
Key Research Reagent Solutions for Lipidomics
A successful lipidomics workflow relies on specific, high-quality reagents and tools to ensure accuracy and reproducibility.
Table 3: Essential Research Reagents and Materials for Lipidomics
| Reagent/Material | Function/Application | Example in Protocol |
|---|---|---|
| Methyl tert-butyl ether (MTBE) | Organic solvent for liquid-liquid lipid extraction; provides high lipid recovery and clean samples. | Used in the phase separation step to isolate lipids from the aqueous phase [19]. |
| Deuterated Internal Standards | Lipid species with stable isotope labels; enable correction for extraction efficiency and ionization variation, improving quantification. | Added to the sample prior to extraction for absolute quantification [51]. |
| C18 UHPLC Column | Reversed-phase chromatography column; separates lipids based on hydrophobicity (chain length, unsaturation). | Waters ACQUITY UPLC BEH C18 column for separating lipid species prior to MS injection [19]. |
| Ammonium Formate | Mobile phase additive; promotes efficient and stable ionization of lipids in the mass spectrometer. | Used in the acetonitrile/isopropanol mobile phase for UHPLC-MS/MS analysis [19]. |
| LIPID MAPS Database | Comprehensive, curated lipid database; provides structural information and classification for lipid annotation. | Used as a reference library for identifying lipids based on mass and fragmentation pattern [1] [55]. |
| LipidIN Software | Advanced AI-driven annotation tool; uses a massive fragmentation library and retention time rules to improve identification accuracy and coverage. | Employed for high-confidence annotation of lipids, including isomers, from complex MS/MS data [54]. |
Integrated Solutions and Future Directions
Addressing the bottlenecks requires a multi-faceted approach combining technological innovation, standardization, and data integration.
- Advanced Computational Tools: Artificial intelligence is revolutionizing lipid annotation. Frameworks like LipidIN demonstrate how AI can integrate MS/MS data with relative retention time rules to significantly reduce false-positive annotations and predict unannotated lipids, achieving an accuracy of up to 97.4% in predicting lipid subclasses [1] [54].
- Standardization and Workflow Harmonization: The consistent use of internal standards, standardized protocols (like the MTBE extraction), and pooled QC samples across studies is critical to minimize technical variance. Initiatives to establish harmonized workflows will improve inter-laboratory reproducibility [1] [51].
- Multi-Omics Integration: Lipidomic data alone may be insufficient. Integrating lipidomics with genomic, proteomic, and clinical data through systems biology approaches provides a more comprehensive understanding of the pathophysiology of diabetes and hyperuricemia, enhancing the predictive power of discovered biomarkers [1] [50].
The path to discovering and validating lipidomic biomarkers for diabetes and hyperuricemia is fraught with challenges stemming from lipid structural diversity and analytical variability. However, by adopting rigorous, standardized experimental protocols, leveraging quantitative data on variance to inform study design, and harnessing the power of next-generation AI-driven bioinformatics tools, these critical bottlenecks can be systematically addressed. A concerted effort towards methodological harmonization and data integration is essential to unlock the full potential of lipidomics in precision medicine and deliver reliable biomarkers to the clinic.
Implementing Robust Quality Control (QC) and Standardization Protocols
In the pursuit of reliable biomarkers for complex metabolic syndromes such as diabetes and hyperuricemia, lipidomics has emerged as a pivotal discipline. The path from biomarker discovery to clinical application is fraught with challenges, primarily due to the immense structural diversity of lipids and their broad concentration range in biological systems [52]. Robust quality control (QC) and standardization protocols are not merely best practices but are fundamental to generating analytically sound, reproducible, and biologically meaningful data. Without stringent QC, the risk of false biomarker identification is high, which can misdirect research and hinder the development of diagnostic and therapeutic strategies. This guide outlines a comprehensive QC framework tailored for lipidomics studies investigating the interplay between diabetes and hyperuricemia, providing researchers with the tools to ensure data integrity from sample collection to data reporting.
Analytical QC Framework: Strategies and Materials
A multi-layered QC strategy is essential to monitor and ensure the stability and performance of the lipidomics platform throughout a study. This involves the use of various quality control materials and standardized procedures.
Key QC Materials and Reagents
The table below details essential reagents and materials required for implementing a robust lipidomics QC protocol.
Table 1: Research Reagent Solutions for Lipidomics QC
| Reagent/Material | Function in QC and Standardization |
|---|---|
| Internal Standard Mix (e.g., from SCIEX Lipidyzer Kit) | Corrects for variability in sample preparation, lipid extraction, and MS ionization efficiency; enables absolute quantification [56] [57]. |
| Commercial Plasma (e.g., for Surrogate QC - sQC) | Acts as a consistent, homogeneous matrix for preparing long-term reference (LTR) samples to monitor inter-batch analytical variation over time [58]. |
| Pooled Quality Control (PQC) Sample | A pool of all study samples; injected at regular intervals throughout the analytical batch to monitor instrument stability and perform data correction (e.g., signal drift correction) [58]. |
| LC-MS Grade Solvents (Acetonitrile, Methanol, Isopropanol) | Minimize chemical background noise and ion suppression, ensuring high sensitivity and reproducibility in lipid extraction and chromatography [56]. |
| Authentic Chemical Standards | Used for verification of lipid identifications, determination of retention times, and construction of calibration curves for precise quantification [59] [57]. |
Implementing System Suitability and Batch Monitoring
Prior to sample analysis, system suitability tests should be performed using a reference standard mixture to confirm that instrument sensitivity, resolution, and retention time stability meet pre-defined acceptance criteria. During the batch run, the PQC and sQC samples are critical. The PQC helps assess the stability of the analytical system, while the sQC, being independent of the study samples, is used to evaluate the overall method performance and correct for technical variation across multiple batches [58]. Monitoring parameters such as the retention time, peak area, and peak width of key lipids in the PQC samples allows for the detection of instrument drift.
Standardization of Pre-Analytical and Analytical Workflows
The reliability of lipidomics data is highly dependent on standardized procedures before the samples even reach the mass spectrometer.
Sample Collection and Preparation
Standardized protocols for biofluid collection (e.g., plasma, serum) and tissue sampling are the first critical step. For instance, using consistent anticoagulants, processing times, and storage conditions (preferably at -80°C) is vital to prevent artifactual changes in the lipidome [57]. The lipid extraction method must be robust and reproducible. A common approach is the isopropanol method, which involves precipitating proteins and extracting lipids with cold isopropanol, followed by centrifugation and analysis of the supernatant [56]. Including internal standards at the very beginning of the extraction process is mandatory to account for losses during preparation.
Liquid Chromatography-Mass Spectrometry (LC-MS) Analysis
For targeted lipidomics, Ultra-Performance Liquid Chromatography tandem Mass Spectrometry (UPLC-MS/MS) operated in Multiple Reaction Monitoring (MRM) mode is the gold standard due to its high sensitivity, specificity, and reproducibility [52] [57]. The chromatographic separation must be optimized to resolve isobaric and isomeric lipids. The use of reversed-phase chromatography is common, and lipids follow a predictable retention time pattern based on their equivalent carbon number (ECN), which serves as an additional QC check for correct annotation [59]. Mass spectrometry parameters, including collision energies and source temperatures, should be optimized for each lipid class and kept consistent throughout the study.
Data Validation and Lipid Annotation Guidelines
Post-acquisition, the focus shifts to the rigorous validation of lipid identifications and quantitative data. Adherence to community-defined guidelines is critical to minimize false-positive annotations [59].
Tiered System for Lipid Identification
A confident lipid identification requires multiple lines of evidence. The following table summarizes the key criteria.
Table 2: Lipid Identification Confidence Levels
| Confidence Level | Required Evidence | Example |
|---|---|---|
| Level 1 (Highest) | Matching retention time and fragmentation spectrum to an authentic chemical standard. | Confidently identifying a specific phosphatidylcholine (PC 16:0/18:1) using a purchased standard. |
| Level 2 | Characteristic MS/MS fragments indicating the lipid class and fatty acyl chains, plus correlation with expected chromatographic retention behavior (e.g., ECN model). | Identifying PC 16:0/18:1 based on head group fragment (m/z 184.07), fatty acid fragments, and its elution in the correct RT window for its ECN [59]. |
| Level 3 (Lowest) | Accurate mass and MS/MS spectrum matched to a database, without full structural validation. Often reported as the total number of carbons and double bonds (e.g., PC 34:1). |
Application of the Equivalent Carbon Number (ECN) Model
The ECN model (ECN = CN - 2*DB, where CN is carbon number and DB is double bond count) predicts a linear relationship between retention time and ECN for a given lipid class in reversed-phase chromatography [59]. This is a powerful QC tool. Lipid species that deviate significantly from the predicted retention pattern for their class should be flagged for manual re-inspection, as their automated annotation is likely incorrect. This step is crucial for filtering out false positives before statistical analysis and biomarker candidate selection.
Case Study: QC in a Diabetes-Hyperuricemia Model
A recent study investigating non-alcoholic fatty pancreas disease (NAFPD) exacerbation by hyperlipidemia combined with hyperuricemia provides a relevant example of applying lipidomics QC in metabolic research [56].
Experimental Protocol
- Animal Model: Eighteen Sprague-Dawley rats were divided into three groups: control (CON), high-fat diet (PO), and high-fat diet with high yeast powder and potassium oxonate to induce hyperuricemia (PH). The study duration was 12 weeks [56].
- Sample Collection: Serum was collected at weeks 4, 8, and 12. At week 12, pancreatic tissues were harvested for histological analysis (HE staining) [56].
- Lipidomics Analysis: Serum lipids were extracted using a cold isopropanol method. Lipidomics profiling was performed using High-Performance Liquid Chromatography-Triple Quadrupole Mass Spectrometry (HPLC-QqQ-MS). Quality control (QC) samples were likely utilized to ensure instrument stability during the analysis, a standard practice in such designs [56].
Key Findings and QC-Verified Biomarkers
The study found that the hyperuricemic (PH) group developed more severe NAFPD, as indicated by higher pathological scores. Lipidomics analysis, conducted under controlled conditions, identified numerous potential lipid biomarkers. These included dysregulated sphingolipids, cholesterol esters, fatty acids, triacylglycerols, and several glycerophospholipids (e.g., phosphatidylcholines, lysophosphatidylcholine, phosphatidylethanolamine) [56]. The conclusion was that glycerophospholipid metabolism may be a key pathway in the exacerbation of pancreatic steatosis under conditions of combined hyperlipidemia and hyperuricemia, a finding with direct relevance to metabolic disease progression. This study underscores how rigorous experimental design and analytical control can uncover specific lipidomic signatures in complex disease models.
Strategies for Improving Inter-Laboratory Reproducibility and Data Validation
The translation of lipidomic discoveries into clinically applicable biomarkers for complex metabolic conditions like diabetes and hyperuricemia faces a substantial barrier: inter-laboratory reproducibility. Inconsistencies in sample preparation, analytical techniques, and data processing can generate variable results across different research centers, potentially obscuring valid biological signals and delaying clinical application. This challenge is particularly acute in diabetes and hyperuricemia research, where subtle lipidomic alterations may serve as early diagnostic indicators or therapeutic targets. For instance, specific ceramides have demonstrated association with cardiovascular risk in diabetic populations, while alterations in glycerophospholipids and triglycerides have been observed in patients with combined diabetes and hyperuricemia [60] [19] [61]. The reliability of these findings depends heavily on standardized, reproducible methodologies. This technical guide outlines evidence-based strategies to enhance reproducibility and validation specifically within lipidomic investigations of diabetes and hyperuricemia, providing researchers with practical frameworks for generating robust, translatable data.
Quantifying the Reproducibility Gap in Lipidomics
A critical first step in addressing reproducibility is understanding its magnitude and sources. Evidence indicates significant variability in lipid identification across different analytical platforms and laboratories, even when analyzing identical samples.
Table 1: Sources of Variability in Lipidomics Analysis
| Source of Variability | Impact on Reproducibility | Supporting Evidence |
|---|---|---|
| Software Platforms | Low identification agreement between platforms (as low as 14-36%) even with identical spectral data [62]. | |
| Sample Preparation | Differences in extraction efficiency (e.g., Folch vs. MTBE methods) affect recovery of polar vs. non-polar lipids [63] [19]. | |
| LC-MS Methodology | Gradient length, column chemistry, and mobile phases influence lipid separation and isomer resolution [63] [62]. | |
| Calibration Approaches | Use of external calibrants and shared reference materials dramatically reduces inter-lab variability (CVs <14%) [60]. | |
| Data Processing | Inconsistent peak alignment, noise filtering, and normalization algorithms introduce significant variation [62] [61]. |
Cross-platform comparisons vividly illustrate this challenge. When identical LC-MS spectra were processed through two popular lipidomics software platforms, MS DIAL and Lipostar, using default settings, the agreement on lipid identifications was merely 14.0%. Even when utilizing fragmentation data (MS2 spectra), concordance improved only to 36.1% [62]. This highlights that software-driven identification alone, without rigorous curation, is insufficient for reliable biomarker discovery.
Furthermore, inter-laboratory comparisons reveal the critical importance of standardized calibration. A community-based study quantifying ceramides in human plasma reference materials demonstrated that utilizing a common set of authentic synthetic standards and a detailed Standard Operating Procedure (SOP) enabled 34 participating laboratories to achieve inter-laboratory coefficients of variation (CVs) of less than 14% for absolute concentration values of four clinically relevant ceramide species [60]. This represents a significant improvement over typical untargeted lipidomics workflows and underscores the value of harmonized protocols and calibrated quantitation.
Standardized Experimental Protocols for Enhanced Reproducibility
Sample Preparation and Lipid Extraction
Standardizing the pre-analytical phase is foundational to reproducible lipidomics. The modified MTBE (methyl tert-butyl ether)-based extraction protocol has demonstrated robust performance for broad lipid coverage from plasma and serum [63] [19].
Detailed Protocol:
- Sample Aliquoting: Use a consistent sample volume (e.g., 100 μL of plasma or serum) [63] [19].
- Internal Standard Addition: Spike samples with a pre-defined mixture of deuterated lipid standards before extraction to monitor extraction efficiency and enable quantification. The Avanti EquiSPLASH LIPIDOMIX standard is commonly used [60].
- Protein Precipitation and Extraction:
- Add 750 μL of methanol to the sample, followed by 20 μL of 1M formic acid. Vortex for 10 seconds.
- Add 2.5 mL of MTBE and mix vigorously with a multi-pulse vortexer for 5 minutes.
- Add 625 μL of deionized water and mix for an additional 3 minutes.
- Centrifuge at 1,000 g for 5 minutes to achieve phase separation [63].
- Phase Collection: Collect the upper organic phase (containing the lipids) into a new glass tube.
- Solvent Evaporation and Reconstitution: Evaporate the organic solvent under a gentle stream of nitrogen. Reconstitute the dried lipid extract in a defined volume of an appropriate solvent mixture (e.g., isopropanol) compatible with the downstream LC-MS analysis [19].
Liquid Chromatography-Mass Spectrometry (LC-MS) Analysis
Chromatographic separation and MS detection parameters must be optimized and consistently applied.
LC Conditions for Broad Lipid Coverage:
- Column: Waters ACQUITY UPLC BEH C18 column (1.7 μm, 2.1 × 100 mm) or equivalent for reversed-phase separation [19].
- Mobile Phase: A) 10 mM ammonium formate in water:acetonitrile; B) 10 mM ammonium formate in acetonitrile:isopropanol [19].
- Gradient: Employ a binary gradient tailored for comprehensive lipid elution. Example: 0–0.5 min (40% B), 0.5–5 min (ramp to 99% B), 5–10 min (hold at 99% B), 10–12.5 min (ramp to 40% B), 12.5–15 min (re-equilibration at 40% B) [63] [62].
- Flow Rate: 0.3-0.4 mL/min for analytical-scale columns [63].
MS Acquisition Parameters:
- Ionization: Electrospray Ionization (ESI) in both positive and negative ion modes to capture the full spectrum of lipid classes.
- Mass Analyzer: High-resolution mass spectrometers (e.g., Q-TOF) are preferred for untargeted analysis due to accurate mass measurement [63].
- Data Acquisition: Use data-dependent acquisition (DDA) to obtain MS2 spectra for lipid identification. In targeted approaches, use multiple reaction monitoring (MRM) on triple quadrupole instruments for sensitive quantification [60].
Quality Control and Calibration
Integrating quality control (QC) measures throughout the analytical run is non-negotiable.
- Pooled QC Samples: Create a pooled sample from all study samples and inject it at regular intervals (e.g., every 5-10 injections) to monitor instrument stability and perform post-acquisition data correction [60].
- Use of Reference Materials: Incorporate commercially available human plasma reference materials, such as NIST SRM 1950, to benchmark performance and correct for systematic biases across laboratories [60].
- Calibration with Authentic Standards: For quantification, use calibration curves generated with authentic, non-deuterated lipid standards. The community ceramide study demonstrated that using shared, custom-tailored calibrant materials is a key factor in achieving concordant results [60].
Data Processing and Bioinformatics Workflows
The post-analytical phase requires stringent protocols to minimize variability introduced by software processing and annotation.
Table 2: Essential Steps for Reproducible Lipidomics Data Processing
| Processing Step | Recommendation | Rationale |
|---|---|---|
| Peak Picking & Alignment | Use consistent parameters for peak width, signal-to-noise ratio, and retention time alignment across all samples in a batch. | Minimizes technical variation and ensures comparable feature detection. |
| Lipid Identification | MS1: Match accurate mass (typically < 10 ppm tolerance) against databases (e.g., LipidMAPS). MS2: Require MS/MS spectral matching for confident annotation. Do not rely on accurate mass alone [62] [61]. | Reduces false positive annotations. MS DIAL and Lipostar show low consensus, necessitating manual curation. |
| Manual Curation | Visually inspect MS/MS spectra for key fragment ions and headgroup-specific fragments. Be aware of isobaric and isomeric lipids that may co-elute [62]. | Essential for verifying software-based identifications and improving cross-platform consistency. |
| Quantification & Normalization | Use internal standard peak areas for normalization (e.g., same lipid class IS). For absolute quantification, use calibration curves from authentic standards, not single-point calibration [60]. | Corrects for injection variability and matrix effects, enabling accurate concentration reporting. |
| Outlier Detection | Implement data-driven quality control, such as Support Vector Machine (SVM) regression, to flag potential false positive identifications based on retention time behavior and other features [62]. | Provides an additional layer of validation to catch anomalies missed by automated processing. |
A Toolkit for Robust Lipidomics Research
Table 3: Research Reagent Solutions for Diabetes/Hyperuricemia Lipidomics
| Reagent / Material | Function | Application in Diabetes/Hyperuricemia Research |
|---|---|---|
| NIST SRM 1950 Plasma | Standard Reference Material for inter-laboratory comparison and quality control. | Allows labs to benchmark measurements of diabetic/hyperuricemic biomarkers against a common, well-characterized sample [60]. |
| Deuterated Lipid Standards | Internal standards for quantification and monitoring of extraction efficiency. | Essential for accurate measurement of lipid classes dysregulated in disease, such as ceramides, diacylglycerols, and phospholipids [63] [60]. |
| Authentic Synthetic Standards | Non-deuterated purified lipids for constructing calibration curves for absolute quantification. | Critical for translating relative changes into absolute concentrations for clinical assay development [60]. |
| MTBE Extraction Solvent | Lipid extraction solvent for high recovery of polar and non-polar lipids. | Used in protocols to ensure comprehensive lipid coverage from patient plasma/serum samples [63] [19]. |
Application to Diabetes and Hyperuricemia Biomarker Discovery
The strategies outlined above are critical for untangling the complex lipidomic signatures associated with diabetes and hyperuricemia. Research has already identified promising leads that require robust validation. For example, an untargeted lipidomic analysis of patients with diabetes mellitus combined with hyperuricemia (DH) identified 1,361 lipid molecules. Compared to healthy controls, DH patients showed significant upregulation of 13 triglycerides (TGs), 10 phosphatidylethanolamines (PEs), and 7 phosphatidylcholines (PCs), with these metabolites enriched in glycerophospholipid and glycerolipid metabolism pathways [19]. Similarly, studies on athletes with hyperuricemia responding to a dietary intervention revealed altered levels of plasmalogen phosphatidylcholines and acylcarnitines, suggesting improvements in mitochondrial metabolism and oxidative stress [64]. Furthermore, specific ceramides (e.g., Cer d18:1/16:0, Cer d18:1/18:0, Cer d18:1/24:0, Cer d18:1/24:1) are being validated as cardiovascular risk biomarkers in diabetic and other populations [60]. The reliability of these findings and their progression toward clinical utility hinges on the widespread adoption of standardized, reproducible methods across the lipidomics community.
Visualizing the Integrated Workflow
The following diagram synthesizes the key stages and decision points of a reproducible lipidomics workflow into a single, integrated pipeline.
Integrated Lipidomics Workflow
Achieving high inter-laboratory reproducibility in lipidomics is a multifaceted challenge, but it is surmountable through a concerted effort to standardize methodologies, employ calibrated quantification, and implement rigorous data validation. The path forward for the discovery and validation of lipid biomarkers in diabetes and hyperuricemia research depends on the community's adoption of shared reference materials, detailed SOPs, and a commitment to manual curation and transparent reporting. By integrating the strategies and protocols outlined in this guide—from standardized MTBE extraction and harmonized LC-MS parameters to the use of authentic standards and cross-platform data curation—researchers can significantly enhance the reliability and translational potential of their lipidomic findings, ultimately accelerating the journey from biomarker discovery to clinical application.
Integrating Multi-Omics Data for Enhanced Specificity and Predictive Power
The complexity of metabolic diseases such as diabetes and hyperuricemia arises from intricate interactions across multiple biological layers, from genetic predispositions to downstream metabolic consequences. Single-omics approaches, while valuable, often fail to capture the complete pathological picture, as they investigate molecular layers in isolation [65]. Multi-omics integration represents a paradigm shift in biomedical research, enabling a systems biology perspective that can uncover the complex networks of interactions between genes, proteins, and metabolites that drive disease progression [66]. This approach is particularly crucial for lipidomics biomarker discovery in diabetes and hyperuricemia, where dysregulated lipid metabolism serves as both a driver and consequence of pathological processes [1].
The fundamental challenge in metabolic disease research lies in distinguishing causal molecular events from correlative associations. As noted in recent literature, "While transcriptomics reveal which genes are being transcribed, translatomics pinpoints which of those transcripts are actually translated into proteins, providing a crucial intermediate layer of information" [66]. This distinction is especially relevant for lipid metabolism studies, where transcriptional regulation of lipid-synthesizing enzymes may not directly correlate with actual lipid species concentrations in circulation or tissues. Multi-omics integration addresses this limitation by providing a layered, cross-dimensional perspective that enables researchers to distinguish causal mutations from inconsequential ones and identify functionally relevant biomarkers and drug targets [66].
For diabetes and hyperuricemia research, lipidomics occupies a particularly strategic position in the multi-omics spectrum. Lipids represent both structural components and signaling molecules that regulate insulin sensitivity, inflammation, and uric acid metabolism [1]. The integration of lipidomics with genomics, transcriptomics, and proteomics creates a powerful framework for identifying robust biomarkers with enhanced specificity and predictive power for early detection, stratification, and therapeutic monitoring of these metabolic disorders.
Network-Based Methodologies for Multi-Omics Integration
Conceptual Framework and Classification
Biological networks provide an organizational framework that mirrors the functional architecture of living systems. The premise of network-based multi-omics integration is that "biomolecules do not perform their functions alone, rather, they interact with one another to form biological networks" [65]. This approach abstracts the complex interactions among various omics layers into computable network models where nodes represent biological molecules and edges represent their functional relationships [65]. This conceptual alignment with biological reality makes network-based methods particularly powerful for identifying clinically actionable biomarkers.
Network-based multi-omics integration methods can be systematically categorized into four primary types based on their algorithmic principles: network propagation/diffusion, similarity-based approaches, graph neural networks, and network inference models [65]. Each category offers distinct advantages for specific aspects of biomarker discovery in metabolic diseases. The table below summarizes the key characteristics, applications, and limitations of each methodological category.
Table 1: Network-Based Multi-Omics Integration Methods for Biomarker Discovery
| Method Category | Algorithmic Principle | Diabetes/Hyperuricemia Applications | Key Advantages | Major Limitations |
|---|---|---|---|---|
| Network Propagation/Diffusion | Spreads information across network topology based on connectivity patterns | Identifying key lipid metabolic pathways dysregulated in insulin resistance | Captures network-wide effects of localized perturbations; Robust to noise | Requires high-quality network construction; May overlook specific molecular interactions |
| Similarity-Based Approaches | Integrates omics data based on similarity measures between molecular entities | Discovering patient subtypes based on combined genetic and lipidomic profiles | Computationally efficient; Intuitive interpretation | May miss non-linear relationships; Dependent on similarity metric choice |
| Graph Neural Networks | Applies deep learning to graph-structured data using message-passing algorithms | Predicting disease progression from multi-omics data | Handles complex, non-linear relationships; High predictive accuracy | Requires large datasets; "Black box" interpretation challenges |
| Network Inference Models | Reconstructs biological networks from omics data using statistical dependencies | Inferring regulatory networks connecting genetic variants to lipid alterations | Discovers novel relationships; No prior network knowledge required | Computationally intensive; Potential for false positives |
Implementation Workflow
The implementation of network-based multi-omics integration follows a systematic workflow that transforms raw omics data into biologically interpretable networks. The following diagram illustrates this workflow, highlighting the key computational and analytical steps:
Diagram 1: Multi-Omics Network Integration Workflow
This workflow begins with comprehensive data preprocessing to address the significant technical challenges posed by multi-omics data heterogeneity. As highlighted in the literature, "multi-omics studies include data that differ in type, scale and source, with often thousands of variables and only few samples" [65]. Effective preprocessing must handle varying scales, resolutions, and noise levels across different omics layers through appropriate normalization, missing value imputation, and batch effect correction techniques.
The construction of biological networks utilizes established knowledge bases including protein-protein interaction networks, gene regulatory networks, metabolic pathways, and lipid metabolic networks [65]. For diabetes and hyperuricemia research, incorporation of lipid-specific networks is particularly valuable, mapping known relationships between lipid species, their enzymatic regulators, and transport proteins. These networks serve as scaffolds for integrating experimental multi-omics data, with the integration method selected based on the specific research question and data characteristics as outlined in Table 1.
Lipidomics-Focused Experimental Design and Protocols
Lipidomics Methodologies for Biomarker Discovery
Lipidomics methodologies have evolved significantly, offering distinct approaches with varying degrees of coverage, sensitivity, and quantitative accuracy. For diabetes and hyperuricemia research, the selection of appropriate lipidomics methods depends on the specific research questions, with each approach offering complementary strengths. The three primary methodological approaches—untargeted, targeted, and pseudotargeted lipidomics—provide researchers with a toolkit for comprehensive lipid biomarker discovery [1].
Table 2: Lipidomics Methodologies for Diabetes and Hyperuricemia Research
| Method Type | Analytical Approach | Key Applications in Metabolic Diseases | Coverage | Quantitative Accuracy | Throughput |
|---|---|---|---|---|---|
| Untargeted Lipidomics | Global profiling without predefined targets; Uses high-resolution MS | Discovery of novel lipid biomarkers; Unbiased hypothesis generation | High (1000+ lipids) | Semi-quantitative | Medium |
| Targeted Lipidomics | Focused analysis of predefined lipid panels; Uses triple quadrupole MS | Validation of candidate biomarkers; Clinical assay development | Low to Medium (10-100 lipids) | High (absolute quantification) | High |
| Pseudotargeted Lipidomics | Inclusion list-driven approach based on prior untargeted data | Bridging discovery and validation phases; Expanding targeted panels | Medium to High (100-500 lipids) | Good (relative quantification) | Medium |
The technical execution of lipidomics requires careful consideration of multiple analytical parameters. As noted in recent evaluations, "Different lipidome platforms often yield divergent outcomes from the same data during validation, primarily in terms of reproducibility" [1]. This challenge is particularly pronounced in diabetes research, where subtle lipid alterations may have significant pathophysiological implications. Standardization of pre-analytical conditions (fasting status, sample collection tubes, processing timelines) is essential for generating clinically meaningful data.
Integrated Multi-Omics Experimental Protocol
A robust protocol for multi-omics integration in lipidomics biomarker discovery involves coordinated sample processing, data generation, and integrative analysis. The following detailed protocol outlines the key steps for a comprehensive study design focused on diabetes and hyperuricemia:
Sample Preparation and Quality Control:
- Collect matched samples (plasma/serum, urine, tissue) under standardized conditions, noting fasting status and time of collection
- Implement quality control pools from representative sample aliquots
- Extract lipids using validated methods (e.g., methyl-tert-butyl ether liquid-liquid extraction)
- Preserve aliquots for other omics analyses (DNA, RNA, protein) under appropriate storage conditions
Multi-Omics Data Generation:
- Perform lipidomics analysis using liquid chromatography-mass spectrometry (LC-MS) with both untargeted and targeted approaches
- Conduct genomics analysis through whole-genome or exome sequencing, with special attention to lipid-associated genetic loci (e.g., APOE, GCKR, CETP)
- Implement transcriptomics analysis via RNA sequencing of relevant tissues (adipose, liver, muscle)
- Execute proteomics analysis using LC-MS/MS with focus on lipid transport and metabolic proteins
Data Integration and Analysis:
- Preprocess each omics dataset individually with appropriate normalization and quality control
- Construct a comprehensive lipid-metabolic network integrating known interactions from public databases
- Apply network-based integration methods (see Section 2.1) to identify multi-omics modules associated with disease phenotypes
- Validate candidate biomarkers in independent cohorts using targeted approaches
This protocol emphasizes the importance of "large-scale datasets [that] provide the statistical power necessary to identify meaningful patterns" [66], which is particularly crucial for detecting the subtle but biologically significant lipid alterations characteristic of early diabetes and hyperuricemia progression.
Data Visualization and Interpretation Framework
Multi-Omics Data Visualization Techniques
Effective visualization of multi-omics data is essential for interpreting complex relationships and communicating findings to diverse audiences. The integration of lipidomics with other omics layers generates high-dimensional data that requires specialized visualization techniques to reveal biologically meaningful patterns. The selection of appropriate visualization methods depends on the specific analytical goals and the nature of the relationships being explored.
For diabetes and hyperuricemia research, several visualization techniques are particularly valuable. Network diagrams visually represent the complex interactions between lipid species, their genetic regulators, and protein effectors, with node properties (size, color) and edge properties (thickness, style) encoding multi-omics information [67]. Correlation matrices use color scales to display association strengths between different types of molecular features across omics layers, revealing coordinated patterns of regulation [67]. Heat maps arranged by lipid classes or pathways can visualize multi-omics patterns across patient subgroups, facilitating the identification of distinct metabolic subtypes within heterogeneous disease populations [67].
Accessibility considerations are crucial when designing multi-omics visualizations. As emphasized in accessibility guidelines, "If color is the only way that you're conveying meaning, your information might be lost to someone who can't see color" [68]. For all visualization types, incorporating additional visual indicators such as shapes, patterns, or direct labels ensures that information is accessible to all readers. Furthermore, providing supplemental data tables allows analytical readers to access the exact numerical values underlying the visual representations [68].
Pathway Visualization in Metabolic Diseases
Pathway diagrams are particularly effective for representing the mechanistic insights gained through multi-omics integration. The following diagram illustrates a simplified lipid metabolic pathway relevant to diabetes and hyperuricemia, integrating genomic, proteomic, and lipidomic elements:
Diagram 2: Multi-Layer Lipid Metabolic Pathway in Diabetes and Hyperuricemia
This integrated pathway visualization illustrates how genetic variants influence enzyme expression and activity, which subsequently alter lipid species concentrations, ultimately driving clinical phenotypes. Such multi-layer representations are particularly valuable for identifying critical intervention points where therapeutic modulation might disrupt pathogenic cascades in diabetes and hyperuricemia.
Essential Research Toolkit for Multi-Omics Integration
Successful implementation of multi-omics integration requires a comprehensive toolkit of analytical resources, computational tools, and reagent solutions. The selection of appropriate tools significantly impacts the quality, reproducibility, and biological relevance of the research outcomes. The table below summarizes essential resources for lipidomics-focused multi-omics research in diabetes and hyperuricemia.
Table 3: Essential Research Toolkit for Multi-Omics Integration in Lipidomics Research
| Resource Category | Specific Tools/Reagents | Application in Workflow | Key Features | Considerations for Metabolic Disease Research |
|---|---|---|---|---|
| Lipidomics Platforms | LC-QTOF-MS, LC-Orbitrap-MS, Triple quadrupole MS | Lipid separation, identification, and quantification | High mass accuracy, structural characterization capability | Platform-specific bias in lipid detection; harmonization needed for multi-center studies |
| Bioinformatics Pipelines | MS-DIAL, Lipostar, LipidSearch | Lipid identification and quantification from raw MS data | Automated peak picking, lipid annotation using reference libraries | Low inter-platform concordance (14-36%) requires cross-validation [1] |
| Multi-Omics Databases | LIPID MAPS, HMDB, KEGG, Reactome | Biological context and reference networks | Curated lipid structures, pathways, and interactions | Integration of disease-specific lipid alterations in diabetes/hyperuricemia |
| Network Analysis Tools | Cytoscape, Gephi, custom R/Python scripts | Network visualization and topological analysis | Plugin architecture for multi-omics data integration | Capability to handle mixed data types (genetic variants to lipid concentrations) |
| AI/ML Frameworks | TensorFlow, PyTorch, Scikit-learn | Predictive modeling and pattern recognition | Deep learning for high-dimensional data integration | Handling of dataset shift between discovery and validation cohorts |
Quality Assurance and Validation Protocols
The transition from multi-omics discoveries to clinically applicable biomarkers requires rigorous quality assurance and validation protocols. As emphasized in recent literature, "Reproducibility and clinical validation issues are exacerbated by biological variability, lipid structural diversity, inconsistent sample processing, and a lack of defined procedures" [1]. Several key strategies enhance the reliability and translational potential of multi-omics findings:
Technical Validation:
- Implement standard reference materials for lipid quantification across analytical batches
- Perform replicate analyses to assess technical variability
- Utilize internal standards for each lipid class to correct for ionization efficiency differences
- Cross-validate findings across multiple analytical platforms when possible
Biological Validation:
- Confirm candidate biomarkers in independent cohorts with appropriate sample sizes
- Assess longitudinal stability of lipid biomarkers in progressive diabetes and hyperuricemia
- Evaluate specificity by testing in related metabolic disorders (e.g., NAFLD, cardiovascular disease)
- Validate mechanistic insights through experimental models (cell culture, animal models)
Clinical Validation:
- Establish standardized operating procedures for pre-analytical sample handling
- Define performance characteristics (sensitivity, specificity, predictive values) in clinically relevant populations
- Assess additive value beyond established clinical parameters through multivariate models
- Evaluate cost-effectiveness and feasibility for implementation in clinical settings
Artificial intelligence approaches are increasingly valuable for addressing validation challenges. As noted in recent research, "AI models inspired by biology may identify novel molecular targets, biomarkers, pharmaceutical agents, and personalized medicines for presently unmet medical needs" [69]. For diabetes and hyperuricemia, AI-driven validation can prioritize the most promising biomarker candidates from the high-dimensional multi-omics space, accelerating the translation of discoveries to clinical applications.
The integration of multi-omics data represents a transformative approach for enhancing the specificity and predictive power of lipidomics biomarker discovery in diabetes and hyperuricemia research. By contextualizing lipid alterations within their genetic, transcriptional, and proteomic frameworks, researchers can distinguish driver molecular events from secondary consequences, identifying biomarkers with stronger causal links to disease pathogenesis. The network-based methodologies and experimental protocols outlined in this technical guide provide a systematic framework for implementing multi-omics integration in metabolic disease research.
Future advances in multi-omics integration will likely focus on several key areas. Spatially resolved omics technologies will enable the mapping of lipid distributions within tissue microenvironments, revealing compartment-specific metabolic alterations in diabetes and hyperuricemia [66]. Artificial intelligence approaches will evolve from pattern recognition to causal inference, enabling the identification of master regulatory nodes that coordinate multi-omics responses to metabolic challenges [69]. Finally, the development of standardized frameworks for multi-omics data sharing and annotation will facilitate the large-scale collaborations necessary to capture the full spectrum of metabolic heterogeneity in human populations [65]. Through continued methodological refinement and biological validation, multi-omics integration promises to deliver clinically actionable biomarkers that enable early detection, precise stratification, and targeted interventions for diabetes, hyperuricemia, and related metabolic disorders.
Translating Discoveries: Clinical Validation, Dietary Interventions, and Comparative Profiles
The transition of lipidomic biomarkers from discovery to clinical application represents a critical pathway in advancing precision medicine for complex metabolic disorders. This whitepaper examines the comprehensive validation framework required to establish robust biomarker-disease associations in diabetes and hyperuricemia research. By integrating evidence from recent lipidomic studies, we detail methodological standards for analytical validation, clinical qualification, and translational implementation in large, diverse cohorts. The content specifically addresses the unique challenges in lipidomics, including biological variability, platform reproducibility, and pathway analysis, while providing practical experimental protocols and reagent solutions. Within the broader thesis of lipidomic biomarker discovery for diabetes-hyperuricemia comorbidity, this guide establishes a rigorous roadmap for researchers and drug development professionals to navigate the multi-stage validation process from initial discovery to clinical adoption.
The discovery of lipidomic biomarkers for diabetes and hyperuricemia has accelerated dramatically with advancements in mass spectrometry and multi-omics technologies, yet the translation of these discoveries to clinical practice remains limited. Robust biomarker-disease associations require demonstration of reliability across diverse populations and analytical platforms, moving beyond initial discovery to clinical validation [1]. The co-occurrence of diabetes and hyperuricemia presents a particularly compelling use case, with studies demonstrating a 81.6% prevalence of combined dyslipidemia and hyperuricemia in uncontrolled type 2 diabetes populations, amplifying renal and cardiovascular risk [17]. This complex metabolic interplay creates both challenges and opportunities for biomarker validation.
Lipidomics, defined as the comprehensive analysis of lipid molecular species and their biological functions, offers unique insights into the shared pathophysiological mechanisms of diabetes and hyperuricemia [1]. The molecular diversity of lipids—encompassing fatty acyls, glycerolipids, glycerophospholipids, and sphingolipids—creates both a rich source of potential biomarkers and significant validation challenges due to structural complexity and analytical variability [1]. Recent research has identified specific lipid classes dysregulated in diabetes-hyperuricemia comorbidity, including triglycerides, phosphatidylethanolamines, and phosphatidylcholines, which are involved in key metabolic pathways such as glycerophospholipid and glycerolipid metabolism [19]. However, without rigorous validation in large cohorts, these findings remain research observations rather than clinical tools.
The validation bottleneck in biomarker development is substantial, with studies indicating that only 0-2 new protein biomarkers achieve FDA approval per year across all diseases, creating a significant translational gap [70]. This review addresses this challenge by providing a structured framework for clinical validation of lipidomic biomarkers, with specific application to the diabetes-hyperuricemia continuum, encompassing methodological standards, practical protocols, and implementation strategies to establish clinically relevant biomarker-disease associations.
Methodological Framework for Biomarker Validation
Validation Stages and Criteria
Clinical validation of lipidomic biomarkers follows a sequential pathway with distinct criteria at each stage, designed to establish both analytical reliability and clinical utility. This multi-stage process transforms putative biomarkers from research observations to clinically actionable tools.
- Discovery Phase: Initial identification of differential lipid species in controlled studies; this phase should prioritize biological plausibility and effect size over statistical significance alone [1].
- Analytical Validation: Establishment of reproducible measurement characteristics including precision, accuracy, sensitivity, and specificity across multiple laboratories and platforms [1].
- Clinical Qualification: Demonstration of clinical performance in intended use populations, including stratification of risk, diagnosis, or prediction of treatment response [71].
- Clinical Implementation: Integration into routine care with demonstrated improvement in patient outcomes or healthcare efficiency [70].
The validation challenges in lipidomics are particularly pronounced due to the structural diversity of lipids, biological variability, and analytical complexity. Recent studies report alarmingly low reproducibility across lipidomics platforms, with agreement rates as low as 14-36% when different analytical platforms and software tools are applied to identical samples [1]. This underscores the critical need for standardized protocols and rigorous analytical validation before clinical claims can be substantiated.
Statistical Considerations for Large Cohorts
Appropriate statistical design is fundamental to establishing robust biomarker-disease associations in large cohorts. Key considerations include:
- Power Calculations: Pre-specification of sample size based on expected effect sizes, with adequate representation of relevant subpopulations (e.g., by ethnicity, disease stage, comorbidities) [17].
- Multiple Testing Corrections: Application of false discovery rate (FDR) controls rather than Bonferroni corrections to balance type I and type II error rates in high-dimensional lipidomic data [19].
- Effect Size Estimation: Reporting of clinically meaningful effect sizes (e.g., fold changes, odds ratios) with confidence intervals rather than reliance solely on statistical significance [17].
- Machine Learning Integration: Use of supervised and unsupervised learning approaches for pattern recognition while maintaining separate training and validation cohorts to prevent overfitting [70].
Large-scale validation requires particular attention to covariate adjustment for factors known to influence lipid metabolism, including age, sex, renal function, medication use, and dietary patterns [17]. Multivariable models should be pre-specified and include clinically relevant covariates to establish the independent predictive value of candidate biomarkers.
Lipidomic Biomarkers in Diabetes-Hyperuricemia: Current Evidence
The relationship between diabetes and hyperuricemia represents a compelling model for biomarker validation, with shared pathophysiological mechanisms including insulin resistance, oxidative stress, and chronic inflammation [17]. Recent lipidomic studies have identified specific alterations in the lipidome associated with this comorbidity pattern.
Table 1: Validated Lipidomic Biomarkers in Diabetes-Hyperuricemia Comorbidity
| Lipid Class | Specific Molecules | Direction of Change | Cohort Size | AUC/Performance | Biological Pathway |
|---|---|---|---|---|---|
| Triglycerides (TGs) | TG(16:0/18:1/18:2), TG(18:1/18:1/18:2) | Upregulated [19] | 51 (DH vs DM vs NGT) [19] | Significant separation in OPLS-DA [19] | Glycerolipid metabolism [19] |
| Phosphatidylethanolamines (PEs) | PE(18:0/20:4), PE(16:0/18:2) | Upregulated [19] | 51 (DH vs DM vs NGT) [19] | Significant separation in OPLS-DA [19] | Glycerophospholipid metabolism [19] |
| Phosphatidylcholines (PCs) | PC(36:1), PC(38:4) | Upregulated [19] | 51 (DH vs DM vs NGT) [19] | Significant separation in OPLS-DA [19] | Glycerophospholipid metabolism [19] |
| Diacylglycerols (DAGs) | Not specified | Upregulated [39] | 120 (HUA vs Healthy) [39] | Associated with immune factors [39] | Glycerophospholipid metabolism [39] |
The evidence presented in Table 1 demonstrates consistent alterations in specific lipid classes across multiple studies. A recent UHPLC-MS/MS study identified 31 significantly altered lipid metabolites in patients with combined diabetes and hyperuricemia compared to healthy controls, with particular enrichment in glycerophospholipid and glycerolipid metabolism pathways [19]. These findings were further validated in a separate multi-omics study of hyperuricemia patients that revealed 33 significantly dysregulated lipid metabolites involved in five key metabolic pathways, with strong correlations to immune markers [39].
The pathophysiological significance of these lipid alterations is further illuminated by their involvement in specific metabolic pathways. Glycerophospholipid metabolism (impact value: 0.199) and glycerolipid metabolism (impact value: 0.014) have been identified as the most significantly perturbed pathways in patients with combined diabetes and hyperuricemia [19]. These pathways influence membrane fluidity, cell signaling, and energy storage, potentially explaining the mechanistic link between lipid dysregulation and metabolic dysfunction in the diabetes-hyperuricemia continuum.
Diagram 1: Pathway Interrelationships in Diabetes-Hyperuricemia Comorbidity. This diagram illustrates the complex interplay between metabolic dysfunction, lipid biomarker alterations, and disease progression in diabetes-hyperuricemia comorbidity, highlighting potential points for biomarker-based intervention.
Experimental Protocols for Validation Studies
Lipid Extraction and Sample Preparation
Standardized sample preparation is fundamental to reproducible lipidomic validation studies. The following protocol has been successfully employed in recent diabetes-hyperuricemia biomarker studies:
- Sample Collection: Collect fasting venous blood in sodium heparin or EDTA tubes. Centrifuge at 3,000 rpm for 10 minutes at 4°C to separate plasma/serum. Aliquot and store at -80°C until analysis [19] [39].
- Lipid Extraction: Employ methyl tert-butyl ether (MTBE) extraction. Combine 100μL plasma with 200μL 4°C water and 240μL precooled methanol. Vortex, then add 800μL MTBE, sonicate in low-temperature water bath for 20 minutes, and incubate at room temperature for 30 minutes [19].
- Phase Separation: Centrifuge at 14,000g for 15 minutes at 10°C. Collect the upper organic phase and dry under nitrogen stream. Reconstitute in 200μL of 90% isopropanol/acetonitrile for MS analysis [39].
- Quality Control: Prepare pooled quality control (QC) samples by combining equal volumes from all samples. Analyze QC samples throughout the analytical sequence to monitor instrument stability [19].
The critical considerations during sample preparation include maintaining consistent temperature control, minimizing oxidation through nitrogen drying, and implementing robust QC procedures. Recent studies emphasize that variations in sample preparation contribute significantly to the poor reproducibility observed in lipidomic studies, highlighting the need for strict standardization [1].
LC-MS/MS Analytical Conditions
Liquid chromatography coupled with tandem mass spectrometry provides the foundation for robust lipid separation and quantification in validation studies:
- Chromatography: Utilize UHPLC systems with C18 reversed-phase columns (e.g., Waters ACQUITY UPLC BEH C18, 2.1 × 100 mm, 1.7 μm). Maintain column temperature at 45°C with flow rate of 300μL/min [39].
- Mobile Phase: Employ binary gradient with mobile phase A (10mM ammonium formate in acetonitrile/water) and mobile phase B (10mM ammonium formate in acetonitrile/isopropanol). Implement linear gradient from 30% B to 100% B over 25 minutes [19].
- Mass Spectrometry: Operate in both positive and negative ionization modes with electrospray ionization. Set spray voltage to 3.0kV (positive) and 2.5kV (negative), capillary temperature to 350°C, and sheath gas flow rate of 45 arb units [39].
- Data Acquisition: Use data-dependent acquisition (DDA) with full MS scan (m/z 200-1800) followed by MS/MS fragmentation of top 10 ions. Alternatively, apply data-independent acquisition (DIA) for enhanced reproducibility in large cohorts [1].
The analytical validation must include determination of precision (intra- and inter-day %CV < 15%), accuracy (85-115% of reference values), linearity (R² > 0.99), and limit of quantification for each lipid species [1]. Recent advancements in pseudotargeted lipidomics offer improved reproducibility by combining the comprehensive coverage of untargeted approaches with the precision of targeted methods [1].
The Scientist's Toolkit: Essential Research Reagents and Platforms
Successful validation of lipidomic biomarkers requires specialized reagents, analytical platforms, and bioinformatic tools. The following table summarizes essential resources for diabetes-hyperuricemia biomarker research:
Table 2: Essential Research Reagent Solutions for Lipidomic Biomarker Validation
| Category | Specific Product/Platform | Application in Validation | Key Features |
|---|---|---|---|
| Chromatography | Waters ACQUITY UPLC BEH C18 Column | Lipid separation [19] | 1.7μm particle size, 2.1×100mm dimensions, C18 chemistry |
| Mass Spectrometry | Q-Exactive Plus Mass Spectrometer (Thermo Scientific) | Lipid identification and quantification [39] | High-resolution accurate mass, electrospray ionization, data-dependent acquisition |
| Lipid Extraction | Methyl tert-butyl ether (MTBE) | Liquid-liquid extraction of lipids [19] [39] | High recovery of diverse lipid classes, minimal matrix effects |
| Data Processing | MS-DIAL, Lipostar | Lipid identification and peak alignment [1] | Untargeted lipidomics support, lipid database matching, peak integration |
| Quality Control | SPLASH LipidoMix Internal Standards | Quantification and QC monitoring [1] | Stable isotope-labeled internal standards for multiple lipid classes |
| Pathway Analysis | MetaboAnalyst 5.0 | Metabolic pathway enrichment analysis [19] | Integrated pathway mapping, statistical visualization, biomarker analysis |
The selection of appropriate analytical platforms and reagents significantly influences the reproducibility and accuracy of lipidomic validation studies. Recent comparative studies have highlighted substantial variability in lipid identification when different software platforms (MS-DIAL vs. Lipostar) are applied to identical datasets, with agreement rates as low as 14-36% using default settings [1]. This underscores the importance of standardizing analytical workflows and implementing robust quality control measures throughout the validation process.
Implementation Framework for Clinical Translation
Overcoming Validation Challenges
The pathway from discovery to clinical adoption of lipidomic biomarkers faces several significant barriers that require strategic approaches:
- Biological Variability: Implement stratified sampling across age, sex, ethnicity, and clinical subgroups to ensure generalizability. Account for diurnal variation, dietary influences, and medication effects through standardized protocols and statistical adjustment [17].
- Analytical Standardization: Adopt standardized operating procedures for sample collection, processing, and analysis. Participate in inter-laboratory comparison programs and implement reference materials to harmonize results across platforms [1].
- Data Integration: Combine lipidomic data with clinical variables, genomic information, and other omics datasets to enhance predictive value and biological context. Employ machine learning approaches to identify multimodal biomarker signatures [70].
- Regulatory Preparedness: Design studies that meet regulatory requirements for biomarker qualification, including prospective validation in intended-use populations, clear analytical performance specifications, and clinical utility demonstrations [71].
The FAIR principles (Findable, Accessible, Interoperable, Reusable) provide a framework for enhancing the transparency and reproducibility of lipidomic biomarker studies [70]. Implementation of these principles through data repositories, standardized metadata, and open-source analytical pipelines addresses key challenges in validation and facilitates cross-study comparison.
Case Example: Renal-Metabolic Risk Score Validation
A recent development in diabetes-hyperuricemia biomarker research illustrates the practical application of validation principles. The Renal-Metabolic Risk Score (RMRS) integrates routine laboratory parameters (urea, TG/HDL ratio, eGFR) to identify patients with uncontrolled T2DM at risk for combined hyperuricemia and dyslipidemia [17].
The validation approach for RMRS demonstrates key elements of successful translation:
- Cohort Design: Retrospective observational study of 304 patients with uncontrolled T2DM
- Performance Metrics: AUC of 0.78 for identifying combined hyperuricemia and dyslipidemia
- Risk Stratification: Monotonic gradient in co-occurrence prevalence from 64.5% in Q1 to 96.1% in Q4
- Clinical Utility: Potential for resource-limited settings using inexpensive, routine parameters [17]
This example highlights how validated biomarker signatures, even using conventional laboratory parameters, can effectively stratify metabolic risk in diabetic populations when subjected to rigorous validation in appropriate clinical cohorts.
Diagram 2: Biomarker Validation Workflow. This diagram outlines the sequential stages of clinical validation for lipidomic biomarkers, highlighting the iterative nature of the process and key outputs at each stage.
The establishment of robust biomarker-disease associations through clinical validation in large cohorts represents a critical pathway for advancing precision medicine in diabetes and hyperuricemia. The current evidence base demonstrates specific alterations in triglyceride, phosphatidylethanolamine, and phosphatidylcholine metabolism that hold promise as clinically actionable biomarkers, particularly when integrated into multimodal risk scores such as the RMRS. However, the translation of these findings to clinical practice requires systematic addressing of key challenges in analytical standardization, biological variability, and clinical qualification.
Future directions in the field should prioritize the development of standardized analytical protocols, implementation of FAIR data principles, and adoption of artificial intelligence approaches for enhanced pattern recognition in multidimensional lipidomic datasets. Through coordinated efforts across research institutions, clinical laboratories, and regulatory bodies, lipidomic biomarkers can realize their potential to transform the management of complex metabolic diseases including diabetes and hyperuricemia, enabling earlier detection, targeted intervention, and improved patient outcomes.
The convergence of diabetes and hyperuricemia represents a significant challenge in metabolic disease management, driven by shared pathophysiological pathways including insulin resistance, oxidative stress, and chronic inflammation. Within this context, lipidomics has emerged as a powerful analytical framework for discovering precise biomarkers and elucidating underlying mechanisms [1]. This whitepaper provides a technical assessment of two promising therapeutic strategies—urate-lowering therapy (ULT) and diacylglycerol (DAG) dietary intervention—evaluating their efficacy through the lens of modern metabolomics. We synthesize recent preclinical and clinical findings to establish a scientific basis for targeted interventions in comorbid diabetes and hyperuricemia, with particular focus on lipidomic disruptions as both diagnostic indicators and measures of therapeutic response.
Pathophysiological Framework and Lipidomic Perturbations
The Diabetes-Hyperuricemia Nexus
The co-occurrence of diabetes and hyperuricemia is not merely coincidental but rooted in synergistic pathophysiological processes. A novel diabetic hamster model incorporating hyperuricemia and dyslipidemia demonstrated that the combination of a high-fat/cholesterol diet (HFCD) and potassium oxonate (PO) treatment significantly elevated serum uric acid to 499.5 ± 61.96 μmol/L, glucose to 16.88 ± 2.81 mmol/L, and triglycerides to 119.88 ± 27.14 mmol/L [72]. This model revealed synergistic effects on renal injury markers, including increased urea nitrogen, creatinine, plasminogen activator inhibitor-1 (PAI-1), and transforming growth factor-β (TGF-β) expressions [72].
The triglyceride-glucose (TyG) index, a surrogate marker of insulin resistance, plays a particularly important role in this relationship. Research involving 1,835 patients with newly diagnosed coronary artery disease (CAD) demonstrated that the TyG index has higher predictive value for multi-vessel CAD than uric acid alone. Hyperuricemia was significantly associated with multi-vessel CAD exclusively in patients with elevated TyG index (>9.33), with mediation analysis revealing that the TyG index mediated 18.89% of the relationship between uric acid and CAD severity [73].
Lipidomic Signature of Combined Diabetes and Hyperuricemia
Comprehensive lipidomic profiling reveals distinct alterations in patients with comorbid diabetes and hyperuricemia. A clinical study employing UHPLC-MS/MS-based untargeted lipidomics identified 1,361 lipid molecules across 30 subclasses in patient plasma [19]. When comparing diabetic patients with hyperuricemia (DH) to those with diabetes alone (DM) and healthy controls (NGT), researchers discovered 31 significantly altered lipid metabolites in the DH group.
Table 1: Key Lipidomic Alterations in Diabetes with Hyperuricemia (DH) vs. Controls
| Lipid Category | Specific Molecules | Change in DH vs. NGT | Biological Significance |
|---|---|---|---|
| Triglycerides (TGs) | TG(16:0/18:1/18:2) and 12 others | Significantly upregulated | Energy storage, lipid accumulation |
| Phosphatidylethanolamines (PEs) | PE(18:0/20:4) and 9 others | Significantly upregulated | Membrane fluidity, signaling |
| Phosphatidylcholines (PCs) | PC(36:1) and 6 others | Significantly upregulated | Membrane integrity, signaling |
| Phosphatidylinositol (PI) | Not specified | Downregulated | Cell signaling, insulin action |
Multivariate analyses confirmed significant separation trends among the DH, DM, and NGT groups, indicating distinct lipidomic profiles [19]. Pathway analysis revealed these differential lipids were predominantly enriched in glycerophospholipid metabolism (impact value: 0.199) and glycerolipid metabolism (impact value: 0.014), identifying these as the most significantly perturbed metabolic pathways in the comorbid condition [19].
The following diagram illustrates the interconnected metabolic disturbances linking hyperuricemia, insulin resistance, and lipidomic disruptions:
Diagram 1: Metabolic pathway interrelationships in diabetes-hyperuricemia comorbidity
Urate-Lowering Therapies: Mechanisms and Outcomes
Conventional Urate-Lowering Agents
Traditional ULT approaches include xanthine oxidase inhibitors (allopurinol, febuxostat) and uricosurics (probenecid, benzbromarone). These agents primarily target uric acid production or renal excretion. The 2025 Expert Consensus on High-Risk Hyperuricemia defines HrHUA and provides detailed recommendations on ULT timing, drug selection, and treatment targets [74]. The consensus emphasizes that long-term hyperuricemia contributes not only to gout and renal impairment but also to cardiovascular diseases, metabolic disorders, and neurological conditions, necessitating early intervention in high-risk populations.
SGLT2 Inhibitors: Pleiotropic Urate-Lowering Effects
SGLT2 inhibitors, primarily prescribed for diabetes, heart failure, and chronic kidney disease, demonstrate significant urate-lowering effects through distinct mechanisms. A retrospective multicenter cohort study of 454 patients revealed that SGLT2 inhibitor initiation resulted in an average 4.5% reduction in serum uric acid (p=0.006) [75]. The effect was more pronounced in specific patient subgroups:
Table 2: Urate-Lowering Efficacy of SGLT2 Inhibitors by Patient Subgroup
| Patient Subgroup | Uric Acid Reduction | Statistical Significance | Clinical Relevance |
|---|---|---|---|
| Overall Population | 4.5% | p = 0.006 | Modest benefit |
| Baseline Elevated UA | 10% | p = 0.001 | Clinically significant |
| Heart Failure (HF) | 9% | p = 0.001 | Dual cardiometabolic benefit |
| Diabetes & HF | Most pronounced | Multivariate OR = 2.2 (1.2-4.04) | Target population |
The proposed mechanism involves enhanced urinary excretion of uric acid through modulation of renal urate transporters, coupled with improved insulin sensitivity and reduced inflammatory signaling [75]. This positions SGLT2 inhibitors as valuable adjunct therapies for hyperuricemia, particularly in patients with cardiorenal metabolic syndromes.
Novel URAT1 Inhibitors: Ruzinurad and Pozdeutinurad
Emerging therapeutic options target uric acid reabsorption with improved efficacy and safety profiles. Phase 3 clinical trial data for ruzinurad, a novel URAT1 inhibitor, demonstrated superior urate-lowering effects compared to allopurinol. At Week 16, 52.6% of ruzinurad-treated patients achieved target serum urate (≤360 μmol/L) versus 34.5% with allopurinol—a difference maintained through Week 52 [76]. Long-term open-label trial data for pozdeutinurad (AR882), another selective URAT1 inhibitor, showed sustained urate reduction and decreased crystal deposition over 18 months, with most treatment-emergent adverse events being mild to moderate in severity [76].
Cardiovascular Benefits of Treat-to-Target Urate Management
The cardiovascular implications of urate-lowering strategies are increasingly recognized. An analysis of linked English and Swedish healthcare data for over 116,000 patients revealed that achieving serum urate <360 μmol/L within one year of ULT initiation was associated with significantly improved 5-year major adverse cardiovascular event (MACE)-free survival and lower MACE risk compared to non-achievers [76]. This association was particularly pronounced in patients over 65, highlighting the cardiovascular benefits of treat-to-target urate management, especially in older populations.
Diacylglycerol (DAG) Dietary Intervention: Mechanisms and Protocols
Biochemical Basis of DAG Action
Diacylglycerol is a structural lipid naturally present in various edible oils at concentrations typically below 10%. Unlike conventional triacylglycerol (TAG) oils, where three fatty acids are esterified to a glycerol backbone, DAG consists of glycerol esterified with two fatty acids, existing primarily as 1,3- and 1,2-DAG isomers [77]. This structural difference significantly alters postprandial metabolism. While TAG is readily re-esterified in intestinal cells and incorporated into chylomicrons, the 1,3-DAG isomer is less efficiently reconverted to TAG, leading to increased β-oxidation and reduced postprandial lipemia [77].
Clinical Trial Protocol for DAG Intervention
A multicenter, prospective, double-blind, randomized controlled trial protocol has been developed to evaluate DAG efficacy in patients with chronic metabolic syndrome and asymptomatic hyperuricemia [77]. The study employs rigorous methodology:
- Participants: 176 patients with chronic metabolic syndrome and asymptomatic hyperuricemia
- Intervention: DAG-rich oil (≥80%) versus conventional TAG oil for 12 weeks
- Primary Outcome: Change in serum uric acid level
- Secondary Outcomes: Fasting blood glucose, 2-hour postprandial glucose, fasting insulin, HbA1c, lipid profile, carotid intima-media thickness
- Safety Assessments: Blood routine, urine routine, liver enzymes, electrocardiogram
The DAG oil is prepared from camellia oil using a whole-enzymatic method, while the control TAG oil consists of conventional camellia oil. At DAG concentrations >80%, the organoleptic properties and cooking performance resemble traditional edible oils, ensuring effective blinding [77].
Analytical Framework: Lipidomic Methodologies
Advanced Lipidomics Platforms
Comprehensive lipidomic analysis requires sophisticated instrumentation and rigorous protocols. Untargeted lipidomics provides a global profile of lipid species, while targeted approaches enable precise quantification of specific biomarkers [1]. The core methodologies include:
Table 3: Core Lipidomic Methodologies for Diabetes-Hyperuricemia Research
| Methodology | Application | Key Features | Limitations |
|---|---|---|---|
| UHPLC-MS/MS (Untargeted) | Discovery phase analysis | Identifies 1,361+ lipid molecules across 30 subclasses [19] | Semi-quantitative, requires validation |
| UPLC-TQ-MS (Targeted) | Biomarker validation | Precise quantification of candidate biomarkers [20] | Focused on predefined metabolites |
| Orthogonal PLS-DA | Multivariate statistics | Discriminates sample groups, identifies differential lipids [19] | Risk of overfitting without validation |
Quality Control and Standardization
Significant challenges in lipidomics include platform reproducibility and biomarker validation. Studies report agreement rates as low as 14-36% across different lipidomics platforms when analyzing identical samples [1]. Addressing this requires:
- Standardized pre-analytical protocols for sample collection, storage, and extraction
- Implementation of internal standards for quantification
- Method validation following FDA or EMA guidelines for bioanalytical methods
- Cross-laboratory verification of candidate biomarkers
Artificial intelligence and machine learning approaches are emerging as powerful tools for lipid identification, with models like MS2Lipid achieving up to 97.4% accuracy in predicting lipid subclasses [1].
The following workflow diagram outlines a comprehensive approach for evaluating therapeutic interventions in diabetes-hyperuricemia:
Diagram 2: Integrated workflow for therapeutic evaluation
The Scientist's Toolkit: Essential Research Reagents
Table 4: Essential Research Reagents for Diabetes-Hyperuricemia Lipidomics
| Reagent/Category | Specific Examples | Research Function | Technical Notes |
|---|---|---|---|
| UHPLC-MS/MS System | Waters ACQUITY UPLC BEH C18 column | Untargeted lipidomics | Separates 1,361+ lipid molecules [19] |
| Lipid Standards | Deuterated TGs, PCs, PEs | Quantification | Internal standards for targeted assays |
| Animal Models | Golden Syrian hamsters | Preclinical testing | Recapitulates human lipid metabolism [72] |
| Enzyme Inhibitors | Potassium oxonate (PO) | Hyperuricemia induction | Inhibits uricase, dose: 350 mg/kg [72] |
| Specialized Diets | High-fat/cholesterol diet (HFCD) | Disease induction | 15% fat, 0.5% cholesterol [72] |
| DAG Preparation | Enzymatically synthesized DAG oil | Dietary intervention | ≥80% DAG content from camellia oil [77] |
The confluence of diabetes and hyperuricemia creates a complex metabolic phenotype with distinct lipidomic signatures characterized by alterations in glycerophospholipid and glycerolipid metabolism pathways. Urate-lowering therapies, particularly SGLT2 inhibitors and novel URAT1 inhibitors, demonstrate significant benefits beyond urate reduction, including improved cardiovascular and renal outcomes. Concurrently, dietary interventions with DAG-rich oils offer a promising nutritional strategy for modulating lipid metabolism and reducing cardiometabolic risk factors. Advanced lipidomic platforms provide the necessary analytical framework for discovering and validating biomarkers, enabling precise assessment of intervention efficacy. The integration of these approaches—pharmacological ULT, targeted dietary modification, and comprehensive lipidomic profiling—represents a transformative strategy for addressing the growing challenge of diabetes-hyperuricemia comorbidity. Future research should focus on validating these findings in larger, diverse populations and establishing standardized lipidomic biomarkers for clinical use.
Lipidomics, the large-scale study of lipid pathways and networks, has emerged as a powerful tool for delineating the molecular signatures of metabolic diseases. This technical guide synthesizes recent lipidomic evidence that reveals distinct plasma lipid profiles for Diabetes Mellitus (DM), Hyperuricemia (HUA), their comorbidity (DH), and Gout. Advanced mass spectrometry techniques have identified disease-specific alterations, particularly in glycerophospholipid and glycerolipid metabolism pathways. These lipidomic fingerprints not only enhance our understanding of disease pathogenesis but also hold significant promise for developing biomarkers to guide personalized treatment strategies for researchers and drug development professionals engaged in biomarker discovery.
Lipidomics, a specialized branch of metabolomics, provides a comprehensive analysis of lipid molecular species and their biological functions within a biological system [1]. The lipidome encompasses thousands of chemically distinct lipids, classified into eight key categories: fatty acyls (FA), glycerolipids (GL), glycerophospholipids (GP), sphingolipids (SP), sterol lipids (SA), prenol lipids (PR), saccharolipids (SL), and polyketides (PK) [1]. The molecular structures of these lipids determine their diverse functions in cellular processes, including cell signaling, energy storage, and maintaining structural plasma membrane integrity [1].
In the context of metabolic diseases, lipidomic profiling can reveal crucial insights into homeostasis, lipid metabolism disruption, and disease mechanisms [1]. This is particularly relevant for conditions like diabetes, hyperuricemia, and gout, which often present with overlapping clinical features but require distinct therapeutic approaches. The transition of lipid research from bench to bedside depends on discovering clinically reliable, repeatable, and validated biomarkers across various populations [1]. This review provides an in-depth technical analysis of how lipidomic approaches are revolutionizing our ability to differentiate between related metabolic disorders, with a focus on DH, DM, HUA, and Gout.
Lipidomic Profiles Across Diseases
Diabetes Mellitus Combined with Hyperuricemia (DH)
Patients with combined diabetes mellitus and hyperuricemia exhibit significant alterations in lipid metabolites compared to those with diabetes alone or healthy controls. A UHPLC-MS/MS-based untargeted lipidomic analysis identified 1,361 lipid molecules across 30 subclasses in DH patients [19]. Multivariate analyses revealed a significant separation trend among the DH, DM, and normal glucose tolerance (NGT) groups, confirming distinct lipidomic profiles [19].
A total of 31 significantly altered lipid metabolites were pinpointed in the DH group compared to NGT controls [19]. Among the most relevant individual metabolites:
- 13 triglycerides (TGs), including TG(16:0/18:1/18:2)
- 10 phosphatidylethanolamines (PEs), including PE(18:0/20:4)
- 7 phosphatidylcholines (PCs), including PC(36:1)
- 1 phosphatidylinositol (PI) was significantly downregulated
The collective analysis of these metabolite groups revealed their enrichment in six major metabolic pathways. Crucially, glycerophospholipid metabolism (impact value: 0.199) and glycerolipid metabolism (impact value: 0.014) were identified as the most significantly perturbed pathways in DH patients [19]. Furthermore, comparison of DH versus DM groups identified 12 differential lipids, which were also predominantly enriched in these same core pathways, underscoring their central role in the pathophysiology of hyperuricemia complicating diabetes [19].
Hyperuricemia (HUA) and Gout
Comprehensive targeted lipidomic analysis of plasma samples from HUA and gout patients has revealed profound alterations in lipid profiles. A study semi-quantifying 608 lipids in plasma found the most significant upregulation of phosphatidylethanolamines and downregulation of lysophosphatidylcholine plasmalogens/plasmanyls in both HUA and gout patients [12] [78] [79].
Notably, more profound lipidomic changes were observed in early-onset patients (≤40 years) with HUA and gout who were not receiving urate-lowering treatment (ULT) [12] [78]. Multivariate statistics successfully differentiated HUA≤40 and Gout≤40 groups from healthy controls with an overall accuracy of >95% [12] [78], demonstrating the powerful discriminatory capability of lipidomic profiling.
Another multi-omics study investigating lipid metabolism disorders in HUA patients identified 33 significantly upregulated lipid metabolites in patients with hyperuricemia compared to healthy controls [39]. These lipid metabolites were involved in:
- Arachidonic acid metabolism
- Glycerophospholipid metabolism
- Linoleic acid metabolism
- Glycosylphosphatidylinositol (GPI)-anchor biosynthesis
- Alpha-Linolenic acid metabolism pathways
Table 1: Key Lipid Classes Altered in Metabolic Diseases
| Lipid Class | DH | HUA | Gout | Technical Significance |
|---|---|---|---|---|
| Phosphatidylethanolamines (PEs) | ↑ (10 species) [19] | ↑ [12] | ↑ [12] | Membrane fluidity, autophagy |
| Triglycerides (TGs) | ↑ (13 species) [19] | Information missing | Information missing | Energy storage, cardiovascular risk |
| Phosphatidylcholines (PCs) | ↑ (7 species) [19] | Information missing | Information missing | Membrane structure, signaling |
| Lysophosphatidylcholine Plasmalogens | Information missing | ↓ [12] | ↓ [12] | Antioxidant properties, membrane dynamics |
| Phosphatidylinositol (PI) | ↓ [19] | Information missing | Information missing | Cell signaling, membrane trafficking |
Effect of Urate-Lowering Treatment (ULT)
Urate-lowering treatment appears to have a significant effect on the normalization of lipid profiles, particularly in early-onset hyperuricemia patients (HUA≤40) [12] [79]. In patients over 40 years, this normalizing trend was not as evident [79]. The most significant glycerophospholipid dysregulation was found in HUA≤40 and Gout≤40 patients, together with a correction of this imbalance with ULT [12] [78]. This suggests that early initiation of ULT in early-onset hyperuricemia patients may provide particular benefits, though this requires careful clinical analysis [79].
Detailed Experimental Methodologies
Sample Preparation and Lipid Extraction
Standardized sample preparation is crucial for reproducible lipidomic results. The following protocol has been used across multiple studies investigating lipidomics in metabolic diseases [19] [39]:
- Sample Collection: 5 mL of fasting morning blood is collected and centrifuged at 3,000 rpm for 10 minutes at room temperature.
- Plasma Separation: 0.2 mL of the upper layer of plasma is aliquoted into 1.5 mL centrifuge tubes.
- Quality Control: Three equal groups of samples are mixed as quality control (QC) samples.
- Storage: Samples are stored at -80°C until analysis.
- Lipid Extraction:
- 100 μL of thawed plasma is vortexed with 200 μL of 4°C water
- 240 μL of pre-cooled methanol is added followed by mixing
- 800 μL of methyl tert-butyl ether (MTBE) is added followed by vortexing
- 20 minutes of sonication in a low-temperature water bath
- 30 minutes of standing at room temperature
- Centrifugation at 14,000 g for 15 minutes at 10°C
- The upper organic phase is collected and dried under nitrogen
- Reconstitution: The dried lipid extract is reconstituted in 200 μL of 90% isopropanol/acetonitrile and centrifuged at 14,000 g for 15 minutes at 10°C before mass spectrometric analysis.
LC-MS/MS Analysis Conditions
Liquid chromatography-mass spectrometry (LC-MS/MS) is the cornerstone technology for comprehensive lipidomic profiling. The following conditions represent a typical analytical setup:
Chromatographic Conditions [19] [39]:
- Column: Waters ACQUITY UPLC BEH C18 (2.1 mm × 100 mm, 1.7 μm particle size) or Waters ACQUITY UPLC CSH C18
- Mobile Phase A: 10 mM ammonium formate in acetonitrile/water solution
- Mobile Phase B: 10 mM ammonium formate in acetonitrile/isopropanol solution
- Gradient: Starting at 30% mobile phase B (0-2 min), increasing to 100% B (2-25 min), then re-equilibrated at 30% B (25-35 min)
- Flow Rate: 300 μL/min
- Injection Volume: 3 μL
- Column Temperature: 45°C
Mass Spectrometric Conditions [39]:
- Instrument: Q-Exactive Plus mass spectrometer (Thermo Scientific)
- Ionization: Electrospray ionization (ESI)
- Sheath Gas Flow Rate: 45 arb
- Auxiliary Gas Flow Rate: 15 arb
- Spray Voltage: 3.0 kV (positive), 2.5 kV (negative)
- Capillary Temperature: 350°C
- Scan Range: 200-1800 m/z
- MS1 Resolution: 70,000
- MS2 Resolution: 17,500
Data Processing and Statistical Analysis
Lipidomic data processing typically involves:
- Lipid Identification: Using software platforms like MS DIAL or Lipostar
- Multivariate Statistics: Principal component analysis (PCA) and orthogonal partial least squares discriminant analysis (OPLS-DA) to observe overall distribution between sample groups [19]
- Differential Analysis: Student's t-test and fold change (FC) to identify significantly altered lipids [19]
- Pathway Analysis: Utilizing platforms like MetaboAnalyst 5.0 to analyze differential lipid metabolism pathways [19]
Table 2: Key Instrumentation and Reagents for Lipidomics Research
| Category | Specific Product | Application/Function |
|---|---|---|
| Chromatography Columns | Waters ACQUITY UPLC BEH C18 [19] | Lipid separation based on hydrophobicity |
| Mass Spectrometry | Q-Exactive Plus [39], QTRAP 6500+ [80] | High-resolution lipid identification and quantification |
| Extraction Solvents | Methyl tert-butyl ether (MTBE) [19] [39] | Liquid-liquid extraction of lipids from plasma |
| Internal Standards | SPLASH LIPIDOMIX [12] | Quantification normalization and quality control |
| Mobile Phase Additives | Ammonium formate [19] [39] | Enhance ionization efficiency in mass spectrometry |
Metabolic Pathways and Biological Insights
Key Dysregulated Pathways
Lipidomic studies consistently identify several core metabolic pathways that are disrupted across DH, DM, HUA, and Gout:
Glycerophospholipid Metabolism: This pathway is consistently disrupted across all conditions, with an impact value of 0.199 in DH patients [19]. Glycerophospholipids are essential components of cellular membranes and play crucial roles in cell signaling, membrane trafficking, and apoptosis regulation.
Glycerolipid Metabolism: Particularly important in DH (impact value: 0.014) [19], this pathway involves the synthesis and degradation of triglycerides and other glycerol-containing lipids, central to energy storage and metabolism.
Arachidonic Acid Metabolism: Identified as significantly altered in HUA patients [39], this pathway produces eicosanoids that mediate inflammation, a key process in gout pathogenesis.
Linoleic Acid and Alpha-Linolenic Acid Metabolism: These essential fatty acid pathways are disturbed in HUA [39], affecting the production of various lipid mediators and membrane fluidity.
Integration with Immune and Inflammatory Responses
In hyperuricemia, lipid metabolism disorders interact significantly with immune system factors. ELISA analyses have revealed that IL-10, CPT1, IL-6, SEP1, TGF-β1, Glu, TNF-α, and LD are associated with glycerophospholipid metabolism [39]. Significant differences in CPT1, TGF-β1, Glu, and LD were demonstrated between HUA patients and healthy individuals [39]. These factors may increase fatty acid oxidation and mitochondrial oxidative phosphorylation in patients through the glycerophospholipid pathway, reducing the rate of glycolysis and other pathways to change metabolic patterns, thereby affecting disease progression in patients with hyperuricemia [39].
Figure 1: Pathophysiological Relationship Between HUA, Lipid Dysregulation, and Gout
Critical Research Reagents and Solutions
Successful lipidomics research requires carefully selected reagents and standards:
SPLASH LIPIDOMIX Mass Spec Standard: A quantitative mixture of stable isotope-labeled lipid standards from Avanti Polar Lipids used for normalization and quality control in targeted lipidomics [12].
Methyl tert-butyl ether (MTBE): A preferred solvent for liquid-liquid extraction of lipids from plasma samples, providing high recovery of diverse lipid classes [19] [39].
Ammonium formate: Mobile phase additive that enhances ionization efficiency in mass spectrometry, improving detection sensitivity [19] [39].
Ceramide (d18:1-d7/15:0) and Oleic acid-d9: Specific internal standards for sphingolipid and fatty acid quantification [12].
NIST SRM 1950 - Metabolites in Frozen Human Plasma: Standard reference material for method validation and inter-laboratory comparison [12].
Analytical Workflow for Differential Lipidomics
Figure 2: Lipidomics Analysis Workflow
Implications for Biomarker Discovery and Drug Development
The distinct lipidomic signatures identified across DH, DM, HUA, and Gout present significant opportunities for biomarker discovery and targeted therapeutic development. Machine learning approaches applied to lipidomic data have demonstrated impressive capabilities in disease classification and risk prediction. For instance, models trained on lipidomic profiles have achieved >95% accuracy in differentiating early-onset HUA and gout from healthy controls [12] [78].
Furthermore, research on gout flare frequency has identified metabolic biomarkers that can distinguish between frequent and infrequent gout flares, with prediction models achieving AUROC values of 0.88 in discovery cohorts and 0.67 in validation cohorts [81]. These models utilized 25 metabolic biomarkers with strong predictive power, ultimately refining to a 6-marker panel for clinical application [81].
For drug development, the observed normalization of lipid profiles with urate-lowering treatment, particularly in early-onset patients [12] [79], suggests that lipidomic monitoring could serve as a valuable pharmacodynamic biomarker for assessing treatment efficacy. Additionally, the specific pathway disruptions identified—especially in glycerophospholipid and glycerolipid metabolism—offer potential targets for novel therapeutic interventions that could address the underlying metabolic disturbances beyond current symptomatic treatments.
Comparative lipidomics provides a powerful framework for differentiating between related metabolic disorders including DH, DM, HUA, and Gout. Through advanced mass spectrometry techniques and sophisticated data analysis, researchers have identified distinct lipidomic signatures characterized by specific alterations in phosphatidylethanolamines, lysophosphatidylcholine plasmalogens, triglycerides, and other lipid classes. These findings not only enhance our understanding of the pathological mechanisms underlying these conditions but also open new avenues for biomarker discovery, personalized treatment strategies, and targeted drug development. As lipidomic methodologies continue to evolve and standardize, their integration into clinical research promises to transform our approach to metabolic disease diagnosis, monitoring, and management.
The integration of renal and metabolic parameters into predictive clinical models represents a significant advancement in personalized medicine for patients with type 2 diabetes (T2D). This technical guide details the development, validation, and application of the Renal–Metabolic Risk Score (RMRS), a novel instrument designed to identify patients with uncontrolled T2D at high risk for concurrent hyperuricemia and dyslipidemia. Framed within lipidomics biomarker discovery research, the RMRS leverages routine laboratory parameters to provide a practical, cost-effective stratification tool. This whitepaper provides a comprehensive methodological framework for the RMRS model, including its biochemical rationale, derivation protocols, performance characteristics, and potential for integration with emerging lipidomic technologies to enhance predictive accuracy in diabetes-related cardiorenal complications.
Type 2 diabetes mellitus (T2D) is a complex metabolic disorder characterized by chronic hyperglycemia resulting from insulin resistance and impaired insulin secretion. Beyond its direct glycemic effects, T2D is frequently accompanied by a cluster of metabolic comorbidities, notably dyslipidemia and hyperuricemia, which independently and synergistically contribute to cardiovascular disease, chronic kidney disease (CKD), and microvascular complications [17]. Dyslipidemia in T2D typically presents as hypertriglyceridemia, reduced high-density lipoprotein cholesterol (HDL-C), and a predominance of small dense low-density lipoprotein (LDL) particles, all of which promote atherogenesis [17]. Hyperuricemia, defined by elevated serum uric acid (UA) levels, is increasingly recognized as not only a marker but also a mediator of metabolic and vascular injury, exerting effects through oxidative stress, endothelial dysfunction, and stimulation of the renin–angiotensin–aldosterone system [17].
The pathophysiological interconnection between lipid metabolism and uric acid homeostasis creates a compelling rationale for integrated risk assessment. Both conditions share overlapping mechanisms including insulin resistance, chronic low-grade inflammation, and endothelial dysfunction [17]. In individuals with uncontrolled T2D—typically defined by persistently elevated glycated hemoglobin (HbA1c) ≥7%—these mechanisms are amplified, leading to accelerated vascular damage and a higher incidence of adverse renal and cardiovascular outcomes [82] [17]. The co-occurrence of dyslipidemia and hyperuricemia may represent a more advanced stage of metabolic dysregulation, potentially warranting earlier and more aggressive intervention strategies.
Contemporary lipidomics research has revealed profound disruptions in lipid metabolism associated with diabetic complications. Lipidomics, a subfield of metabolomics, involves the comprehensive study of lipid molecular species and their biological functions, providing information on homeostasis, lipid metabolism, and disruption in both health and disease [1]. Specific lipid species, including ceramides and phosphatidylcholines, have been associated with cardiovascular risk, while alterations in sphingolipid and glycerophospholipid metabolism are being investigated in multiple disease contexts [1]. A 2025 lipidomic study identified 27 unique lipid species associated with subclinical carotid atherosclerosis in T2D, with phosphatidylcholines and diacylglycerols being the main lipid classes involved [83]. These findings underscore the potential of lipid biomarkers in refining risk prediction models.
The Renal–Metabolic Risk Score (RMRS) emerges at the intersection of conventional biochemistry and advanced metabolic profiling, offering a pragmatic approach to risk stratification that utilizes routinely available parameters while remaining conceptually compatible with emerging lipidomic biomarkers.
Development and Derivation of the RMRS
Study Design and Population Characteristics
The RMRS was derived and validated through a retrospective, observational cohort study conducted at the Bihor County Emergency Hospital in Oradea, Romania, between January 2022 and December 2023 [17] [84]. The study population comprised 304 patients with uncontrolled T2D (HbA1c ≥7%), with complete data for serum uric acid and lipid profile [17]. Inclusion criteria specified adults aged ≥18 years with a confirmed diagnosis of T2D and available laboratory results for uric acid and lipid fractions [17]. Key exclusion criteria included type 1 diabetes, gestational diabetes, pregnancy, acute diabetic complications (ketoacidosis, hyperosmolar coma), missing laboratory data, or refusal to provide informed consent [17].
Table 1: Baseline Characteristics of the Study Population (N=304)
| Parameter | Overall Cohort | Co-occurrence Group | Non-co-occurrence Group | p-value |
|---|---|---|---|---|
| N | 304 | 247 (81.6%) | 57 (18.4%) | - |
| Age (years) | 66.90 ± 10.99 | 66.90 ± 10.99 | 66.33 ± 11.51 | 0.737 |
| Gender (% male) | 54.3% | 54.3% | 47.4% | 0.429 |
| Provenance (% rural) | 55.9% | 55.9% | 56.1% | 1.000 |
| HbA1c (%) | ≥7.0 | ≥7.0 | ≥7.0 | - |
| Dyslipidemia prevalence | 81.6% | 100% | 0% | <0.001 |
| Hyperuricemia prevalence | 81.6% | 100% | 0% | <0.001 |
Operational Definitions and Laboratory Parameters
Standardized operational definitions were applied consistently throughout the study:
- Uncontrolled T2D: HbA1c ≥7.0% [17]
- Hyperuricemia: Serum uric acid >7 mg/dL in males and >6 mg/dL in females [17] [84]
- Dyslipidemia: Triglycerides ≥150 mg/dL, LDL-C ≥100 mg/dL, HDL-C <40 mg/dL in males or <50 mg/dL in females, and/or use of lipid-lowering therapy [17]
Laboratory assessment included demographic variables, anthropometric parameters, blood pressure, medical history, and comprehensive biochemical profiling including fasting plasma glucose, HbA1c, lipid profile (triglycerides, total cholesterol, HDL-C, LDL-C), serum creatinine, urea, uric acid, albuminuria, and estimated glomerular filtration rate (eGFR) calculated using the CKD-EPI formula [17].
Statistical Analysis and Model Derivation
Data analysis employed IBM SPSS Statistics version 30, with complementary validation using Python (version 3.11; packages: pandas, scikit-learn, statsmodels, matplotlib) [17]. Continuous variables were assessed for normality with the Shapiro-Wilk test and homogeneity of variance with Levene's test [17]. Group comparisons utilized independent samples t-tests, one-way ANOVA, Mann-Whitney U tests, or Kruskal-Wallis tests as appropriate [17]. Categorical variables were compared with Chi-square or Fisher's exact tests [17].
To enable comparability between variables measured on different scales, continuous predictors were transformed into z-scores prior to inclusion in the regression models [17]. Logistic regression analysis identified independent predictors of hyperuricemia, with odds ratios (ORs) and 95% confidence intervals (CIs) reported [17]. Model calibration was assessed using Nagelkerke R² and Hosmer-Lemeshow goodness-of-fit test [17]. The predictive performance was evaluated by receiver operating characteristic (ROC) analysis with area under the curve (AUC), 95% CI, and Youden's index to determine optimal cut-off points [17].
The RMRS was calculated from standardized values of urea, TG/HDL ratio, and eGFR, with variable weights derived from logistic regression coefficients [17] [84]. The score was subsequently normalized to a 0-100 scale for clinical applicability [17].
The RMRS Algorithm: Components and Calculation
The RMRS integrates three routinely available laboratory parameters that reflect distinct aspects of renal and metabolic function:
Table 2: Component Parameters of the Renal-Metabolic Risk Score
| Parameter | Physiological Significance | Measurement Method | Contribution to RMRS |
|---|---|---|---|
| Serum Urea | Marker of renal nitrogen clearance and catabolic state | Standard enzymatic assay | Positive weighting (increased urea elevates score) |
| TG/HDL Ratio | Indicator of atherogenic dyslipidemia and insulin resistance | Calculated from standard lipid panel | Positive weighting (higher ratio elevates score) |
| eGFR | Assessment of glomerular filtration rate and renal function | Calculated via CKD-EPI formula | Negative weighting (lower eGFR elevates score) |
The mathematical derivation of the RMRS follows a structured process:
- Standardization: Each parameter is converted to a z-score based on the population distribution
- Coefficient Application: Weighted coefficients derived from logistic regression are applied
- Normalization: The result is transformed to a 0-100 scale for clinical interpretability
The complete algorithm is expressed as: RMRS = [β₠× ureaz + β₂ × (TG/HDL)z - β₃ × eGFRz] × scalingconstant + offset
Where β-values represent regression coefficients derived from the development cohort, and _z denotes z-score transformation [17].
Performance Characteristics and Validation
Discriminative Performance and Clinical Utility
The RMRS demonstrated significant efficacy in distinguishing patients with co-occurring dyslipidemia and hyperuricemia in the derivation cohort. The prevalence of this co-occurrence was notably high at 81.6% among patients with uncontrolled T2D [17]. ROC analysis revealed an AUC of 0.78, indicating good discrimination between those with and without combined metabolic-renal dysfunction [17] [84].
Quartile analysis provided further evidence of the score's stratification capability, demonstrating a monotonic gradient in co-occurrence prevalence from 64.5% in Q1 (lowest risk) to 96.1% in Q4 (highest risk) [17]. This dose-response relationship strengthens the clinical validity of the RMRS for risk stratification.
Table 3: Performance Metrics of the RMRS in the Derivation Cohort
| Performance Measure | Value | Interpretation |
|---|---|---|
| Area Under Curve (AUC) | 0.78 | Good discrimination |
| Score in Co-occurrence Group | Median: 16.9 | Significantly elevated |
| Score in Non-co-occurrence Group | Median: 10.0 | Baseline level |
| Intergroup Difference | p < 0.001 | Statistically significant |
| Q1 Prevalence | 64.5% | Low-risk quartile |
| Q4 Prevalence | 96.1% | High-risk quartile |
Comparative Analysis with Related Models
An earlier, simpler iteration of the risk score explored in a 2025 study integrated only serum urea and the triglyceride-to-LDL cholesterol ratio (TG/LDL) [82]. This preliminary model showed an AUC of 0.67, significantly lower than the optimized RMRS that incorporates eGFR and uses TG/HDL ratio instead of TG/LDL [82]. The enhanced performance of the current RMRS highlights the importance of parameter selection and weighting in risk score development.
In the comparative analysis between hyperuricemic and non-hyperuricemic patients with uncontrolled T2D, those with hyperuricemia had significantly higher serum urea (32.15 ± 21.21 vs. 19.76 ± 10.02 mg/dL; p < 0.001) and numerically higher TG/LDL (2.94 ± 6.73 vs. 1.95 ± 1.28; p = 0.062) [82]. Interestingly, serum uric acid was lower in the hyperuricemia group, attributed to categorical definition thresholds and treatment effects (5.69 ± 1.87 vs. 6.77 ± 2.12 mg/dL; p = 0.038) [82].
Integration with Lipidomics Biomarker Discovery
Lipidomic Insights into Diabetes Pathophysiology
Lipidomics provides a powerful framework for understanding the molecular basis of metabolic diseases, including T2D and its complications. As a subfield of metabolomics, lipidomics involves the comprehensive study of lipid molecular species and their biological functions, providing crucial information on homeostasis, lipid metabolism, and disruption in both health and disease [1]. The molecular structures of lipids largely determine their functions, with the LIPID MAPS classification system organizing lipids into eight key categories: fatty acyls (FA), glycerolipids (GL), glycerophospholipids (GP), sphingolipids (SP), sterol lipids (ST), prenol lipids (PR), saccharolipids (SL), and polyketides (PK) [1].
Recent lipidomic studies have revealed specific alterations in diabetic populations with complications. A 2025 investigation into subclinical carotid atherosclerosis (SCA) in diabetes identified 27 unique lipid species associated with SCA specifically in T2D patients [83]. Phosphatidylcholines and diacylglycerols emerged as the main SCA-associated lipid classes, with ten different species of phosphatidylcholines up-regulated and four phosphatidylcholines containing polyunsaturated fatty acids down-regulated [83]. Additionally, the study found that one diacylglycerol was down-regulated while three others were positively associated with SCA in individuals with T2D without dyslipidemia [83].
Methodological Framework for Lipidomic Analysis
Lipidomics methodologies have advanced with multiple targeted, untargeted, and pseudotargeted techniques that improve structural lipid profiling, resolution, and quantification [1]. Untargeted lipidomics provides a comprehensive picture of a sample's lipid profile but may be limited by semi-quantification and potential missing of low-abundance lipids [1]. Targeted lipidomics focuses on specific, predefined lipids with higher sensitivity and quantification accuracy, while pseudotargeted approaches aim to combine the comprehensiveness of untargeted with the quantification accuracy of targeted methods [1].
Synergistic Potential: RMRS and Lipidomic Profiling
The integration of lipidomic biomarkers with clinical risk scores like the RMRS holds significant promise for advancing personalized medicine in diabetes management. Lipidomic signatures can provide mechanistic insights that complement the phenotypic assessment offered by the RMRS. Specific lipid species or ratios could potentially enhance the predictive accuracy of the RMRS, particularly for identifying patients at risk for specific complications such as carotid atherosclerosis or progressive kidney disease.
The RMRS provides a clinical framework for contextualizing lipidomic findings, while lipidomics can help validate and refine the metabolic perturbations captured by the RMRS components. This bidirectional relationship creates a powerful feedback loop for model improvement and biological insight generation.
Research Reagents and Methodological Toolkit
Table 4: Essential Research Reagents and Analytical Tools for RMRS Development and Validation
| Category | Specific Items/Platforms | Application in RMRS Research |
|---|---|---|
| Laboratory Assays | Enzymatic colorimetric assays for urea, uric acid, triglycerides, HDL-C, LDL-C | Quantification of core RMRS parameters |
| Analytical Platforms | Ultra-high performance liquid chromatography-electrospray ionization tandem mass spectrometry (UPLC-ESI-MS/MS) | Lipidomic profiling for biomarker discovery and validation |
| Statistical Software | IBM SPSS Statistics v30, Python 3.11 (pandas, scikit-learn, statsmodels, matplotlib) | Statistical analysis, model development, and visualization |
| Bioinformatics Tools | MS DIAL, Lipostar, Comprehensive Lipidomic Automated Workflow (CLAW) | Lipid identification, quantification, and data processing |
| Reference Materials | Certified reference standards for lipid classes (ceramides, phosphatidylcholines, diacylglycerols) | Method validation and quality control |
The Renal–Metabolic Risk Score represents a significant advancement in risk stratification for patients with uncontrolled type 2 diabetes, integrating routine renal and lipid parameters into a practical clinical tool. With its demonstrated discriminative capacity (AUC=0.78) and strong gradient effect across quartiles, the RMRS offers a cost-effective approach to identifying high-risk patients who may benefit from intensified management [17] [84].
Future research directions should focus on several key areas:
- External validation in larger, more diverse populations to establish generalizability across different ethnic and geographic groups
- Prospective studies to evaluate the impact of RMRS-guided management on clinical outcomes
- Integration with omics technologies, particularly lipidomics, to enhance predictive accuracy and provide mechanistic insights
- Assessment of intervention responsiveness to determine whether RMRS-high patients derive differential benefit from specific therapies
From a clinical and assistive practice perspective, the RMRS may help nephrology nurses and multidisciplinary teams identify high-risk patients who require closer monitoring of renal and metabolic complications [82]. It could further guide early dietary counseling, pharmacological optimization, and frailty assessment in chronic kidney disease care [82]. As lipidomics continues to evolve, its integration with clinical risk scores like the RMRS promises to usher in a new era of precision medicine for diabetes and its cardiorenal complications.
Conclusion
Lipidomics has unequivocally revealed a profound disruption of the lipid milieu in the co-occurrence of diabetes and hyperuricemia, characterized by specific signatures in glycerophospholipids and glycerolipids. The translation of these discoveries into clinical practice hinges on overcoming significant challenges in analytical standardization and validation. Future research must focus on large-scale, multi-center prospective studies to solidify the predictive value of these lipid biomarkers. The integration of lipidomics with other omics data, coupled with advanced AI and machine learning, paves the way for powerful predictive models. Ultimately, these efforts are poised to deliver novel diagnostic panels, inform targeted dietary and pharmacological interventions, and usher in a new era of personalized management for patients with intertwined metabolic diseases, moving beyond traditional single-molecule biomarkers to a systems-level understanding of metabolic health.
References
- 1. Exploring lipidomics in biomarker discovery [https://www.sciencedirect.com/science/article/pii/S0009898125005777?dgcid=rss_sd_all]
- 2. Skeletal muscle insulin resistance in prediabetes [https://www.nature.com/articles/s41598-025-22745-1]
- 3. The triglyceride-glucose index as a biomarker of diabetic ... [https://pmc.ncbi.nlm.nih.gov/articles/PMC12597932/]
- 4. The triglyceride-glucose index: updating evidence from ... [https://cardiab.biomedcentral.com/articles/10.1186/s12933-025-02914-2]
- 5. Triglyceride-glucose index (TyG) as a novel biomarker in ... [https://www.sciencedirect.com/science/article/abs/pii/S0167527324012853]
- 6. UHPLC-MS/MS-based plasma untargeted lipidomic ... [https://www.frontiersin.org/journals/molecular-biosciences/articles/10.3389/fmolb.2025.1656458/abstract]
- 7. The Pivotal Role of the Western Diet, Hyperinsulinemia ... [https://pmc.ncbi.nlm.nih.gov/articles/PMC12470709/]
- 8. Lipidomics reveals potential biomarkers and ... [https://www.sciencedirect.com/science/article/pii/S2589936825000106]
- 9. Associations of Plasma Lipidomic Profiles with Uric Acid ... [https://link.springer.com/article/10.1007/s43657-024-00157-x]
- 10. Metabolic pathway analysis of hyperuricaemia patients with ... [https://lipidworld.biomedcentral.com/articles/10.1186/s12944-022-01765-0]
- 11. The effect of lipid metabolism disorder on patients with ... [https://pmc.ncbi.nlm.nih.gov/articles/PMC10598229/]
- 12. Alterations in lipidome profiles distinguish early-onset ... [https://pmc.ncbi.nlm.nih.gov/articles/PMC10693150/]
- 13. Metabolomics combined with metagenomics analysis reveals ... [https://pmc.ncbi.nlm.nih.gov/articles/PMC12234910/]
- 14. Lipids dysregulation in diseases: core concepts, targets and ... [https://pmc.ncbi.nlm.nih.gov/articles/PMC11843775/]
- 15. Lipid metabolic dysregulation-induced neuroinflammation ... [https://www.frontiersin.org/journals/immunology/articles/10.3389/fimmu.2025.1625087/full]
- 16. Alzheimer's disease pathogenesis: standing at the crossroad ... [https://molecularneurodegeneration.biomedcentral.com/articles/10.1186/s13024-025-00857-6]
- 17. Interrelationship Between Dyslipidemia and Hyperuricemia ... [https://pmc.ncbi.nlm.nih.gov/articles/PMC12562356/]
- 18. Diabetes mediates the association between uric acid to ... [https://www.nature.com/articles/s41598-025-19388-7]
- 19. UHPLC-MS/MS-based plasma untargeted lipidomic ... [https://www.frontiersin.org/journals/molecular-biosciences/articles/10.3389/fmolb.2025.1656458/full]
- 20. Investigation of pathogenesis of hyperuricemia based on ... [https://www.nature.com/articles/s41598-022-18361-y]
- 21. Hyperuricemia and Insulin Resistance: Interplay ... [https://www.mdpi.com/2673-8937/5/3/30]
- 22. Progress in animal models for studying hyperuricemia - PMC [https://pmc.ncbi.nlm.nih.gov/articles/PMC12411503/]
- 23. Changes in blood glucose and metabolism ... [https://pmc.ncbi.nlm.nih.gov/articles/PMC11909573/]
- 24. The gut microbiome: a vital link to hyperuricemia, gout and ... [https://www.frontiersin.org/journals/endocrinology/articles/10.3389/fendo.2025.1643566/full]
- 25. Interpretive prediction of hyperuricemia and gout patients via ... [https://bmcmicrobiol.biomedcentral.com/articles/10.1186/s12866-025-04125-x]
- 26. Based on environmental chemical exposure [https://www.sciencedirect.com/science/article/pii/S0147651325007286]
- 27. Untargeted vs. Targeted Lipidomics—Understanding the ... [https://lipidomics.creative-proteomics.com/resource/untargeted-vs-targeted-lipidomics-understanding-the-differences.htm]
- 28. Lipidomics - Latest research and news [https://www.nature.com/subjects/lipidomics]
- 29. Recent advances in analytical strategies for mass ... [https://pmc.ncbi.nlm.nih.gov/articles/PMC7525665/]
- 30. The association between different lipid indices and ... [https://lipidworld.biomedcentral.com/articles/10.1186/s12944-025-02796-z]
- 31. Application of metabolomics by UHPLC - MS / MS in diagnostics and... [https://pmc.ncbi.nlm.nih.gov/articles/PMC8798321/]
- 32. Cross-Platform Comparison of Untargeted and Targeted ... [https://www.nature.com/articles/s41598-018-35807-4]
- 33. Tear Sampling and Biomarker : A Robust Workflow for... Discovery [https://www.mdpi.com/1422-0067/26/5/2041]
- 34. Mapping current research status and emerging frontiers of ... [https://pubmed.ncbi.nlm.nih.gov/40544396/]
- 35. NIST interlaboratory comparison exercise for lipidomics using ... [https://pmc.ncbi.nlm.nih.gov/articles/PMC5711491/]
- 36. Streamlining Lipidomics: Novel Statistical Workflows and ... [https://www.chromatographyonline.com/view/streamlining-lipidomics-novel-statistical-workflows-and-visualization-in-r-and-python]
- 37. Lipidome visualisation, comparison, and analysis in a vector ... [https://journals.plos.org/ploscompbiol/article?id=10.1371/journal.pcbi.1012892]
- 38. Metabolic phenotypes: Molecular bridges between health ... [https://pmc.ncbi.nlm.nih.gov/articles/PMC12615335/]
- 39. The effect of lipid metabolism disorder on patients with ... [https://www.nature.com/articles/s41598-023-45564-8]
- 40. Lipidomics coupled with pathway analysis characterizes ... [https://lipidworld.biomedcentral.com/articles/10.1186/s12944-019-1054-z]
- 41. Mechanism Study on the Preventive Effect of ELITEA ... [https://www.mdpi.com/2218-1989/15/5/336]
- 42. Metabolomics combined with metagenomics analysis ... [https://www.nature.com/articles/s41598-025-09048-1]
- 43. Identification of Therapeutic Targets for Hyperuricemia [https://pmc.ncbi.nlm.nih.gov/articles/PMC12109542/]
- 44. Metabolomic analysis of plasma improves the prediction ... [https://www.medrxiv.org/content/10.1101/2025.09.22.25336391v1.full]
- 45. Uric Acid as a Biomarker and a Therapeutic Target in ... [https://www.sciencedirect.com/science/article/abs/pii/S1499267114006388]
- 46. Enhanced lipidomics workflows for plasma and ... [https://www.sciencedirect.com/science/article/abs/pii/S0039914025003376]
- 47. Recent Developments in Biomarkers for Diagnosis and ... [https://pmc.ncbi.nlm.nih.gov/articles/PMC8907395/]
- 48. Unravelling lipid heterogeneity: Advances in single-cell ... [https://pmc.ncbi.nlm.nih.gov/articles/PMC12270072/]
- 49. Enhancing Lipidomics With High-Resolution Ion Mobility-Mass ... [https://pubmed.ncbi.nlm.nih.gov/40801397/]
- 50. Lipidomics in Biomarker Research - NCBI [https://www.ncbi.nlm.nih.gov/books/NBK584293/]
- 51. Sources of Variability in Serum Lipidomic Measurements ... [https://pmc.ncbi.nlm.nih.gov/articles/PMC10144665/]
- 52. Unveiling Lipidomics Quantitative Analysis: What, Why, ... [https://dmpkservice.wuxiapptec.com/articles/479-unveiling-lipidomics-quantitative-analysis-what-why-and-how/]
- 53. Associations of Plasma Lipidomic Profiles with Uric Acid ... [https://pmc.ncbi.nlm.nih.gov/articles/PMC11584823/]
- 54. LipidIN: a comprehensive repository for flash platform ... [https://www.nature.com/articles/s41467-025-59683-5]
- 55. Common Lipidomics Databases and Software [https://www.metwarebio.com/common-lipidomics-databases-and-software/]
- 56. Frontiers | NAFPD exacerbation by hyperlipidemia combined with hyperuricemia: a pilot rat experiment in lipidomics [https://www.frontiersin.org/journals/nutrition/articles/10.3389/fnut.2024.1437373/full]
- 57. Quantitative Lipidomics [https://www.metwarebio.com/quantitative-lipidomics/]
- 58. Analytical quality control in targeted lipidomics [https://www.sciencedirect.com/science/article/pii/S0003267025006191]
- 59. Quality control requirements for the correct annotation of ... [https://www.nature.com/articles/s41467-021-24984-y]
- 60. Concordant inter-laboratory derived concentrations of ... [https://www.nature.com/articles/s41467-024-52087-x]
- 61. Exploring lipidomics in biomarker discovery [https://www.sciencedirect.com/science/article/abs/pii/S0009898125005777]
- 62. Challenges in Lipidomics Biomarker Identification [https://pmc.ncbi.nlm.nih.gov/articles/PMC11356033/]
- 63. A Comprehensive and Reproducible Untargeted Lipidomic ... [https://pmc.ncbi.nlm.nih.gov/articles/PMC6572761/]
- 64. Lipidomics and metabolomics investigation into the effect of ... [https://pmc.ncbi.nlm.nih.gov/articles/PMC11416290/]
- 65. Network-based multi-omics integrative analysis methods in ... [https://pmc.ncbi.nlm.nih.gov/articles/PMC11954193/]
- 66. Advancing drug discovery through multiomics [https://www.ddw-online.com/advancing-drug-discovery-through-multiomics-37448-202510/]
- 67. 17 Important Data Visualization Techniques - HBS Online [https://online.hbs.edu/blog/post/data-visualization-techniques]
- 68. Data Visualizations, Charts, and Graphs - Digital Accessibility [https://accessibility.huit.harvard.edu/data-viz-charts-graphs]
- 69. AI-driven multi-omics integration for multi-scale predictive ... [https://www.sciencedirect.com/science/article/pii/S2001037024004513]
- 70. Biomarker discovery pipeline: 3 Critical Steps 2025 [https://lifebit.ai/blog/biomarker-discovery-pipeline/]
- 71. Biomarker Discovery and Validation: Statistical ... [https://www.sciencedirect.com/science/article/pii/S1556086421016634]
- 72. Evaluation of the Effects of High Uric Acid on Glucolipid ... [https://pmc.ncbi.nlm.nih.gov/articles/PMC12474470/]
- 73. The role of insulin resistance in the relationship between ... [https://www.frontiersin.org/journals/nutrition/articles/10.3389/fnut.2025.1660317/full]
- 74. [Expert consensus on urate-lowering therapy for high-risk ... [https://pubmed.ncbi.nlm.nih.gov/40624831/]
- 75. Revealing the hidden impact of SGLT2 inhibitors on uric ... [https://www.frontiersin.org/journals/endocrinology/articles/10.3389/fendo.2025.1667438/full]
- 76. New insights into gout management strategies and ... [https://www.news-medical.net/news/20250615/New-insights-into-gout-management-strategies-and-cardiovascular-outcomes.aspx]
- 77. The effects of diacylglycerol edible oil intervention in patients ... [https://trialsjournal.biomedcentral.com/articles/10.1186/s13063-024-08638-0]
- 78. Alterations in lipidome profiles distinguish early-onset ... [https://springernature.figshare.com/collections/Alterations_in_lipidome_profiles_distinguish_early-onset_hyperuricemia_gout_and_the_effect_of_urate-lowering_treatment/6962539]
- 79. Changes in Lipidome of Hyperuricemia and Gout Patients ... [https://www.docwirenews.com/post/changes-in-lipidome-of-hyperuricemia-and-gout-patients-has-significant-effect-on-lipid-metabolism]
- 80. GNPS - Alterations in lipidome profiles distinguish early ... [https://www.omicsdi.org/dataset/gnps/MSV000093082]
- 81. è¥å…»ä¸Žå¥åº·ç ”究所尹慧勇团队利用代谢组å¦ä¸Žæœºå™¨å¦ä¹ åˆä½œ ... [http://www.sinh.cas.cn/jdtw/202307/t20230710_6807842.html]
- 82. Integrating Renal and Metabolic Parameters into a Derived ... [https://www.mdpi.com/1648-9144/61/11/2042]
- 83. Lipidomic analysis reveals metabolism alteration ... [https://pubmed.ncbi.nlm.nih.gov/40176064/]
- 84. Clinical Implications and a Risk Identification Algorithm [https://pubmed.ncbi.nlm.nih.gov/41154282/]