AmpliSeq for Illumina Library QC: A Complete Guide to BioAnalyzer and Fragment Analyzer Troubleshooting
This comprehensive guide details the essential quality control (QC) and troubleshooting protocols for AmpliSeq for Illumina libraries using the Agilent BioAnalyzer and Fragment Analyzer systems.
AmpliSeq for Illumina Library QC: A Complete Guide to BioAnalyzer and Fragment Analyzer Troubleshooting
Abstract
This comprehensive guide details the essential quality control (QC) and troubleshooting protocols for AmpliSeq for Illumina libraries using the Agilent BioAnalyzer and Fragment Analyzer systems. Tailored for researchers and scientists, it covers foundational principles of library QC, step-by-step methodological applications, systematic troubleshooting for common issues like adapter dimers and low yield, and validation strategies for complex samples such as FFPE. By integrating practical insights with current best practices, this article empowers professionals to generate high-quality sequencing data, optimize library preparation efficiency, and ensure reliable results across diverse research applications from cancer genomics to agrigenomics.
Understanding AmpliSeq Library QC: Fundamentals of the BioAnalyzer and Fragment Analyzer
AmpliSeq for Illumina represents a advanced targeted resequencing solution that utilizes a highly multiplexed PCR-based workflow to enable deep sequencing of specific genomic regions. This technical support document provides a comprehensive overview of the AmpliSeq technology, detailing its complete workflow from library preparation to data analysis, highlighting its key benefits in disease research, and presenting its primary applications in cancer and inherited disease studies. The document further includes extensive troubleshooting guides and frequently asked questions to assist researchers in optimizing their experiments, with particular emphasis on library quality control using the BioAnalyzer and Fragment Analyzer systems. By framing this content within the broader context of AmpliSeq library QC and troubleshooting research, this resource serves as an essential reference for scientists, researchers, and drug development professionals implementing targeted sequencing approaches in their experimental workflows.
AmpliSeq for Illumina is a comprehensive targeted resequencing solution offering both ready-to-use and customizable panels designed for use with low-input DNA and RNA samples. This technology delivers robust performance with tailored content for disease research, enabling investigators to focus on specific genomic regions of interest with exceptional efficiency and precision. The core methodology employs a highly multiplexed PCR-based workflow for amplicon sequencing that maintains robust performance even with challenging sample types such as FFPE tissue, blood, saliva, and cell-free DNA [1].
The system provides flexible content design options to accommodate diverse research needs. Ready-to-Use Panels offer predesigned sequencing panels that target important genes with known relevance to specific diseases or phenotypes, providing a standardized approach for common research applications. For more specialized investigations, Custom Panels can be created using Illumina's DesignStudio Assay Design Tool, which allows researchers to design panels optimized for their specific genomic content of interest. Additionally, Community Panels contain content selected with input from leading disease researchers, while On-Demand Panels enable researchers to select from a catalog of pretested genes with known relevance for inherited disease research [1].
A key advantage of AmpliSeq technology lies in its ability to target a wide range of genomic content, from a few genes to hundreds of genes, in a single run. This scalability makes it particularly valuable for research applications requiring focused yet comprehensive genomic analysis. The technology achieves robust performance with minimal input material, requiring as little as 1 ng of DNA or cDNA, making it suitable for precious or limited samples commonly encountered in clinical research settings [1].
Workflow and Experimental Protocol
The AmpliSeq for Illumina workflow follows a streamlined, integrated process from library preparation through data analysis, with total library preparation requiring approximately 5-7 hours with only 1.5 hours of hands-on time [1]. The sequencing phase typically requires 17-32 hours, with data analysis time varying based on the specific application and computational resources available. Below is a comprehensive visual representation of the complete experimental workflow:
Library Preparation Protocol
Library preparation begins with multiplexed PCR amplification of targeted genomic regions using as little as 1 ng of DNA or cDNA input [1]. This initial amplification step simultaneously targets hundreds to thousands of specific genomic regions in a single reaction, significantly reducing hands-on time compared to traditional approaches. The highly multiplexed nature of this PCR reaction enables comprehensive coverage of targeted regions while conserving precious sample material.
Following PCR amplification, the remaining primers are enzymatically digested to prevent interference with subsequent sequencing steps. The purified amplicons then undergo processing to attach Illumina sequencing adapters, creating final libraries ready for sequencing. The entire library preparation process is optimized for efficiency and reproducibility, with careful attention to eliminating contaminants that could compromise results [2].
Library Quality Control
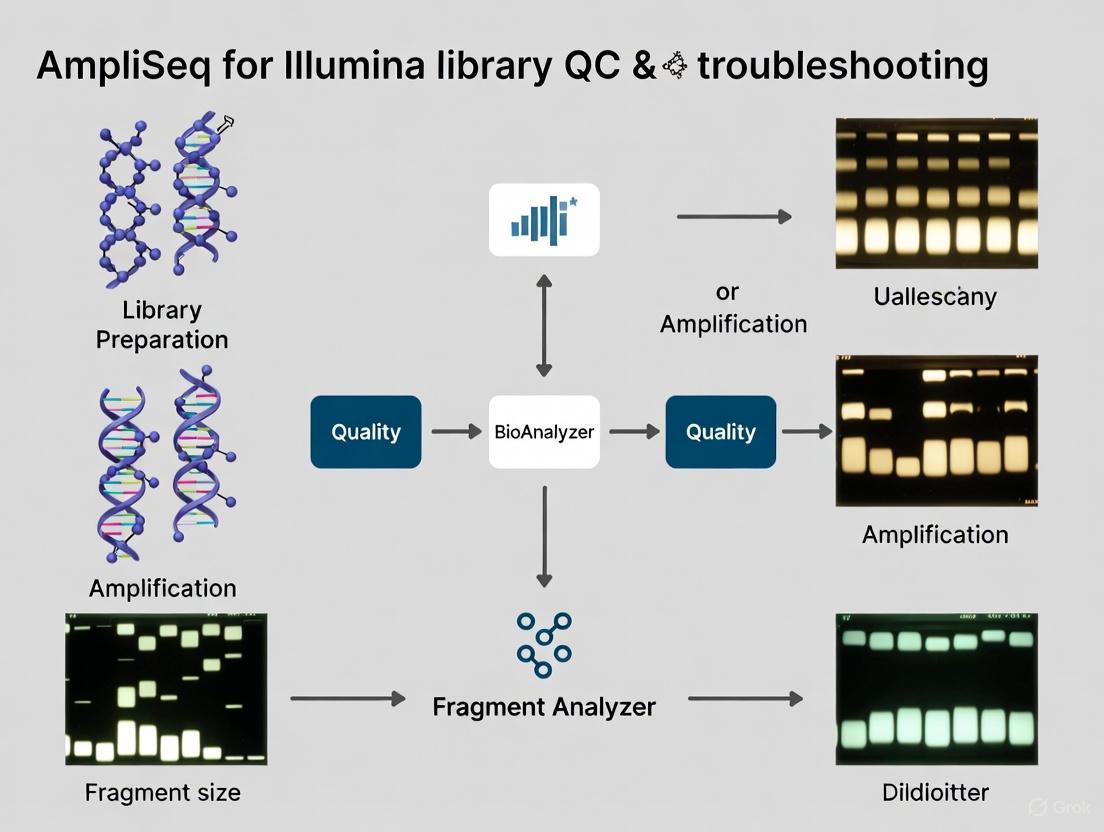
Library QC represents a critical step in the AmpliSeq workflow, ensuring that only high-quality libraries proceed to sequencing. Instruments such as the Agilent Bioanalyzer or Fragment Analyzer are essential tools for assessing library quality prior to sequencing [3] [4]. These systems provide critical information about library characteristics, including:
- Expected Average Library Size: Confirming that the library fragments fall within the expected size range for the specific panel used.
- Library Peak Presence: Verifying that a distinct library peak is visible in the trace, indicating successful library construction.
- Absence of Additional Peaks: Ensuring the lack of additional small or large library peaks that might indicate adapter dimers, primer artifacts, or other contaminants.
Ideal library traces display a single, well-defined peak with minimal background or additional peaks. Deviations from this pattern may indicate issues requiring troubleshooting before proceeding to sequencing. Common problematic phenotypes include multiple peaks, broad size distributions, or shifts in expected fragment sizes, all of which can negatively impact sequencing performance and data quality [3].
Sequencing and Data Analysis
AmpliSeq for Illumina products are compatible with all Illumina sequencing systems, with benchtop sequencing systems being most commonly employed [1]. Sequencing leverages Illumina's widely adopted Sequencing by Synthesis (SBS) chemistry, which provides highly accurate base calling across all supported platforms.
Data analysis can be performed through multiple pathways depending on available resources and preferences. The DRAGEN Amplicon pipeline on BaseSpace Sequence Hub provides cloud-based secondary analysis, including alignment against reference genomes and small variant calling [1]. For RNA applications, the DRAGEN RNA Amplicon pipeline performs differential expression analysis and gene fusion calling. Alternatively, Local Run Manager enables on-instrument analysis, delivering accurate results without extensive bioinformatics resources. Tertiary analysis is available through Correlation Engine for more advanced investigative applications [1].
Benefits and Advantages
AmpliSeq for Illumina offers numerous compelling benefits that make it particularly valuable for targeted sequencing applications in research settings. The technology's specialized approach provides distinct advantages over broader sequencing methods, especially for focused research questions. The table below summarizes the key benefits and their practical implications for researchers:
Table 1: Key Benefits of AmpliSeq for Illumina Technology
| Benefit | Technical Advantage | Research Impact |
|---|---|---|
| High Sensitivity | Capable of detecting variants at low allele frequencies (down to 0.2%) [5] | Enables identification of rare somatic variants and subclonal populations |
| Low Input Requirements | Robust performance with as little as 1 ng of DNA or cDNA input [1] | Facilitates analysis of precious or limited samples (FFPE, biopsies, cfDNA) |
| Workflow Efficiency | Library prep in ~5-7 hr total with only 1.5 hr hands-on time [1] | Increases laboratory throughput and reduces technical labor requirements |
| Deep Sequencing Capability | Enables sequencing to high depth (500-1000× or higher) [5] | Allows identification of rare variants with high confidence |
| Focused Data Generation | Produces smaller, more manageable datasets compared to WGS [6] | Reduces data analysis burden and storage requirements |
| Multiplexing Flexibility | Capability to target from a few to hundreds of genes in a single run [1] | Provides cost-effective solution for both small and larger gene panels |
The AmpliSeq approach is particularly advantageous when compared to other targeted sequencing methods. When evaluating targeted sequencing strategies, researchers must consider the specific requirements of their application to select the most appropriate methodology. The following comparison highlights the key distinctions between AmpliSeq and alternative approaches:
Table 2: Comparison of Targeted Sequencing Methods
| Parameter | AmpliSeq (Amplicon Sequencing) | Target Enrichment |
|---|---|---|
| Optimal Gene Content | Smaller content, typically < 50 genes [5] | Larger content, typically > 50 genes [5] |
| Variant Detection | Ideal for SNVs and insertions/deletions (indels) [5] | More comprehensive profiling for all variant types [5] |
| Workflow Characteristics | More affordable, easier workflow [5] | More comprehensive method with longer hands-on time [5] |
| Turnaround Time | Faster library prep assay time [5] | Longer library prep assay time [5] |
| Input Requirements | Compatible with low-input samples (1 ng DNA or cDNA) [1] | Varies by specific enrichment method |
The AmpliSeq technology demonstrates particular strength in applications requiring high sensitivity for variant detection, efficient use of limited sample material, and rapid turnaround times. The highly multiplexed PCR approach provides uniform coverage across targeted regions while maintaining efficiency and reproducibility across diverse sample types.
Key Applications
AmpliSeq for Illumina panels support diverse research applications across multiple disease areas and biological disciplines. The technology's flexibility in content design and robustness across sample types makes it suitable for addressing various research questions. The primary application areas include:
Cancer Research
In cancer research, AmpliSeq panels enable comprehensive profiling of somatic variants in solid tumors and hematological malignancies. The AmpliSeq for Illumina Focus Panel represents a prominent solution, targeting 52 genes with known relevance to solid tumors [1]. This panel facilitates simultaneous investigation of DNA and RNA from the same sample, providing a comprehensive view of genomic alterations driving oncogenesis. For immuno-oncology applications, the AmpliSeq for Illumina TCR beta-SR Panel specifically sequences T-cell receptor beta chain rearrangements, enabling assessment of T-cell diversity and clonal expansion in tumor samples [1]. This application is particularly valuable for evaluating tumor microenvironment characteristics and monitoring immunotherapeutic responses.
Inherited and Rare Diseases
AmpliSeq technology provides an efficient solution for identifying causative variants associated with rare and inherited genetic disorders. The deep coverage capabilities (500-1000× or higher) enable confident detection of novel or inherited mutations in a single assay [5]. The On-Demand panel option allows researchers to select from a catalog of pretested genes with known content relevant for inherited disease research, facilitating rapid panel design for specific Mendelian disorders [1]. This application demonstrates particular utility in sequencing key genes of interest to high depth, allowing identification of rare variants that may be missed by broader sequencing approaches [5].
Infectious Disease and Microbiology
In infectious disease research, AmpliSeq panels support hypothesis-free pathogen detection and characterization. As a targeted sequencing method, AmpliSeq can distinguish between infectious disease strains that differ by as little as one single nucleotide polymorphism (SNP), effectively replacing multiple targeted tests with a single comprehensive assay [5]. This application is particularly valuable for genomic surveillance of respiratory pathogens, antimicrobial resistance gene detection, and outbreak investigation.
Other Research Applications
Additional applications include preimplantation genetic screening (PGS) for determining chromosomal status of embryos in IVF research [5], cardiac conditions for investigating inherited cardiomyopathies and arrhythmias, and autism research for identifying associated genetic variants. The flexibility of custom panel design further extends these applications to specialized research areas requiring investigation of specific pathways or genomic regions.
Research Reagent Solutions
Successful implementation of AmpliSeq for Illumina workflows requires specific reagents, instruments, and analytical tools. The following table details essential components for establishing a complete AmpliSeq workflow in a research setting:
Table 3: Essential Research Reagent Solutions for AmpliSeq Workflows
| Component | Function | Examples/Specifications |
|---|---|---|
| Library Prep Kits | Amplify target regions and attach sequencing adapters | AmpliSeq for Illumina Custom DNA Panel, Illumina DNA Prep with Enrichment [1] [5] |
| Sequencing Panels | Target specific genomic regions of interest | Ready-to-Use Panels, Custom Panels (designed in DesignStudio) [1] |
| QC Instruments | Assess library quality and quantity | Agilent Bioanalyzer, Fragment Analyzer [3] [4] |
| Sequencing Systems | Perform high-throughput sequencing | iSeq 100, MiSeq, NextSeq series, NovaSeq X Series [1] [6] |
| Analysis Software | Process and interpret sequencing data | DRAGEN Amplicon pipeline, Local Run Manager, BaseSpace Sequence Hub [1] |
| Design Tools | Create custom panel content | DesignStudio Assay Design Tool [1] |
Each component plays a critical role in ensuring successful targeted sequencing experiments. Library preparation kits provide all necessary reagents for target amplification and library construction, while sequencing panels determine the specific genomic regions that will be captured. Quality control instruments are essential for verifying library integrity before sequencing, and sequencing systems provide the platform for actual data generation. Analysis software enables conversion of raw sequencing data into biologically meaningful results, and design tools facilitate creation of custom panels tailored to specific research needs.
Troubleshooting Guides
Library Quality Control Issues
Problem: Abnormal library trace on BioAnalyzer/Fragment Analyzer
- Symptoms: Multiple peaks, smearing, or shift in expected fragment size distribution on BioAnalyzer/Fragment Analyzer trace [3] [4].
- Possible Causes:
- Primer dimer formation due to inefficient primer digestion
- Incomplete PCR amplification
- Sample degradation or impurities
- Incorrect quantification leading to suboptimal loading
- Solutions:
- Verify proper primer digestion enzyme activity and incubation conditions
- Check PCR component concentrations and thermal cycler performance
- Assess sample quality prior to library preparation using appropriate QC methods
- Ensure accurate library quantification and adhere to recommended loading concentrations
- Implement contamination prevention practices, including separate pre- and post-PCR work areas [2]
Problem: Low library yield
- Symptoms: Insufficient library concentration for sequencing after amplification and purification.
- Possible Causes:
- Insufficient input DNA/RNA quantity or quality
- PCR inhibition due to sample contaminants
- Inefficient purification with significant sample loss
- Suboptimal primer design or annealing conditions for custom panels
- Solutions:
- Verify input DNA/RNA quantity and quality using fluorometric methods
- Include positive control samples to monitor overall workflow performance
- Evaluate purification efficiency and consider alternative purification methods if necessary
- For custom panels, utilize DesignStudio design recommendations and avoid problematic genomic regions
Sequencing Performance Issues
Problem: Low cluster density on MiSeq
- Symptoms: Below optimal cluster density resulting in insufficient data yield [7].
- Possible Causes:
- Inaccurate library quantification
- Over-diluted library loaded onto flow cell
- Library quality issues affecting cluster generation
- Flow cell defects or improper storage
- Solutions:
- Utilize multiple quantification methods (qPCR, fluorometry) for cross-verification
- Follow manufacturer's recommendations for library loading concentrations
- Perform thorough library QC including BioAnalyzer/Fragment Analyzer assessment
- Inspect flow cell for visible defects and ensure proper storage conditions
Problem: MiSeq Read 2 low intensity and quality scores
- Symptoms: Degradation of quality metrics in later sequencing cycles [7].
- Possible Causes:
- Reagent delivery issues in later sequencing cycles
- Flow cell aging or performance degradation
- Cluster density too high or too low
- Contaminants affecting sequencing chemistry
- Solutions:
- Verify proper instrument function and reagent delivery
- Monitor flow cell usage and performance history
- Optimize library loading concentration to achieve appropriate cluster density
- Ensure library purification to remove potential contaminants
Frequently Asked Questions
Q1: What analysis options are available for AmpliSeq for Illumina data? A: AmpliSeq for Illumina data can be analyzed with user-friendly secondary analysis workflows either in the cloud via the DRAGEN Amplicon pipeline or on-instrument via Local Run Manager [1]. The DRAGEN DNA Amplicon workflow aligns reads against reference genomes and calls small variants, while DRAGEN RNA Amplicon performs differential expression analysis and gene fusion calling. Tertiary analysis is available through Correlation Engine for more advanced investigative applications.
Q2: Which Illumina sequencing systems are compatible with AmpliSeq for Illumina panels? A: AmpliSeq for Illumina products are compatible with all Illumina sequencing systems, though users most often utilize benchtop sequencing systems such as the iSeq 100, MiSeq, or NextSeq series [1]. System selection depends on required throughput, read length requirements, and desired run time.
Q3: How can I design a custom panel if my genes of interest are not available in a ready-to-use panel? A: If genes of interest are not available in a ready-to-use panel, researchers can use the DesignStudio Assay Design Tool to create an AmpliSeq for Illumina Custom Panel [1]. DesignStudio is a free web-based assay design software that enables researchers to submit target regions of interest and receive personalized panel content customized for their specific study requirements.
Q4: What are the key characteristics of an ideal library trace on the BioAnalyzer/Fragment Analyzer? A: An ideal final library trace should display a clear, single peak at the expected average library size with minimal additional peaks or background signal [3]. The trace should confirm the presence of a distinct library peak and the absence of additional small and large library peaks that might indicate adapter dimers, primer artifacts, or other contaminants that could interfere with sequencing performance.
Q5: How do I transition my existing targeted sequencing workflows to AmpliSeq for Illumina? A: Illumina provides specific resources for transitioning existing workflows to AmpliSeq for Illumina, including the resource "Transitioning to AmpliSeq for Illumina on the iSeq 100 System" [1]. For additional assistance with workflow transition, researchers can contact Illumina Technical Support or consult with an Illumina sales representative for personalized guidance.
Q6: What steps can I take to prevent contamination in AmpliSeq library preparation? A: Prevention of PCR contamination is critical for successful AmpliSeq experiments. Best practices include maintaining physical separation of pre- and post-PCR workspaces, using dedicated equipment and reagents for each area, implementing thorough cleaning protocols, and utilizing ultraviolet irradiation of workstations when appropriate [2]. These measures minimize the potential for PCR contamination that could compromise experimental results.
Technical FAQs: Core Principles and Instrumentation
FAQ 1: What is the fundamental role of capillary electrophoresis systems like the Bioanalyzer and Fragment Analyzer in NGS library preparation?
Capillary Electrophoresis (CE) instruments are critical for Quality Control (QC) prior to sequencing. They provide an objective assessment of your library's size distribution, concentration, and overall integrity [8]. By automating parallel capillary electrophoresis, these systems generate an electrophoretic trace that allows you to confirm the expected average library size, verify the presence of a primary library peak, and, crucially, check for the absence of contaminants or by-products that could compromise sequencing efficiency and data output [3] [9]. This step is essential for ensuring that your library is "good to sequence."
FAQ 2: How do the Bioanalyzer and Fragment Analyzer differ in their practical use?
The primary difference lies in their throughput and design, which should be matched to your lab's needs. The Bioanalyzer is a chip-based system with a capacity to analyze approximately 11-12 samples per run. In contrast, the Fragment Analyzer is a plate-based system capable of handling multiple 96-well plates in a single run, making it the preferred solution for high-throughput NGS laboratories and large-scale projects [9]. While both provide essential QC data, their resolution, sensitivity, and dynamic range can vary, leading to differences in the appearance of the library trace for the same sample [9].
FAQ 3: Why is it recommended to combine capillary electrophoresis with other quantification methods like fluorometry or qPCR?
Microfluidic CE systems are excellent for analyzing relative size distribution and identifying contaminants, but they should be complemented with other methods for accurate quantification [9]. Fluorometric methods (e.g., Qubit dsDNA HS Assay) provide highly sensitive concentration measurements without being influenced by contaminants like salts or free nucleotides. qPCR-based quantification is considered the gold standard for determining the concentration of amplifiable library fragments because it uses primers targeting the adapter sequences, ensuring only fully functional library molecules are counted. This is vital for achieving equal read distribution across samples during sequencing [9].
Troubleshooting Guides: Interpreting Your Library Trace
A high-quality NGS library trace should show a single, sharp peak within the expected size range. The table below outlines common anomalies, their causes, and corrective actions.
| Observed Anomaly | Potential Causes | Corrective & Preventive Actions |
|---|---|---|
| Adapter Dimer Peak (~120-130 bp) [9] | • Inefficient purification post-ligation• Overcycling during PCR amplification | Re-purify the library using bead-based clean-up to remove short fragments. If substantial (>3% of total), re-purify before sequencing to avoid loss of useful reads [9]. |
| Primer Dimer / Residual Primer Peaks (smaller than main peak) [9] | • Inefficient cleanup after the enzymatic reaction or amplification steps. | Re-purify the library to remove excess primers. Optimize cleanup protocols to prevent recurrence [9]. |
| "Bubble Product" / High Molecular Weight Smear or "Bump" [9] | • Overcycling during the final library amplification PCR, leading to formation of aberrant products. | Re-run the library prep using a lower number of PCR cycles. Use a qPCR assay to determine the optimal cycle number to prevent overamplification, which reduces library complexity and increases duplication rates [9]. |
| Broader-than-expected Peak or Multiple Peaks | • Overcycling (can cause broad size distribution) [9]• Non-specific amplification• DNA input quality issues (e.g., degradation) | • Use qPCR to determine the optimal cycle number [9].• Check the quality of the input DNA/RNA.• Optimize PCR conditions and enzyme. |
| No Peak or Very Low Peak | • Undercycling during PCR [9]• Failed library preparation reaction• Extremely low input | • Add additional PCR cycles if the yield is too low for accurate quantification [9].• Check reagent integrity and reaction setup.• Verify input quantity and quality. |
Workflow for Systematic Library QC and Troubleshooting
The following diagram illustrates a logical workflow for quality control and troubleshooting using CE systems, integrating key decision points based on your trace results.
Essential Research Reagent Solutions for Library QC
Successful library QC relies on a suite of specific reagents and tools. The table below details essential materials and their functions.
| Research Reagent / Tool | Primary Function in NGS Library QC |
|---|---|
| Bioanalyzer High Sensitivity DNA Kit | Provides the reagents (dye, gel matrix, ladder) for chip-based analysis of DNA libraries, enabling high-resolution sizing and quantification in the pg/µL range [9]. |
| Fragment Analyzer Capillary Array & Kit | The consumable for plate-based systems that enables automated, parallel capillary electrophoresis for nucleic acid QC. Different kits are available for various size ranges and sensitivities [8]. |
| dsDNA HS Qubit Assay | A fluorometric method for highly specific and sensitive quantification of double-stranded DNA library concentration. It is not affected by salts, free nucleotides, or RNA [9]. |
| qPCR Library Quantification Kit | Uses primers against Illumina adapter sequences to quantify only amplifiable, fully-formed library fragments. This is critical for normalizing library concentrations for balanced sequencing coverage [9]. |
| Size Standard / Ladder | A molecular weight marker run alongside samples on CE systems to accurately determine the fragment size of the library peak[s] [9]. |
| Solid Phase Reversible Immobilization (SPRI) Beads | Used for post-ligation and post-amplification library clean-up to remove unwanted by-products like adapter dimers and residual primers [9]. |
Why Library Quality Control is Crucial
In modern Next-Generation Sequencing (NGS) workflows, library preparation is a pivotal step that can determine the success or failure of an entire sequencing run. It is estimated that over 50% of failures or suboptimal runs can be traced back to issues encountered during library preparation [10]. Proper Quality Control (QC) ensures that your libraries have the correct concentration, size distribution, and purity to achieve balanced cluster generation and optimal yield on the sequencer, preventing wasted resources and time [10] [11].
This guide will help you interpret your library traces from instruments like the Agilent Bioanalyzer and Fragment Analyzer, enabling you to identify an ideal library and troubleshoot common problems.
The Ideal Library Trace
An ideal final library trace indicates a high-quality library ready for sequencing.
- Size Distribution: The library should appear as a single, narrow peak within the expected size range for your specific protocol (e.g., approximately 200–600 bp for many Illumina libraries) [10]. The trace should be a smooth curve that returns to the baseline [12].
- Peak Shape: The peak should be unimodal (a single, main peak) and symmetric, indicating a uniform population of library fragments [3].
- Concentration: The library should be quantified using appropriate methods like fluorometry (e.g., Qubit) and qPCR to ensure accurate molar concentration of amplifiable fragments [9] [11].
The following diagram illustrates the key stages of a typical NGS library preparation workflow and the critical QC checkpoints.
Troubleshooting Common Library Trace Anomalies (FAQs)
What does a peak at the lower size range (around 100-150 bp) indicate?
A sharp peak in the 100-150 bp region typically indicates the presence of adapter dimers [9]. These are by-products formed when sequencing adapters ligate to each other instead of to your target DNA fragments.
- Cause: Often due to inefficient clean-up steps after adapter ligation or using an suboptimal adapter-to-insert ratio [10].
- Solution: Re-purify the library using magnetic beads (e.g., AMPure XP) to remove short fragments. If the adapter dimer peak accounts for >3% of the total trace, it is best to re-purify before sequencing, as these dimers will compete for sequencing capacity and generate non-informative reads [9].
- Prevention: Optimize ligation conditions and ensure thorough clean-up after adapter ligation.
Why does my library trace show a high molecular weight "bump" or bubble product?
A high molecular weight "bump" is a classic sign of PCR over-amplification or "overcycling" [9].
- Cause: When too many PCR cycles are used, the reaction components become exhausted, leading to the formation of aberrant products and hybrid molecules [9].
- Impact: While these libraries may still be sequenceable, quantification is impaired, which can lead to unequal read distribution between samples. Overamplification also increases duplication rates and reduces library complexity, potentially skewing biological conclusions [9].
- Solution: Use a qPCR assay to determine the optimal number of PCR cycles for your library instead of using a fixed, high cycle number [9].
What does a broad or multi-peak trace signify?
A broad, smeared, or multi-peaked size distribution often points to issues during the fragmentation step [10].
- Cause:
- Over-fragmentation: Produces a majority of fragments that are too short.
- Under-fragmentation: Results in many fragments that are too long.
- Inconsistent fragmentation: Can be due to uneven enzymatic digestion or inconsistent mechanical shearing [10].
- Solution: Optimize and calibrate your fragmentation method (e.g., sonication time/duration, enzyme concentration, or digestion time) to achieve a tight, unimodal distribution of fragments [10].
My library yield is low, but the trace looks good. Is it sequenceable?
A good-looking trace with low yield can often be sequenced, but it requires accurate quantification.
- Explanation: Fluorometric methods (e.g., Qubit) measure total double-stranded DNA concentration but cannot distinguish between adapter-ligated molecules and other by-products [9] [11].
- Solution: Use qPCR-based quantification for the most accurate results. This method uses primers targeting the adapter sequences and therefore selectively quantifies only molecules that are fully functional and capable of being sequenced [9] [11]. This concentration is crucial for accurate loading on the flow cell.
Library Quantification and QC Methods
Different quantification methods provide different information. The table below summarizes the common techniques used in NGS QC.
| Method | What It Measures | Primary Use | Notes and Limitations |
|---|---|---|---|
| Fluorometry (e.g., Qubit) [11] | Concentration of total dsDNA (or ssDNA/RNA) | General nucleic acid quantification | Does not distinguish between adapter-ligated fragments and other DNA (e.g., adapter dimers) [9]. |
| qPCR [9] [11] | Concentration of amplifiable, adapter-ligated fragments | Most accurate method for sequencing loading calculations | Does not provide information about size distribution or purity [9]. |
| Microfluidic Capillary Electrophoresis (e.g., Bioanalyzer, TapeStation) [9] [11] | Size distribution, profile shape, and presence of contaminants | Quality control and size verification | Generally not recommended for absolute quantification, though it can be used for it for certain library types [11]. |
| UV Spectrophotometry (e.g., Nanodrop) | Concentration of total nucleic acids and contaminants | Assessing sample purity (A260/280 ratio) | Not recommended for library quantification due to inaccuracy and inability to detect contaminants like adapter dimers [11]. |
Essential Reagents and Tools for Library QC
The following table lists key materials and instruments essential for effective library QC and troubleshooting.
| Tool or Reagent | Function |
|---|---|
| Agilent Bioanalyzer [4] [3] | Chip-based system for analyzing library size distribution and quality using microfluidic capillary electrophoresis. Typically analyzes 11-12 samples per run. |
| Agilent TapeStation [9] [12] | Automated electrophoresis system that uses screen tapes for library QC. A common alternative to the Bioanalyzer. |
| Fragment Analyzer [4] [3] | Plate-based capillary electrophoresis system for high-throughput library QC, capable of handling multiple 96-well plates. |
| Qubit Fluorometer [9] | Benchtop fluorometer used with dsDNA HS (High Sensitivity) assays for accurate concentration measurement of purified libraries. |
| qPCR Kits (e.g., Kapa SYBR Green) [9] | Used for accurate quantification of amplifiable library fragments by targeting adapter sequences, providing the concentration needed for sequencing. |
| SPRIselect / AMPure XP Beads [10] | Magnetic beads used for post-ligation and post-amplification clean-up to purify libraries and remove unwanted short fragments like adapter dimers. |
The AmpliSeq workflow requires stringent quality control at multiple stages to ensure the generation of high-quality, reliable sequencing data. The diagram below maps the entire process and its six critical QC checkpoints.
Detailed QC Checkpoints and Troubleshooting
This section provides the quantitative standards for each QC checkpoint and guides troubleshooting for common failures.
Table 1: Critical QC Checkpoints and Acceptance Criteria
| Checkpoint | Metric | Acceptance Criteria | Potential Impact of Failure |
|---|---|---|---|
| QC1: Pre-DNA Extraction | Tumor Content | ≥ 10% [13] | High false-negative rate due to low variant allele frequency [13] |
| Tissue Sufficiency | 8 unstained slides (5 µm each) [13] | Insufficient DNA yield for library preparation [13] | |
| QC2: DNA Quantification | DNA Concentration | ≥ 1.7 ng/µL [13] | Incomplete coverage and amplicon drop-outs [13] |
| QC3: DNA Quality | Q129/Q41 Ratio | ≥ 0.4 [13] | Poor library complexity and biased amplification [13] |
| QC4: Library Quantification | Library Concentration | ≥ 100 pM [13] | Low sequencing yield and poor chip loading [13] |
| QC5: Post-emulsification PCR | Templated ISPs | 10% to 30% [13] | Suboptimal sequencing throughput [13] |
| QC6: Post-Sequencing | Coverage Uniformity | > 90% [13] | Inconsistent detection of variants across targets [13] |
| Amplicons with 500x Coverage | ≥ 95% [13] | Increased risk of false negatives in low-coverage regions [13] |
Frequently Asked Questions (FAQs)
Q1: My DNA input passes concentration QC (QC2) but fails the DNA quality check (QC3). What does this mean and how can I proceed? A1: A pass in QC2 but a fail in QC3 indicates that you have a sufficient quantity of DNA, but the DNA is highly fragmented or degraded. This is common with FFPE samples. The Q129/Q41 ratio is a measure of DNA integrity; a low ratio (<0.4) suggests the DNA fragments are too short for successful amplification of all targets [13]. To proceed:
- Re-assess the tumor area and percentage on the slide to ensure you are macro-dissecting the best region.
- If possible, extract DNA from a different, less degraded FFPE block.
- Consider using a specialized DNA repair protocol prior to library preparation, though this requires re-validation.
Q2: My library quantification (QC4) is below the 100 pM threshold. What are the likely causes and solutions? A2: A low library concentration often stems from issues in earlier steps.
- Primary Cause: The most common cause is insufficient or degraded input DNA, as indicated by failures in QC2 or QC3 [13].
- Other Causes: Inefficient amplification during the initial PCR cycles or losses during clean-up steps (e.g., with SPRI beads) can also be responsible [14].
- Solutions:
- Troubleshoot backwards: Re-check the input DNA quality and quantity.
- Ensure the AMPure XP bead clean-up steps are performed with precise ratios to recover the desired fragment sizes and remove adapter dimers [14].
- Repeat the library preparation with a new DNA aliquot if available.
Q3: What should I do if the post-sequencing metrics (QC6) show that my sample has low on-target reads (<90%)? A3: Low on-target reads indicate that a significant portion of your sequencing data is not aligning to the intended AmpliSeq panel targets.
- Investigate Library Specificity: This problem often originates from non-specific amplification during library prep. Verify that the primer pools are correctly constituted and that the PCR conditions are optimal.
- Check for Contamination: Assess the possibility of foreign DNA contamination (e.g., microbial) in the sample or reagents.
- Review Probe Design: For custom panels, review the probe design for specificity.
Q4: Why is it critical to use a dedicated FFPE QC cell line throughout the entire workflow? A4: Incorporating a well-characterized FFPE QC cell line (e.g., one with known variants at specific allelic frequencies) acts as a systemic control. It helps to:
- Detect process variations due to changes in reagent lots or instrument performance [13].
- Verify the sensitivity and specificity of the entire wet-bench and bioinformatics workflow [13].
- Ensure that the test can reliably detect variants at the established limit of detection (e.g., 5% allelic frequency) [13]. A failure of this QC material mandates investigation and repetition of the run, preventing the reporting of potentially inaccurate results from patient samples.
The Scientist's Toolkit: Essential Research Reagents
Table 2: Key Reagents and Their Functions in the AmpliSeq Workflow
| Reagent / Kit | Function |
|---|---|
| KAPA hgDNA Quantification and QC Kit | Precisely quantifies human gDNA and assesses its quality/degradation status via the Q129/Q41 ratio, a critical pre-library preparation step [13]. |
| AMPure XP SPRI Beads | Purifies and size-selects DNA fragments after enzymatic steps (end-repair, A-tailing, adapter ligation). This step is crucial for removing adapter dimers and selecting the optimal insert size for sequencing [14]. |
| AmpliSeq Library Kit | Contains the ultrahigh multiplex PCR reagents and bespoke primer pools to specifically amplify the targeted genomic regions of interest from the input DNA [15]. |
| FFPE QC Cell Line | A characterized control sample (e.g., with known somatic variants) processed alongside patient samples to monitor the performance and accuracy of the entire end-to-end workflow [13]. |
| QIAquick PCR Purification Columns | An alternative to SPRI beads for purifying and concentrating DNA after enzymatic reactions, though less scalable for high-throughput workflows [14]. |
Accurate library quality control (QC) is a critical prerequisite for successful next-generation sequencing (NGS). Proper QC ensures that your libraries have the expected size distribution, concentration, and purity to generate high-quality sequencing data. This guide provides a comprehensive overview of the essential tools, kits, and methodologies for effective library QC, with a focus on troubleshooting common issues that researchers encounter during their experiments.
Research Reagent Solutions for Library Quantification
The table below summarizes key reagents and kits essential for accurate NGS library quantification:
Table 1: Essential Research Reagents for Library QC
| Reagent/Kits | Primary Function | Key Features | Platform Compatibility |
|---|---|---|---|
| KAPA Library Quantification Kits [16] [17] | qPCR-based quantification of NGS libraries | Contains KAPA SYBR FAST qPCR Master Mix, platform-specific primer premix, and pre-diluted DNA standards; enables quantification of only sequencing-competent fragments | Illumina and Ion Torrent platforms; multiple instrument-specific formulations available |
| NEBNext Library Quant Kit for Illumina [18] | qPCR-based quantification of Illumina libraries | Provides six pre-diluted DNA standards for broader standard curve; single extension time for all libraries; includes ROX for instrument normalization | Specifically optimized for Illumina platforms |
| Agilent Bioanalyzer [3] [4] | Microfluidic electrophoresis for library size distribution analysis | Assesses library size, distribution, and detects contaminants like adapter dimers | Compatible with various NGS platforms for quality assessment |
| Fragment Analyzer [3] [4] | Capillary electrophoresis for library QC | Similar to Bioanalyzer; provides detailed information on library fragment size distribution and quality | Compatible with various NGS platforms for quality assessment |
| NuQuant [19] | Novel fluorescent quantification method | Rapid, accurate quantification without multiple manual steps; reduces user-to-user variability | Alternative to qPCR and fluorometry for library quantification |
Library QC and Troubleshooting Workflow
The following diagram illustrates the logical workflow for comprehensive library quality control and troubleshooting:
Frequently Asked Questions (FAQs)
Q1: What are the advantages of qPCR-based library quantification over fluorometric methods?
qPCR-based quantification methods, such as those offered by KAPA and NEBNext, provide significant advantages over standard fluorometric approaches [16] [19] [18]. While fluorometry measures total nucleic acid concentration (including non-sequenceable molecules), qPCR specifically quantifies only "sequencing-competent" library molecules that contain both adapter sequences. This results in more accurate cluster density optimization on sequencing platforms and enables precise equimolar pooling for multiplexed sequencing. The KAPA kits utilize a specially engineered DNA polymerase that amplifies diverse DNA fragments with similar efficiency, regardless of GC content or fragment length, providing more accurate quantification of heterogeneous library populations [16].
Q2: What does an ideal final library trace look like on a BioAnalyzer or Fragment Analyzer?
An ideal library trace on a BioAnalyzer or Fragment Analyzer should show a single, clear peak representing the expected average library size, with the absence of additional small and large library peaks [3] [4]. There should be minimal evidence of adapter dimers (which typically appear as sharp peaks around 70-90 bp) or other contamination artifacts. The distribution should be appropriate for your specific library preparation method and expected insert size.
Q3: How can I troubleshoot low library yield?
Table 2: Troubleshooting Low Library Yield
| Cause | Mechanism of Yield Loss | Corrective Action |
|---|---|---|
| Poor input quality/contaminants [20] | Enzyme inhibition from residual salts, phenol, or EDTA | Re-purify input sample; ensure wash buffers are fresh; target high purity (260/230 > 1.8) |
| Inaccurate quantification/pipetting error [20] | Suboptimal enzyme stoichiometry due to concentration errors | Use fluorometric methods (Qubit) rather than UV; calibrate pipettes; use master mixes |
| Fragmentation/tagmentation inefficiency [20] | Reduced adapter ligation efficiency from improper fragmentation | Optimize fragmentation parameters; verify fragmentation distribution before proceeding |
| Suboptimal adapter ligation [20] | Poor ligase performance or wrong molar ratios | Titrate adapter:insert molar ratios; ensure fresh ligase and buffer; maintain optimal temperature |
| Overly aggressive purification [20] | Loss of desired fragments during cleanup steps | Optimize bead:sample ratios; avoid over-drying beads; follow manufacturer's protocols precisely |
Q4: What are the common causes of adapter dimers and how can I prevent them?
Adapter dimers typically appear as sharp peaks around 70-90 bp on electrophoretic traces and result from ligation of adapters to themselves rather than to library inserts [20]. Common causes include:
- Excessive adapters in ligation reactions (improper adapter-to-insert ratios)
- Inefficient ligation due to enzyme issues or suboptimal reaction conditions
- Inadequate cleanup procedures after ligation
- Low input DNA leading to preferential adapter-adapter ligation
Prevention strategies include accurate quantification of input DNA, optimizing adapter concentrations, using fresh ligation enzymes and buffers, and implementing rigorous size selection or cleanup protocols to remove dimer contaminants before amplification [20].
Q5: How does automation improve NGS library preparation and QC?
Automated library preparation offers several advantages over manual workflows [19]:
- Reduced variability: Minimizes pipetting differences between users that can lead to inconsistent library yields
- Improved efficiency: Enables rapid processing of large sample numbers with minimal manual intervention
- Contamination reduction: Closed systems decrease the likelihood of environmental contamination
- Integrated QC: Advanced systems can automate library preparation and QC in a single workflow, eliminating manual normalization steps
Q6: What are the critical specifications for library quantification standards?
High-quality library quantification standards should exhibit:
- Lot-to-lot consistency: Pre-diluted standards with very high reproducibility between production lots [16]
- Broad dynamic range: Multiple dilution points to create accurate standard curves (e.g., six pre-diluted DNA standards in the NEBNext kit) [18]
- Platform compatibility: Specific formulations for different qPCR instruments and sequencing platforms [16] [18]
- Stability: Ability to be stored at -20°C while maintaining performance over time [16]
Advanced Troubleshooting Guide
Problem-Solution Reference Table
Table 3: Comprehensive Troubleshooting Guide for Common Library Prep Issues
| Problem Category | Typical Failure Signals | Common Root Causes | Recommended Solutions |
|---|---|---|---|
| Sample Input/Quality [20] | Low starting yield; smear in electropherogram; low library complexity | Degraded DNA/RNA; sample contaminants; inaccurate quantification; shearing bias | Re-purify input; use fluorometric quantification; optimize fragmentation; check purity ratios |
| Fragmentation/Ligation [20] | Unexpected fragment size; inefficient ligation; adapter-dimer peaks | Over/under-shearing; improper buffer conditions; suboptimal adapter-to-insert ratio | Titrate fragmentation conditions; optimize adapter ratios; ensure fresh enzymes and buffers |
| Amplification/PCR [20] | Overamplification artifacts; bias; high duplicate rate | Too many cycles; inefficient polymerase; primer exhaustion | Reduce PCR cycles; use high-fidelity polymerases; optimize primer concentrations |
| Purification/Cleanup [20] | Incomplete removal of small fragments; sample loss; carryover of salts | Wrong bead ratio; bead over-drying; inefficient washing; pipetting error | Optimize bead:sample ratios; prevent bead over-drying; follow washing protocols precisely |
Effective library QC requires a multifaceted approach combining accurate quantification methods, precise size distribution analysis, and systematic troubleshooting of common issues. By implementing the tools and techniques outlined in this guide—including qPCR-based quantification kits, electrophoretic quality assessment, and structured troubleshooting protocols—researchers can significantly improve their sequencing outcomes, reduce costs associated with failed runs, and generate more reliable data for their research and drug development programs.
Step-by-Step Protocol: Performing AmpliSeq Library QC on BioAnalyzer and Fragment Analyzer Systems
Foundational Guidelines for Input Quantities
DNA Input Recommendations
The quality and quantity of input DNA are critical factors for successful library preparation. The following table summarizes the key requirements and considerations for DNA input based on the Illumina DNA Prep, (M) Tagmentation protocol [21].
Table 1: DNA Input Guidelines for Library Preparation
| Parameter | Recommendation | Notes & Consequences |
|---|---|---|
| Intact DNA Quality | High molecular weight band (>10,000 bp) on 1% agarose gel; absence of low molecular weight smear [21]. | Low molecular weight smearing indicates RNA contamination or degraded DNA. |
| Purity (A260/280) | Approximately 1.8 [21]. | Deviation may indicate protein or other contamination. |
| Purity (A260/230) | 2.0 - 2.2 [21]. | Deviation may indicate salt or organic solvent carryover. |
| Compatible Input Range | 1 - 500 ng [21]. | The protocol is optimized for double-stranded DNA (dsDNA). |
| Recommended Input (Large/Complex Genomes) | 100 - 500 ng [21]. | Ensures sufficient library complexity and normalized yield. |
| Recommended Input (Small Genomes) | As low as 1 ng [21]. | Requires adjustment of the number of PCR cycles. |
| Input for Built-in Normalization | ≥ 100 ng [21]. | Using <100 ng may result in reduced library diversity and increased duplicate rates. |
| Quantification Method | Fluorometric, dsDNA-specific (e.g., Qubit dsDNA BR or HS Assay) [21]. | More accurate than absorbance-based methods for assessing usable DNA. |
RNA Input Considerations
While this guide focuses on the 1-100 ng range, specialized ultra-low input RNA sequencing protocols exist that can handle inputs as low as 1-10 pg [22]. For such sensitive applications, proprietary technologies are often employed to achieve adequate sensitivity and reproducibility, especially with challenging samples like rare cell types or cytoplasmic extracts.
Troubleshooting Guide: FAQs on Input Sample Handling
FAQ 1: My final library yield is unexpectedly low. What are the most common causes related to my starting material?
Low library yield can often be traced back to issues with the input sample. The primary causes and corrective actions are [20]:
- Cause: Poor Input Quality/Degradation. Degraded DNA or RNA will result in low yields and poor library complexity.
- Solution: Re-purify the input sample. Always run a gel to confirm the DNA is intact or use a Fragment Analyzer/Bioanalyzer for an RNA Integrity Number (RIN). Ensure a high purity (e.g., 260/280 ~1.8).
- Cause: Sample Contaminants. Residual substances like phenol, EDTA, salts, or guanidine from the extraction process can inhibit enzymes used in fragmentation, ligation, and amplification.
- Solution: Re-purify the sample using clean columns or beads. Ensure wash buffers are fresh, and consider diluting the sample to reduce inhibitor concentration if necessary.
- Cause: Inaccurate Quantification. Using UV absorbance (e.g., NanoDrop) can overestimate concentration by counting non-template contaminants, leading to suboptimal input amounts.
- Solution: Always use a fluorometric-based quantification method (e.g., Qubit, PicoGreen) specific for dsDNA or RNA for accurate measurement of usable material.
- Cause: Overly Aggressive Cleanup. Excessive sample loss can occur during purification or size selection steps before sequencing.
- Solution: Optimize bead-based cleanups by carefully following recommended bead-to-sample ratios and avoiding over-drying the bead pellet.
FAQ 2: I see a sharp peak around 70-90 bp in my Bioanalyzer trace. What is it and how do I fix it?
A sharp peak in the 70-90 bp range is a classic indicator of adapter dimers [20]. These are artifacts formed by the ligation of adapters to themselves instead of your DNA fragments.
- Root Causes:
- Corrective Actions:
- Titrate the adapter concentration to find the optimal ratio for your specific input amount.
- Ensure fresh ligase and buffer are used, and maintain optimal reaction temperature.
- If the input DNA was low or degraded, increase the input amount if possible or use a protocol designed for low-input samples.
- Re-perform a bead-based cleanup with an optimized ratio to remove the short adapter dimer products.
FAQ 3: My qPCR quantification for library amplification shows low efficiency or high variability. How can I improve it?
For reliable qPCR results, stringent quality control is essential. High inter-assay variability is a known issue, and key parameters can deviate from optimal conditions if not carefully controlled [23].
- Best Practices:
- Include a Standard Curve: To obtain accurate and reproducible results, it is recommended to include a standard curve in every qPCR experiment [23] [24]. This practice controls for inter-assay variability and allows for precise calculation of amplification efficiency.
- Assess Efficiency and Linearity: The standard curve should have an amplification efficiency between 90% and 110%, and a coefficient of correlation (R² > 0.99) [24]. Efficiencies outside this range may indicate polymerase inhibition or poor primer performance.
- Use High-Quality Standards: Use serial dilutions of a known standard (e.g., synthetic RNA/DNA) over several orders of magnitude. Aliquot standards to avoid freeze-thaw cycles [23].
- Perform Replicates: Run samples in triplicate to assess repeatability. The standard deviation for Cq values should be within 0.2 [24].
Experimental Protocols for Quality Assessment
Protocol: Assessing Input DNA Quality via Agarose Gel Electrophoresis
This protocol verifies the integrity of genomic DNA prior to library prep [21].
- Prepare Gel: Create a 1% agarose gel in an appropriate buffer and stain with SYBR-safe or similar DNA dye.
- Prepare Sample: Mix an aliquot of the DNA sample (approximately 10-100 ng) with loading dye.
- Electrophoresis: Run the gel alongside a DNA molecular weight ladder.
- Visualization: Image the gel under UV light.
- Interpretation: High-quality, intact genomic DNA will appear as a tight, high molecular weight band (>10,000 bp). A smear toward lower molecular weights indicates degradation.
Workflow: Systematic Library Preparation and QC
The following diagram outlines the key stages of library preparation and points where quality control is critical.
The Scientist's Toolkit: Essential Research Reagents
Table 2: Key Reagents for Sample Preparation and QC
| Item | Function | Example & Notes |
|---|---|---|
| Fluorometric dsDNA Assay | Accurate quantification of double-stranded DNA. | Qubit dsDNA HS or BR Assay. Selectively binds dsDNA, providing a more accurate concentration than UV absorbance for library prep [21]. |
| Agilent Bioanalyzer/Fragment Analyzer | Microfluidic-based analysis of nucleic acid size, distribution, and concentration. | Used for checking input DNA/RNA integrity and final library quality. Identifies adapter dimers and size anomalies [4] [3]. |
| Size Selection Beads | Cleanup and size selection of DNA fragments. | SPRI beads or similar. Used to remove unwanted short fragments (like adapter dimers) and to select the desired insert size range [20]. |
| TaqMan Fast Virus 1-Step Master Mix | One-step RT-qPCR for quantification of RNA targets or libraries. | Contains reverse transcriptase and polymerase for combined reverse transcription and amplification. Ideal for rapid, sensitive quantification [23]. |
| High-Quality Formamide | Denaturant for capillary electrophoresis. | Used when running samples on a Fragment Analyzer or similar CE instrument. Degraded formamide can cause peak broadening and reduced signal intensity [25] [26]. |
| Internal Size Standards | For accurate fragment sizing in capillary electrophoresis. | LIZ or ROX dye-labeled standards. Included in each sample well to create a standard curve for precise base-pair sizing [25]. |
The following diagram outlines the key stages of method setup, chip loading, and data acquisition on the Bioanalyzer/Fragment Analyzer, and how these steps are critical for ensuring successful Illumina library QC.
Experimental Protocols
Method Setup and Chip Loading
- Assay Selection: Launch the 2100 Expert software and select the appropriate assay for your application (e.g., High Sensitivity NGS Fragment Kit for library QC) [27].
- Chip Preparation:
- Gel-Matrix Loading: Pipette the required volume of gel into the appropriate well of the chip. Ensure the plunger is steady and positioned correctly when using the chip priming station to avoid introducing air bubbles [28].
- Ladder and Sample Loading: Pipette the marker into all ladder and sample wells. Load the ladder into the designated well. Subsequently, load your purified library samples into the remaining sample wells. Proper pipetting technique is critical to avoid cross-contamination [27] [28].
- Chip Processing: Vortex the loaded chip and run it on the IKA vortex mixer as specified in the kit protocol. Ensure the chip is placed in the instrument within the specified time window to prevent the gel from drying.
Instrument Communication and Data Acquisition
- Pre-Run Instrument Check: Before starting a run, verify that the Bioanalyzer's status indicator light is on. A red light or an off light (while the fan is running) indicates a problem that requires power cycling or a firmware update [29].
- COM Port Configuration: In the 2100 Expert software, navigate to the
Instrumenttab. If the instrument is not connecting, select a different COM port from the drop-down list to re-establish communication [29]. - Run Initiation and Monitoring: Place the processed chip into the instrument and start the run in the software. Monitor the run for any error messages, such as "Instrument connection timeout," "Counter mismatch," or "No data received," which indicate communication issues [29].
Troubleshooting Guides
Communication and Hardware Errors
Table: Troubleshooting Common Communication and Hardware Issues
| Problem | Possible Cause | Solution |
|---|---|---|
| Instrument connection timeout [29] | Incorrect COM port, driver issues, faulty USB-serial adapter. | Select a different COM port in software; reinstall drivers; use Agilent-certified USB-to-serial adapter (p/n 5188-8031 for B.02.08+) [29]. |
| Intermittent loss of communication [29] | PC specs not met, regional settings, antivirus interference. | Ensure PC meets minimum specs; set regional settings to English (US); turn off antivirus software/screensavers [29]. |
| Counter mismatch error [29] | Data points missing in PC-instrument communication. | Disconnect and reconnect all cables; ensure no other hardware is connected to PC; reinstall latest 2100 Expert software [29]. |
| Chip not detected [29] | Bioanalyzer-PC connection issue, faulty chip. | Check instrument-PC connection; ensure chip is inserted correctly; try a new chip [29]. |
| Unexpected firmware termination [29] | Potential hardware defect. | Create a support package and contact Agilent support [29]. |
Sample and Data Quality Issues
Table: Troubleshooting Sample and Data Quality Problems
| Problem | Observation | Solution |
|---|---|---|
| Degraded RNA Ladder/Samples [30] | Ladder or sample trace shows smearing or absence of distinct peaks. | Use fresh ladder aliquots; decontaminate electrode cartridge & pipettes with RNaseZAP; use new RNase-free tips/water [30]. |
| Additional small/large peaks [31] | Unexpected peaks in library trace. | Confirm sample purity; ensure proper sample purification to remove primer dimers or adapter artifacts prior to loading [31] [27]. |
| RIN not calculated (NA) [30] | Software does not display RNA Integrity Number. | Confirm a total RNA assay was selected; RIN is not calculated for small RNA assays [30]. |
| Manual integration greyed out [32] | Unable to manually integrate peaks in software. | This is a known software issue (KPR#:157, 506417). Check the Known Problem Report for your software version and any available fixes [32]. |
The Scientist's Toolkit: Essential Research Reagents and Materials
Table: Key Reagents and Materials for BioAnalyzer/Fragment Analyzer Experiments
| Item Name | Function/Application | Example Product/Note |
|---|---|---|
| High Sensitivity NGS Fragment Analysis Kit [27] | Quality control of NGS libraries, especially for low-concentration samples. | DNF-464-0500; input DNA range: 5–600 pg/µl [27]. |
| Standard Sensitivity RNA Kit [27] | Qualitative and quantitative analysis of RNA samples. | DNF-471-0500; quantitative range: 25–500 ng/µl [27]. |
| RNA 6000 Nano/Pico Ladder [30] | Provides size standards for accurate RNA sample assessment. | Must be aliquoted and stored at -70 °C to prevent degradation (p/n 5067-1529, 5067-1535) [30]. |
| Electrode Cleaner Chip [30] | For routine cleaning and RNase decontamination of the electrode cartridge. | p/n 5065-9951; included in boxes of RNA chips [30]. |
| RNaseZAP or Equivalent [30] | Effective surface decontaminant to remove RNase contamination from lab surfaces and equipment. | Critical for preventing RNA sample and ladder degradation [30]. |
| Agilent USB-to-Serial Adapter [29] | Ensures stable communication between the instrument and PC. | For software B.02.08+, use all-black cable p/n 5188–8031 [29]. |
Frequently Asked Questions (FAQs)
Q1: What does an ideal final library trace look like on a Bioanalyzer? An ideal trace for a sequencing library should show a single, sharp peak corresponding to the expected average library size. The trace should be smooth and confirm the absence of additional small peaks (which may indicate primer dimers or adapter artifacts) or large peaks (which may indicate high molecular weight contamination or concatemers) [31] [33].
Q2: My RNA ladder appears degraded. What should I do? First, confirm the degradation by checking the ladder with another method if possible. If confirmed, use a new aliquot of ladder stored at -70°C. To prevent future issues, perform RNase decontamination of the electrode cartridge and pipettes using RNaseZAP, use a new box of RNase-free pipette tips, and decontaminate the lab bench [30].
Q3: What is the most common reason for a "counter mismatch" error and how can I resolve it? This error indicates an interruption in communication between the instrument and PC. To resolve it, first ensure your PC meets the minimum specifications. Then, disconnect and firmly reconnect all cables. If the problem persists, try selecting a different COM port in the software, turn off antivirus software, or reinstall the 2100 Expert software [29].
Q4: Why is fluorometric quantification (e.g., Qubit) recommended over photometric methods (e.g., Nanodrop) for library QC? Fluorometric methods use dyes that specifically bind to nucleic acids, providing a significantly more accurate measurement of double-stranded DNA concentration. Photometric measurements like Nanodrop can be skewed by contaminants such as salts, proteins, or free nucleotides, frequently leading to overestimation of the sample's DNA concentration, which is a common reason for failed sequencing attempts [27] [33].
Within the framework of AmpliSeq for Illumina library quality control (QC), determining average library size, molarity, and profile integrity is a critical prerequisite for a successful sequencing run. These parameters directly influence cluster density, data yield, and the overall quality of your NGS data. This guide addresses frequently asked questions and provides detailed troubleshooting protocols to help researchers identify and correct common issues encountered during library QC using the Bioanalyzer and Fragment Analyzer.
Frequently Asked Questions (FAQs)
1. What does an ideal final library trace look like on the Bioanalyzer or Fragment Analyzer? An ideal trace should show a single, narrow peak corresponding to your expected average library size, indicating a population of fragments with uniform length. The trace should be free of additional peaks, particularly small peaks in the 70-90 bp range which indicate adapter dimers, and large peaks that suggest high molecular weight contamination or inefficient fragmentation [3] [34].
2. What is that sharp peak at ~70 bp or ~90 bp? A sharp peak at approximately 70 bp (for non-barcoded libraries) or 90 bp (for barcoded libraries) is indicative of adapter dimers [35]. These form when adapters self-ligate during the ligation step. They can amplify efficiently and compete with your target library during sequencing, significantly reducing useful throughput [20] [35].
3. My library yield is low. What are the common causes? Low library yield can stem from several issues in the preparation workflow [20]:
- Input Quality/Quantity: Degraded DNA/RNA or contaminants inhibiting enzymes.
- Fragmentation & Ligation: Inefficient shearing or poor ligase performance.
- Amplification: Too few PCR cycles or polymerase inhibitors.
- Purification: Overly aggressive size selection or sample loss during clean-up steps.
4. Can I sequence a library if I see a small adapter dimer peak? It is highly recommended to remove adapter dimers prior to sequencing. While a very minor peak might be tolerated, any significant adapter dimer peak will consume sequencing cycles and reduce the number of reads from your target library, thereby decreasing overall throughput and data quality [35].
5. How does over-amplification affect my library? Over-amplification, or using too many PCR cycles, can introduce bias in your library. It often results in a high duplicate rate, skews the library toward smaller fragments, and can lead to off-scale data on the Bioanalyzer, making accurate quantification difficult [20] [35].
Troubleshooting Common Library QC Issues
The following table summarizes common problems, their potential causes, and recommended solutions.
Table 1: Troubleshooting Guide for Library QC
| Problem | Primary Causes | Recommended Solutions |
|---|---|---|
| Adapter Dimers(Peak at ~70-90 bp) | - Suboptimal adapter-to-insert ratio during ligation- Inefficient size selection or cleanup [20] | - Titrate adapter concentration [20]- Perform an additional cleanup or size selection step to remove dimers [35] [36] |
| Low Library Yield | - Poor input quality/degraded nucleic acids- Contaminants (salts, phenol)- Inaccurate quantification- Overly aggressive purification [20] | - Re-purify input sample; check purity ratios (260/280 ~1.8)- Use fluorometric quantification (e.g., Qubit) over absorbance- Optimize bead cleanup ratios to minimize loss [20] |
| Overamplification Artifacts(High duplicate rate, bias, off-scale data) | - Excessive number of PCR cycles [20] | - Limit the number of amplification cycles- If yield is low, repeat the amplification from leftover ligation product rather than overcycling [35] |
| Broad or Heterogeneous Peaks | - Degraded polymer or buffer in CE instrument- Sample degradation- High salt concentration in sample [25] | - Prepare fresh samples and reagents- Run a size-standard only plate to diagnose instrument issues- Ensure proper purification to remove salts [25] |
| Off-scale or Saturated Data(Flat-topped peaks) | - Library concentration too high for the assay [25] | - Dilute the library further before analysis- Reduce injection time if re-injecting the same plate on the instrument [25] |
Step-by-Step Experimental Protocols
Protocol 1: Diagnosing Instrument vs. Sample Issues on the Fragment Analyzer
This protocol helps determine if poor data quality originates from your library or the capillary electrophoresis instrument [25].
- Prepare a size standard-only plate:
- Mix 12.5 µL of HiDi Formamide and 0.5 µL of Internal Size Standard (e.g., ROX 500) per well/capillary.
- Use a 16-capillary array as an example: prepare 16 wells, each with 12.5 µL HiDi Formamide and 0.5 µL Size Standard [25].
- Execute the run:
- Run the standards using the instrument's Standard Run Modules.
- Check that the sizing passes in the analysis software using a default analysis method [25].
- Analyze the results:
- If the standards do not look good: Perform weekly instrument maintenance (polymer, buffer, capillary/array replacement) and re-run the standards. If problems persist, contact technical support [25].
- If the standards look good: The issue likely lies in your sample preparation. Proceed to step 4.
- Test your sample:
- Set up a PCR reaction using a laboratory-internal positive control DNA.
- After PCR, dilute the sample per your protocol and mix 1 µL of diluted sample, 0.5 µL Internal Size Standard, and 10.5 µL HiDi Formamide.
- Denature at 95°C for 3 minutes and immediately place on ice for 3 minutes.
- Run the samples using Standard Run Modules [25].
Protocol 2: Remedial Cleanup for Adapter Dimer Removal
This protocol is used when a QC trace indicates the presence of adapter dimers [35].
- Verify the presence of adapter dimers: Confirm the sharp peak is at ~70 bp (non-barcoded) or ~90 bp (barcoded) on the Bioanalyzer/Fragment Analyzer trace [35].
- Select a cleanup method: Use bead-based cleanups (e.g., SPRIselect beads) for optimal size selection.
- Optimize the bead-to-sample ratio: Adjust the ratio to selectively bind and remove fragments in the adapter dimer size range while retaining your target library fragments. A slightly higher bead ratio than standard may be required.
- Execute the cleanup:
- Mix the beads well before dispensing.
- Combine the beads with the library and incubate.
- Pellet the beads on a magnet and carefully remove the supernatant (which contains the unwanted adapter dimers).
- Wash the beads with fresh ethanol without over-drying.
- Elute the purified library in the recommended buffer [35].
- Re-quantify: Re-assess the library concentration and profile on the Bioanalyzer/Fragment Analyzer to confirm the successful removal of adapter dimers.
Library QC Troubleshooting Workflow
The following diagram outlines a logical decision-making process for troubleshooting library quality based on Bioanalyzer/Fragment Analyzer results.
The Scientist's Toolkit: Key Research Reagent Solutions
Table 2: Essential Materials for Library QC and Troubleshooting
| Item | Function/Benefit |
|---|---|
| Agilent Bioanalyzer | Microfluidics-based platform for rapid assessment of library size distribution and quantification, using RNA or DNA High Sensitivity chips [4] [3]. |
| Fragment Analyzer | Capillary electrophoresis instrument for high-resolution analysis of library fragment size and molar concentration [25]. |
| Fluorometric Quantitation Kits (e.g., Qubit) | Provides highly specific nucleic acid quantification by fluorescent dye binding, unlike UV absorbance which can be skewed by contaminants [20]. |
| qPCR Library Quantitation Kits | Accurately quantifies only amplifiable library fragments, which is critical for achieving optimal cluster densities on the sequencer [35]. |
| Size Selection Beads (e.g., SPRI beads) | Magnetic beads used to purify and select for library fragments within a specific size range, crucial for removing adapter dimers and other unwanted products [20] [35]. |
| HiDi Formamide | A denaturant used in sample preparation for capillary electrophoresis; provides sample stability and consistent injection quality. Using water is not recommended as it causes variable results [25]. |
| Internal Size Standards (e.g., ROX, LIZ) | Fluorescently-labeled DNA ladders included in each sample well to create a standard curve, enabling precise sizing of library fragments [25]. |
Frequently Asked Questions (FAQs)
Q1: What are the key quality control (QC) metrics I should check for my FFPE DNA and RNA samples before starting an AmpliSeq for Illumina assay?
For FFPE DNA intended for targeted DNA sequencing with AmpliSeq for Illumina panels, it is recommended to check the ∆Cq value using a qPCR-based method like the Infinium FFPE QC Kit. A ∆Cq value of ≤ 5 is recommended for optimal performance; samples with ∆Cq > 5 may lead to library preparation failure or reduced assay performance [37]. For FFPE RNA, the key metric is the DV200 value, which represents the percentage of RNA fragments larger than 200 nucleotides. This is assessed using systems like the Agilent 2100 Bioanalyzer or the Fragment Analyzer. The recommended minimum DV200 value is 20%, though some protocols require higher thresholds (e.g., ≥ 36.5 or >55%) [37]. A recent study also recommends a minimum RNA concentration of 25 ng/µL and a pre-capture library Qubit value of 1.7 ng/µL to achieve adequate RNA-seq data [38].
Q2: My FFPE sample has a ∆Cq value greater than 5. Can I still use it with my AmpliSeq for Illumina DNA panel?
Yes, but with caution. While the Illumina DNA Prep with Enrichment kit is not recommended for samples with ∆Cq > 5, using such samples is possible but might increase the chances of library preparation failure or decrease assay performance [37]. It is important to note that for the AmpliSeq for Illumina Ready-To-Use Panels (e.g., BRCA Panel, Cancer Hotspot Panel v2), no specific FFPE QC is required [37]. However, you should not exceed the maximum supported amount of input DNA and should use validated FFPE extraction kits [37].
Q3: What adjustments should I make to my library preparation protocol when working with low-input or degraded FFPE RNA?
When using degraded FFPE RNA with the Illumina Stranded Total RNA with Ribo-Zero Plus kit, you should adjust the RNA input amount based on the DV200 value. The protocol also recommends increasing the PCR cycles by 2 in the "Amplify Library" step for extracted FFPE sample input [37]. For targeted RNA sequencing with fixed and custom panels, increasing the PCR cycles to 17 in the "Tagment cDNA" step is recommended for extracted FFPE input [37].
Q4: How can I use the Bioanalyzer or Fragment Analyzer to troubleshoot my library preparation before sequencing?
The Agilent Bioanalyzer or Fragment Analyzer are critical tools for checking library quality prior to sequencing. They help you [4] [3]:
- Confirm the expected average library size and the presence of a main library peak.
- Ensure the absence of additional small and large library peaks (e.g., adapter dimer, primer artifacts, or high molecular weight contamination).
- Identify issues related to sample preparation, such as inefficient fragmentation, over-amplification, or purification problems. Recognizing these phenotypes in the trace allows you to correct and prevent errors in future preparations.
Troubleshooting Guides
Issue 1: Low Library Yield from FFPE RNA Samples
Potential Causes and Solutions:
- Cause: Input RNA is too degraded.
- Solution: Quantify degradation using the DV200 metric. For the Illumina Stranded Total RNA with Ribo-Zero Plus kit, a DV200 > 55% is recommended. If the DV200 is low, increase the input RNA mass within the protocol's allowed range and increase the number of PCR cycles during library amplification as per manufacturer guidelines [37].
- Cause: Insufficient input RNA concentration.
- Solution: Use a fluorescence-based quantification method like Qubit. Do not use UV-spectrometer-based methods (e.g., Nanodrop) as they are inaccurate for degraded samples. Ensure the RNA concentration meets or exceeds the minimum recommended threshold of 25 ng/µL [38].
- Cause: Inefficient cDNA synthesis or library amplification due to sample inhibitors.
- Solution: Use a validated FFPE RNA extraction kit, such as the QIAGEN AllPrep DNA/RNA FFPE kit, to ensure pure nucleic acid isolation. Re-quantify the library post-amplification with Qubit; a pre-capture value below 1.7 ng/µL is a strong indicator of potential failure [38].
Issue 2: Poor Bioanalyzer/Fragment Analyzer Profile for DNA Libraries
Potential Causes and Solutions:
- Cause: Adapter dimer present (a small peak around ~100-150 bp).
- Solution: Optimize the cleanup step using bead-based purification (e.g., AMPure XP beads) with a careful bead-to-sample ratio to remove short fragments. Ensure proper size selection.
- Cause: Broad peak or multiple peaks, indicating uneven fragment size or contamination.
- Solution: Check the fragmentation time and method. For FFPE DNA, fragmentation may not be required. If using a sonicator, ensure it is calibrated. Verify that the sample is not contaminated with genomic DNA or RNA.
- Cause: No peak or very low signal.
- Solution: Confirm the success of the enzymatic reactions (tagmentation, PCR) by checking reagent aliquots and thermal cycler conditions. Re-assess the input DNA quality using the ∆Cq metric [37].
Essential Metrics and Protocols
Quality Control Thresholds for Challenging Samples
Table 1: Recommended QC Metrics for FFPE Samples in Library Preparation
| Sample Type | Library Prep Kit (Example) | Key QC Metric | Recommended Threshold | Input Recommendation | Protocol Adjustment |
|---|---|---|---|---|---|
| FFPE DNA | Illumina DNA Prep with Enrichment | ∆Cq (qPCR) | ∆Cq ≤ 5 [37] | 50-1000 ng [37] | Not recommended for ∆Cq > 5 [37] |
| FFPE DNA | AmpliSeq for Illumina Panels | Not required | Not required [37] | Do not exceed max input; 1 ng for high-quality only [37] | Use validated FFPE extraction kits [37] |
| FFPE RNA | Illumina Stranded Total RNA with Ribo-Zero Plus | DV200 | > 55% [37] | 10-100 ng [37] | Increase PCR cycles by 2 [37] |
| FFPE RNA | Targeted RNA Sequencing (Fixed Panels) | DV200 | ≥ 36.5% [37] | 20-100 ng [37] | Increase PCR cycles to 17 [37] |
| FFPE RNA | General Recommendation | RNA Concentration | ≥ 25 ng/µL [38] | Based on DV200 [37] | N/A |
Experimental Protocol: QC Workflow for FFPE RNA Samples
The following diagram outlines the key decision points in a recommended QC workflow for FFPE RNA samples.
The Scientist's Toolkit: Key Research Reagent Solutions
Table 2: Essential Materials for QC of Challenging Samples
| Item | Function / Application | Example Products / Kits |
|---|---|---|
| Fluorometric Quantitation Kit | Accurate quantification of low-concentration or degraded nucleic acids; superior to spectrophotometry for these samples. | Qubit dsDNA HS Assay, Qubit RNA HS Assay [38] |
| qPCR QC Kit for FFPE DNA | Assesses DNA quality via ∆Cq measurement to predict library prep success. | Infinium FFPE QC Kit (Illumina WG-321-1001) [37] |
| Automated Electrophoresis System | Evaluates nucleic acid size distribution and integrity (e.g., RIN, DV200). Critical for RNA from FFPE. | Agilent 2100 Bioanalyzer, Advanced Analytical Fragment Analyzer [37] [38] |
| Validated Nucleic Acid Extraction Kit | Optimized for recovering degraded DNA and/or RNA from FFPE tissue sections. | QIAGEN AllPrep DNA/RNA FFPE Kit, Promega ReliaPrep FFPE gDNA MiniPrep System [37] |
| FFPE-Tailored Library Prep Kit | Library construction protocols designed to work with fragmented and damaged nucleic acids from FFPE. | Illumina DNA Prep, (formerly Nextera Flex), TruSeq RNA Exome, NEBNext rRNA Depletion Kit [37] [38] |
Frequently Asked Questions (FAQs)
1. Why is accurate library quantification critical for multiplexed sequencing on patterned flow cells?
Accurate library quantification is essential because it directly impacts flow cell occupancy and data quality. While underclustering maintains high data quality, it results in lower overall data output. Conversely, overclustering can lead to run failure, poor performance, lower Q30 scores, sequencing artifacts, and reduced total data output. The most common cause of both under- and overclustering is inaccurate library quantification [39].
2. What is the best method for quantifying AmpliSeq for Illumina libraries prior to pooling?
For AmpliSeq for Illumina libraries, which typically have a narrow size distribution, multiple methods are appropriate. qPCR is highly recommended as it selectively quantifies only full-length library fragments containing both P5 and P7 adapter sequences, ensuring only cluster-capable molecules are counted [39]. Fluorometric methods (e.g., Qubit, PicoGreen) are also effective but may overestimate concentration by including incomplete library fragments and primer dimers. Microfluidics-based systems (e.g., Bioanalyzer, Fragment Analyzer) are well-suited for both quality control and quantification of these libraries [39] [11].
3. How does the normalization method affect the evenness of sequence coverage across samples in a multiplex pool?
The normalization method significantly influences the distribution of sequences across samples. A comparative study of three methods found that a quantitative DNA binding approach (e.g., using a SequalPrep kit) provided superior evenness. This method resulted in a lower coefficient of variation (72%) and a much higher percentage of samples (95%) meeting the minimum sequence threshold, compared to direct spectroscopy or size-restricted spectroscopy [40].
4. What are the consequences of using an incompatible quantification method?
Using an incompatible or non-recommended quantification method, such as UV spectrophotometry, can lead to overestimation of library concentration. This occurs because UV methods quantify single-stranded nucleic acids and free nucleotides along with complete double-stranded DNA library fragments, which can cause overclustering and poor sequencing performance [39] [11].
5. How many samples can be multiplexed in a single AmpliSeq for Illumina run?
The AmpliSeq for Illumina protocol allows for 1 to 96 samples to be processed simultaneously. For optimal efficiency, especially when using a multichannel pipette, it is recommended to process samples in multiples of 8 [41].
Troubleshooting Guides
Problem: Uneven Sequence Coverage Across Multiplexed Samples
Potential Causes and Solutions:
- Cause: Inaccurate quantification of individual libraries before pooling.
- Solution: Re-evaluate your quantification method. Implement qPCR quantification, as it specifically targets full-length, amplifiable library fragments and ignores incomplete products [39]. Always use technical replicates (triplicates recommended) and at least two separate dilutions for accuracy.
- Cause: Use of a quantification method prone to error for your library type.
- Solution: Consult the table below to select the appropriate quantification method. Avoid UV spectrophotometry [11].
Problem: Low Sequencing Output or Poor Cluster Density on the iSeq 100 System
Potential Causes and Solutions:
- Cause: Under-clustering due to overestimation of library concentration from primer dimer contamination.
- Cause: Use of ng/µL concentration without converting to nM for cluster generation.
- Solution: When using fluorometric methods that yield concentration in ng/µL, you must convert to nM using the average library size determined from the Bioanalyzer or Fragment Analyzer trace and the appropriate conversion formula [39].
Data Presentation: Quantification Methods and Performance
Table 1: Comparison of Library Quantification Methods
| Method | Principle | Best For | Key Advantage | Key Limitation | Recommended for AmpliSeq? |
|---|---|---|---|---|---|
| qPCR [39] | Amplification of P5/P7 adapter sequences | All library types, especially low-input | Quantifies only cluster-capable, full-length fragments | Does not provide library size distribution | Yes |
| Fluorometry (e.g., Qubit) [39] [11] | Fluorescent dye binding dsDNA | Libraries with broad fragment size distributions | Fast; minimal equipment needed | Overestimates by including primer dimers/incomplete fragments | Yes (with size QC) |
| Microfluidics Electrophoresis (Bioanalyzer) [39] [11] | Electro-phoretic separation and fluorescence | Libraries with narrow size distribution (e.g., AmpliSeq) | Provides size distribution and quantification in one step | Accuracy decreases with broad size distributions | Yes |
| UV Spectro-photometry [39] [11] | UV light absorption by nucleotides | Not recommended for final libraries | Fast and inexpensive | Overestimates severely; quantifies contaminants | No |
| Normalization Method | Principle | Coefficient of Variation (CV) | % of Samples > Minimum Threshold | Labor and Efficiency |
|---|---|---|---|---|
| Direct Spectroscopy (NanoDrop) | A260 absorbance | 113% | 44% | Low efficiency, manual dilution |
| Size-Restricted Spectroscopy (QIAxcel) | Capillary electrophoresis for target size | 103% | 63% | Medium efficiency |
| Quantitative DNA Binding (SequalPrep Kit) | Fixed DNA binding per well | 72% | 95% | High efficiency, scalable |
Experimental Protocols
Detailed Protocol: qPCR Quantification for AmpliSeq Libraries
This protocol is based on Illumina's best practices for library quantification [39].
- Dilution: Make an initial 1:1000 or 1:10,000 dilution of your purified AmpliSeq library in a low-EDTA TE buffer or nuclease-free water.
- Preparation of Standards and Samples: Prepare the qPCR standards according to the kit's instructions. Create at least two further working dilutions of your library (e.g., 1:10,000 and 1:20,000) in triplicate.
- qPCR Setup: Set up the qPCR reaction using a kit validated for Illumina libraries (e.g., KAPA qPCR kits). The reaction mix typically contains:
- qPCR Master Mix (including primers that anneal to P5 and P7)
- Your diluted library or standard
- Nuclease-free water
- Run qPCR: Use the following typical cycling conditions (optimize per kit):
- Initial denaturation: 95°C for 5 minutes
- 35 cycles of: 95°C for 30 seconds, 60°C for 45 seconds
- Data Analysis: The qPCR software will generate a concentration for each sample based on the standard curve. Average the triplicate values for each dilution. The concentrations for different dilutions should be consistent. Use this concentration to calculate the molarity of your original library for pooling.
Detailed Protocol: Normalization and Pooling Using a Quantitative Binding Method
This protocol is adapted from a study that demonstrated superior performance using a quantitative DNA binding kit [40].
- PCR Cleanup: Ensure all individual AmpliSeq PCR reactions are purified to remove primers, nucleotides, and enzymes. Magnetic beads (e.g., AMPure XP) are commonly used.
- DNA Binding: Transfer each purified amplicon to the wells of a normalization plate (e.g., SequalPrep Kit). The resin in each well is designed to bind a fixed amount of DNA (e.g., 25 ng) when DNA is in excess.
- Washing: Perform wash steps as per the manufacturer's instructions to remove salts, enzymes, and other contaminants.
- Elution: Elute the bound DNA from each well into an equal volume of elution buffer. This step effectively normalizes the concentration of all samples.
- Pooling: Combine equal volumes of the eluted, normalized DNA from each sample into a single microcentrifuge tube to create the final multiplexed sequencing pool.
- Final QC: Quantify the final pool using a fluorometric method and check its profile on a Fragment Analyzer or Bioanalyzer before loading onto the sequencer.
Workflow Visualization
The Scientist's Toolkit: Essential Research Reagents
| Item | Function | Notes |
|---|---|---|
| AmpliSeq for Illumina Panel | Target enrichment via multiplex PCR | Choose from On-Demand, Custom, or Focused Panels (1-500 genes). |
| AmpliSeq Library PLUS Kit | Contains reagents for library construction | Includes enzymes and buffers for amplification and cleanup steps. |
| AmpliSeq CD Indexes | Allows sample multiplexing | Unique dual indexes for up to 96-plex; essential for sample demultiplexing. |
| iSeq 100 i1 Reagents | Sequencing reagents for the iSeq 100 system | Includes flow cell, cartridge, and buffer for the sequencing run. |
| Direct FFPE DNA Kit (Optional) | DNA preparation from FFPE samples | For use with challenging FFPE samples without need for deparaffinization. |
Troubleshooting AmpliSeq Libraries: Diagnosing and Correcting Common BioAnalyzer Anomalies
Within the context of AmpliSeq for Illumina library preparation and quality control, adapter dimers represent a significant challenge. These byproducts, which form when adapters ligate to themselves instead of the target amplicons, can severely impact sequencing efficiency and data quality. This guide provides a focused troubleshooting resource for researchers and scientists to identify and eliminate adapter dimers, a critical step in robust library QC using instruments like the BioAnalyzer or Fragment Analyzer.
Troubleshooting Guide: Adapter Dimers
Problem: A prominent, sharp peak is observed in the ~70-90 bp region during library QC analysis.
Question & Answer
Q1: What exactly are adapter dimers and why are they problematic for sequencing?
A1: Adapter dimers are short, artifactual molecules formed during library preparation when the Illumina sequencing adapters ligate to each other instead of to your target DNA fragments. They are problematic because:
- Cluster Depletion: They compete with your target library for binding sites on the flow cell, significantly reducing cluster density and sequencing output.
- Data Contamination: They sequence efficiently but produce no meaningful biological data, wasting a substantial portion of your sequencing read.
- QC Failure: Their presence indicates an inefficient library preparation reaction, potentially leading to project delays.
Q2: How do I definitively distinguish an adapter dimer peak from a genuine small amplicon on a BioAnalyzer/Fragment Analyzer trace?
A2: The primary indicator is size. A classic, full-length adapter dimer (with both adapters and a short, non-templated ligation) typically appears as a sharp peak between 70 and 90 base pairs. In contrast, your smallest intended amplicons from an AmpliSeq panel will be larger, as defined by your panel's design (e.g., the first targeted amplicon). The table below summarizes the key differentiating factors.
Table 1: Differentiating Adapter Dimers from Target Amplicons
| Feature | Adapter Dimer | Small Target Amplicon |
|---|---|---|
| Typical Size | ~70-90 bp | Defined by panel design (>100 bp typically) |
| Peak Shape | Sharp, narrow | Broader, more Gaussian shape |
| Peak Location | Consistent across samples | Consistent with panel specifications |
| Sequence | Adapter sequence only | Genomic target sequence |
Q3: What are the most effective strategies to clean up a library contaminated with adapter dimers?
A3: Several post-ligation clean-up strategies are effective, each with pros and cons. The choice depends on the severity of contamination and the required recovery of your target library.
Table 2: Comparison of Adapter Dimer Clean-up Methods
| Method | Principle | Optimal Size Cut-off | Best For | Protocol Summary |
|---|---|---|---|---|
| SPRI Bead Size Selection | Selective binding of DNA to magnetic beads based on size in PEG buffer. | ~1.0x - 1.2x bead-to-sample ratio | Routine clean-up, mild dimer contamination. | 1. Bring sample to a known volume. 2. Add SPRI beads at a 0.8x ratio to remove large fragments. 3. Collect supernatant. 4. Add SPRI beads to supernatant at a 1.2x ratio to bind target library. 5. Wash, elute. |
| Gel Electrophoresis | Physical separation by size on an agarose or precast gel. | Manual excision of target band. | Severe dimer contamination, high-precision size selection. | 1. Load library on a high-resolution gel (e.g., 2-4% agarose). 2. Run electrophoresis. 3. Visualize and excise the band corresponding to your target library size. 4. Purify DNA from gel slice. |
| Specialized Kits (e.g., SeqPure) | Proprietary beads/formulations optimized for dimer removal. | As per manufacturer's instructions. | Fast, standardized protocol for consistent results. | 1. Follow kit-specific protocol, which often involves a single bead addition step designed to bind fragments >100 bp. |
Frequently Asked Questions (FAQs)
Q4: Can I prevent adapter dimers from forming in the first place?
A4: Yes, proactive measures are the best defense:
- Use Reduced Adapter Concentration: If using non-IDT for Illumina adapters, titrate the adapter amount to the minimum required for efficient ligation.
- Purify Post-Ligation: Always perform a clean-up after the ligation reaction to remove excess free adapters before the PCR amplification step.
- Validate Reagents: Ensure enzymes (e.g., ligase) are active and storage conditions are optimal.
- Quantify Accurately: Use fluorometric methods (Qubit) over spectrophotometry (NanoDrop) for accurate input DNA quantification to avoid using too little DNA, which increases the adapter-to-insert ratio.
Q5: My library has a strong adapter dimer peak, but I have already amplified it. Can I still clean it up?
A5: Yes, but with reduced efficiency. Post-amplification clean-up is less effective because the adapter dimers have been amplified exponentially alongside your target library. The methods in Table 2 (especially gel electrophoresis or a double-sided SPRI bead clean-up) are your best options, but expect some loss of your target library.
Q6: What is an acceptable level of adapter dimers to proceed with sequencing?
A6: There is no universal threshold, but a general guideline is that the adapter dimer peak should represent less than 5-10% of the total molarity of the library. If the dimer peak is comparable to or larger than your target library peak, clean-up is strongly recommended to avoid sequencing failure.
Experimental Workflow and Strategies
The following diagram illustrates the logical decision-making process for identifying and addressing adapter dimers within a typical AmpliSeq workflow.
Diagram 1: Adapter Dimer Identification & Clean-up Workflow
The Scientist's Toolkit: Research Reagent Solutions
Table 3: Essential Reagents for Adapter Dimer Management
| Reagent / Kit | Function in Context |
|---|---|
| SPRIselect / AMPure XP Beads | Magnetic beads for post-ligation and post-amplification size-selective clean-up to remove short adapter dimers. |
| High Sensitivity DNA Kit (BioAnalyzer) | Reagents for running and analyzing library QC traces to accurately identify and quantify the ~70-90 bp adapter dimer peak. |
| Qubit dsDNA HS Assay Kit | Fluorometric quantification of library concentration, providing accurate values unaffected by adapter dimer contamination (unlike A260). |
| Agilent D1000/High Sensitivity ScreenTape | Alternative to BioAnalyzer chips for rapid, automated library QC and dimer detection on the TapeStation systems. |
| SeqPure Beads / DimerFree | Specialized magnetic beads formulated for enhanced removal of short-fragment artifacts like adapter dimers. |
| Low-EDTA TE Buffer | Ideal elution and dilution buffer for libraries, as EDTA can inhibit downstream enzymatic steps like cluster amplification. |
Frequently Asked Questions
What are the most common causes of low library yield? Low library yield can stem from several steps in the preparation process. The most frequent causes include degraded or contaminated input DNA, suboptimal amplification cycles (too few or too many), and inefficiencies during bead-based clean-up, such as using an incorrect bead-to-sample ratio or over-drying the beads [42] [20].
How can I tell if my input DNA quality is the problem? Poor input DNA quality is often indicated by a low library complexity and a "smear" on the electropherogram [20]. Inhibitors present in the DNA sample, such as residual salts, phenol, or EDTA, can also prevent enzymatic reactions from proceeding efficiently [42] [20].
What does an adapter dimer look like, and how does it affect yield? Adapter dimers appear as a sharp peak at approximately 127 bp on a Bioanalyzer or Fragment Analyzer trace [42]. This artifact consumes adapters and PCR reagents that would otherwise be used to create your target library, thereby reducing your usable yield [20].
My Bioanalyzer trace looks normal, but my quantification is low. Why? It is crucial to use the correct quantification method. UV spectrophotometry (e.g., NanoDrop) can overestimate concentration by detecting contaminants and adapter/primer artifacts. For accurate quantification of amplifiable library molecules, use fluorometric methods (e.g., Qubit) or qPCR [11].
Troubleshooting Guide: Low Library Yield
The following table outlines the primary causes of low library yield and their respective solutions.
| Potential Cause | Detailed Mechanism | Corrective & Preventive Actions |
|---|---|---|
| Input DNA Quality [42] [20] | Inhibitors (salts, phenol) or DNA damage can block enzyme activity in end-prep, ligation, or PCR. | - Repair damaged DNA (e.g., with NEBNext FFPE DNA Repair Mix) [42].- Re-purify input DNA; ensure 260/230 & 260/280 ratios are good [20].- Shear DNA in a clean buffer like 1X TE [42]. |
| Adaptor Ligation Issues [42] [20] | Denatured adaptors or an incorrect adaptor-to-insert ratio leads to inefficient ligation or adaptor dimer formation. | - Dilute adaptors in 10 mM Tris-HCl (pH 7.5-8.0) with 10 mM NaCl and keep on ice [42].- Titrate the adaptor concentration based on input DNA [42].- Add adaptor to the sample first, then add the ligase master mix to reduce adaptor self-ligation [42]. |
| Amplification Problems [42] [20] | Too many PCR cycles can lead to overamplification and primer exhaustion, while too few will not generate enough product. | - Start with the recommended number of cycles and optimize based on input [42].- Reduce cycles if signs of overamplification (e.g., single-stranded DNA) appear [42].- Ensure primer concentration is correct and stored properly [20]. |
| Bead-Based Clean-up Loss [42] [20] | Sample loss occurs from beads drying out, incomplete ethanol removal, or using an incorrect bead-to-sample ratio. | - Do not let SPRI beads dry completely before elution [42].- After the final ethanol wash, perform a quick spin, keep the tube on the magnet, and remove all residual ethanol with a fine pipette tip [42].- Mix beads and sample slowly to avoid droplets clinging to pipette tips [42]. |
| General Protocol Errors [42] [20] | Omitting critical reagents, improper mixing, or inaccurate pipetting can cause failures at any step. | - Confirm all reagents are added and stored at correct temperatures [42].- Mix samples thoroughly by pipetting up and down 10x for enzymatic steps [42].- Use master mixes to reduce pipetting errors and improve consistency [20]. |
The Scientist's Toolkit: Essential Research Reagent Solutions
| Item | Function |
|---|---|
| DNA Repair Mix (e.g., NEBNext FFPE) | Repairs damaged DNA from challenging samples (e.g., FFPE tissue) prior to library prep to improve yield [42]. |
| SPRI Beads | Magnetic beads used for post-reaction clean-up and size selection to purify library fragments and remove unwanted by-products like adapter dimers [42]. |
| Fluorometric Assay Dyes (e.g., Qubit) | Provide highly accurate, specific quantification of double-stranded DNA concentration, which is critical for normalizing libraries and avoiding over- or under-loading [11]. |
| High-Sensitivity DNA Assay Kits | Used with instruments like the Bioanalyzer or Fragment Analyzer to visualize library size distribution, detect adapter dimers, and assess overall library quality [43] [11]. |
| Tris-HCl Buffer with NaCl | The recommended buffer for diluting sensitive reagents like adaptors to maintain stability and prevent denaturation [42]. |
Experimental Protocol: A Systematic Workflow for Diagnosis and Optimization
Objective: To diagnose the root cause of low NGS library yield by systematically evaluating input DNA quality, amplification efficiency, and clean-up efficacy.
1. Input DNA QC Protocol
- Quantification: Quantify the input DNA using both fluorometric (e.g., Qubit) and UV spectrophotometric methods. A significant discrepancy (e.g., high NanoDrop reading but low Qubit reading) indicates potential contaminants [20] [11].
- Quality Assessment: Run 50-100 ng of DNA on a High Sensitivity DNA chip for the Bioanalyzer or Fragment Analyzer. A sharp, single peak is ideal. A smear or significant fragmentation suggests the DNA is degraded and may require repair [3] [20].
2. Post-Ligation QC Check
- Procedure: After adaptor ligation and post-ligation clean-up, run 1 µL of the library on a High Sensitivity DNA chip.
- Interpretation: The electropherogram should show a broad smear or peak shift corresponding to the expected insert size plus adaptor length. A dominant sharp peak at ~127 bp confirms significant adaptor dimer formation, which requires a more stringent bead clean-up (e.g., 0.9x ratio) to remove [42].
3. Amplification Cycle Optimization
- Setup: Set up multiple, identical PCR reactions from the same ligated library. Amplify using a gradient of PCR cycles (e.g., 8, 10, 12, 14 cycles).
- Analysis: Purify all reactions and quantify the final yield via qPCR. Also, analyze each on the Bioanalyzer. The optimal cycle number is the one just before the yield plateaus and before overamplification artifacts (like high molecular weight heteroduplexes) appear on the trace [42].
4. Bead Clean-up Efficiency Test
- Bead Ratio Titration: After a reaction requiring clean-up, split the sample into several aliquots. Perform clean-ups using different bead-to-sample ratios (e.g., 0.7x, 0.9x, 1.2x).
- Evaluation: Elute and quantify the samples. The 0.7x ratio may retain only large fragments, the 1.2x ratio may co-purify more adapter dimers, and the 0.9x ratio often provides a good balance for dimer removal. Compare yields and Bioanalyzer profiles to select the best ratio for your application [42] [20].
Workflow for Diagnosing Low Yield
The following diagram illustrates the logical decision-making process for troubleshooting low library yield.
Optimizing Bead-Based Clean-up
The diagram below details the key steps and potential failure points in the SPRI bead clean-up process, which is critical for maximizing library yield.
Within the context of AmpliSeq for Illumina library quality control, the electropherogram generated by the Bioanalyzer or Fragment Analyzer serves as a primary diagnostic tool. An ideal library trace is characterized by a single, smooth, bell-shaped peak centered within the expected size range (e.g., 300–600 bp for PE150 sequencing) and a return to baseline on both sides of the peak [44]. Unusual peak patterns are critical indicators of issues that can compromise sequencing performance, leading to poor data quality, low yield, and failed runs. This guide provides a systematic approach to diagnosing and correcting these common electropherogram anomalies, enabling researchers to produce robust, sequencing-ready libraries.
Frequently Asked Questions (FAQs)
1. What does a "good" or qualified sequencing library profile look like on the Bioanalyzer? A qualified library for a platform like PE150 sequencing should exhibit a smooth, bell-shaped curve resembling a normal distribution, with the main peak located between 300–600 bp. The trace should return to the baseline after the peak, indicating the absence of significant adapter dimers, primer dimers, or other contamination [44].
2. A sharp peak appears at ~70-90 bp in my electropherogram. What is it and how do I fix it? This is a classic signature of adapter dimers [20] [44]. These form when adapters ligate to each other instead of to your DNA insert, and they can monopolize sequencing flow cells.
- Causes: Excess adapters in the ligation reaction, an suboptimal adapter-to-insert molar ratio, or inefficient purification that fails to remove these small fragments [20] [44].
- Solutions: Titrate your adapter concentration to find the optimal ratio. Be more aggressive with size selection; adjusting the bead-to-sample ratio during cleanup can effectively exclude these short fragments [20] [44]. Ensure you are using fresh, active ligase and proper ligation temperatures (20–25°C) [20] [45].
3. My library peak has a "tailing" or "smearing" appearance, trailing off to the right or left. What does this mean? Tailing or smearing indicates a heterogeneous mixture of fragment sizes where the library fails to form a tight, defined peak.
- Causes:
- Improper size selection: A too-wide gel excision range or miscalibrated bead-based cleanup [44].
- Over-amplification during PCR: Too many PCR cycles can cause non-specific amplification and smearing [44].
- High salt concentration: Residual salts from extraction or cleanup can inhibit enzymes and cause fragment quality issues [44] [45].
- Degraded or low-quality input DNA: A smeared input will inevitably lead to a smeared library [20].
4. The main library peak is unusually broad or "chubby." What is the likely issue? A broad peak distribution typically points to fragmentation issues [44].
- Causes: Suboptimal fragmentation conditions where the DNA was either over- or under-sheared [20] [44]. This can result from incorrect time, energy, or enzyme concentration during the fragmentation or tagmentation step.
- Solutions: Re-optimize your fragmentation protocol for your specific sample type and target size. Verify the fragmentation profile on the Bioanalyzer before proceeding to ligation. Also, ensure you are using high-quality, intact input DNA [20] [44].
5. I see multiple peaks in my trace, suggesting non-target fragments. What could they be? Multiple peaks often signal sample cross-contamination from shared tips or tubes, or inadequate size selection that allows fragments outside the target range to persist [44]. In amplicon sequencing, a split peak appearing slightly offset (about one base larger) from the main allele peak can be an artifact known as Excessive Addition Split Peak (EASP). This is caused by the non-templated nucleotide addition activity of Taq DNA polymerase after PCR is complete, and can be mitigated by terminating the reaction with EDTA or formamide [46].
Troubleshooting Guide: Common Electropherogram Anomalies
The following table summarizes the most common unusual peak patterns, their root causes, and corrective actions.
Table 1: Troubleshooting Guide for Unusual Peak Patterns
| Peak Pattern | Primary Root Cause | Corrective Actions |
|---|---|---|
| Adapter Dimers (Sharp peak at ~70-90 bp) [20] [44] | Excess adapters; Inefficient size selection [20] [44] | Titrate adapter:insert ratio; Optimize bead cleanup ratio; Use fresh ligase [20] [44] |
| Tailing / Smearing [44] | Over-amplification; High salt; Poor size selection [44] | Reduce PCR cycles; Add purification step; Tighten size selection parameters [44] |
| Broad Peak (Wide size distribution) [44] | Suboptimal fragmentation [20] [44] | Re-optimize fragmentation time/energy; Use high-quality input DNA [20] [44] |
| Multiple Peaks [44] | Sample cross-contamination; Inefficient cleanup [44] | Improve lab practices (change tips); Re-optimize purification; Use EDTA/formamide to stop PCR [44] [46] |
| Split Peaks (Artifacts in amplicons) [46] [45] | Non-templated nucleotide addition by Taq polymerase [46] | Terminate PCR with EDTA (1-4 mM final conc.) or formamide; Optimize final extension time [46] |
Diagnostic and Correction Workflows
Workflow for Diagnosing Peak Pattern Issues
The following diagram outlines a logical sequence for diagnosing the root cause of abnormal electropherogram patterns.
Protocol for Correcting Adapter-Dimer Contamination
Adapter dimers are one of the most common library preparation failures. This protocol provides a detailed methodology for their removal and prevention.
- Objective: To remove existing adapter dimers from a library and prevent their formation in future preps.
- Experimental Principle: A double-sided size selection using magnetic beads is employed. By adjusting the bead-to-sample ratio, small fragments like adapter dimers are preferentially excluded in the first cleanup, while the desired library fragments are retained in the second [20] [44].
- Materials:
- Magnetic beads (e.g., SPRIselect beads)
- Freshly prepared 80% ethanol
- Nuclease-free water or TE buffer
- Thermomixer or magnetic stand
- Step-by-Step Methodology:
- First Cleanup (Remove Small Fragments): Add a lower ratio of beads to sample (e.g., 0.6X sample volume) to bind and remove large fragments. Discard the supernatant containing the adapter dimers and other small wastes.
- Wash: While the beads (with bound library) are on the magnet, wash twice with 80% ethanol and air dry.
- Elute: Elute the library from the beads in nuclease-free water or TE buffer.
- Second Cleanup (Recover Library): Add a higher ratio of beads (e.g., 1.0X sample volume) to the eluate from step 3 to bind the desired library fragments. This step removes any remaining salts and ensures a clean final product.
- Wash and Elute: Repeat the wash and elution steps. The final eluate is your purified library.
- Expected Outcome: A significant reduction or complete elimination of the ~70-90 bp peak on the Bioanalyzer trace, resulting in a cleaner library profile.
Research Reagent Solutions
The following table lists key reagents and materials essential for diagnosing and correcting library QC issues.
Table 2: Essential Reagents and Kits for Library QC and Troubleshooting
| Item | Function / Application |
|---|---|
| Agilent Bioanalyzer/Fragment Analyzer | Primary instrument for library QC; provides electropherogram of library size distribution and concentration [4] [3]. |
| Fluorometric Quantitation Kits (e.g., Qubit dsDNA Assay) | Accurate quantification of double-stranded DNA library concentration; more specific than UV absorbance [20] [44]. |
| Magnetic Beads (e.g., SPRIselect) | Workhorse for post-ligation and post-PCR cleanups; used for size selection and adapter dimer removal [20] [44]. |
| High-Quality Library Prep Kits | Optimized, validated reagent systems (e.g., from Illumina or Yeasen) designed to minimize common failure points like inefficient ligation and adapter dimer formation [47] [44]. |
| EDTA or Formamide | Used to terminate PCR reactions and prevent artifacts like Excessive Addition Split Peaks (EASP) caused by non-templated polymerase activity [46]. |
FAQ: How can I prevent contamination in my qPCR or PCR experiments?
Contamination is a significant challenge in sensitive molecular biology workflows like qPCR and PCR, primarily due to the technique's incredible sensitivity which can amplify even trace amounts of unwanted DNA. The most common sources are cross-contamination (physical transfer between samples) and carry-over contamination from amplified products of previous experiments [48] [49]. The consequences include false positives and reduced sensitivity, which can compromise entire datasets [49].
Key Prevention Strategies:
- Physical Separation of Workspaces: Establish dedicated, separate areas for different stages of the workflow. At a minimum, implement distinct pre- and post-amplification areas, ideally in different rooms with separate equipment (pipettes, centrifuges, lab coats) [48] [49]. Maintain a one-way workflow where personnel do not move from post-amplification to pre-amplification areas on the same day without changing PPE [48].
- Use of No Template Controls (NTCs): Always include NTCs in your runs. These wells contain all reaction components except the DNA template. Any amplification in the NTC indicates contamination, helping you monitor your workflow's cleanliness [48] [49].
- Meticulous Laboratory Practices: Use aerosol-resistant filter pipette tips to minimize aerosol formation [48] [49]. Open tubes carefully and keep them capped as much as possible [48]. Aliquot all reagents into single-use volumes to avoid contaminating entire stocks [48] [49].
- Rigorous Decontamination: Regularly clean work surfaces and equipment with a 10% bleach solution (sodium hypochlorite), followed by wiping with de-ionized water. Fresh bleach dilutions should be prepared regularly as it is unstable [48] [49]. For thermocycler blocks and other sensitive equipment, use isopropanol or a manufacturer-recommended DNA decontamination solution [50].
- Enzymatic Control (UNG): For qPCR, use a master mix containing Uracil-N-Glycosylase (UNG) and incorporate dUTP in your dNTP mix. UNG selectively degrades any uracil-containing PCR products from previous amplifications before the thermocycling begins, preventing carry-over contamination [48].
The following diagram illustrates the recommended physical workflow to prevent contamination in the laboratory.
FAQ: How do I prevent evaporation and sample loss in my thermocycler?
Evaporation during thermocycling leads to reduced reaction volume, changed reagent concentrations, and failed experiments. Proper sealing and instrument maintenance are key to prevention.
Key Prevention Strategies:
- Ensure a Proper Seal: Use high-quality PCR tubes or plates and matching lids. Ensure the thermocycler's heated lid is correctly adjusted to apply even pressure and is set to the correct temperature (typically 105°C) to condense any vapor back into the tube.
- Validate Thermocycler Lid Function: Regularly check that the heated lid is maintaining the set temperature. An malfunctioning lid is a common cause of widespread evaporation across multiple samples.
- Use Mineral Oil: For reactions particularly prone to evaporation or in instruments without a heated lid, a layer of mineral oil can act as a physical vapor barrier.
- Brief Centrifugation: Always pulse-centrifuge your PCR plates or tubes before placing them in the thermocycler. This ensures all liquid is at the bottom of the tube and prevents droplets from being trapped under the seal, where they can evaporate [49].
FAQ: What is the proper maintenance routine for my thermocycler?
Regular maintenance ensures the accuracy of temperature ramps, holds, and the functionality of the heated lid, which is critical for preventing evaporation.
Key Maintenance Strategies:
- Regular Cleaning: Power off and unplug the instrument, allowing it to cool completely. Wipe the exterior with a soft, dry cloth (a microfiber cloth for screens is ideal). For stubborn stains, use a cloth lightly moistened with a neutral pH soap solution, taking extreme care to prevent liquid from entering the unit [50].
- Decontaminate the Sample Block and Lid: Use a lint-free swab or cloth soaked in isopropanol or a manufacturer-approved DNA decontamination solution to thoroughly clean the sample block wells and the bottom of the heated lid. Ensure everything is completely dry before use [50].
- Clear the Vents: Periodically use a small, soft brush or a cloth moistened with isopropanol to clean the ventilation vents. Blocked vents can lead to overheating and component failure [50].
- Annual Check-up: Perform a yearly comprehensive inspection. Check the electrical cord for damage, test the responsiveness of control buttons and the display, and perform the thorough cleaning described above [50].
- Use a Surge Protector: Protect the sensitive electronics of your thermocycler from power fluctuations by plugging it into a reliable surge protector [50].
The table below summarizes a recommended maintenance schedule.
Table 1: Thermocycler Preventative Maintenance Schedule
| Maintenance Task | Frequency | Key Details | Contamination Control Benefit |
|---|---|---|---|
| Surface Decontamination | Before and after each run | Wipe exterior with 70% ethanol or isopropanol [50]. | Removes surface contaminants. |
| Sample Block & Lid Cleaning | Weekly or as needed (after spills/contamination) | Use lint-free swab with isopropanol or DNA decontaminant. Ensure complete drying [50]. | Eliminates DNA carryover between runs. |
| Vent Cleaning | Monthly | Use a soft brush or cloth to remove dust from vents [50]. | Prevents overheating and maintains performance. |
| Full Instrument Inspection | Annually | Check power cords, buttons, display, and perform deep cleaning [50]. | Ensures long-term reliability and accuracy. |
The Scientist's Toolkit: Essential Reagent Solutions
Having the right tools is fundamental for maintaining reagent integrity and experimental success.
Table 2: Key Research Reagent Solutions for Contamination and Evaporation Control
| Item | Function | Application in Contamination/Evaporation Prevention |
|---|---|---|
| Aerosol-Resistant Filter Tips | Physical barrier within the pipette tip. | Prevents aerosols from contaminating the pipette shaft and subsequent samples, crucial for both pre- and post-PCR pipetting [48] [49]. |
| UNGUracil-N-Glycosylase | Enzymatic contamination control. | When used with dUTP in the PCR mix, it selectively degrades carryover contamination from previous PCR products, protecting against false positives [48]. |
| Bleach (Sodium Hypochlorite) | Chemical decontaminant. | A 10% solution is effective for degrading DNA on non-corrosive surfaces and equipment. Must be freshly prepared weekly for maximum efficacy [48] [49]. |
| Isopropanol | Cleaning and decontaminating agent. | Safe for cleaning the thermocycler sample block, heated lid, and external surfaces without damaging electronics when used properly [50]. |
| DNA/RNA Decontamination Solution | Commercial nucleic acid degrading solution. | Specifically formulated to destroy DNA/RNA on surfaces and equipment without causing corrosion [50]. |
| Single-Use Reagent Aliquots | Pre-portioned reagents. | Dividing bulk reagents into single-use volumes prevents contamination of the entire stock through repeated freeze-thaw cycles and handling [48] [49]. |
| Properly Sealed Tubes/Plates | Sample containment. | High-quality tubes and plates with solid seals are the primary physical barrier against evaporation during high-temperature cycling. |
Technical Support & Troubleshooting Guides
FAQ: Addressing Common Library Preparation Challenges
Q1: What are the primary causes of poor coverage uniformity in my sequencing data?
Poor coverage uniformity often stems from issues during the library preparation stage. A non-diverse library, where certain genome fragments are missing or underrepresented, will lead to gaps in the sequencing data, as these missing portions cannot be sequenced. Additionally, inaccurate pooling of normalized libraries, resulting in an imbalance of library representation, is a common cause. Errors introduced during library preparation are particularly critical because quality scores from the sequencer will not reflect them, making the data appear clean despite the underlying gaps [51].
Q2: How can I identify a suboptimal library prior to sequencing?
Using the Agilent Bioanalyzer or Fragment Analyzer to check library quality is essential. You should examine the trace to confirm the expected average library size, verify that a clear library peak is present, and ensure the absence of additional small or large peaks that indicate contaminants like adapter dimer or over-amplified products. An ideal trace will have a single, well-defined peak. Reviewing educational resources, such as Illumina's support webinar on this topic, can help you recognize the phenotypes of both ideal and problematic traces [4] [3].
Q3: What is the effect of adapter dimer, and how can it be removed?
Adapter dimer is a common byproduct of library preparation that can sequester sequencing throughput and reduce the quality of your data. It appears as a small peak (around 128 bp) on a Bioanalyzer trace. Illumina's knowledge base contains dedicated articles on the causes, effects, and methods for removing adapter dimers, which often involve optimization of purification steps and the use of validated cleanup protocols [52].
Q4: How can I use a benchtop sequencer for library QC to improve final pool balance?
The iSeq 100 system can be used for library and pooling QC prior to a large-scale run on a system like the NovaSeq 6000. The process involves running a small aliquot of your normalized library pool on the iSeq, then using the demultiplexed data to calculate a rebalancing factor for each library. This allows you to add more volume of underrepresented samples and less of overrepresented ones, creating a final pool with even library representation, which directly improves coverage uniformity [53].
Troubleshooting Guide: Library QC and Analysis
Table 1: Troubleshooting Common Library Preparation Issues
| Observed Issue | Potential Causes | Corrective & Preventive Actions |
|---|---|---|
| Low Library Diversity / Gapped Coverage | Non-uniform fragmentation, over-amplification, inaccurate normalization [51]. | Use high-quality library prep kits (e.g., TruSeq); employ iSeq QC for pool rebalancing; optimize PCR cycle numbers [53] [51]. |
| Adapter Dimer Contamination | Excessive PCR cycles, inefficient purification post-ligation, suboptimal adapter concentration [52]. | Optimize cleanup protocol using size selection beads; refer to Illumina's specific guide on adapter dimer removal [52]. |
| Inaccurate Library Quantification | Use of imprecise quantification methods, pipetting errors during dilution [53]. | Use fluorometric methods for quantification; perform serial dilutions for accuracy; use sufficient volumes to minimize pipetting error [53]. |
| Over-amplification Bias | Excessive number of PCR cycles during library amplification, leading to skewed representation and duplicate reads. | Determine the minimum number of PCR cycles required for sufficient yield; use master-mixed reagents to minimize pipetting steps and variability [51]. |
Experimental Protocols & Data Presentation
Protocol: Library Pool Rebalancing Using iSeq 100 QC
This protocol details how to use the iSeq 100 System to check and rebalance a library pool for improved coverage uniformity on a subsequent NovaSeq 6000 run [53].
- Normalize Libraries: Quantify each uniquely indexed library and dilute each to a 1 nM concentration using Resuspension Buffer (RSB) or 10 mM Tris-HCl, pH 8.5. Using serial dilutions is recommended for accuracy.
- Create Initial Pool: Combine equal volumes of each 1 nM normalized library. For example, to pool 6 libraries, add 1 µl of each to a tube for a total of 6 µl of a 1 nM pool.
- Dilute for iSeq Load: Dilute the 1 nM library pool to a 100 pM concentration. For the 6-library example, add 5 µl of the 1 nM pool to 45 µl of RSB to make 50 µl of a 100 pM stock.
- Run iSeq 100 System: Load 20 µl of the 100 pM pool onto the iSeq 100 and perform the sequencing run. Use the Generate FASTQ analysis module in Local Run Manager for automated demultiplexing.
- Calculate Rebalanced Pool Volumes:
- First, normalize the demultiplexed percentage data to 100%. The formula is:
Normalized % = [(Demultiplexed % for sample) / (Total % Reads Identified)] x 100 - Find the maximum (MAX) value from all the Normalized % values.
- For each library, calculate a new volume for the final pool using the formula:
New Volume (µl) = Initial Volume (µl) x (MAX Normalized % / Sample's Normalized %)
- First, normalize the demultiplexed percentage data to 100%. The formula is:
- Create Rebalanced Pool: Combine the calculated new volumes of each library to create a rebalanced pool. This pool can be run on the iSeq again to verify balance or sequenced directly on the NovaSeq 6000 at an empirically determined higher concentration (e.g., 4x the iSeq concentration) [53].
Table 2: Example Library Pool Rebalancing Calculations
| Sample Name | Demultiplexed % | Normalized to 100% | Scaling Factor (MAX/Norm %) | Rebalanced Volume (µl) |
|---|---|---|---|---|
| NDFBcereus1 | 18.90 | 19.97 | 1.00 (19.97/19.97) | 1.00 |
| NDFBcereus2 | 17.43 | 18.42 | 1.08 (19.97/18.42) | 1.08 |
| NDFRsphaer1 | 16.89 | 17.85 | 1.12 (19.97/17.85) | 1.12 |
| NDFRsphaer2 | 15.24 | 16.10 | 1.24 (19.97/16.10) | 1.24 |
| NDFEcoli1 | 13.45 | 14.21 | 1.41 (19.97/14.21) | 1.41 |
| NDFEcoli2 | 12.69 | 13.41 | 1.49 (19.97/13.41) | 1.49 |
| Total/Sum | 94.6% | 100% | 7.33 µl |
Workflow Diagram: Path to Optimal Library Preparation
The following diagram illustrates the logical workflow and decision points for achieving optimal library preparation and coverage.
The Scientist's Toolkit: Essential Research Reagents & Materials
Table 3: Key Reagent Solutions for Library QC and Preparation
| Item | Function & Application |
|---|---|
| TruSeq Library Prep Kits | High-quality library construction solutions (e.g., TruSeq Stranded Total RNA, TruSeq DNA Nano) known for high coverage uniformity, precise strand information, and reliability through simplified, master-mixed workflows [51]. |
| Agilent Bioanalyzer / Fragment Analyzer | Instruments used for capillary electrophoresis to check library quality, estimate library size and distribution, and identify contaminants like adapter dimer prior to sequencing [4] [3]. |
| iSeq 100 System | A benchtop sequencing system used for cost-effective library and pooling QC. It generates data that guides the rebalancing of library pools to ensure even sample representation before large-scale production runs [53]. |
| Resuspension Buffer (RSB) | A low EDTA TE buffer, typically 10 mM Tris-HCl at pH 8.5, used for diluting and resuspending Illumina library constructs and pools [53]. |
| Size Selection Beads | Magnetic beads used for the selective purification of DNA fragments within a specific size range, which is critical for removing unwanted adapter dimer and optimizing library insert size [52]. |
Validation and Comparative Analysis: Ensuring Robust AmpliSeq Performance Across Applications
Troubleshooting Guide: Resolving Discrepancies Between BioAnalyzer and qPCR Results
Problem: Researchers frequently observe significant concentration differences when quantifying the same Next-Generation Sequencing (NGS) library using BioAnalyzer (or similar electrophoresis systems) versus qPCR-based methods. This discrepancy can lead to suboptimal sequencing performance, including uneven sample coverage or cluster over- or under-loading.
Explanation: This difference stems from the fundamental principles each technique uses to quantify DNA:
- Bioanalyzer and Electrophoresis Methods: These separate DNA fragments by size and use intercalating dyes to estimate concentration based on fluorescence intensity. They provide excellent visual representation of the library's size distribution and can identify contaminants like adapter dimers. However, they quantify all double-stranded DNA molecules present, including fragments with incomplete adapters or other non-amplifiable by-products that cannot become clusters on a sequencer [54] [9].
- qPCR-based Methods: These techniques use primers specific to the adapter sequences and only amplify fragments that contain complete, functional adapter ends. Therefore, qPCR quantifies only the "amplifiable" fraction of the library—the molecules that are actually capable of being sequenced [54] [9].
Solution:
- Always Use Both Methods for Critical Workflows: For optimal sequencing results, use BioAnalyzer (or TapeStation, Fragment Analyzer) to assess the size distribution and purity of your library, and use qPCR to determine the molar concentration of sequencer-ready fragments for pooling [9].
- Inspect the Bioanalyzer Trace: Before comparing concentrations, check the electrophoregram for a clean, singular peak at your expected insert size. If you see a large peak around ~70-90 bp (indicating adapter dimers) or a "bump" at a high molecular weight (indicating over-amplification "bubble products"), the library requires further cleanup or optimization [9] [20].
- Correlate with Sequencing Output: Studies have shown that qPCR quantification provides a more accurate prediction of final sequencing coverage than methods like Qubit or TapeStation alone, as it directly counts the amplifiable molecules [54].
The following workflow illustrates the recommended strategy for cross-platform quality control:
Frequently Asked Questions (FAQs)
Q1: My Bioanalyzer shows a high library concentration, but my qPCR result is very low. What does this mean?
A: This is a classic indicator of a high proportion of non-functional library molecules in your sample. Your library may be contaminated with:
- Adapter Dimers: Short fragments (~70-90 bp) consisting only of adapters ligated to each other. They are visible on the Bioanalyzer but lack the insert sequence needed for qPCR amplification with library-specific primers [9] [20].
- Incomplete Library Fragments: Molecules that failed during the adapter ligation step and therefore lack the full primer binding sites required for qPCR amplification [54].
- Over-amplification Artifacts: Excessive PCR cycles can create aberrant products like "bubble" structures, which are detected by the Bioanalyzer but are poorly quantified by qPCR and can impair sequencing [9].
Solution: Re-purify the library using bead-based cleanup with optimized ratios to remove short fragments. If over-amplification is suspected, reduce the number of PCR cycles in the library preparation protocol [9] [20].
Q2: How do I formally correlate Bioanalyzer data with qPCR data for a validation experiment?
A: To systematically correlate data from these platforms, follow this experimental protocol:
- Sample Preparation: Create a dilution series of your NGS library (e.g., undiluted, 2x, 4x, 8x, 16x). This provides a range of concentrations for analysis [54].
- Parallel Quantification: Quantify each dilution in triplicate using both the Bioanalyzer (or TapeStation) and qPCR.
- Data Conversion: Convert the raw data to a consistent unit. Convert the Bioanalyzer's concentration (ng/µL) to molarity (nM) using the average fragment size it provides. The qPCR assay typically provides a molar concentration (nM) directly.
- Statistical Analysis: Perform a linear regression analysis, plotting the qPCR-derived molar concentrations (often considered the more accurate "gold standard" for functional molecules) against the Bioanalyzer-derived molar concentrations. A strong correlation (R² > 0.98) indicates that your library preparation is highly efficient and produces a consistent ratio of functional molecules. A poor correlation suggests the presence of variable amounts of non-functional fragments [54].
Q3: Why is my sequencing coverage still uneven even though I pooled my libraries based on accurate qPCR data?
A: While qPCR is the best method for quantifying amplifiable fragments, other factors can affect coverage:
- Library Complexity: Low-input or over-amplified libraries can have low complexity, leading to high duplication rates and uneven coverage, even if the molar concentration is correct [20].
- Sequence-Specific Bias: Libraries with extreme GC content or secondary structures can amplify less efficiently during the cluster generation on the sequencer itself, despite being quantified correctly by qPCR [55].
- Bioanalyzer for Size Verification: Even with perfect qPCR quantification, a broad size distribution on the Bioanalyzer can lead to a mix of fragment sizes being sequenced, which might affect coverage uniformity if not accounted for in pooling calculations [9].
Comparative Data of Quantification Methods
The following table summarizes key findings from a comprehensive study comparing eight different methods for quantifying NGS libraries [54].
Table 1: Comparison of NGS Library Quantification Methods
| Method Category | Example Instruments/Assays | What It Quantifies | Relative Concentration Estimate | Correlation to Sequencing Coverage |
|---|---|---|---|---|
| Spectrophotometry | NanoDrop | All nucleic acids (dsDNA, ssDNA, RNA, free nucleotides) | Highest | Poor |
| Fluorometry (Intercalating Dyes) | Qubit (dsDNA HS Assay) | Total double-stranded DNA | Intermediate | Moderate |
| Microfluidics Electrophoresis | Bioanalyzer, TapeStation, Fragment Analyzer | Total dsDNA, with size resolution | Intermediate | Moderate |
| qPCR | Ion Library Quantitation Kit, Kapa Biosystems qPCR | Only fragments with full adapters (amplifiable) | Lowest | Most Accurate |
Research Reagent Solutions
Table 2: Essential Tools for NGS Library QC and Validation
| Reagent / Kit | Function | Key Feature |
|---|---|---|
| Bioanalyzer High Sensitivity DNA Kit | Provides size distribution and quantitative analysis of DNA libraries in the ~50-7000 bp range. | Chip-based microfluidics for visualizing adapter dimers and library profile [54]. |
| qPCR Library Quantification Kits | Accurately determines the molar concentration of sequencing-competent library molecules. | Uses primers targeting platform-specific adapter sequences (e.g., Illumina P5/P7, Ion Torrent A/P1) [54] [9]. |
| SPRI Beads | Used for post-library cleanup and size selection to remove primer dimers and other small artifacts. | Paramagnetic beads allow for precise ratio-based cleanup to enrich for target fragment sizes [20]. |
| Synthetic dsDNA Oligos | Contains exact adapter sequences; used as a positive control for qPCR assays and to validate quantification methods. | Helps distinguish between quantification of adapter dimers vs. functional library molecules [54]. |
Troubleshooting Guides
Library QC and Troubleshooting for Bioanalyzer and Fragment Analyzer
Q: What are the key features of an ideal library trace on the Bioanalyzer or Fragment Analyzer, and what do anomalies indicate?
An ideal final library trace should show a single, narrow peak that corresponds to the expected average library size, confirming a uniform population of library fragments. The absence of additional small or large peaks is critical, as these indicate contaminants or incomplete reactions [3]. Specific anomalies and their common causes include:
- A peak at ~125 bp: This typically indicates the presence of adapter dimers, which can inefficiently consume sequencing cycles and data. Their causes include using an unbalanced adapter-to-insert ratio or suboptimal purification post-ligation [52].
- A broad or smeared peak distribution: This suggests significant size heterogeneity in the library, which can result from DNA input that is degraded or sheared to a variable size range.
- Multiple distinct peaks: This can point to contamination from other DNA sources or PCR artifacts. Expert recommendations emphasize implementing rigorous laboratory practices to prevent PCR contamination, which is a common source of such extraneous peaks [52] [47].
Q: How can I troubleshoot elevated PhiX alignment rates in my sequencing run?
Elevated PhiX alignment rates often indicate a problem with the primary library. A low-diversity library, such as one highly enriched for a specific amplicon, may not cluster efficiently on its own. The sequencer relies more heavily on the spiked-in PhiX control to generate sufficient data diversity for calibration. Troubleshooting should, therefore, focus on the library preparation itself [52]. Consider these steps:
- Verify Library QC: Re-inspect the Bioanalyzer trace for the issues described above, particularly adapter dimers or an off-target size distribution [4].
- Check Library Quantification: Ensure the library was accurately quantified to prevent underloading or overloading the flow cell.
- Review Panel Design (for Amplicon Panels): For targeted panels like AmpliSeq, ensure the panel is properly designed and that the PCR amplification was efficient and specific. Illumina provides specific resources for optimizing amplicon sequencing data [47].
Troubleshooting 16S Metagenomic Sequencing
Q: Our 16S metagenomic sequencing assay has a high limit of detection. How can we improve its sensitivity for clinical samples?
Improving the sensitivity of a 16S metagenomic sequencing (16S MG) assay requires optimization at both the wet-lab and bioinformatics levels. A validated clinical 16S MG assay demonstrated a limit of detection of 10 to 100 colony-forming units/mL [56]. Key considerations for achieving high sensitivity include:
- Optimize DNA Extraction: Use a robust extraction protocol designed for the specific sample type (e.g., body fluids) to maximize yield and minimize inhibitors.
- PCR Amplification Efficiency: Ensure the 16S rRNA gene PCR is highly efficient. This includes using high-fidelity polymerase, optimizing primer sequences to cover a broad bacterial range, and carefully cycling conditions.
- Target the Full-Length Gene: While short-read sequencing of variable regions is common, sequencing the full-length (~1500 bp) 16S gene provides superior taxonomic resolution and can improve detection confidence, especially for closely related species [57].
- Bioinformatic Filtering: Implement stringent but accurate bioinformatic pipelines to distinguish true low-abundance signals from sequencing errors or background noise.
Q: What are the primary advantages of a quantitative 16S MG assay over conventional culture methods?
A quantitative 16S MG assay offers several critical advantages, particularly for complex clinical cases [56]:
- Culture-Independent Detection: It can identify pathogens in culture-negative samples, which is crucial for patients who have already received antibiotics.
- Detection of Polymicrobial Infections: The assay can identify and quantify all bacterial species in a sample, whereas culture may only isolate the most dominant one or a few.
- Speed: While not always faster than culture, it can provide a comprehensive result without the need for prolonged incubation.
- Quantification: The assay provides quantitative data on bacterial load, which can be useful for monitoring infection progression or response to treatment.
Troubleshooting Cancer Panel Analysis
Q: How can we minimize reports of Variants of Uncertain Significance (VUS) in our cancer predisposition panel testing?
Minimizing VUS reports is essential for clinical utility. A study of 1,462 patients tested with multigene cancer panels (BROCA or ColoSeq) achieved a low VUS rate by implementing an expert-driven, multi-faceted interpretation framework [58]. The strategy involves:
- Utilizing All Available Evidence: Classify variants using established guidelines (e.g., International Agency for Research on Cancer (IARC)) and incorporate data from evolutionary conservation (GERP), in-silico prediction tools (SIFT, PolyPhen), and functional assays.
- Leveraging Population Frequency: Postulate that variants commonly found in general population databases are likely benign.
- Incorporating Clinical History: Interpret the variant in the context of the patient's personal and family cancer history. A variant is more likely to be pathogenic if it is found in a gene associated with the patient's personal or familial cancer syndrome.
- Domain-Specific Knowledge: Assess the variation tolerance of specific protein domains. A missense variant in a domain known to harbor pathogenic mutations is more suspect than one in a domain with abundant benign variation [58].
- Expert Consensus Review: Have multiple experts review each variant independently and then in consensus conference to finalize the classification.
Frequently Asked Questions (FAQs)
General Library Preparation
Q: What are the best practices for preventing PCR contamination in my NGS workflow? Best practices include using separate physical areas for pre- and post-PCR work, employing dedicated equipment and reagents, using uracil-DNA glycosylase (UDG) treatments to carryover contaminants, and including negative controls in every run to monitor for contamination [47].
Q: Where can I find detailed training materials for the AmpliSeq for Illumina Comprehensive Panel v3? Illumina's support portal offers dedicated training resources, including a 30-minute library prep protocol course, a 15-minute technology overview, and webinars on how to optimize amplicon sequencing data and perform library QC [47].
16S Metagenomics
Q: Should I sequence a sub-region or the full-length 16S rRNA gene? Sequencing the full-length (~1500 bp) gene provides significantly better taxonomic resolution at the species and strain level compared to any single variable sub-region (e.g., V4). In-silico experiments show that some sub-regions, like V4, fail to classify over 56% of sequences to the correct species, while the full-length gene succeeds in nearly all cases [57].
Q: What is intragenomic 16S copy variation, and why does it matter? Many bacterial genomes contain multiple copies of the 16S rRNA gene, and these copies can have slight sequence variations (polymorphisms) within the same genome. With full-length, high-accuracy sequencing, it is possible to resolve these variants. Accounting for this variation is crucial, as it can be used to improve discrimination between closely related strains but can also be misinterpreted as distinct species if not properly handled [57].
Data Analysis and Interpretation
Q: For cancer panel testing, what constitutes a pathogenic vs. a likely pathogenic variant? Based on IARC guidelines, a variant is classified as pathogenic if the estimated probability of pathogenicity (P) is > 0.99. A variant is likely pathogenic if P is between 0.95 and 0.99. This classification integrates evidence such as the variant type (e.g., truncating mutations are typically pathogenic), population frequency, computational predictions, and available clinical and functional data [58].
Experimental Protocols & Performance Data
Protocol: Quantitative 16S Metagenomic Sequencing for Bacterial Pathogen Detection
This protocol is adapted from a validated clinical assay for bacterial detection in body fluids [56].
- Sample Preparation: Process body fluids (CSF, synovial fluid, abscess material) according to established clinical laboratory protocols. Include a negative control (sterile water) and a positive control (a mock community or sample with known low-titer bacteria) in each run.
- DNA Extraction: Extract genomic DNA using a robust, standardized kit (e.g., QIAamp DNA Microbiome Kit). Include a bead-beating step or other mechanical lysis to ensure efficient rupture of tough bacterial cell walls.
- 16S rRNA Gene Amplification: Perform a broad-range PCR amplification of the near-full-length 16S rRNA gene using primers targeting conserved regions. Use a high-fidelity polymerase to minimize amplification errors.
- Library Preparation: Prepare sequencing libraries from the purified PCR amplicons using a commercial library prep kit (e.g., Illumina DNA Prep). This typically involves fragmentation, end-repair, adapter ligation, and index PCR.
- Quality Control: Assess the final library's quality and quantity using the Fragment Analyzer or Bioanalyzer to confirm the expected size profile and absence of primer dimers [4].
- Sequencing: Pool indexed libraries and sequence on an appropriate Illumina platform (e.g., MiSeq or NextSeq) to achieve sufficient depth.
- Bioinformatic Analysis:
- Processing: Demultiplex reads, perform quality filtering, and merge paired-end reads.
- Denoising: Use a denoising algorithm (e.g., DADA2) to infer exact amplicon sequence variants (ASVs), correcting for PCR and sequencing errors.
- Taxonomic Assignment: Classify ASVs against a curated 16S database (e.g., SILVA or Greengenes) using a classifier like the RDP classifier.
- Quantification: Report the relative abundance of each identified taxon.
Protocol: Analytical Validation for a Cancer Predisposition Panel
This framework is based on the validation of the BROCA and ColoSeq multigene panels [58].
- Panel Design: Design capture probes to target all exons, 5' and 3' untranslated regions, and non-repetitive portions of introns for all genes on the panel. This enables the identification of single nucleotide variants, small insertions/deletions (indels), and larger structural variants.
- Wet-Lab Validation:
- Precision/Reproducibility: Sequence a set of reference samples across multiple runs and operators to measure consistency.
- Analytical Sensitivity/Specificity: Assess the assay's ability to detect known positive variants (including SNVs, indels, and large deletions) and its true negative rate against a validated orthogonal method (e.g., Sanger sequencing).
- Limit of Detection: Serially dilute a sample with a known variant to determine the lowest variant allele frequency at which the mutation can be reliably called.
- Sequencing and Variant Calling: Sequence germline DNA on a platform like the Illumina HiSeq 2500. Use an established informatics pipeline for alignment (to hg19) and variant calling for SNVs, indels, and structural variants.
- Variant Interpretation: This is a critical step. As described in the troubleshooting section, use a multi-expert review process adhering to IARC guidelines. Integrate evidence from population databases, computational predictions, clinical history, and published literature to classify variants as Benign, Likely Benign, VUS, Likely Pathogenic, or Pathogenic.
Table 1: Performance Characteristics of a Validated 16S Metagenomic Sequencing Assay [56]
| Performance Characteristic | Result |
|---|---|
| Limit of Detection | 10 - 100 CFU/mL |
| Linearity | Met clinical requirements |
| Precision | Met clinical requirements |
| Specificity | Met clinical requirements |
| Clinical Concordance | Matched culture in 75% (15/20) of samples; detected additional species in 5 samples, including one culture-negative sample. |
Table 2: Diagnostic Yield of Multigene Cancer Panels in a Clinical Cohort (n=1,462) [58]
| Result Category | Percentage of Patients |
|---|---|
| Damaging Mutations (Pathogenic/Likely Pathogenic) | 12% |
| Initial VUS Reports | 10.5% |
| VUS after Reclassification | 7.5% |
| Actionable Findings (in breast/colorectal cancer patients) | 13% |
| Actionable Findings (in cancer-free subjects with family history) | 4% |
Workflow and Process Diagrams
The Scientist's Toolkit: Research Reagent Solutions
Table 3: Essential Materials for NGS Library QC and Targeted Sequencing
| Item | Function / Application |
|---|---|
| Agilent Bioanalyzer | An automated electrophoresis system that provides a visual trace of library fragment size and distribution, used for quality control prior to sequencing [4] [3]. |
| Fragment Analyzer | A capillary electrophoresis instrument similar to the Bioanalyzer, used for high-quality assessment of NGS library size and concentration [3]. |
| AmpliSeq for Illumina Panels | A targeted sequencing technology that uses multiplex PCR to amplify genes of interest (e.g., cancer predisposition panels) for highly sensitive and specific detection of variants [47] [58]. |
| 16S rRNA Gene Primers | PCR primers designed to amplify conserved regions of the bacterial 16S rRNA gene for metagenomic studies and pathogen detection [56] [57]. |
| PhiX Control Kit | A well-characterized control library spiked into sequencing runs (typically 1-5%) to serve as a quality control metric for low-diversity libraries like amplicons, helping with cluster detection and alignment rate calibration [52]. |
| High-Fidelity PCR Master Mix | A PCR enzyme blend designed for high accuracy and yield during amplification, critical for minimizing errors in amplicon-based sequencing (e.g., 16S, AmpliSeq) [56]. |
Quality control (QC) of sequencing libraries is a critical step in ensuring the success of next-generation sequencing (NGS) experiments. For AmpliSeq for Illumina panels, accurate assessment of library quality, quantity, and fragment size distribution is essential for generating optimal sequencing data. This technical support center provides comprehensive guidance on utilizing three major automated electrophoresis systems—Agilent BioAnalyzer, Agilent TapeStation, and Fragment Analyzer—for AmpliSeq library QC. Within the context of a broader thesis on AmpliSeq for Illumina library QC and troubleshooting, this resource directly addresses the practical challenges researchers, scientists, and drug development professionals encounter when selecting and implementing these QC platforms. The content is structured to provide immediate troubleshooting assistance while fostering a deeper understanding of the technical considerations underlying effective quality assessment strategies.
Technology Comparison Tables
Key Specifications and Performance Metrics
Table 1: System specifications and throughput comparison
| Feature | Agilent BioAnalyzer 2100 | Agilent TapeStation 4200 | Fragment Analyzer |
|---|---|---|---|
| Sample Throughput per Run | 12 samples [59] | 96 samples [59] | Information not available in search results |
| Sample Volume Requirement | 1μL minimum [30] | 1μL minimum [59] | Information not available in search results |
| Quantitative Range (RNA) | 25–500 ng/μL [59] | 25–500 ng/μL [59] | Information not available in search results |
| Primary QC Metrics | RIN (RNA Integrity Number) [59] | RINe (RIN equivalent), DV200 [59] | Information not available in search results |
| Analysis Method | Microfluidics-capillary electrophoresis [59] | Automated electrophoresis [59] | Capillary electrophoresis [25] |
Table 2: Performance characteristics and practical considerations
| Aspect | Agilent BioAnalyzer 2100 | Agilent TapeStation 4200 | Fragment Analyzer |
|---|---|---|---|
| RNA Integrity Algorithm | Assesses entire electrophoretic trace, 28S:18S ratios, degradation products [59] | Measures relative ratio of degraded products in fast zone to 18S peak signal [59] | Information not available in search results |
| Correlation with BioAnalyzer RIN | Reference standard | Weak correlation (r²=0.393), average difference of 3.2 RIN units [59] | Information not available in search results |
| Sample Pass Rate at RIN/RINe 6.5 | 95.6% of samples pass [59] | 23.5% of samples pass (same sample set) [59] | Information not available in search results |
| Recommended Quantification Method | Fluorometric methods (Qubit), qPCR for adapter-ligated libraries [11] | Fluorometric methods (Qubit), qPCR for adapter-ligated libraries [11] | Internal size standards (e.g., LIZ, ROX) [25] |
The Scientist's Toolkit: Essential Research Reagent Solutions
Table 3: Key reagents and consumables for automated electrophoresis systems
| Reagent/Consumable | Function | Compatibility/Notes |
|---|---|---|
| RNA 6000 Nano/Pico Kit | Total RNA analysis and integrity assessment | BioAnalyzer systems [30] |
| ScreenTape Assays | Automated RNA/DNA analysis | TapeStation systems [59] |
| Internal Size Standards (LIZ, ROX) | Fragment sizing and quantification | Fragment Analyzer systems [25] |
| HiDi Formamide | Sample denaturation and stability | Fragment Analyzer; prevents evaporation, ensures consistent migration [25] |
| Electrode Cleaner Chips | System maintenance and RNase decontamination | BioAnalyzer; included with chip purchases [30] |
| RNaseZAP or Equivalent | Surface decontamination to prevent RNA degradation | Critical for RNA sample handling [30] |
Platform Selection Workflow
Frequently Asked Questions (FAQs) and Troubleshooting Guides
Platform Selection and Implementation
Q1: Can I use RIN and RINe metrics interchangeably when comparing BioAnalyzer and TapeStation data?
No, RIN (BioAnalyzer) and RINe (TapeStation) should not be used interchangeably despite using the same 1-10 value system. Research demonstrates only a weak correlation between these metrics (r²=0.393) with an average difference of 3.2 RIN units. When applying a quality threshold of 6.5, 95.6% of samples passed using RIN compared to only 23.5% using RINe from the same sample set. It is crucial to establish separate quality thresholds for each metric specific to your experimental conditions [59].
Q2: What are the key throughput considerations when selecting between these platforms?
The BioAnalyzer processes 12 samples per run, making it suitable for lower-throughput laboratories. The TapeStation processes 96 samples per run, offering significantly higher throughput for core facilities or high-volume experiments. The Fragment Analyzer's specific throughput varies by model and application [59].
Q3: What quantification methods does Illumina recommend for sequencing libraries?
Illumina recommends fluorometric-based methods (e.g., Qubit) that are specific to double-stranded or single-stranded DNA, and qPCR for libraries with Illumina adapters. UV spectrophotometry is not recommended due to potential inaccuracies [11].
Technical Issues and Problem Resolution
Q4: My BioAnalyzer RNA ladder shows degradation patterns. How should I troubleshoot this?
Degraded RNA ladders display abnormal electrophoregrams with shifted or absent peaks. To resolve this:
- Confirm degradation by checking ladder quality with an alternative method
- Perform RNase decontamination of the electrode cartridge using RNaseZAP followed by RNase-free water
- Use new electrode cleaner chips, RNase-free pipette tips, and fresh RNase-free water
- Prepare fresh ladder aliquots stored at -70°C
- Decontaminate lab benches and pipettes with RNaseZAP
- Use a dedicated electrode cartridge for RNA assays [30]
Q5: My fragment analysis shows low signal intensity. What could be causing this?
For low signal intensity issues:
- Verify reagent storage conditions and expiration dates
- Run internal size standards alone to isolate the issue
- If size standards show normal signal, optimize PCR conditions (increase template, primer concentration, or cycle number)
- Check fluorescently labeled primers - resynthesize if necessary
- Ensure proper sample dilution and use of HiDi Formamide (not water) for stability
- Confirm dye set compatibility in instrument settings [25]
Q6: I observe broad peaks in my fragment analysis data. What are potential causes?
Broad peaks can result from:
- Expired or degraded polymer or buffer
- Capillary array degradation
- Sample degradation (run fresh samples if older than 24 hours)
- High salt concentration in samples
- System leaks that divert current and slow sample migration
- Run size standard-only samples to determine if issue is sample-specific [25]
Methodology and Best Practices
Q7: What are the specific sample input requirements for successful AmpliSeq libraries?
For AmpliSeq for Illumina panels, DNA input ranges from 1-100 ng depending on application, with 10 ng per pool recommended for most applications. DNA purity must have A260/A280 ratio of 1.8-2.0. PicoGreen or Qubit DNA HS assays are recommended for accurate quantification rather than UV spectrophotometry [41].
Q8: How can I prevent adapter dimers in my sequencing libraries?
Adapter dimers (sharp peaks at ~70-90 bp in electrophoregrams) can be minimized by:
- Optimizing adapter-to-insert molar ratios to avoid excess adapters
- Ensuring efficient ligation with fresh enzymes and proper buffer conditions
- Implementing optimized bead-based cleanup with appropriate size selection
- Using two-step indexing instead of one-step PCR approaches
- Carefully controlling purification parameters to remove small fragments [20]
Q9: What specific maintenance schedules should I follow for BioAnalyzer systems?
Regular maintenance is essential for consistent performance:
- Before each run (RNA Nano): Clean electrode with RNaseZAP for 60 seconds followed by RNase-free water for 10 seconds
- After each run (RNA Nano): Rinse electrode with RNase-free water for 10 seconds
- Monthly or after liquid spills: Perform complete RNase decontamination with brush using RNaseZAP followed by RNase-free water
- For RNA Pico and Small RNA kits: Use extended water rinses (5 minutes before run, 30 seconds after run) [30]
Core Concepts and Performance Data
Key Definitions and Performance Metrics
Sensitivity refers to the lowest concentration of an analyte that can be consistently detected against the assay's background signal. High sensitivity is crucial for avoiding false negatives, especially in clinical contexts where test results guide treatment plans [60].
Specificity is an assay's ability to correctly identify the target analyte without reacting to non-target molecules, thereby eliminating background noise and false positives. Achieving high specificity depends on precise reagent dispensing to ensure uniform concentrations and prevent cross-contamination [60].
Quantitative Performance of a High-Sensitivity Liquid Biopsy Assay
Comprehensive genomic profiling (CGP) liquid biopsy assays with enhanced sensitivity are critical in precision oncology, particularly for tumors that shed circulating tumor DNA (ctDNA) at low abundance [61] [62].
Table 1: Analytical Validation Performance of a High-Sensitivity CGP Assay
| Variant Class | 95% Limit of Detection | Performance vs. On-Market Assays |
|---|---|---|
| SNV/Indels | 0.15% variant allele frequency (VAF) [61] [62] | Identifies 51% more pathogenic variants [61] |
| CNVs (Amplification) | 2.11 copies [61] | Identifies 109% more CNVs [61] |
| CNVs (Loss) | 1.80 copies [61] | |
| Gene Fusions | 0.30% [61] | |
| Overall Impact | 45% fewer null reports (no pathogenic/actionable results) [61] |
The majority (91%) of additional clinically actionable SNV/indels detected by this assay were found below 0.5% VAF, demonstrating its critical utility for profiling low-shedding tumors [61].
Troubleshooting Guides & FAQs
Troubleshooting Common NGS Library Preparation Issues
Table 2: Common NGS Library Preparation Issues and Solutions
| Problem Scenario | Expert Recommendations & Solutions |
|---|---|
| Presence of Adapter Dimers (Peak at ~70 bp or ~90 bp) [35] | - Form during adapter ligation and should be removed by size selection.- Perform an additional clean-up step prior to template preparation, as dimers decrease usable sequencing reads [35]. |
| Low Library Yield Post-Amplification [35] | - Double-check DNA quantification method (recommended: TaqMan RNase P Detection Reagents Kit).- If using 50-100 ng input, add 1-3 cycles to the initial amplification (not the final amplification) to avoid bias toward smaller fragments [35]. |
| Low or No Signal from Bioanalyzer/TapeStation [63] | - Do not stop the workflow. Sequence the library even with weak or invisible QC peaks, as successful NGS data is often still obtainable [63].- Use a positive control (e.g., Tri-Methyl-Histone H3 (Lys4)) to evaluate protocol success [63]. |
| Inefficient Bead-Based Clean-Up [35] | - Mix nucleic acid binding beads thoroughly before dispensing.- Use fresh ethanol and pre-wet pipette tips for accurate volume transfer.- Completely remove residual ethanol before elution; avoid over-drying or under-drying beads [35]. |
Frequently Asked Questions (FAQs)
Q: My CUT&Tag DNA library concentration is very low (<3 ng/µL via NanoDrop) and shows no peak on the Bioanalyzer. Should I proceed with sequencing? A: Yes, proceed with sequencing if concentration is >3 ng/µL, especially if your positive control generates the expected yield and/or peaks. CUT&Tag can deliver quality NGS data even with low QC signals [63].
Q: Can I use the Ion Library Quantitation Kit to accurately quantify my library if adapter dimers are present? A: No, the Ion Library Quantitation Kit for qPCR cannot differentiate amplifiable primer-dimers from library fragments. Assess library size distribution and check for adapter dimers using a Bioanalyzer instrument instead [35].
Q: What is an alternative QC method for my CUT&Tag DNA library if Bioanalyzer signal is low? A: Perform qPCR on the final DNA library (not the CUT&Tag DNA prior to library prep) against known positive and negative loci. A good signal-to-noise ratio strongly indicates the library can be successfully sequenced [63].
Experimental Protocols & Methodologies
- Prepare DNA Library: Use the final amplified CUT&Tag DNA library. This is critical because tagmented small DNA and large genomic DNA are both present before amplification. PCR amplification enriches the tagmented DNA, making it amenable to qPCR.
- Design Primers: Select primer sets for known positive binding sites of your target and for a known negative site.
- Perform qPCR: Quantify the amount of immunoprecipitated DNA in each sample relative to the total input chromatin.
- Interpret Results: A high signal-to-noise ratio (enrichment at positive sites versus the negative site) indicates successful library preparation and predicts successful NGS sequencing.
Workflow Diagram: High-Sensitivity Liquid Biopsy Assay Validation
The Scientist's Toolkit: Essential Research Reagent Solutions
Table 3: Key Reagents and Materials for Sensitive NGS Assays
| Reagent / Material | Function & Importance in Sensitive Detection |
|---|---|
| Nucleic Acid Binding Beads [35] | Critical for clean-up and size selection steps. Inefficient use is a major source of failure; must be mixed well before use to ensure consistency. |
| TaqMan RNase P Detection Reagents Kit [35] | Recommended for accurate quantitation of amplifiable DNA, which is crucial for determining optimal input mass and avoiding low yield. |
| High-Sensitivity CGP Assay (e.g., Northstar Select) [61] [62] | Tumor-naive, plasma-based test covering 84 genes. Its low limit of detection (LOD) enables reliable variant detection at lower VAFs than conventional assays. |
| CUT&Tag Dual Index Primers and PCR Master Mix [63] | Specifically designed for preparing CUT&Tag DNA libraries for Illumina sequencing, ensuring compatibility and efficient amplification. |
| Positive Control Antibodies (e.g., Tri-Methyl-Histone H3 (Lys4)) [63] | Essential for evaluating CUT&Tag protocol success, especially when working with low-abundance targets or low cell numbers. |
| Automated Non-Contact Dispensers (e.g., I.DOT) [60] | Enables nanoliter-scale dispensing (down to 4 nL) to improve assay sensitivity, specificity, and reproducibility by eliminating operator-related variability and cross-contamination. |
Frequently Asked Questions (FAQs)
Q1: What is the primary function of the nf-core/ampliseq pipeline? A1: nf-core/ampliseq is a bioinformatics analysis pipeline designed for amplicon sequencing data. It supports the denoising of any amplicon and the taxonomic assignment of 16S, ITS, CO1, and 18S rRNA genes. The pipeline utilizes established tools like DADA2 and QIIME2 to perform comprehensive analysis, from raw read processing to diversity metrics and differential abundance testing [64] [65] [66].
Q2: My data originates from multiple sequencing runs. What special considerations are needed?
A2: When data comes from multiple sequencing runs, it is crucial to process them separately to account for run-specific error profiles. You can achieve this by using the run column in your samplesheet input or by specifying the --multiple_sequencing_runs parameter when using direct FASTQ input. This ensures that processes like error rate learning in DADA2 are performed per run, leading to more accurate results [67].
Q3: Can I analyze regions of variable length, like the ITS region, with nf-core/ampliseq?
A3: Yes. For variable-length regions such as the ITS (Internal Transcribed Spacer), it is recommended to use the --illumina_pe_its parameter for paired-end Illumina reads. This disables fixed-length read truncation. You may also need to adjust the quality filtering threshold (--truncq) to a value higher than the default of 2 if a high proportion of reads is being excluded by DADA2 [67].
Q4: What are the common causes of rRNA reads in TruSeq Stranded Total RNA libraries, and how can I troubleshoot them? A4: Despite rRNA removal probes, residual rRNA reads can persist. Here are common causes and solutions [68]:
- Inefficient Probe-rRNA Binding: If the Ribo-Zero probes do not bind effectively to the endogenous rRNA, the rRNA will remain in the sample. Troubleshooting: Ensure reagents are mixed thoroughly, use the recommended sample input amount, verify the correct incubation temperature, and use fresh, in-date reagents.
- Inefficient Magnetic Bead Binding: If the magnetic beads do not effectively bind the probe-rRNA complexes, both will remain. Troubleshooting: Balance magnetic beads to room temperature for at least 30 minutes before use, mix beads thoroughly, and use a validated magnetic rack.
- Incomplete Bead Removal: If beads are not completely captured by the magnet, they can carry over. Troubleshooting: Visually inspect the supernatant after bead removal to ensure no beads remain.
- DNA Contamination: Genomic DNA in the original RNA sample can be sequenced. Troubleshooting: Perform DNase treatment on the raw RNA sample prior to library preparation.
Troubleshooting Guides
Problem 1: Pipeline Fails at the Input Stage
- Symptoms: Nextflow fails to launch or terminates immediately with an error about input files.
- Possible Causes and Solutions:
- Cause 1: Incorrect samplesheet format.
- Solution: Validate your samplesheet against the pipeline's requirements. It must be a tab or comma-separated file with a header. The
sampleIDcolumn is mandatory and must contain unique identifiers starting with a letter and containing only letters, numbers, or underscores. TheforwardReadscolumn (andreverseReadsfor paired-end) must point to existing gzipped FASTQ files (e.g.,.fastq.gz) [67].
- Solution: Validate your samplesheet against the pipeline's requirements. It must be a tab or comma-separated file with a header. The
- Cause 2: File naming does not match the expected pattern when using
--input_folder.- Solution: Ensure your file names conform to the pattern expected by the pipeline (default is
/*_R{1,2}_001.fastq.gz). You can customize this using the--extensionparameter [67].
- Solution: Ensure your file names conform to the pattern expected by the pipeline (default is
- Cause 1: Incorrect samplesheet format.
Problem 2: High Proportion of Reads Lost During DADA2 Denoising
- Symptoms: The pipeline runs, but the final ASV count is very low, and the DADA2 summary reports a high percentage of filtered reads.
- Possible Causes and Solutions:
- Cause 1: Overly stringent truncation parameters (
--trunclenf,--trunclenr).- Solution: Use
FastQCreports (generated by the pipeline) to visualize read quality and determine appropriate truncation lengths. For variable-length regions like ITS, use--illumina_pe_itsto disable truncation [67].
- Solution: Use
- Cause 2: Low-quality reads.
- Cause 1: Overly stringent truncation parameters (
Problem 3: Unsuccessful Taxonomic Classification or Low Resolution
- Symptoms: A large number of ASVs are unclassified or classified only at a high taxonomic level (e.g., "Bacteria").
- Possible Causes and Solutions:
- Cause 1: Mismatch between primer sequences and reference database.
- Cause 2: Unsuitable reference database for your sample type.
- Solution: Select an appropriate pre-configured database. For example, use
unite-fungifor fungal ITS data orpr2for 18S rRNA gene data from eukaryotes. The defaultsilvadatabase is optimized for bacterial and archaeal 16S rRNA [67].
- Solution: Select an appropriate pre-configured database. For example, use
Experimental Protocols for Key Analyses
Protocol 1: Basic 16S rRNA Gene Amplicon Analysis with nf-core/ampliseq
This protocol outlines a standard workflow for analyzing paired-end Illumina 16S data [69] [65] [67].
- Prerequisite: Install Nextflow and configure your execution environment (e.g., Docker, Singularity).
- Data Preparation: Organize your sequencing files. Prepare a samplesheet (e.g.,
samplesheet.csv) and a metadata file (optional but recommended for downstream analysis). - Pipeline Execution: Run a command with the essential parameters:
- Output: The
./resultsdirectory will contain all output, including FASTQ reports, ASV tables, taxonomy assignments, diversity metrics, and interactive plots.
Protocol 2: Validating rRNA Depletion in Total RNA-Seq Libraries
While not a direct function of nf-core/ampliseq, validating rRNA removal is a critical QC step for transcriptomics. This protocol uses standard alignment tools [68].
- Sequencing: Sequence your TruSeq Stranded Total RNA library on an Illumina platform.
- Alignment: Align a subset of the sequencing reads (e.g., 100,000) to a reference genome that includes rRNA sequences using a splice-aware aligner like STAR.
- Strand-Specific Analysis: Check the alignment strands of the reads that map to rRNA genes.
- Residual endogenous rRNA will show Read 1 aligning to the antisense strand and Read 2 to the sense strand.
- Contamination from rRNA removal probes will show a mixed strand orientation because the probes themselves are sequenced.
- Troubleshoot: Based on the strand specificity, refer to the troubleshooting guide (Problem 2) to identify the root cause of the rRNA contamination.
Research Reagent Solutions
The following table details key reagents and materials used in amplicon sequencing and library preparation, along with their critical functions.
Table 1: Essential Research Reagents and Materials
| Item Name | Function / Application |
|---|---|
| Ribo-Zero Probes [68] | Biotin-labeled oligonucleotides that hybridize to specific rRNA molecules (e.g., cytoplasmic and mitochondrial rRNA) for their removal during Total RNA library prep. |
| Streptavidin-coated Magnetic Beads [68] | Used to capture the biotin-labeled Ribo-Zero probes bound to rRNA, facilitating the physical removal of rRNA from the total RNA sample. |
| DNase I Enzyme [68] | Digests contaminating genomic DNA in RNA samples prior to library construction, preventing non-rRNA background from DNA. |
| SILVA Reference Database [65] [67] | A curated, comprehensive database of ribosomal RNA sequences used as a pre-configured option in nf-core/ampliseq for taxonomic classification of 16S and 18S amplicons. |
| UNITE Reference Database [67] | A specialized database for the fungal ITS (Internal Transcribed Spacer) region, used for taxonomic classification of fungal amplicon sequences. |
nf-core/ampliseq Workflow Diagram
The diagram below visualizes the key stages and decision points in the nf-core/ampliseq pipeline, illustrating the logical flow from raw data to final output [65] [66] [67].
Conclusion
Effective quality control using the BioAnalyzer or Fragment Analyzer is not merely a preliminary step but a critical determinant of success in AmpliSeq for Illumina workflows. By mastering the interpretation of library traces, researchers can proactively identify issues like adapter dimers, optimize yields, and ensure the generation of high-quality sequencing data. The integration of robust QC practices with systematic troubleshooting empowers laboratories to maximize the potential of targeted sequencing across diverse applications—from clinical cancer research and inherited disease studies to agrigenomics and metagenomics. As AmpliSeq technology continues to evolve, embracing these best practices in library validation and QC will be paramount for driving discoveries and translating genomic insights into meaningful biomedical advances.
References
- 1. AmpliSeq for Illumina Sequencing Solution [https://www.illumina.com/products/by-brand/ampliseq.html]
- 2. AmpliSeq for Illumina Custom and Community Panels [https://support.illumina.com/sequencing/sequencing_kits/ampliseq-for-illumina-custom-and-community-panels/training.html]
- 3. Library QC and Troubleshooting with the BioAnalyzer ... [https://www.illumina.com/company/video-hub/uie_UYNjFSk.html]
- 4. Library QC and Troubleshooting with the Bioanalyzer ... [https://knowledge.illumina.com/library-preparation/general/library-preparation-general-troubleshooting-list/000008041]
- 5. Targeted Gene Sequencing Panels [https://www.illumina.com/techniques/sequencing/dna-sequencing/targeted-resequencing/targeted-panels.html]
- 6. Targeted Sequencing | Focus on key genes and regions of ... [https://www.illumina.com/techniques/sequencing/dna-sequencing/targeted-resequencing.html]
- 7. Troubleshooting [https://knowledge.illumina.com/instrumentation/miseq/instrumentation-miseq-troubleshooting-list]
- 8. Fragment Analyzer Systems Capillary Arrays [https://www.agilent.com/en/product/automated-electrophoresis/fragment-analyzer-systems/fragment-analyzer-systems-capillary-arrays?srsltid=AfmBOoovjPtPd3YKyhcDF1lwhWMVfNftvf8yo-BkLYQeGnxfmj-T439s]
- 9. Library Preparation Quality Control and Quantification [https://www.lexogen.com/blog/rna-lexicon-library-preparation-quality-control-and-quantification/]
- 10. NGS Library Preparation [https://www.cd-genomics.com/resource-library-preparation-for-ngs.html]
- 11. Library quantification and quality control quick reference ... [https://knowledge.illumina.com/library-preparation/general/library-preparation-general-reference_material-list/000001247]
- 12. Sample and library QC [https://www.scdiscoveries.com/support/qc/]
- 13. Effective quality management practices in routine clinical ... [https://pmc.ncbi.nlm.nih.gov/articles/PMC5506542/]
- 14. Improved Protocols for Illumina Sequencing - PMC [https://pmc.ncbi.nlm.nih.gov/articles/PMC3849550/]
- 15. Ion AmpliSeq Custom Targeted NGS Testing Panels [https://www.thermofisher.com/us/en/home/life-science/sequencing/next-generation-sequencing/ion-torrent-next-generation-sequencing-workflow/ion-torrent-next-generation-sequencing-select-targets/ampliseq-target-selection.html]
- 16. KAPA Library Quantification Kits [https://sequencing.roche.com/us/en/products/group/kapa-library-quantification-kits.html]
- 17. KAPA Library Quantification Kits [https://rochesequencingstore.com/catalog/kapa-library-quantification-kits/]
- 18. NEBNext® Library Quant Kit for Illumina® [https://www.neb.com/en-us/products/e7630-nebnext-library-quant-kit-for-illumina?srsltid=AfmBOormXR6cx0o-VtQ_14UhliTFSOprrcqUCs9doZXlfot-0WLeWnHm]
- 19. NGS library prep and QC: Five expert tricks to save time ... [https://www.tecan.com/blog/ngs-library-prep-tips-and-help]
- 20. How to Troubleshoot Sequencing Preparation Errors (NGS ... [https://www.cd-genomics.com/resource-sequencing-preparation-troubleshooting.html]
- 21. Sample Input for Illumina DNA Prep, (M) Tagmentation ... [https://knowledge.illumina.com/library-preparation/dna-library-prep/library-preparation-dna-library-prep-faq-list/000001262]
- 22. Ultra-Low Input RNA Sequencing | Lexogen NGS Services [https://www.lexogen.com/services/ultra-low-input-rna/]
- 23. The Impact of the Variability of RT-qPCR Standard Curves ... [https://pmc.ncbi.nlm.nih.gov/articles/PMC12029521/]
- 24. Learn about the importance of the qPCR standard curve [https://bitesizebio.com/31470/obligate-qpcr-standard-curve/]
- 25. Fragment Analysis Support—Troubleshooting [https://www.thermofisher.com/us/en/home/technical-resources/technical-reference-library/capillary-electrophoresis-applications-support-center/fragment-analysis-support/fragment-analysis-support-troubleshooting.html]
- 26. A Troubleshooting Guide for Common Issues in STR Analysis [https://www.forensicmag.com/Forensic-Tips/613460-A-Troubleshooting-Guide-for-Common-Issues-in-STR-Analysis/]
- 27. Fragment Analyzer™ Automated CE System - DNA Facility at Iowa State University [https://www.biotech.iastate.edu/dna/resources/fragment-analyzer-automated-ce-system/]
- 28. 2100-Bioanalyzer Maintenance-Troubleshooting USR ENG [https://www.scribd.com/document/946660935/2100-Bioanalyzer-Maintenance-Troubleshooting-USR-ENG]
- 29. Troubleshooting Bioanalyzer Communication - Articles [https://community.agilent.com/knowledge/automated-electrophoresis-portal/kmp/automated-electrophoresis-articles/kp987.troubleshooting-bioanalyzer-communication-]
- 30. Troubleshooting Degraded Bioanalyzer RNA Ladder or ... [https://community.agilent.com/knowledge/automated-electrophoresis-portal/kmp/automated-electrophoresis-articles/kp1258.troubleshooting-degraded-bioanalyzer-rna-ladder-or-samples]
- 31. Library QC and Troubleshooting with the BioAnalyzer and Fragment Analyzer | Illumina [https://sapac.illumina.com/company/video-hub/uie_UYNjFSk.html]
- 32. Known Problem Report as of Nov 10 2025 4:00AM [https://www.agilent.com/cs/library/support/Patches/SSBs/G2946CA-G2949CA.html?srsltid=AfmBOoqE2IXjFjb_B7qnv2c9uIVt0MzBuN6fu4KjX_bFCvo2tXE5-EZJ]
- 33. Troubleshooting & result interpretation [https://eurofinsgenomics.eu/en/custom-dna-sequencing/eurofins-services/whole-plasmid-sequencing/wps-data-interpretation/]
- 34. AmpliSeq for Illumina Illumina Repertoire Panel Training [https://support.illumina.com/sequencing/sequencing_kits/ampliseq-for-illumina-immune-repertoire-panel/training.html]
- 35. NGS Library Preparation Support—Troubleshooting [https://www.thermofisher.com/us/en/home/technical-resources/technical-reference-library/next-generation-sequencing-support-center/ngs-library-preparation-support/ngs-library-preparation-support-troubleshooting.html]
- 36. Troubleshooting Tips for cDNA Library Preparation in Next ... [https://www.stackwave.com/antibody-discovery-faqs/troubleshooting-tips-for-cdna-library-preparation-in-next-generation-sequencing]
- 37. Recommended quality control of FFPE samples for Illumina ... [https://knowledge.illumina.com/library-preparation/general/library-preparation-general-reference_material-list/000001941]
- 38. Quality control recommendations for RNASeq using FFPE ... [https://bmcmedgenomics.biomedcentral.com/articles/10.1186/s12920-022-01355-0]
- 39. Best practices for library quantification [https://knowledge.illumina.com/library-preparation/general/library-preparation-general-reference_material-list/000003750]
- 40. Comparison of Normalization Methods for Construction of ... [https://pmc.ncbi.nlm.nih.gov/articles/PMC2893486/]
- 41. AmpliSeq for Illumina on iSeq [https://support.illumina.com/support-content/AmpliSeq-for-Illumina-on-iSeq.html]
- 42. Troubleshooting Guide for NEBNext® Ultra™ II and ... [https://www.neb.com/en-us/tools-and-resources/troubleshooting-guides/troubleshooting-guide-for-nebnext-ultra-ii-and-ultra-dna-library-prep-kits?srsltid=AfmBOop_PL4wwW10BETTyKyNsTCrIjBOKW-MGXCOh-_lAErAVuwb05xT]
- 43. CUT&TAG fragment distribution - Forum [https://community.agilent.com/technical/automated-electrophoresis/f/forum/8699/cut-tag-fragment-distribution]
- 44. Rescuing Your Failed Libraries: A Guide to Ugly ... - Yeasen [https://www.yeasenbio.com/blogs/ngs/rescuing-your-failed-libraries-a-guide-to-ugly-electropherograms-and-what-they-mean]
- 45. PAN_RnaDnaQC [https://pan.stanford.edu/section_html/QC/analysis.html]
- 46. Excessive addition split peak formed by the non-templated ... [https://pmc.ncbi.nlm.nih.gov/articles/PMC10174434/]
- 47. AmpliSeq for Illumina Comprehensive Panel v3 Training [https://support.illumina.com/sequencing/sequencing_kits/ampliseq-for-illumina-comprehensive-panel-v3/training.html]
- 48. Avoiding Contamination | Thermo Fisher Scientific - ES [https://www.thermofisher.com/us/en/home/life-science/pcr/real-time-pcr/real-time-pcr-learning-center/real-time-pcr-basics/good-laboratory-practice-avoid-contamination-qpcr-experiments.html]
- 49. How to prevent PCR contamination [https://www.minipcr.com/how-to-prevent-pcr-contamination/]
- 50. The Ultimate Guide to Thermal Cycler TLC [https://blog.edvotek.com/2023/09/05/the-ultimate-guide-to-thermal-cycler-tlc/]
- 51. Sequencing Workflow Accuracy | TruSeq technology [https://www.illumina.com/science/education/sequencing-workflow-accuracy.html]
- 52. Troubleshooting [https://knowledge.illumina.com/library-preparation/general/library-preparation-general-troubleshooting-list]
- 53. Step by step instructions for sequencing library QC with the ... [https://knowledge.illumina.com/instrumentation/iseq-100/instrumentation-iseq-100-reference_material-list/000002698]
- 54. Quantification of massively parallel sequencing libraries [https://www.nature.com/articles/s41598-018-19574-w]
- 55. Comparison of DNA Quantification Methods for Next ... [https://pmc.ncbi.nlm.nih.gov/articles/PMC4822169/]
- 56. Validation and Retrospective Clinical Evaluation of a ... [https://pubmed.ncbi.nlm.nih.gov/31229651/]
- 57. Evaluation of 16S rRNA gene sequencing for species and ... [https://www.nature.com/articles/s41467-019-13036-1]
- 58. Improving performance of multigene panels for genomic ... [https://www.nature.com/articles/gim2015212]
- 59. A Comparison of TapeStation 4200 and Bioanalyzer 2100 ... [https://pmc.ncbi.nlm.nih.gov/articles/PMC10531353/]
- 60. 5 Essentials of Diagnostic Assay Development [https://dispendix.com/blog/5-essentials-of-diagnostic-assay-development-enhancing-precision-with-advanced-dispensing-technology]
- 61. Validation of a liquid biopsy assay with increased ... [https://www.sciencedirect.com/science/article/pii/S2950195425000384]
- 62. Validation of a liquid biopsy assay with increased ... [https://pubmed.ncbi.nlm.nih.gov/40980342/]
- 63. CUT&Tag DNA Library Yield: What to Do if it's Too Low to Detect [https://blog.cellsignal.com/cut-tag-dna-bioanalyzer-library-yield]
- 64. GitHub - nf - core / ampliseq : Amplicon sequencing analysis workflow... [https://github.com/nf-core/ampliseq]
- 65. : Introduction ampliseq [https://nf-co.re/ampliseq/2.6.1/]
- 66. - nf / core | Seqera ampliseq [https://seqera.io/pipelines/ampliseq--nf-core/]
- 67. ampliseq: Usage [https://nf-co.re/ampliseq/2.15.0/docs/usage/]
- 68. 最小化TruSeq Stranded Total RNA 文库中rRNA污染的最佳 ... [https://knowledge.illumina.com/library-preparation/general/library-preparation-general-reference_material-list/000007416]
- 69. 使用nf-core的ampliseq(qiime2)流程分析16S数据原创 [https://blog.csdn.net/zd200572/article/details/105390248]