Distinct Lipidomic Signatures in Diabetes with Hyperuricemia: Biomarker Discovery, Pathophysiological Insights, and Clinical Implications
This article provides a comprehensive analysis of the distinct plasma lipidomic profiles that differentiate patients with diabetes mellitus (DM) from those with diabetes and comorbid hyperuricemia (DH).
Distinct Lipidomic Signatures in Diabetes with Hyperuricemia: Biomarker Discovery, Pathophysiological Insights, and Clinical Implications
Abstract
This article provides a comprehensive analysis of the distinct plasma lipidomic profiles that differentiate patients with diabetes mellitus (DM) from those with diabetes and comorbid hyperuricemia (DH). Utilizing advanced mass spectrometry-based lipidomics, recent studies reveal significant upregulation of specific triglycerides (TGs), phosphatidylethanolamines (PEs), and phosphatidylcholines (PCs) in DH, with marked perturbations in glycerophospholipid and glycerolipid metabolism pathways. We explore the methodological frameworks for lipidomic analysis, address key challenges in biomarker validation and reproducibility, and evaluate the comparative performance of lipid signatures against conventional clinical biomarkers. This synthesis is intended to inform researchers, scientists, and drug development professionals about the potential of lipidomics for revealing novel pathophysiological mechanisms, identifying diagnostic biomarkers, and developing targeted therapeutic strategies for this high-risk patient population.
Unraveling the Lipidomic Landscape: Key Alterations in Diabetes with Hyperuricemia
Clinical and Epidemiological Significance
The co-occurrence of diabetes mellitus (DM) and hyperuricemia (HUA) represents a significant clinical challenge in metabolic medicine. Epidemiological studies reveal a substantial overlap between these conditions, with HUA prevalence among diabetic patients reported at 21.24% in China and 20.70% in North America [1]. This coexistence is clinically consequential, as patients with both conditions face significantly worse outcomes than those with either condition alone.
A substantial 7-year cohort study of patients with chronic kidney disease (CKD) stages 3-5 demonstrated that the combination of DM and HUA synergistically increases risk. Compared to patients with neither condition, those with both DM and HUA had dramatically elevated hazards for all-cause mortality (HR = 2.12) and end-stage kidney disease (HR = 2.46) [2]. This risk profile was substantially worse than for either condition alone, underscoring the clinical importance of their co-occurrence.
Table 1: Comparative Risk for Adverse Outcomes in CKD Patients (Stages 3-5) [2]
| Condition | All-Cause Mortality Hazard Ratio (HR) | End-Stage Kidney Disease Hazard Ratio (HR) |
|---|---|---|
| Hyperuricemia alone | 1.48 | 1.34 |
| Diabetes alone | 1.52 | 1.59 |
| Diabetes + Hyperuricemia | 2.12 | 2.46 |
Recent scientometric analysis reveals consistently growing research interest in the HUA-diabetes relationship, with publication output peaking at 170 publications in 2021 alone [1]. This reflects increasing recognition of their pathophysiological interplay and clinical implications.
Lipidomic Profiles: Diabetes with Hyperuricemia vs. Diabetes Alone
Advanced lipidomic technologies have revealed distinct plasma lipid profiles that differentiate patients with coexisting diabetes and hyperuricemia (DH) from those with diabetes alone (DM). Using ultra-high performance liquid chromatography-tandem mass spectrometry (UHPLC-MS/MS), researchers have identified characteristic lipid alterations that provide mechanistic insights into this metabolic synergy [3].
Key Lipidomic Alterations
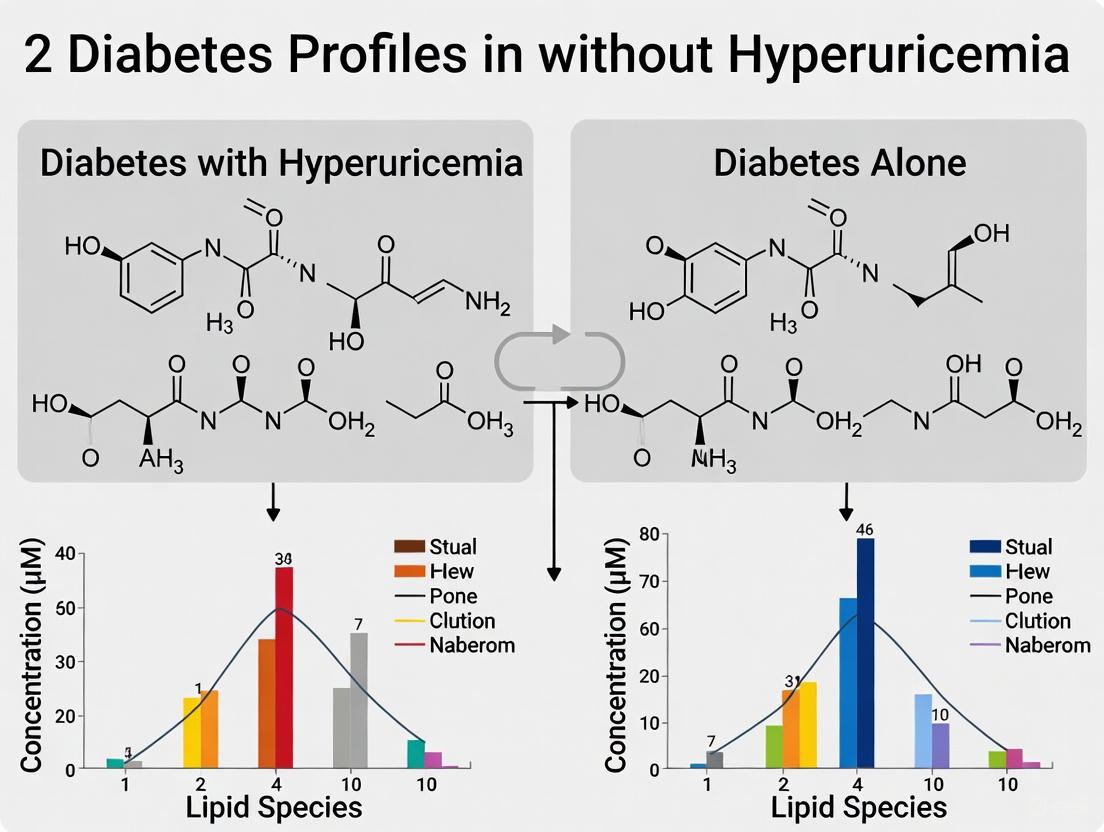
A comprehensive untargeted lipidomic analysis identified 1,361 lipid molecules across 30 subclasses, with multivariate analyses revealing significant separation between DH, DM, and normoglycemic control (NGT) groups [3]. The most prominent differences between DH and DM groups include significant upregulation of specific lipid species:
Table 2: Significantly Altered Lipid Metabolites in Diabetes with Hyperuricemia (DH) vs. Diabetes Alone (DM) and Healthy Controls [3]
| Lipid Category | Specific Lipid Molecules Altered | DH vs. NGT | DH vs. DM |
|---|---|---|---|
| Triglycerides (TGs) | TG(16:0/18:1/18:2) and 12 others | Significantly upregulated | 13 TGs upregulated |
| Phosphatidylethanolamines (PEs) | PE(18:0/20:4) and others | Significantly upregulated | 10 PEs upregulated |
| Phosphatidylcholines (PCs) | PC(36:1) and others | Significantly upregulated | 7 PCs upregulated |
| Phosphatidylinositol (PI) | - | One PI downregulated | Not specified |
| Total Significant Lipids | - | 31 | 12 |
These lipid alterations are not merely correlative but reflect fundamental disturbances in metabolic pathways. The collective analysis revealed enrichment of these differential lipids in six major metabolic pathways, with glycerophospholipid metabolism (impact value: 0.199) and glycerolipid metabolism (impact value: 0.014) identified as the most significantly perturbed in DH patients [3].
Other studies in middle-aged and elderly Chinese populations have corroborated these findings, identifying 123 lipids significantly associated with uric acid levels, predominantly glycerolipids (GLs) and glycerophospholipids (GPs). Specific lipid signatures strongly associated with HUA risk included diacylglycerols [DAG(16:0/22:5), DAG(16:0/22:6), DAG(18:1/20:5), DAG(18:1/22:6)], phosphatidylcholine [PC(16:0/20:5)], and triacylglycerol [TAG(53:0)], while lysophosphatidylcholine [LPC(20:2)] was inversely associated with HUA risk [4].
Experimental Models and Methodologies
Human Study Protocols
Human lipidomic studies follow rigorous standardized protocols. In one representative study, researchers recruited 17 patients each for DH, DM, and healthy control groups, matched 1:1 by sex and age [3]. After overnight fasting, blood samples were collected and centrifuged at 3,000 rpm for 10 minutes at room temperature. The upper plasma layer (0.2 mL) was aliquoted and stored at -80°C until analysis.
The lipid extraction protocol involved:
- Thawing samples on ice and vortexing
- Adding 100 μL plasma to 200 μL of 4°C water
- Mixing with 240 μL pre-cooled methanol
- Adding 800 μL methyl tert-butyl ether (MTBE)
- Sonicating in a low-temperature water bath for 20 minutes
- Standing at room temperature for 30 minutes
- Centrifuging at 14,000 g for 15 minutes at 10°C
- Collecting and drying the upper organic phase under nitrogen [3]
Animal Model Development
To investigate the mechanistic interplay between these conditions, researchers have developed a novel diabetic hamster model with combined hyperuricemia and dyslipidemia. The model induction protocol involves:
Diabetes Induction: Intraperitoneal injection of streptozotocin (STZ, 30 mg/kg) once daily for 3 consecutive days to induce pancreatic β-cell damage [5]
Hyperuricemia Induction: Intragastric administration of potassium oxonate (PO, 350 mg/kg) and adenine (150 mg/kg) with 5% fructose water to inhibit uricase activity [5]
Dyslipidemia Induction: Feeding with high-fat/cholesterol diet (HFCD) containing 15% fat and 0.5% cholesterol [5]
This combined intervention successfully established a model exhibiting characteristic features of the human condition: serum uric acid (499.5 ± 61.96 μmol/L), glucose (16.88 ± 2.81 mmol/L), triglyceride (119.88 ± 27.14 mmol/L), and total cholesterol (72.92 ± 16.62 mmol/L) [5].
Pathophysiological Mechanisms and Signaling Pathways
The relationship between diabetes and hyperuricemia involves complex, bidirectional pathophysiological mechanisms. Uric acid contributes to insulin resistance through multiple pathways, including increased oxidative stress, stimulation of the renin-angiotensin-aldosterone system, and chronic inflammatory responses [6].
Key Mechanistic Insights
Research indicates that uric acid impairs pancreatic β-cell survival and function, though alone it may be insufficient to induce diabetes [1]. In the context of pre-existing metabolic dysfunction, however, elevated uric acid accelerates disease progression through several mechanisms:
Oxidative Stress: Uric acid transitions from antioxidant to pro-oxidant at elevated concentrations, generating reactive oxygen species that impair insulin signaling [6]
Inflammatory Activation: Uric acid crystals and soluble urate activate the NLRP3 inflammasome, promoting interleukin-1β production and chronic inflammation [6]
Lipid Metabolism Disruption: Uric acid induces endoplasmic reticulum stress and activates sterol regulatory element-binding protein-1c (SREBP-1c), promoting hepatic fat accumulation [7]
Endothelial Dysfunction: Elevated uric acid impairs nitric oxide-mediated vasodilation and promotes endothelial inflammation [6]
The identified lipidomic alterations in glycerophospholipid and glycerolipid metabolism pathways reflect these underlying mechanistic disturbances, potentially serving as both biomarkers and mediators of the enhanced metabolic risk in DH patients [3].
Diagram: Pathophysiological Mechanisms Linking Hyperuricemia to Diabetes Progression and Lipidomic Alterations. The diagram illustrates how elevated uric acid (UA) triggers multiple pathological processes that converge to promote insulin resistance, β-cell dysfunction, and the distinct lipidomic profile characteristic of diabetes with hyperuricemia (DH).
The Scientist's Toolkit: Essential Research Reagents and Materials
Table 3: Essential Research Reagents and Materials for Diabetes-Hyperuricemia Lipidomic Studies
| Reagent/Material | Application Purpose | Technical Specifications | Experimental Function |
|---|---|---|---|
| UHPLC-MS/MS System | Lipid separation and quantification | Waters ACQUITY UPLC BEH C18 column (2.1 mm × 100 mm, 1.7 μm); SCIEX 5500 QTRAP mass spectrometer [3] | High-resolution lipid separation and sensitive detection |
| Methyl tert-butyl ether (MTBE) | Lipid extraction | LC-MS grade [3] [7] | Organic solvent for efficient lipid extraction from plasma |
| Potassium Oxonate (PO) | Hyperuricemia induction in models | >98% purity; 350 mg/kg dosage in hamsters [5] | Uricase inhibitor to elevate serum uric acid |
| Streptozotocin (STZ) | Diabetes induction in models | >98% purity; 30 mg/kg dosage in hamsters [5] | Pancreatic β-cell cytotoxin for diabetes modeling |
| SPLASH LIPIDOMIX Standard | Lipid quantification reference | Commercially available mass spec standard mixture [7] | Internal standard for lipid semi-quantification |
| Ammonium Formate | Mobile phase additive | 10 mM in acetonitrile/water and acetonitrile/isopropanol [3] | Enhances ionization efficiency in mass spectrometry |
This toolkit enables comprehensive investigation of the diabetes-hyperuricemia relationship, from model creation to molecular analysis. The standardized protocols ensure reproducibility across studies, while the analytical methods provide deep metabolic profiling capabilities essential for understanding the complex interplay between these conditions.
The clinical co-occurrence of diabetes and hyperuricemia represents a distinct metabolic phenotype with characteristic lipidomic signatures, enhanced clinical risks, and unique pathophysiological mechanisms. The distinct lipidomic profile marked by alterations in glycerophospholipid and glycerolipid metabolism pathways provides both biomarkers for risk stratification and insights into potential therapeutic targets.
Future research directions should focus on:
- Longitudinal Studies: Tracking lipidomic evolution from isolated diabetes to diabetes with hyperuricemia
- Therapeutic Intervention: Investigating how urate-lowering therapies affect the diabetic lipidome and clinical outcomes
- Mechanistic Studies: Elucidating how specific lipid species contribute to insulin resistance and metabolic dysfunction
- Diagnostic Applications: Developing clinical algorithms incorporating lipidomic signatures for personalized risk assessment
The robust experimental models and analytical methodologies now available provide powerful tools to address these questions, potentially leading to improved clinical management strategies for this high-risk patient population.
Lipidomics, the large-scale study of lipid pathways and networks, has revolutionized our understanding of metabolic diseases by revealing the profound diversity and complexity of the lipidome [8]. Lipids are no longer viewed merely as energy storage molecules but as dynamic mediators of cellular signaling, membrane structure, and metabolic regulation. The human lipidome encompasses tremendous structural diversity, with over 40,000 lipid structures cataloged in the LIPID MAPS database as of 2018, organized into eight major categories: fatty acyls, glycerolipids, glycerophospholipids, sphingolipids, sterol lipids, prenol lipids, saccharolipids, and polyketides [8].
Advances in mass spectrometry technologies have enabled comprehensive lipid profiling, revealing that alterations in specific lipid classes and subclasses are intimately associated with metabolic disease progression [9] [8]. This review examines the current landscape of lipidomics research, with particular focus on the distinct lipidomic signatures that differentiate complex metabolic conditions such as diabetes with concurrent hyperuricemia from diabetes alone. Through comparative analysis of experimental data and methodologies, we provide a resource for researchers and drug development professionals working to identify novel biomarkers and therapeutic targets.
Lipidomics Technologies and Methodologies
Analytical Platforms for Lipid Separation and Detection
Mass spectrometry has emerged as the cornerstone technology for lipidomic analysis due to its high sensitivity and capacity for high-throughput applications [8]. The two primary approaches are liquid chromatography-mass spectrometry (LC-MS) and shotgun lipidomics, each with distinct advantages and limitations.
Chromatography-based lipidomics utilizing ultra-high performance liquid chromatography (UHPLC) coupled with tandem mass spectrometry provides superior separation of structurally similar lipid species. The method described by [10] uses a Waters ACQUITY UPLC BEH C18 column (2.1 × 100 mm, 1.7 μm) with a mobile phase consisting of 10 mM ammonium formate in water (A) and 10 mM ammonium formate in acetonitrile-isopropanol (B). This approach offers excellent analytical specificity for individual lipid species within a given class but requires longer analysis times and introduces potential variability through multiple processing steps [8].
Shotgun lipidomics directly introduces lipid extracts into the mass spectrometer without chromatographic separation, relying instead on differential ionization and mass-to-charge ratio resolution. The Lipidyzer platform described in [9] utilizes a triple-quadrupole mass spectrometer (Sciex QTRAP 5500) with differential mobility separation (DMS), enabling identification and quantification of >1,000 lipid species across 16 subclasses. This approach offers high-throughput capabilities from limited biological samples but has reduced capacity to distinguish isobaric lipid species compared to LC-MS methods [8].
Lipid Extraction and Quantification Methods
Effective lipid extraction is critical for comprehensive lipidome coverage. The Folch method (chloroform:methanol, 2:1) and Bligh and Dyer method (chloroform:methanol, 1:2) represent traditional biphasic extraction approaches that partition lipids into an organic phase while removing proteins and nucleic acids [8]. Recent advances favor monophasic extraction methods using solvents such as isopropanol, which improve recovery of polar lipid species that may partially partition into the aqueous phase in biphasic systems [10] [11].
For accurate quantification, lipidomic workflows incorporate deuterated internal standards. The longitudinal study by [9] included 54 deuterated spike-in standards across nine lipid subclasses at known concentrations. Lipid species without corresponding labeled standards were normalized against structurally similar standards with correlated signal patterns. This approach enables precise quantification across wide concentration ranges spanning up to four orders of magnitude [9].
Table 1: Key Methodological Approaches in Lipidomics Studies
| Study | Extraction Method | Separation Platform | Detection Method | Internal Standards |
|---|---|---|---|---|
| [9] | Not specified | Differential Mobility Separation | QTRAP 5500 MS | 54 deuterated standards across 9 subclasses |
| [10] | Monophasic (MTBE/methanol) | UHPLC BEH C18 column | Tandem MS | SPLASH LIPIDOMIX, deuterated Cer & FA |
| [11] | Monophasic (isopropanol) | Reversed-phase C8 column | QTRAP 6500+ MS | Deuterated standards specified in supplementary |
| [12] | Not specified | LC-MS platform | Untargeted MS | Not specified |
Figure 1: Generalized Lipidomics Workflow. The typical pipeline involves sample collection, lipid extraction with internal standards, separation by chromatography or direct infusion, mass spectrometry detection, and computational analysis.
Lipidomic Signatures in Metabolic Diseases
Diabetes Mellitus with Hyperuricemia vs. Diabetes Alone
Comprehensive lipidomic profiling reveals distinct patterns that differentiate diabetes mellitus with hyperuricemia (DH) from diabetes alone (DM). A study comparing these conditions identified 1,361 lipid molecules across 30 subclasses, with multivariate analyses showing clear separation between DH, DM, and normal glucose tolerance (NGT) groups [10].
The DH group exhibited 31 significantly altered lipid metabolites compared to NGT controls, characterized by:
- 13 triglycerides significantly upregulated, including TG(16:0/18:1/18:2)
- 10 phosphatidylethanolamines significantly upregulated, including PE(18:0/20:4)
- 7 phosphatidylcholines significantly upregulated, including PC(36:1)
- 1 phosphatidylinositol significantly downregulated
Pathway analysis revealed these differential lipids were enriched in glycerophospholipid metabolism (impact value: 0.199) and glycerolipid metabolism (impact value: 0.014) [10]. When comparing DH versus DM groups directly, researchers identified 12 differential lipids that were similarly enriched in these core pathways, underscoring their central role in the pathophysiology of hyperuricemia complicating diabetes [10].
Hyperuricemia and Gout-Associated Lipid Alterations
Lipidomic studies of hyperuricemia and gout reveal consistent alterations in glycerophospholipid metabolism. A comprehensive targeted lipidomic analysis of 608 plasma lipids in 94 hyperuricemia and 196 gout patients found the most significant changes included upregulation of phosphatidylethanolamines and downregulation of lysophosphatidylcholine plasmalogens/plasmanyls [11].
Notably, more profound lipid disturbances were observed in early-onset patients (age ≤ 40 years), with multivariate statistics differentiating early-onset hyperuricemia and gout groups from healthy controls with >95% accuracy [11]. Urate-lowering treatment (ULT) appeared to partially correct this lipid imbalance, suggesting a modifiable component to these lipid alterations.
Obesity and Insulin Resistance-Associated Lipid Changes
Longitudinal deep lipidome profiling of >1,500 plasma samples from 112 participants followed for up to 9 years has revealed dynamic lipidome alterations associated with insulin resistance and ageing [9]. Individuals with insulin resistance exhibited disturbed immune homeostasis and accelerated changes in specific lipid subclasses during ageing, including:
- Altered associations between lipids and clinical markers
- Distinct trajectories for large and small triacylglycerols
- Differential changes in ester- and ether-linked phosphatidylethanolamines
Pediatric studies have identified increased ceramides alongside decreased lysophospholipids and omega-3 fatty acids in children with obesity [12]. Specific lipid classes showed strong associations with cardiometabolic risk, with ceramides, phosphatidylethanolamines, and phosphatidylinositols associated with insulin resistance, while sphingomyelins showed inverse associations [12].
Table 2: Key Lipid Classes Altered in Metabolic Diseases
| Lipid Class | Subclasses | Diabetes with Hyperuricemia | Gout/Hyperuricemia | Obesity/Insulin Resistance |
|---|---|---|---|---|
| Glycerophospholipids | Phosphatidylcholines (PC) | Upregulated [10] | Not specified | Divergent trends [12] |
| Phosphatidylethanolamines (PE) | Upregulated [10] | Upregulated [11] | Associated with insulin resistance [12] | |
| Lysophosphatidylcholines (LPC) | Not specified | Downregulated [11] | Decreased [12] | |
| Glycerolipids | Triglycerides (TG) | Upregulated [10] | Not specified | Increased [12] |
| Diacylglycerols (DG) | Not specified | Not specified | Increased [12] | |
| Sphingolipids | Ceramides (Cer) | Not specified | Not specified | Increased [12] |
| Sphingomyelins (SM) | Not specified | Not specified | Decreased [12] |
Pathophysiological Implications and Mechanisms
Lipid Metabolism Pathways in Metabolic Disease
The consistent identification of glycerophospholipid and glycerolipid metabolism as disturbed pathways across multiple metabolic conditions points to their central role in disease pathophysiology. Glycerophospholipids are essential components of cellular membranes and play crucial roles in signal transduction, while glycerolipids, particularly triglycerides, represent key energy storage molecules.
The upregulation of specific phosphatidylethanolamines and triglycerides in diabetes with hyperuricemia suggests increased membrane remodeling activity and altered energy storage patterns [10]. The reduction in lysophosphatidylcholines, observed in both hyperuricemia and obesity, may reflect increased inflammation or altered phospholipase activity [11] [12].
Ceramide-Mediated Insulin Resistance
The association between ceramides and insulin resistance represents a key mechanism linking lipid dysregulation to metabolic dysfunction. Ceramides, a class of sphingolipids, have been shown to impair insulin signaling through multiple mechanisms, including inhibition of AKT/PKB activation and promotion of inflammatory pathways [12]. In pediatric obesity, ceramides partially mediate the association between obesity and cardiometabolic traits, suggesting these pathways are activated early in disease progression [12].
Figure 2: Ceramide-Mediated Pathway to Metabolic Dysfunction. Obesity-driven lipid accumulation promotes ceramide synthesis, which impairs insulin signaling and promotes inflammation, leading to systemic metabolic dysfunction.
The Scientist's Toolkit: Essential Research Reagents
Table 3: Key Reagent Solutions for Lipidomics Research
| Reagent Category | Specific Examples | Research Application |
|---|---|---|
| Internal Standards | SPLASH LIPIDOMIX Mass Spec Standard; Deuterated ceramide (d18:1-d7/15:0); Oleic acid-d9 [11] | Quantification accuracy through isotope dilution |
| Chromatography Columns | Waters ACQUITY UPLC BEH C18 (2.1 × 100 mm, 1.7 μm) [10]; Reversed-phase BEH C8 column [11] | Lipid separation by hydrophobicity |
| Extraction Solvents | Methyl tert-butyl ether (MTBE) [10]; Isopropanol [11]; Chloroform-methanol mixtures [8] | Lipid isolation from biological matrices |
| MS Instrumentation | QTRAP 6500+ [11]; Triple-quadrupole MS with DMS [9]; UHPLC-MS/MS systems [10] | Lipid detection and quantification |
Comprehensive lipidomic profiling has revealed the remarkable diversity of the lipidome and its intricate connections to metabolic disease pathophysiology. The distinct lipid signatures differentiating diabetes with hyperuricemia from diabetes alone highlight the nuanced lipid disturbances underlying complex metabolic conditions. The consistent involvement of glycerophospholipid and glycerolipid metabolism pathways across multiple studies suggests these represent core perturbed processes in metabolic disease.
Advanced mass spectrometry platforms, coupled with robust extraction and quantification methods, now enable researchers to characterize hundreds to thousands of lipid species simultaneously, providing unprecedented insights into lipid metabolism. As these technologies continue to evolve and become more accessible, lipidomics promises to deliver novel biomarkers for early detection, stratification, and monitoring of metabolic diseases, ultimately guiding the development of targeted therapeutic interventions.
Lipidomic profiling reveals distinct plasma lipid signatures that differentiate patients with diabetes mellitus combined with hyperuricemia (DH) from those with diabetes mellitus alone (DM). Through untargeted lipidomics based on ultra-high performance liquid chromatography-tandem mass spectrometry (UHPLC-MS/MS), researchers have identified a specific panel of upregulated lipid molecules—notably triglycerides (TGs), phosphatidylethanolamines (PEs), and phosphatidylcholines (PCs)—in DH patients. These differentially expressed lipids are predominantly enriched in glycerophospholipid and glycerolipid metabolism pathways, providing a molecular basis for the exacerbated metabolic dysregulation observed when hyperuricemia complicates diabetes. This comparative analysis synthesizes key experimental data and methodologies to guide future research and therapeutic development in metabolic disease.
Diabetes mellitus (DM) and hyperuricemia are common metabolic disorders that frequently co-exist, creating a combined condition (DH) associated with worsened clinical outcomes. Lipidomics, a branch of metabolomics, has emerged as a powerful tool for characterizing specific lipid disturbances in metabolic diseases beyond conventional clinical biomarkers [3]. While previous studies have separately documented lipid alterations in diabetes [9] and hyperuricemia [3], only recent investigations have directly compared the lipidomic profiles of DH versus DM alone. These studies reveal that the hyperuricemic state in diabetic patients induces specific lipidomic changes characterized by upregulated TGs, PEs, and PCs, highlighting the complex interplay between purine and lipid metabolism in disease progression. Understanding these distinct lipid signatures provides valuable insights for developing targeted interventions for this high-risk patient population.
Comparative Lipidomic Profiles: DH vs. DM
Signature Lipid Molecules
A comprehensive UHPLC-MS/MS-based lipidomic analysis of plasma samples from DH and DM patients identified 1,361 lipid molecules across 30 subclasses [3]. Multivariate analyses revealed significant separation trends among DH, DM, and healthy control (NGT) groups, confirming distinct lipidomic profiles.
Table 1: Signature Upregulated Lipid Molecules in DH vs. DM and NGT
| Lipid Category | Specific Lipid Molecules | Regulation in DH vs. NGT | Regulation in DH vs. DM | Biological Relevance |
|---|---|---|---|---|
| Triglycerides (TGs) | TG(16:0/18:1/18:2) and 12 other TGs | Significantly upregulated | Upregulated | Energy storage, lipid accumulation, insulin resistance |
| Phosphatidylethanolamines (PEs) | PE(18:0/20:4) and 9 other PEs | Significantly upregulated | Upregulated | Membrane structure, cellular signaling |
| Phosphatidylcholines (PCs) | PC(36:1) and 6 other PCs | Significantly upregulated | Upregulated | Membrane integrity, lipid transport |
| Phosphatidylinositol (PI) | One unspecified PI | Downregulated | Not specified | Cell signaling processes |
When comparing DH versus DM groups specifically, researchers identified 12 significantly differential lipids that were also predominantly enriched in glycerophospholipid and glycerolipid metabolism pathways [3]. The collective analysis of these metabolite groups revealed their enrichment in six major metabolic pathways, with glycerophospholipid metabolism (impact value: 0.199) and glycerolipid metabolism (impact value: 0.014) identified as the most significantly perturbed pathways in DH patients [3].
Pathway Analysis
The differential lipid signature in DH patients reflects profound disruptions in key metabolic pathways:
Glycerophospholipid Metabolism: This pathway showed the highest impact value (0.199) in DH patients, indicating substantial alterations in membrane lipid composition and signaling precursors [3]. The upregulation of multiple PC and PE species suggests increased membrane remodeling activity and potential impacts on membrane fluidity and signaling in the combined disease state.
Glycerolipid Metabolism: With an impact value of 0.014, this pathway demonstrated significant perturbation, primarily driven by the elevated TG species [3]. This finding reflects enhanced lipogenesis and impaired lipid clearance mechanisms in DH patients, potentially contributing to increased cardiovascular risk.
The consistency of pathway perturbations across both DH vs. NGT and DH vs. DM comparisons underscores the central role of these metabolic disruptions in the pathophysiology of hyperuricemia complicating diabetes [3].
Experimental Protocols & Methodologies
Study Population Design
The foundational lipidomic study employed a carefully designed participant selection protocol [3]:
Participant Recruitment: 17 patients each diagnosed with DM and DH were selected from permanent residents aged 18 years and above in Fuzhou City, China, from June 2019 to July 2020, with 1:1 matching by sex and age, plus 17 healthy controls.
Inclusion Criteria: Participants were 18 years or older with completed questionnaires and blood collection, signed informed consent, and meeting American Diabetes Association diagnostic criteria for diabetes (fasting blood glucose ≥7.0 mmol/L or random blood glucose >11.0 mmol/L). DH patients additionally exhibited fasting blood uric acid levels >420 μmol/L in men and >360 μmol/L in women.
Exclusion Criteria: Use of hypoglycemic agents; recent use of drugs affecting uric acid metabolism (diuretics, lipid-lowering drugs, aspirin, benzbromarone, allopurinol); diagnosis of gout, primary kidney disease, renal insufficiency, leukemia, or tumors; combination with psychiatric diseases or low cooperation; pregnancy and lactation.
Sample Preparation and Lipid Extraction
The protocol for sample preparation followed rigorous standardized procedures [3]:
Blood Collection and Processing: 5 mL of fasting morning blood was collected and centrifuged at 3,000 rpm for 10 minutes at room temperature. The upper layer of plasma (0.2 mL) was aliquoted, with quality control samples created by mixing equal groups of samples.
Lipid Extraction: 100 μL of thawed plasma was mixed with 200 μL of 4°C water, then 240 μL of pre-cooled methanol was added. After mixing, 800 μL of methyl tert-butyl ether (MTBE) was added, followed by 20 minutes of sonication in a low-temperature water bath and 30 minutes of standing at room temperature.
Phase Separation: Centrifugation at 14,000 g for 15 minutes at 10°C separated the phases. The upper organic phase was collected and dried under nitrogen. The dried residue was reconstituted for UHPLC-MS/MS analysis.
UHPLC-MS/MS Analysis Conditions
The analytical conditions for lipidomic profiling were comprehensively optimized [3]:
Chromatographic Conditions: Separation used a Waters ACQUITY UPLC BEH C18 column (2.1 mm × 100 mm, 1.7 μm particle size). The mobile phase consisted of A: 10 mM ammonium formate acetonitrile solution in water and B: 10 mM ammonium formate acetonitrile isopropanol solution.
Mass Spectrometry: The UHPLC system was coupled with tandem mass spectrometry, enabling high-sensitivity detection and quantification of lipid species. Quality control samples were randomly inserted into the analytical sequence to ensure data reliability.
Diagram 1: Experimental workflow for lipidomic profiling of diabetes with hyperuricemia (DH) versus diabetes alone (DM).
Metabolic Pathway Dysregulation
The lipidomic alterations observed in DH patients reflect coordinated disruptions in interconnected metabolic pathways:
Diagram 2: Dysregulated metabolic pathways and their clinical implications in DH versus DM.
The Scientist's Toolkit: Essential Research Reagents
Table 2: Key Research Reagent Solutions for Lipidomic Studies in Metabolic Disease
| Reagent/Category | Specific Examples | Function in Research | Application Notes |
|---|---|---|---|
| Chromatography Columns | Waters ACQUITY UPLC BEH C18 (2.1×100mm, 1.7μm) | Lipid separation by hydrophobicity | Provides high-resolution separation of complex lipid mixtures |
| Mass Spectrometry Systems | UHPLC-MS/MS with triple quadrupole or Q-Exactive Focus | Lipid identification and quantification | Enables untargeted lipidomics with high sensitivity |
| Lipid Extraction Solvents | Methyl tert-butyl ether (MTBE), Methanol, Isopropanol | Lipid extraction from biological samples | MTBE/methanol/water system enables efficient lipid recovery |
| Mobile Phase Additives | Ammonium formate, Formic acid | Enhance ionization efficiency in MS | Improves signal intensity and stability |
| Deuterated Internal Standards | Mix of 54 deuterated lipid standards | Quantification normalization | Corrects for extraction and ionization variance |
| Quality Control Materials | Pooled plasma samples | Monitoring analytical performance | Identifies technical variability across batches |
Discussion: Implications for Research and Therapeutic Development
The distinct lipid signature characterizing DH patients provides crucial insights for both biomarker development and therapeutic targeting. The upregulation of specific TG, PE, and PC species in DH versus DM alone suggests that hyperuricemia exacerbates pre-existing lipid metabolic disturbances in diabetes through shared pathophysiological mechanisms. These findings align with broader research showing that lipidome alterations are associated with diabetes progression and complications [9] [13].
From a therapeutic perspective, the identified pathway perturbations—particularly in glycerophospholipid and glycerolipid metabolism—offer potential intervention targets. The robustness of these findings across different analytical approaches strengthens their validity and suggests clinical relevance. Future research should focus on validating these lipid signatures in larger, diverse cohorts and exploring targeted interventions that specifically address the combined metabolic burden of diabetes with hyperuricemia.
Comprehensive lipidomic profiling reveals a distinct signature of upregulated TGs, PEs, and PCs in patients with diabetes mellitus combined with hyperuricemia compared to those with diabetes alone. These lipid alterations, enriched in glycerophospholipid and glycerolipid metabolism pathways, provide a molecular basis for the exacerbated metabolic dysregulation observed in the combined condition. The standardized experimental protocols and analytical workflows presented here offer a robust framework for future investigations into lipid-mediated mechanisms in metabolic disease, potentially guiding the development of targeted diagnostic and therapeutic strategies for this high-risk patient population.
Lipidomics has unveiled distinct dysregulation in glycerophospholipid and glycerolipid metabolism in patients with comorbid type 2 diabetes mellitus (T2DM) and hyperuricemia (HU) compared to those with T2DM alone. This comparison guide synthesizes evidence from mass spectrometry-based lipidomic profiles to objectively delineate these differences. Data demonstrate that the comorbid condition features a more pronounced perturbation of specific lipid species, including upregulated triglycerides (TGs) and phosphatidylethanolamines (PEs), and an enhanced dysregulation of core metabolic pathways. This analysis provides researchers and drug development professionals with a structured overview of the specific lipid alterations and the experimental methodologies used to identify them.
The co-occurrence of type 2 diabetes mellitus (T2DM) and hyperuricemia (HU) represents a significant clinical challenge, associated with amplified renal and cardiovascular risk [14] [15]. Dyslipidemia is a common feature in both conditions, but emerging lipidomic technologies reveal that the specific nature of lipid disturbances differs substantially between patients with T2DM alone and those with T2DM and HU. A recent study reported a striking 81.6% prevalence of dyslipidemia and hyperuricemia co-occurrence in a cohort of patients with uncontrolled T2DM, underscoring the clinical importance of this metabolic intersection [14] [15]. Beyond conventional lipid panels, advanced lipidomics can identify hundreds of individual lipid species, providing a more nuanced understanding of the underlying pathophysiology. Specifically, glycerophospholipid metabolism and glycerolipid metabolism have been identified as the two most significantly perturbed pathways in patients with comorbid T2DM and HU [10]. This guide compares the lipidomic profiles between these patient groups, summarizes key experimental data, and details the methodologies enabling these discoveries.
Comparative Lipidomic Profiles: Diabetes with Hyperuricemia vs. Diabetes Alone
Direct comparative lipidomics reveals a distinct signature in patients with concomitant disease. A 2025 untargeted lipidomic study that compared patients with T2DM and HU (the DH group) against those with T2DM alone (the DM group) and healthy controls (NGT) identified a specific set of differentially expressed lipids [10].
Table 1: Key Differential Lipid Species in DH vs. DM and NGT Groups [10]
| Lipid Class | Specific Lipid Molecules (Examples) | Trend in DH vs. NGT | Trend in DH vs. DM | Key Findings |
|---|---|---|---|---|
| Triglycerides (TGs) | TG(16:0/18:1/18:2) and 12 others | Significantly Upregulated | Information Missing | 13 TGs were significantly elevated in DH compared to NGT. |
| Phosphatidylethanolamines (PEs) | PE(18:0/20:4) and 9 others | Significantly Upregulated | Information Missing | 10 PEs were significantly elevated in DH compared to NGT. |
| Phosphatidylcholines (PCs) | PC(36:1) and 6 others | Significantly Upregulated | Information Missing | 7 PCs were significantly elevated in DH compared to NGT. |
| Phosphatidylinositol (PI) | Not Specified | Significantly Downregulated | Information Missing | One PI was significantly downregulated in DH. |
| Glycerophospholipid Pathway | N/A | Significantly Enriched | Significantly Enriched | Most significantly perturbed pathway (Impact value: 0.199). |
| Glycerolipid Pathway | N/A | Significantly Enriched | Significantly Enriched | Second significantly perturbed pathway (Impact value: 0.014). |
Another study investigating T2DM with hyperlipidemia, a condition closely related to HU, also found significant lipid disparities. When comparing the T2D HL (hyperlipidemia) group to the T2D group, 22 lipids from 4 lipid classes were differentially expressed, with the glycerophospholipid metabolism pathway being significantly affected [16]. This consistent identification of glycerophospholipid disruption across studies highlights its central role in the pathology of complicated diabetes.
Furthermore, a study on serum uric acid (SUA) correlation in T2DM patients found that SUA had a strong positive correlation with triglycerides (TG) (( rs = 0.65, p < 0.0001 )) and a significant negative correlation with HDL-C (( rs = -0.35, p < 0.0001 )) [17]. This reinforces the close relationship between uric acid levels and specific components of the glycerolipid profile.
Experimental Protocols & Methodologies
The lipidomic data presented rely on sophisticated analytical platforms. The following workflow outlines the typical process for the untargeted lipidomic studies cited.
Detailed Methodological Breakdown
Study Population and Sample Collection
The core comparative study recruited 17 patients each for the Diabetes with Hyperuricemia (DH), Diabetes Mellitus (DM), and Normal Glucose Tolerance (NGT) groups, matched for sex and age [10]. Similar studies collected fasting venous blood from participants. Plasma or serum was obtained by centrifugation (e.g., 3,000 rpm for 10 minutes) and stored at -80°C until analysis to preserve lipid integrity [10] [18].
Lipid Extraction and Pre-processing
The preferred method for lipid extraction is often a liquid-liquid technique. As detailed in the research:
- A 100 μL plasma sample is vortexed after adding 200 μL of 4°C water [10].
- 240 μL of pre-cooled methanol is added, followed by 800 μL of methyl tert-butyl ether (MTBE) for liquid-liquid extraction [10].
- The mixture is sonicated in a low-temperature water bath for 20 minutes and left to stand at room temperature for 30 minutes [10].
- After centrifugation (e.g., 14,000 g, 15 min, 10°C), the upper organic phase is collected and dried under a nitrogen stream [10]. The dried lipids are then reconstituted in an appropriate solvent like isopropanol for instrumental analysis [10].
Instrumentation and Data Acquisition
Ultra-High-Performance Liquid Chromatography-Tandem Mass Spectrometry (UHPLC-MS/MS) is the cornerstone technology for untargeted lipidomics due to its high sensitivity and wide analytical range [10] [16].
- Chromatography: Separation is typically performed on a reversed-phase column, such as a Waters ACQUITY UPLC BEH C18 column (2.1 mm × 100 mm, 1.7 μm). The mobile phase often consists of acetonitrile/water mixtures and acetonitrile/isopropanol mixtures, both with additives like 10 mM ammonium formate [10].
- Mass Spectrometry: Analysis is conducted in both positive and negative ionization modes to capture a broad spectrum of lipids. Data-Independent Acquisition (DIA) modes like MSE are employed to collect comprehensive MS and MS/MS data for all ions, reducing false negatives [16].
Data Processing and Statistical Analysis
- Multivariate Analysis: Techniques like Principal Component Analysis (PCA) and Orthogonal Partial Least Squares-Discriminant Analysis (OPLS-DA) are used to visualize group separation and identify lipids contributing most to the variance [10] [19].
- Differential Lipid Screening: Statistical tests (e.g., Student's t-test) combined with Fold Change (FC) analysis are applied to pinpoint significantly altered lipid molecules [10].
- Pathway Analysis: Platforms such as MetaboAnalyst 5.0 are used to map the dysregulated lipids onto metabolic pathways (e.g., KEGG) to identify significantly perturbed pathways based on impact and p-values [10].
The Scientist's Toolkit: Essential Research Reagents & Solutions
Successfully conducting these lipidomic comparisons requires a suite of specialized reagents and tools.
Table 2: Key Research Reagent Solutions for Lipidomics
| Reagent / Material | Function / Application | Specific Example from Research |
|---|---|---|
| UHPLC-MS/MS System | High-resolution separation and accurate mass detection of complex lipid mixtures. | Core analytical platform used in comparative studies [10]. |
| Methyl tert-butyl ether (MTBE) | Organic solvent for liquid-liquid extraction of a wide range of lipid classes. | Used in the MTBE-based lipid extraction method [10] [16]. |
| Reversed-Phase UPLC Column (e.g., C18) | Chromatographic separation of individual lipid species prior to mass spectrometry. | Waters ACQUITY UPLC BEH C18 column (1.7 μm particle size) [10]. |
| Ammonium Formate / Formic Acid | Mobile phase additives to improve ionization efficiency and chromatographic resolution. | 10 mM ammonium formate in acetonitrile/water and acetonitrile/isopropanol [10]. |
| Quality Control (QC) Samples | Pooled sample aliquots injected at regular intervals to monitor instrument stability and data quality. | Randomly inserted into the sample sequence to ensure analytical reproducibility [10] [18]. |
| Metabolic Pathway Analysis Software | Bioinformatics tool for interpreting lipidomic data in a biological context. | MetaboAnalyst 5.0 platform for pathway enrichment analysis [10]. |
Dysregulated Metabolic Pathways: A Visual Synthesis
The convergence of lipidomic data points to specific dysregulated metabolic pathways. The following diagram synthesizes the key findings regarding glycerophospholipid and glycerolipid metabolism in the context of diabetes and hyperuricemia.
The diagram illustrates how insulin resistance, a hallmark of T2DM often quantified by the Triglyceride-Glucose (TyG) index [20], drives the dysregulation. This leads to increased flux through both the glycerolipid pathway (producing TGs) and the glycerophospholipid pathway, resulting in the characteristic elevation of PCs and PEs, and the observed decrease in PI, as seen in patients with comorbid diabetes and hyperuricemia [10] [16].
In the evolving landscape of metabolic disease research, the investigation of lipidomic profiles has unveiled critical insights into the pathophysiological mechanisms underlying disease progression. This comparative analysis focuses on a particularly vulnerable population: younger patients presenting with concurrent diabetes mellitus (DM) and hyperuricemia (HUA). Emerging evidence substantiates that early-onset phenotypes exhibit more profound lipid disruptions than their older counterparts or those with diabetes alone, suggesting a distinct metabolic trajectory with significant implications for prognosis and therapeutic targeting. The co-occurrence of diabetes and hyperuricemia represents a potent metabolic challenge, with dyslipidemia serving as a key intermediary in disease pathogenesis. Recent investigations have quantified the prevalence of this metabolic triad, revealing that dyslipidemia and hyperuricemia co-occur in 81.6% of patients with uncontrolled type 2 diabetes, underscoring the clinical magnitude of this phenomenon [14]. This review synthesizes contemporary lipidomic evidence to delineate the specific lipid alterations characterizing younger patient cohorts, providing a foundation for precision medicine approaches in metabolic disease management.
Comparative Lipidomic Profiling: Young vs. Older Cohorts
Methodological Framework for Lipidomic Analysis
The foundational methodologies enabling precise lipidomic differentiation across patient cohorts involve sophisticated analytical platforms. A standardized protocol for plasma untargeted lipidomic analysis utilizes ultra-high performance liquid chromatography-tandem mass spectrometry (UHPLC-MS/MS) to achieve comprehensive lipid separation and identification [3]. The technical workflow begins with plasma sample preparation via a monophasic extraction using isopropanol containing internal deuterated standards (e.g., SPLASH LIPIDOMIX Mass Spec Standard) for quantification accuracy [11]. Chromatographic separation employs reversed-phase columns (Waters ACQUITY UPLC BEH C18 or BEH C8, 2.1 × 100 mm, 1.7 μm) with mobile phases consisting of 10 mM ammonium formate in water (A) and 10 mM ammonium formate in acetonitrile-isopropanol (B) [3] [11]. Mass spectrometric detection using QTRAP 6500+ systems facilitates the semi-quantification of hundreds to thousands of lipid molecules across multiple subclasses, with data processing through specialized software (Analyst version 1.6.2) [11]. Multivariate statistical approaches, including principal component analysis (PCA) and orthogonal partial least squares discriminant analysis (OPLS-DA), then enable differentiation of lipidomic profiles between patient groups with high accuracy (>95% for distinguishing early-onset hyperuricemia/gout from healthy controls) [11].
Table 1: Core Lipidomic Analysis Protocol
| Protocol Component | Specification | Application in Comparative Studies |
|---|---|---|
| Sample Preparation | Monophasic extraction with isopropanol + internal standards (deuterated lipids) | Ensures quantification accuracy across all patient cohorts |
| Chromatography | UHPLC with reversed-phase BEH C18/C8 columns (1.7 μm particle size) | Separates complex lipid mixtures from plasma samples |
| Mass Spectrometry | QTRAP 6500+ MS system with electrospray ionization | Detects and semi-quantifies 600+ lipid species |
| Data Processing | Analyst software (v1.6.2) with multivariate statistics (PCA, OPLS-DA) | Differentiates patient groups with >95% accuracy for early-onset phenotypes |
| Quality Control | Standard reference material (NIST SRM 1950) | Maintains analytical consistency across batch runs |
Lipidomic Alterations in Early-Onset Hyperuricemia and Diabetes
Comparative lipidomic profiling reveals substantial quantitative and qualitative differences in younger versus older patients with hyperuricemia, with parallel implications for diabetic populations. A comprehensive targeted lipidomic analysis of 608 plasma lipids demonstrated that both hyperuricemia and gout patients show significant alterations in lipid profiles, with the most profound changes observed in early-onset cases (age ≤40 years) [11]. The most significant perturbations include the upregulation of phosphatidylethanolamines (PEs) and downregulation of lysophosphatidylcholine plasmalogens/plasmanyls, with these alterations being markedly more pronounced in younger patients [11]. This pattern suggests accelerated glycerophospholipid metabolism dysregulation in early-onset disease, potentially contributing to more rapid disease progression and earlier development of complications. The distinct lipidomic signature of younger patients persists even after controlling for traditional risk factors, indicating that age of onset represents an independent determinant of metabolic phenotype severity.
Table 2: Lipid Class Alterations in Early-Onset vs. Late-Onset Metabolic Disease
| Lipid Class | Early-Onset Alteration (≤40 years) | Late-Onset Alteration (>40 years) | Biological Implications |
|---|---|---|---|
| Phosphatidylethanolamines (PEs) | Significantly upregulated [11] | Moderately upregulated | Increased membrane fluidity, potential impact on insulin signaling |
| Lysophosphatidylcholine Plasmalogens | Significantly downregulated [11] | Moderately downregulated | Reduced antioxidant capacity, increased oxidative stress |
| Triglycerides (TGs) | Multiple species significantly elevated (e.g., TG 16:0/18:1/18:2) [3] | Selective elevation | Enhanced lipid storage, adipose tissue expansion |
| Phosphatidylcholines (PCs) | Significant upregulation (e.g., PC 36:1) [3] | Moderate changes | Altered membrane composition, potential cell signaling effects |
| Phosphatidylinositols (PIs) | Downregulated [3] | Minimal change | Disrupted intracellular signaling pathways |
Pathway-Level Disturbances in Younger Cohorts
Beyond discrete lipid class alterations, pathway analysis reveals systematic metabolic disturbances that distinguish younger patient cohorts. When comparing patients with diabetes combined with hyperuricemia (DH) against those with diabetes alone (DM) and healthy controls (NGT), multivariate analyses demonstrate significant separation trends among all three groups, confirming distinct lipidomic architectures [3]. Crucially, the collective analysis of 31 significantly altered lipid metabolites in DH patients reveals their enrichment in six major metabolic pathways, with glycerophospholipid metabolism (impact value: 0.199) and glycerolipid metabolism (impact value: 0.014) identified as the most significantly perturbed pathways [3]. These pathway-level disturbances manifest more intensely in younger patients, suggesting that the co-occurrence of hyperuricemia and diabetes activates a feed-forward cycle of metabolic dysregulation that is particularly deleterious when established early in the lifespan. The identification of these pathway-specific perturbations provides a mechanistic foundation for understanding the accelerated disease trajectory observed in younger patients with concomitant metabolic conditions.
Molecular Mechanisms and Signaling Pathways
The lipidomic disruptions observed in younger patients with diabetes and hyperuricemia originate from interconnected molecular mechanisms that propagate metabolic dysfunction. The relationship between hyperuricemia and insulin resistance exhibits bidirectionality, with elevated uric acid promoting insulin resistance through oxidative stress, chronic inflammation, endothelial dysfunction, and adipocyte dysregulation, while insulin resistance conversely contributes to elevated uric acid levels through reduced renal excretion [21]. At a cellular level, uric acid has been demonstrated to impair insulin signaling pathways by inhibiting IRS1 and Akt phosphorylation, thereby reducing glucose uptake in peripheral tissues [21]. Simultaneously, in hepatic models, uric acid induces fat accumulation by stressing the endoplasmic reticulum and activating sterol regulatory element-binding protein-1c (SREBP-1c), a master regulator of lipogenesis [11]. The resulting lipidomic landscape creates a pro-inflammatory milieu characterized by elevated ceramides and reduced cardioprotective lipid species, establishing a molecular environment conducive to accelerated vascular complications and microvascular damage. These mechanisms appear amplified in younger patients, potentially due to greater metabolic flexibility and more responsive (yet vulnerable) signaling networks.
The Scientist's Toolkit: Essential Research Reagents and Platforms
Advancing research into early-onset lipid disruptions requires specialized reagents and analytical platforms designed for comprehensive lipidomic characterization. The following toolkit delineates essential resources for investigators in this field, compiled from methodologies employed in contemporary studies.
Table 3: Essential Research Reagents and Platforms for Lipidomic Investigation
| Category | Specific Product/Platform | Research Application | Key Features |
|---|---|---|---|
| Chromatography | Waters ACQUITY UPLC BEH C18/C8 columns (1.7μm) | Lipid separation | High-resolution separation of complex lipid mixtures |
| Mass Spectrometry | SCIEX QTRAP 6500+ LC-MS/MS System | Lipid identification and quantification | High-sensitivity detection of 600+ lipid species |
| Internal Standards | SPLASH LIPIDOMIX Mass Spec Standard | Quantification accuracy | Deuterated lipid standards across multiple classes |
| Reference Materials | NIST SRM 1950 - Metabolites in Frozen Human Plasma | Quality control | Standardized reference for method validation |
| Sample Preparation | Isopropanol extraction with MTBE | Lipid extraction | Efficient recovery of diverse lipid classes |
| Data Processing | Analyst Software (v1.6.2) | Data acquisition and processing | Instrument control and initial data processing |
| Statistical Analysis | MetaboAnalyst 5.0 Platform | Pathway analysis | Identification of perturbed metabolic pathways |
| Multivariate Statistics | SIMCA-P+ Software | OPLS-DA modeling | Differentiation of patient cohort lipidomic profiles |
Therapeutic Implications and Future Directions
The distinct lipidomic signature characterizing younger patients with concomitant diabetes and hyperuricemia carries significant implications for therapeutic strategy development and clinical management. Evidence suggests that urate-lowering treatment (ULT) may partially correct the lipidomic imbalance observed in early-onset cohorts, with studies demonstrating that ULT administration is associated with a normalization of specific lipid class alterations, particularly glycerophospholipids [11]. This effect highlights the potential for targeted metabolic interventions to modify disease trajectory in younger, high-risk patients. Beyond conventional urate-lowering approaches, emerging research indicates that pharmacological agents with pleiotropic metabolic effects, including SGLT2 inhibitors and GLP-1 receptor agonists, may simultaneously address hyperglycemia, hyperuricemia, and associated lipid disruptions through interconnected mechanisms [14] [22]. Future research directions should prioritize longitudinal studies tracking lipidomic evolution in response to targeted interventions, with particular emphasis on the window of opportunity presented by early-onset disease. Additionally, the integration of multi-omics approaches—combining lipidomics with genomics, proteomics, and metabolomics—will enable more comprehensive phenotyping and personalized therapeutic approaches for younger patients exhibiting these profound lipid disruptions.
The comprehensive analysis of lipidomic profiles in patients with diabetes and hyperuricemia reveals a critical distinction between early-onset and late-onset phenotypes. Younger patients (≤40 years) demonstrate more profound disruptions across multiple lipid classes, particularly phosphatidylethanolamines, lysophosphatidylcholine plasmalogens, and triglycerides, with concomitant disturbances in glycerophospholipid and glycerolipid metabolism pathways. These quantifiable differences, detectable via advanced UHPLC-MS/MS platforms, substantiate the concept of early-onset metabolic disease as a distinct clinical entity with accelerated pathophysiological progression. The delineation of these lipidomic signatures provides both prognostic insight and therapeutic opportunity, highlighting the imperative for age-specific management approaches in patients presenting with concomitant diabetes and hyperuricemia. As precision medicine continues to evolve, lipidomic profiling promises to enhance risk stratification and enable targeted interventions for this metabolically vulnerable population.
The study of complex metabolic diseases like diabetes and hyperuricemia has evolved beyond single-omics approaches, revealing the critical need for integrated analyses that connect lipidomic perturbations with genetic susceptibility and proteomic alterations. This integrated perspective is essential for unraveling the multifaceted pathophysiology of diabetes with hyperuricemia (DH) compared to diabetes alone (DM). Lipidomics, which provides a comprehensive profile of lipid species within a biological system, serves as a crucial bridge between genetic predispositions and functional protein effects. When combined with proteomic and genetic data, lipidomic profiles transform from mere biomarkers into powerful tools for understanding disease mechanisms, identifying novel therapeutic targets, and developing personalized treatment strategies for metabolic disorders.
Lipidomic Perturbations in Diabetes with Hyperuricemia vs. Diabetes Alone
Distinct Lipidomic Profiles Revealed by Untargeted Analysis
Comprehensive lipidomic analyses reveal significant alterations in plasma lipid metabolites between patients with diabetes mellitus combined with hyperuricemia (DH) and those with diabetes alone (DM). Using ultra-high performance liquid chromatography-tandem mass spectrometry (UHPLC-MS/MS), researchers have identified 1,361 lipid molecules across 30 subclasses, demonstrating a clear separation in lipidomic profiles between DH, DM, and normal glucose tolerance (NGT) groups [10].
Table 1: Significantly Altered Lipid Classes in Diabetes with Hyperuricemia vs. Diabetes Alone
| Lipid Class | Representative Lipid Species | Change in DH vs. DM | Biological Implications |
|---|---|---|---|
| Triglycerides (TGs) | TG(16:0/18:1/18:2) | ↑ Significantly upregulated | Associated with insulin resistance and cardiovascular risk |
| Phosphatidylethanolamines (PEs) | PE(18:0/20:4) | ↑ Significantly upregulated | Membrane fluidity and signaling alterations |
| Phosphatidylcholines (PCs) | PC(36:1) | ↑ Significantly upregulated | Disrupted membrane integrity and signaling |
| Phosphatidylinositols (PIs) | Not specified | ↓ Downregulated | Impaired intracellular signaling |
| Sphingolipids | Sphingosine(d16:0) | ↑ In insulin resistance | Associated with IR in obesity [23] |
| Coenzyme | Coenzyme(Q8) | ↑ In insulin resistance | Mitochondrial dysfunction [23] |
Multivariate analyses including principal component analysis (PCA) and orthogonal partial least squares discriminant analysis (OPLS-DA) have confirmed distinct lipidomic separation between these patient groups, highlighting the profound impact of hyperuricemia on lipid metabolism in diabetic individuals [10]. The collective analysis of these altered metabolites reveals their enrichment in six major metabolic pathways, with glycerophospholipid metabolism (impact value: 0.199) and glycerolipid metabolism (impact value: 0.014) identified as the most significantly perturbed pathways in DH patients [10].
Pathway Analysis and Metabolic Implications
The integration of lipidomic data with pathway analysis tools such as MetaboAnalyst 5.0 has been instrumental in identifying the core metabolic disruptions in diabetes with hyperuricemia. The discovery that glycerophospholipid and glycerolipid metabolism pathways are significantly perturbed in DH patients provides crucial insights into the mechanistic links between hyperuricemia and lipid dysregulation in diabetes [10].
These pathway disturbances correlate with clinical observations of accelerated renal and cardiovascular damage in diabetic patients with concomitant hyperuricemia. The upregulation of specific triglycerides, phosphatidylethanolamines, and phosphatidylcholines suggests enhanced lipogenesis and membrane remodeling processes that may contribute to the progression of diabetic complications [10]. Furthermore, the downregulation of phosphatidylinositols indicates potential disruptions in intracellular signaling cascades that are critical for insulin action and metabolic homeostasis.
Experimental Protocols for Multi-Omics Integration
Lipidomic Profiling Methodology
The standard workflow for lipidomic analysis in metabolic disease research involves several critical steps that ensure comprehensive lipid coverage and accurate quantification:
Sample Preparation Protocol:
- Sample Collection: Collect 5 mL of fasting morning blood in EDTA-coated tubes and centrifuge at 3,000 rpm for 10 minutes at room temperature [10].
- Plasma Separation: Aliquot 0.2 mL of the upper plasma layer into 1.5 mL centrifuge tubes and store at -80°C until analysis [10].
- Lipid Extraction: Thaw samples on ice and vortex. Take 100 μL and add 200 μL of 4°C water followed by 240 μL of pre-cooled methanol. Add 800 μL of methyl tert-butyl ether (MTBE), sonicate for 20 minutes in a low-temperature water bath, and incubate at room temperature for 30 minutes [10].
- Phase Separation: Centrifuge at 14,000 g for 15 minutes at 10°C. Collect the upper organic phase and dry under nitrogen stream [10].
- Reconstitution: Reconstitute the dried lipids in 100 μL of isopropanol for UHPLC-MS/MS analysis [10].
UHPLC-MS/MS Analysis Conditions:
- Chromatography: Utilize a Waters ACQUITY UPLC BEH C18 column (2.1 mm × 100 mm, 1.7 μm particle size) with mobile phase A (10 mM ammonium formate acetonitrile solution in water) and mobile phase B (10 mM ammonium formate acetonitrile isopropanol solution) [10].
- Mass Spectrometry: Perform analysis using a tandem mass spectrometry system with electrospray ionization in both positive and negative ion modes to maximize lipid coverage [10].
- Quality Control: Insert quality control samples randomly throughout the analytical sequence to monitor instrument performance and data quality [10].
Proteomic Integration Protocols
The integration of proteomic data with lipidomic profiles requires specialized approaches to identify protein-lipid networks:
Proteomic Data Acquisition:
- Multiplex Proteomic Assays: Utilize high-throughput proteomic platforms such as the Olink platform to quantify hundreds of proteins simultaneously in plasma samples [23].
- Protein Correlation Networks: Apply weighted gene co-expression network analysis (WGCNA) to identify modules of co-expressed proteins that correlate with clinical phenotypes [24].
Integrated Analysis Workflow:
- Data Preprocessing: Normalize both lipidomic and proteomic datasets, impute missing values using k-nearest neighbor imputation, and apply inverse normal transformation to account for technical variability [24].
- Network Construction: Build weighted lipid and protein co-expression networks using appropriate similarity measures and identify modules of tightly correlated molecules [24].
- Module-Phenotype Correlation: Correlate module eigenvalues with clinical traits such as disease status, progression, and relevant biochemical parameters [24].
- Pathway Enrichment Analysis: Employ gene ontology enrichment analysis to examine biological processes and molecular functions of protein modules associated with disease phenotypes [24].
Figure 1: Integrated Multi-Omics Workflow for Lipidomic and Proteomic Data in Metabolic Disease Research
Proteomic Correlates of Lipidomic Perturbations in Metabolic Disease
Key Protein Biomarkers and Their Clinical Utility
Integrated proteomic and lipidomic analyses have identified specific protein biomarkers that strongly correlate with lipid disturbances in metabolic diseases including diabetes with hyperuricemia. These proteins not only serve as diagnostic markers but also provide insights into the underlying pathophysiological mechanisms.
Table 2: Protein Biomarkers Associated with Lipidomic Perturbations in Metabolic Disease
| Protein Biomarker | Full Name | Expression in IR/DH | AUROC Value | Biological Function |
|---|---|---|---|---|
| FABP4 | Fatty Acid Binding Protein 4 | Overexpressed | Not specified | Lipid chaperone, inflammation |
| PAI | Serpin Family E Member 1 | Overexpressed | 0.65 | Fibrinolysis inhibition |
| IGFBP-1 | Insulin-like Growth Factor Binding Protein 1 | Lower expression | 0.89 | IGF regulation, glucose metabolism |
| PON3 | Paraoxonase 3 | Lower expression | 0.81 | Antioxidant protection |
| Adiponectin | Adiponectin | Lower expression | Less than IGFBP-1/PON3 | Insulin sensitization |
The diagnostic performance of these protein biomarkers often surpasses traditional metabolic indicators. For instance, IGFBP-1 demonstrated an AUROC of 0.89 for diagnosing insulin resistance, significantly higher than adiponectin (AUROC 0.67) and leptin (AUROC 0.65) [23]. Similarly, PON3 showed an AUROC of 0.81, highlighting the superior diagnostic capability of these proteomic markers derived from integrated omics analyses [23].
Network Analysis of Protein-Lipid Interactions
Weighted gene co-expression network analysis (WGCNA) of integrated proteomic and lipidomic data has revealed functionally significant modules associated with metabolic diseases. Studies in Alzheimer's disease (as a model of complex metabolic disorder) have identified five key protein modules out of seventeen that correlate with disease phenotypes, involving processes such as positive regulation of cytokine production, neutrophil-mediated immunity, and humoral immune responses [24].
Similarly, lipid modules comprising phospholipids, triglycerides, sphingolipids, and cholesterol esters have shown significant correlations with disease risk loci involved in immune response and lipid metabolism [24]. These network-based approaches demonstrate how integrated omics analyses can reveal organized functional modules rather than just individual biomarkers, providing a systems-level understanding of metabolic diseases including diabetes with hyperuricemia.
Genetic Susceptibility and Multi-Omics Integration
Genetic Loci Influencing Lipidomic Profiles
The integration of genomic data with lipidomic and proteomic profiles has revealed how genetic susceptibility loci influence lipid metabolism in metabolic diseases. Network analyses have demonstrated significant associations between established disease risk loci and specific lipid/protein modules that correlate with clinical phenotypes [24].
For instance, specific lipid modules comprising phospholipids, triglycerides, sphingolipids, and cholesterol esters have been correlated with risk loci involved in immune response and lipid metabolism [24]. Similarly, protein modules involved in immune responses show correlations with risk loci in the complement system and lipid metabolism, including the APOE ε4 genotype [24]. These findings highlight how genetic susceptibility can shape both the proteomic and lipidomic landscape in metabolic diseases.
Mendelian Randomization and Causal Inference
Advanced statistical approaches such as Mendelian randomization can leverage genetic variants as instrumental variables to infer causal relationships between lipid species and disease outcomes. This approach helps distinguish between causal lipid mediators and reactive changes in the disease process, providing valuable insights for therapeutic target prioritization.
While the specific search results don't provide detailed Mendelian randomization analyses in diabetes with hyperuricemia, the network analysis approaches described demonstrate the principle of using genetic data to inform lipidomic and proteomic associations [24]. Future studies specifically applying Mendelian randomization to the DH vs. DM comparison would strengthen causal inference in the observed lipidomic differences.
The Scientist's Toolkit: Essential Research Reagents and Platforms
Table 3: Essential Research Reagents and Platforms for Multi-Omics Studies
| Category | Specific Tool/Reagent | Application | Key Features |
|---|---|---|---|
| Chromatography | Waters ACQUITY UPLC BEH C18 Column | Lipid separation | 2.1 mm × 100 mm, 1.7 μm particles |
| Mass Spectrometry | UHPLC-MS/MS with ESI source | Lipid identification and quantification | High resolution, positive/negative mode switching |
| Proteomic Platforms | Olink Proteomics | Multiplex protein quantification | High-throughput, plasma proteomics |
| Proteomic Platforms | SOMAscan (SomaLogic) | Aptamer-based protein detection | 1016 protein targets with Uniprot ID [24] |
| Bioinformatics | MetaboAnalyst 5.0 | Pathway analysis | Lipid pathway enrichment, network visualization |
| Bioinformatics | WGCNA R Package | Co-expression network analysis | Module identification, phenotype correlation |
| Statistical Analysis | IBM SPSS Statistics v30 | Statistical modeling | Logistic regression, ROC analysis |
| Specialized Reagents | Potassium Oxonate (PO) | Hyperuricemia induction | Uricase inhibitor, 350 mg/kg dose [5] |
Visualization and Data Representation in Multi-Omics Studies
Effective visualization of integrated omics data requires careful consideration of design principles to accurately communicate complex relationships. Key guidelines include maximizing the data-ink ratio by eliminating non-data ink and redundant elements [25]. This principle emphasizes that every bit of ink (or pixels) in a visualization should present new information, leading to cleaner and more effective graphics.
Additional critical guidelines include:
- Self-explanatory visualizations: Figures should include clear titles, axis labels with units, and sufficient context to be understood without excessive reference to the main text [25].
- Meaningful baselines: Axes, particularly in bar charts, should start at appropriate baselines (usually zero) to avoid distorting data patterns [25].
- Direct labeling: Instead of legends, label elements directly when possible to avoid indirect look-up and facilitate faster comprehension [25].
- Colorblind-aware palettes: Approximately 8% of males worldwide have color vision deficiency, necessitating careful color selection that differentiates by saturation and brightness rather than just hue [25].
Figure 2: Multi-Omics Network Linking Genetic Susceptibility to Clinical Outcomes in Diabetes with Hyperuricemia
The integration of lipidomic data with genetic and proteomic susceptibility information represents a transformative approach to understanding complex metabolic diseases like diabetes with hyperuricemia. The distinct lipidomic signatures observed in DH compared to DM alone, characterized by elevations in specific triglycerides, phosphatidylethanolamines, and phosphatidylcholines, along with corresponding proteomic alterations in proteins like FABP4, PAI, IGFBP-1, and PON3, provide a comprehensive molecular portrait of this metabolic phenotype.
The experimental protocols and analytical frameworks described herein, including UHPLC-MS/MS lipidomics, multiplexed proteomics, and WGCNA network analysis, provide researchers with robust methodologies for conducting integrated omics studies. The essential research tools and visualization principles further support the generation and communication of high-quality multi-omics data.
Future directions in this field will likely include larger-scale longitudinal studies to establish temporal relationships between omics changes and disease progression, as well as interventional studies to determine how these integrated omics profiles respond to treatment. Additionally, the development of more sophisticated computational methods for multi-omics data integration will enhance our ability to extract biologically meaningful insights from these complex datasets, ultimately advancing personalized approaches to managing diabetes and its metabolic comorbidities.
Advanced Lipidomics in Practice: From Mass Spectrometry to Biomarker Panels
Lipidomics, defined as the systems-level analysis of lipids and their interactors, has become an essential strategy for understanding the mechanisms underlying cellular signaling, metabolism, and homeostasis [26]. In the context of metabolic diseases such as diabetes mellitus (DM) and hyperuricemia, lipidomics provides powerful insights into pathological mechanisms and potential diagnostic signatures [3] [26]. The biological significance of lipids in multiple physio-pathological events has driven the development of lipidomics as a discipline, with technological innovations enabling increasingly comprehensive analysis of the lipidome [27]. Within this field, two primary analytical paradigms have emerged: untargeted (hypothesis-generating) and targeted (hypothesis-driven) lipidomics [28]. Ultra-high-performance liquid chromatography coupled to tandem mass spectrometry (UHPLC-MS/MS) has become the cornerstone technology for both approaches, offering the sensitivity, selectivity, and throughput required for meaningful lipidomic profiling in complex biological matrices [3] [29] [30]. This guide objectively compares these core analytical platforms within the specific research context of comparing lipidomic profiles in diabetes with hyperuricemia versus diabetes alone.
Untargeted versus Targeted Lipidomics: A Strategic Comparison
Conceptual Frameworks and Applications
Untargeted and targeted lipidomics represent complementary approaches with distinct philosophical frameworks and application domains. Untargeted lipidomics employs a holistic analytical strategy to profile the complete lipid repertoire within biological specimens without prior selection of targets [28]. This hypothesis-free approach serves as a discovery tool to map lipid diversity, uncover novel metabolic pathways, and elucidate lipid functional networks across biological systems [28]. In contrast, targeted lipidomics adopts a hypothesis-driven methodology, focusing on precise quantification of predefined lipid panels [28]. Leveraging techniques such as Multiple Reaction Monitoring (MRM), this approach prioritizes analytical rigor for specific lipid classes or molecules, delivering absolute quantification via internal standards [26] [28]. It is optimized for validating biomarkers, monitoring metabolic fluxes, and assessing therapeutic interventions [28].
In diabetes and hyperuricemia research, these approaches serve sequential purposes. Untargeted methods can identify novel lipid signatures associated with disease comorbidity, while targeted approaches enable rigorous validation and quantification of these candidates across larger patient cohorts [3] [28].
Technical Specifications and Performance Characteristics
The fundamental differences between these approaches are reflected in their technical implementations and performance characteristics, as summarized in Table 1.
Table 1: Comparison of Untargeted and Targeted Lipidomics Approaches
| Dimension | Untargeted Lipidomics | Targeted Lipidomics |
|---|---|---|
| Scanning Mode | Full Scan + Data-Dependent Acquisition (DDA) | Selective Reaction Monitoring (SRM/MRM) |
| Target Scope | Global coverage (>1,000 lipids) | Specific targets (<100 to ~600 lipids) |
| Quantification Capability | Semi-quantitative (relative quantification) | Absolute quantification (standard curve method) |
| Sensitivity | Moderate | High (zeptomole detection limits) |
| Instrument Configuration | Q-TOF, Orbitrap (high resolution) | Triple Quadrupole (QQQ) |
| Data Analysis Core | Spectrum matching, fragment ion annotation | Ion pair optimization, internal standard correction |
| Typical Applications | Biomarker discovery, metabolic pathway analysis | Clinical diagnostics validation, drug monitoring |
| Advantages | Unbiased, high discovery power | High sensitivity, precise quantification |
| Limitations | Lower quantitative accuracy, database dependent | Poor scalability, inability to detect novel lipids |
The instrumentation requirements differ substantially between these approaches. Untargeted lipidomics relies on high-resolution mass spectrometers (HRMS) such as Quadrupole Time-of-Flight (Q-TOF), Orbitrap, or Fourier Transform Ion Cyclotron Resonance (FTICR) MS, which provide powerful mass resolution and high mass accuracy essential for elucidating lipid structural composition [27] [28]. Targeted lipidomics typically employs triple quadrupole (QQQ) instruments operating in MRM mode, leveraging the iFunnel technology available in systems like the Agilent 6490 to achieve up to a 10X increase in sensitivity and zeptomole detection limits at conventional HPLC flow rates [26]. The Agilent 6490 QQQ MS system offers up to six orders of linear dynamic range and allows dynamic MRM methods with up to 4,000 transitions per method with polarity switching in as little as 30 milliseconds [26].
UHPLC-MS/MS Platform Configuration for Lipidomics
Chromatographic Separation Strategies
Chromatographic separation is a critical component of lipidomic analysis, with different approaches offering distinct advantages for specific applications. Reversed-phase UHPLC enables separation of lipids based on their hydrophobicity, fatty acyl chain length, and degree of unsaturation, providing deeper structural resolution and distinguishing of isomeric lipid species [30]. This approach was successfully implemented in a PDAC study, where it identified 455 lipid species from 22 subclasses and quantified 381 species, revealing molecular signatures that would remain hidden with lipid class separation [30]. Hydrophilic interaction liquid chromatography separates lipids by class based on the polarity of their head groups and is often used in complementary workflows [28]. Normal-phase HPLC is another option for separating glycerophospholipids and sphingolipids by class [26].
The selection of chromatographic column and mobile phase significantly impacts separation efficiency. For reversed-phase separation, Waters ACQUITY UPLC BEH C18 columns (2.1 mm × 100 mm, 1.7 μm) provide excellent performance [3]. Mobile phase optimization typically involves combinations of acetonitrile or methanol with water, often modified with additives such as ammonium formate or formic acid to enhance ionization efficiency [3] [31]. The addition of 0.1% formic acid to both aqueous and organic phases has been shown to significantly enhance ionization efficiency [31].
Mass Spectrometric Detection and Identification
Mass spectrometric detection parameters must be carefully optimized for lipidomic analysis. In untargeted approaches, full-scan MS data (typically m/z 50-2000) is acquired with high mass accuracy (<5 ppm), often supplemented by data-dependent acquisition (DDA) to obtain fragmentation spectra for the most abundant ions [28]. Targeted approaches use predetermined MRM transitions specific to each lipid species, with collision energies optimized for each transition to generate characteristic fragment ions [26] [31].
Ionization techniques are selected based on the lipid classes of interest. Electrospray ionization optimizes detection of polar lipids such as phosphatidylcholines and sphingomyelins [28]. Atmospheric pressure chemical ionization may be preferred for nonpolar species including cholesteryl esters and triacylglycerols [28]. Both positive and negative ionization modes are typically employed in separate runs to comprehensively cover the lipidome [26].
Table 2: Quantitative Performance Characteristics of UHPLC-MS/MS Platforms
| Performance Metric | Untargeted Lipidomics | Targeted Lipidomics |
|---|---|---|
| Mass Accuracy | <5 ppm | <0.5 Da |
| Linear Dynamic Range | 2-3 orders of magnitude | Up to 6 orders of magnitude |
| Limit of Detection | Compound-dependent | Zeptomole levels (10⁻²¹ mol) |
| Precision (RSD) | 10-20% | <5% |
| Recovery Rates | Variable | 80-120% |
| Quantification Approach | Relative to internal standards | Absolute with calibration curves |
Experimental Protocols for Diabetes and Hyperuricemia Lipidomics
Sample Preparation Methodology
Proper sample preparation is crucial for reproducible lipidomic results. For plasma or serum samples, as used in diabetes-hyperuricemia research, a modified Bligh-Dyer extraction or protein precipitation method is commonly employed [3] [26]. The protocol typically involves:
- Sample Collection: Fasting blood samples collected and centrifuged at 3,000 rpm for 10 minutes at room temperature to separate plasma [3].
- Aliquot Preparation: 0.2 mL of the upper layer of plasma is transferred to 1.5 mL centrifuge tubes [3].
- Quality Control (QC) Preparation: Equal aliquots from multiple samples are pooled to create QC samples inserted at regular intervals throughout the analytical sequence [3] [30].
- Lipid Extraction: 100 μL plasma is mixed with 200 μL of 4°C water, followed by addition of 240 μL of pre-cooled methanol and 800 μL of methyl tert-butyl ether (MTBE) [3]. After mixing, samples are sonicated in a low-temperature water bath for 20 minutes and stood at room temperature for 30 minutes [3].
- Phase Separation: Centrifugation at 14,000 g for 15 minutes at 10°C separates the phases [3].
- Concentration: The upper organic phase is collected and dried under a stream of nitrogen [3].
- Reconstitution: The dried lipid extract is reconstituted in an appropriate solvent such as 100 μL isopropanol [3].
An alternative protein precipitation method using butanol/methanol (1:1, v/v) has also been described, followed by purification through a 0.25 μm cellulose membrane filter [30].
Analytical Sequence Design
Robust lipidomic analysis requires careful experimental design to account for potential instrumental drift and batch effects. The inclusion of pooled quality control samples at regular intervals throughout the analytical sequence is essential for monitoring instrument stability [3] [30]. Some studies employ commercial plasma as a surrogate for pooled study samples to evaluate analytical variation [32]. The use of internal standards is critical for both untargeted and targeted approaches, with stable isotope-labeled analogs (e.g., ¹³C-PC 16:0/18:1) mitigating matrix effects and instrumental drift [28]. For targeted analyses, validation of recovery rates (80-120%) and precision (CV < 15%) via quality control samples is standard practice [28].
Application to Diabetes and Hyperuricemia Research
Lipidomic Discoveries in Combined Metabolic Disorders
The application of UHPLC-MS/MS lipidomics to diabetes mellitus combined with hyperuricemia has revealed significant alterations in lipid metabolism. One study comparing DH (diabetes with hyperuricemia), DM (diabetes alone), and NGT (normal glucose tolerance) groups identified 1,361 lipid molecules across 30 subclasses using UHPLC-MS/MS-based untargeted lipidomic analysis [3]. Multivariate analyses revealed a significant separation trend among the DH, DM, and NGT groups, confirming distinct lipidomic profiles [3]. Specifically, researchers pinpointed 31 significantly altered lipid metabolites in the DH group compared to NGT controls [3]. Among the most relevant individual metabolites, 13 triglycerides, 10 phosphatidylethanolamines, and 7 phosphatidylcholines were significantly upregulated, while one phosphatidylinositol was downregulated [3].
Pathway analysis of these differential metabolites revealed enrichment in six major metabolic pathways, with glycerophospholipid metabolism and glycerolipid metabolism identified as the most significantly perturbed pathways in DH patients [3]. Furthermore, comparison of DH versus DM groups identified 12 differential lipids that were also predominantly enriched in these same core pathways, underscoring their central role in the pathophysiology of hyperuricemia complicating diabetes [3].
Quantitative Lipidomic Profiling
Targeted lipidomic approaches enable precise quantification of specific lipid panels relevant to diabetes and hyperuricemia research. Comprehensive targeted lipidomic profiling can quantify over 590 individual lipid species belonging to 34 lipid classes, including glycerolipids, sphingolipids, and glycerophospholipids [26]. This quantitative approach provides the rigorous data necessary for clinical association studies and biomarker validation.
Advanced reversed-phase UHPLC/MS/MS methods have been developed that provide enhanced lipidomic profiling through improved separation of molecular species [30]. One such method enabled identification of 455 lipid species from 22 subclasses and quantitation of 381 species, with response factor correction for sterol esters markedly improving quantification accuracy [30]. This level of molecular detail is essential for uncovering specific enzymatic activities or pathways disrupted in metabolic diseases.
Table 3: Key Lipid Classes and Their Relevance to Diabetes-Hyperuricemia Research
| Lipid Category | Representative Lipid Classes | Biological Functions | Relevance to Diabetes-Hyperuricemia |
|---|---|---|---|
| Glycerophospholipids | PC, PE, PS, PI, PG | Membrane structure, signaling | Glycerophospholipid metabolism identified as most significantly perturbed pathway [3] |
| Glycerolipids | TG, DG, MG | Energy storage, signaling | Glycerolipid metabolism significantly altered in DH patients [3] |
| Sphingolipids | Cer, SM, GlcCer, GalCer | Signaling, membrane domains | Associated with insulin resistance and complications [26] |
| Sterol Lipids | CE, FC | Membrane fluidity, signaling | Require response factor correction for accurate quantification [30] |
| Fatty Acyls | Eicosanoids, oxylipins | Inflammatory signaling | Low abundance necessitates targeted approaches [28] |
The Scientist's Toolkit: Essential Research Reagents and Materials
Successful implementation of UHPLC-MS/MS lipidomics requires specific reagents and materials optimized for lipid analysis. Table 4 details essential components for establishing a robust lipidomics workflow.
Table 4: Essential Research Reagents and Materials for Lipidomics
| Item Category | Specific Examples | Function/Purpose |
|---|---|---|
| Chromatography Columns | Waters ACQUITY UPLC BEH C18 (2.1×100 mm, 1.7 μm); Agilent ZORBAX Eclipse Plus C18 | Lipid separation based on hydrophobicity (RP) or head group (HILIC) |
| Mobile Phase Solvents | LC/MS grade methanol, acetonitrile, 2-propanol, butanol; deionized water (Milli-Q) | Chromatographic separation with minimal ion suppression |
| Mobile Phase Additives | Ammonium formate, formic acid (0.1%) | Enhance ionization efficiency and improve peak shape |
| Extraction Solvents | Methyl tert-butyl ether (MTBE), chloroform, methanol, butanol | Lipid extraction from biological matrices |
| Internal Standards | SPLASH Lipidomix; deuterated or 13C-labeled PC, PE, TG, Cer, etc. | Quantification normalization and quality control |
| Quality Control Materials | NIST SRM 1950 Human Plasma; pooled study samples | Method validation and instrumental performance monitoring |
| Sample Preparation | 0.25 μm cellulose membrane filters; solid-phase extraction cartridges | Sample purification and matrix clean-up |
Analytical Considerations for Metabolic Disease Research
Technical Challenges and Limitations
Despite significant advances, lipidomic analysis still faces considerable challenges. The structural complexity of lipids presents a major hurdle, with biological systems containing tens to hundreds of thousands of distinct chemical entities with wide diversities in structures and physiochemical properties [27]. The LIPID MAPS Structure Database currently includes over 44,000 unique lipid structures distributed across eight categories [27]. This diversity creates analytical challenges in both expanding the scope of analysis to achieve comprehensive coverage and accurately quantifying individual lipid molecules [27].
Isomer complexity represents another significant challenge, as structural analogs (e.g., DG 34:1 vs. TG 34:1) necessitate advanced separation techniques and validation using collision cross-section measurements or ion mobility spectrometry [28]. Additionally, the wide dynamic range of lipid concentrations in biological samples means high-abundance lipids (e.g., triglycerides) may obscure low-concentration species (e.g., ceramides), requiring signal optimization strategies [28].
Emerging Trends and Future Directions
The field of lipidomics continues to evolve with several promising trends enhancing research capabilities. Pseudotargeted lipidomics represents an emerging strategy that combines the wide coverage of untargeted methods with the improved quantification of targeted approaches [27]. Ion mobility spectrometry is increasingly integrated with UHPLC-MS/MS platforms, providing additional separation dimension based on the shape and size of ions, which helps distinguish isomeric lipids [28]. Green analytical chemistry principles are being applied to develop more sustainable lipidomic methods that reduce solvent consumption and waste generation while maintaining analytical performance [29].
For diabetes and hyperuricemia research, the integration of lipidomics with other omics technologies (genomics, transcriptomics, proteomics) holds particular promise for elucidating comprehensive mechanistic networks underlying these complex metabolic disorders [27]. As lipidomic methodologies continue to advance, they will increasingly enable the discovery of specific lipid biomarkers and therapeutic targets for improved diagnosis and treatment of metabolic diseases.
Lipidomics, the large-scale study of lipid pathways and networks, provides a powerful tool for investigating the complex metabolic interplay in comorbid conditions such as diabetes mellitus (DM) and hyperuricemia. Research reveals that the prevalence of hyperuricemia is significantly higher in diabetic populations than in the general population, and the coexistence of these conditions can exacerbate complications including renal impairment and cardiovascular disease [33]. This comparison guide examines critical study design considerations for lipidomic profiling research comparing diabetic hyperuricemia (DH) to diabetes alone, focusing on cohort selection, sample preparation methodologies, and quality control (QC) protocols to ensure analytically robust and biologically relevant findings.
Cohort Selection and Clinical Characterization
Proper cohort selection is fundamental for generating meaningful lipidomic data. Studies must carefully define inclusion criteria and match participants to control for confounding variables.
Defining Study Populations and Key Variables
Table 1: Essential Criteria for Cohort Selection in DH vs. DM Lipidomics Studies
| Cohort Group | Diagnostic Criteria | Key Exclusion Criteria | Matching Variables |
|---|---|---|---|
| Diabetes with Hyperuricemia (DH) | Fasting blood glucose ≥7.0 mmol/L AND Uric acid >420 μmol/L (men) / >360 μmol/L (women) [33] [10] | History of gout; malignancy; uric acid-lowering drugs; diuretics; renal insufficiency [33] [10] | Sex, Age, Diabetes Duration |
| Diabetes Alone (DM) | Fasting blood glucose ≥7.0 mmol/L [10] | Hyperuricemia; use of drugs affecting uric acid metabolism [10] | Sex, Age, Diabetes Duration |
| Healthy Controls (NGT) | Normal fasting glucose and uric acid levels [10] | Diabetes; hyperuricemia; major chronic diseases [10] | Sex, Age |
Prospective cohort studies have demonstrated that specific hyperuricemia trajectories, particularly a "high-increasing" pattern, are associated with a 42% increased risk of developing diabetes, with obesity, dyslipidemia, and hypertension acting as significant mediators [34]. This underscores the importance of recruiting well-phenotyped cohorts and collecting comprehensive clinical data.
Table 2: Essential Clinical and Laboratory Covariates for Cohort Characterization
| Category | Specific Parameters to Collect |
|---|---|
| Demographics & Anthropometrics | Age, Sex, Body Mass Index (BMI), Waist Circumference [33] |
| Diabetes-Related | Diabetes Duration, Fasting Blood Glucose, HbA1c, Diabetes Medication [33] |
| Renal & Liver Function | Serum Creatinine (SCr), Blood Urea Nitrogen (BUN), Estimated Glomerular Filtration Rate (eGFR), Alanine Aminotransferase (ALT) [33] |
| Lipid Profile | Total Cholesterol (TC), Triglycerides (TGs), Low-Density Lipoprotein Cholesterol (LDL-C), High-Density Lipoprotein Cholesterol (HDL-C) [33] |
| Lifestyle Factors | Smoking Status, Alcohol Consumption, Exercise Habits [33] |
Sample Preparation and Analytical Protocols
The integrity of lipidomic data is critically dependent on pre-analytical procedures. Standardized sample collection, processing, and extraction are paramount.
Standardized Sample Collection and Pre-processing
Blood samples should be collected after an overnight fast (10-14 hours) to avoid alimentary hyperlipemia [35]. Using consistent collection tubes (e.g., EDTA plasma) is recommended, as calcium-chelating anticoagulants can prevent calcium-dependent lipid degradation ex vivo [35].
- Plasma Separation: Centrifuge blood at 3,000 rpm for 10 minutes at room temperature [10].
- Aliquoting and Storage: Immediately aliquot the upper plasma layer (e.g., 0.2 mL) into cryotubes and store at -80°C. Avoid multiple freeze-thaw cycles, as they can significantly alter the concentrations of various lipid metabolites [35] [36].
Lipid Extraction Methodologies
The choice of extraction method impacts lipid recovery and profile. The MTBE-based method is widely used for its efficiency and safety.
Table 3: Comparison of Common Lipid Extraction Protocols
| Method | Principle | Procedure Summary | Advantages & Limitations |
|---|---|---|---|
| MTBE Extraction [10] [36] | Liquid-Liquid Extraction | 1. Mix 100 μL plasma with 200 μL water.2. Add 240 μL pre-cooled methanol, then 800 μL MTBE.3. Sonicate (low-temperature bath, 20 min), stand (room temp, 30 min).4. Centrifuge (14,000 g, 15 min, 10°C).5. Collect upper organic phase and dry under nitrogen. | Advantages: Higher yield for glycerophospholipids and ceramides; less toxic than chloroform; organic phase is top layer, easier collection.Limitations: Lower efficiency for saturated fatty acids and plasmalogens vs. chloroform. |
| Chloroform (Folch/Bligh & Dyer) [36] | Liquid-Liquid Extraction | 1. Use ternary mixture of chloroform/methanol/water (e.g., 2:1:0.8).2. Centrifuge to separate phases.3. Collect lower chloroform-rich organic phase. | Advantages: High efficiency for saturated FAs and plasmalogens; well-established history.Limitations: Chloroform is more hazardous; organic phase is bottom layer, making collection less convenient. |
| One-Step Protein Precipitation [36] | Protein Denaturation & Solubilization | 1. Add organic solvent (e.g., IPA:chloroform 9:1) to plasma.2. Vortex and centrifuge to pellet proteins.3. Analyze supernatant. | Advantages: Fast, robust, high efficiency for polar lipids (LPC, S1P, bile acids).Limitations: Extracts more non-lipid compounds, increasing ion suppression and instrument contamination. |
Ultra-High Performance Liquid Chromatography-Tandem Mass Spectrometry (UHPLC-MS/MS) Analysis
For instrumental analysis, UHPLC-MS/MS is the benchmark for untargeted lipidomics.
- Chromatography:
- Mass Spectrometry:
- Ionization: Electrospray Ionization (ESI) in both positive and negative modes.
- Mass Analyzer: High-resolution mass analyzer (e.g., Q-TOF) for accurate mass determination.
- Data Acquisition: Data-Dependent Acquisition (DDA) or Parallel Reaction Monitoring (PRM) to obtain MS/MS spectra for lipid identification.
The following workflow diagram summarizes the key steps from cohort selection to data acquisition:
Quality Control and Data Annotation Standards
Implementing a rigorous QC framework is non-negotiable for generating high-quality, reproducible lipidomics data at cohort scale.
Implementing a Cross-Batch QC Monitoring Design
For cohort studies, "pass/fail" per sample is insufficient. A cross-batch monitoring design is essential to detect and correct for technical variance [37]. Key metrics include:
- QC Pool: Create a pooled quality control sample from an aliquot of all samples and inject it repeatedly throughout the acquisition sequence to monitor instrument stability.
- Monitoring Metrics: Track retention time drift, peak intensity, peak width, and mass accuracy over the entire sequence.
- Batch Effects: Use Principal Component Analysis (PCA) on QC metrics colored by batch/plate to identify operational drift [37].
Lipid Identification and Scoring System
Confident lipid annotation requires more than accurate mass. The proposed lipidomics scoring system awards points for layers of analytical evidence [38].
Table 4: Lipidomics Scoring System for Data Quality Assessment [38]
| Evidence Level | Analytical Technology | Structural Information Gained | Points Awarded |
|---|---|---|---|
| Level 1 (L1) | MS1 (High-Res Mass), Chromatography (RT), Ion Mobility (CCS) | Lipid class & sum composition; confirms fit with retention time model (e.g., ECN). | Base points for each valid data type. |
| Level 2 (L2) | MS/MS (Low-Energy CID) | Lipid class-specific fragments (LCF) and molecular lipid species-specific fragments (MLF) for fatty acyl chains. | Points for LCF and for each MLF identified. |
| Level 3 (L3) | Advanced MS/MS (OzID, UVPD, etc.), Chromatography | Double bond position, functional groups, and their location. | High points for specific structural data. |
| Level 4 (L4) | Chiral Chromatography | Stereochemical details (e.g., sn-positions). | Highest points for full stereochemistry. |
This scoring system helps non-experts judge data quality and reduces false-positive annotations, which are common when relying solely on software-based matching without manual validation [39]. Adherence to the equivalent carbon number (ECN) model in reversed-phase chromatography is a crucial check for annotation validity [39].
The Scientist's Toolkit
Table 5: Essential Research Reagent Solutions for Lipidomics Studies
| Item | Function/Application | Example/Note |
|---|---|---|
| MTBE (Methyl tert-butyl ether) | Primary solvent for liquid-liquid lipid extraction; less toxic alternative to chloroform [10] [36]. | Enriches lipids in the upper organic phase for easier collection. |
| Ammonium Formate | Mobile phase additive for LC-MS; improves ionization efficiency and adduct formation consistency [10]. | Used in 10 mM concentration in acetonitrile and isopropanol. |
| Internal Standards (IS) | Correct for variability in extraction, ionization, and analysis; quantify lipid species [35]. | Stable isotope-labeled lipids for each major lipid class (e.g., PC(13:0/13:0), TG(17:0/17:0/17:0)). |
| Antioxidants (e.g., BHT) | Added during extraction to prevent oxidation of unsaturated lipids, especially critical for oxylipins [35]. | Butylated Hydroxytoluene (BHT) is commonly used. |
| Protease Inhibitor Cocktails | Stabilize proteinaceous hormones in serum/plasma when also measuring obesity-associated hormones [35]. | Prevents degradation of analytes like leptin and adiponectin. |
Discussion and Concluding Remarks
The distinct lipidomic profiles observed between DH and DM patients, characterized by significant upregulation of specific triglycerides (TGs), phosphatidylethanolamines (PEs), and phosphatidylcholines (PCs), highlight the profound metabolic perturbation caused by hyperuricemia in diabetes [10]. These alterations are enriched in glycerophospholipid and glycerolipid metabolism pathways, offering potential mechanistic insights and biomarker candidates.
Success in this complex research area hinges on a meticulously designed study. Key takeaways include:
- Cohort Rigor: Precise phenotyping and matching are crucial to isolate the effect of hyperuricemia from other metabolic confounders.
- Protocol Standardization: Adherence to standardized, validated protocols for sample preparation—from blood draw to lipid extraction—is the foundation of data integrity.
- QC Integration: A comprehensive QC strategy, including a pooled QC and a lipid annotation scoring system, is essential for generating reliable, reproducible, and high-confidence lipid identifications.
By adhering to these detailed considerations in cohort selection, sample preparation, and quality control, researchers can ensure their lipidomic comparisons of diabetes with and without hyperuricemia yield robust, biologically significant, and clinically actionable results.
The following tables synthesize key experimental findings from lipidomic studies comparing diabetes mellitus (DM), diabetes mellitus combined with hyperuricemia (DH), and healthy controls.
Table 1: Summary of Differential Lipid Metabolites Identified in Comparative Studies
| Comparison Group | Total Significant Lipids | Key Upregulated Lipid Classes (Examples) | Key Downregulated Lipid Classes (Examples) | Citation |
|---|---|---|---|---|
| DH vs. Healthy Controls | 31 | 13 Triglycerides (e.g., TG (16:0/18:1/18:2)), 10 Phosphatidylethanolamines (e.g., PE (18:0/20:4)), 7 Phosphatidylcholines (e.g., PC (36:1)) | 1 Phosphatidylinositol | [3] |
| DH vs. DM | 12 | Lipids predominantly from Glycerophospholipid and Glycerolipid pathways | Not Specified | [3] |
| Hyperuricemia (HUA) vs. Healthy | 33 | Various lipid metabolites involved in Arachidonic acid, Glycerophospholipid, and Linoleic acid metabolism | Not Specified | [40] |
| T2DM/NAFPD vs. Healthy | 60 | Not Specified | Plasmalogens (Plasmenylcholine, pPC; Plasmenylethanolamine, pPE) | [41] |
Table 2: Significantly Perturbed Metabolic Pathways in Disease States
| Disease State | Enriched Metabolic Pathways | Key Associated Molecules/Immune Factors | Citation |
|---|---|---|---|
| Diabetes with Hyperuricemia (DH) | Glycerophospholipid metabolism (Impact: 0.199), Glycerolipid metabolism (Impact: 0.014) | N/A | [3] |
| Hyperuricemia (HUA) | Arachidonic acid metabolism, Glycerophospholipid metabolism, Linoleic acid metabolism, GPI-anchor biosynthesis, Alpha-Linolenic acid metabolism | IL-10, CPT1, IL-6, SEP1, TGF-β1, Glu, TNF-α, LD | [40] |
| T2DM/NAFPD | Lipid metabolism, Molecular transport, Carbohydrate metabolism, Small molecule biochemistry | Increased 4-hydroxynonenal (indicating oxidative stress) | [41] |
Experimental Protocols for Lipidomics Analysis
Sample Preparation and Lipid Extraction
A standardized protocol for plasma/serum sample preparation is critical for reproducibility [3] [40] [42].
- Sample Collection: Collect fasting venous blood (e.g., 5 mL) into tubes containing anticoagulants like sodium heparin. Centrifuge at 3,000 rpm for 10 minutes at room temperature to separate plasma/serum. Aliquot and store at -80°C until analysis [3] [40].
- Lipid Extraction (MTBE Method):
- Thaw samples on ice and vortex.
- Pipette 100 μL of plasma into a 1.5 mL centrifuge tube.
- Add 200 μL of 4°C water and vortex.
- Add 240 μL of pre-cooled methanol and vortex.
- Add 800 μL of methyl tert-butyl ether (MTBE) and vortex.
- Sonicate in a low-temperature water bath for 20 minutes.
- Let the mixture stand at room temperature for 30 minutes.
- Centrifuge at 14,000 g for 15 minutes at 10°C to separate phases.
- Collect the upper organic phase and dry under a gentle nitrogen stream.
- Reconstitute the dried lipids in 200 μL of 90% isopropanol/acetonitrile for mass spectrometry analysis [3] [40].
- Quality Control (QC): Create a pooled QC sample by combining a small aliquot from every sample. QC samples are injected at the beginning of the run for column conditioning, after every batch of experimental samples, and at the end of the run to monitor instrument stability and reproducibility [42].
UHPLC-MS/MS Analysis
Liquid chromatography-mass spectrometry conditions are optimized to separate and detect a wide range of lipid species.
- Chromatographic Conditions:
- Column: Waters ACQUITY UPLC BEH C18 column (2.1 mm x 100 mm, 1.7 μm particle size) or similar [3] [42].
- Mobile Phase:
- Gradient: Typically, starts at a low percentage of B (e.g., 30%), increases to 100% B over 20-25 minutes, and is then re-equilibrated [40].
- Flow Rate, Temperature: 300 μL/min flow rate and 45°C column temperature are commonly used [40].
- Mass Spectrometry Conditions:
- Ionization: Heated electrospray ionization (HESI) in both positive and negative ion modes [40].
- Parameters (Positive Mode): Sheath gas flow: 45 arb, Aux gas flow: 15 arb, Spray voltage: 3.0 kV, Capillary temperature: 350°C, Heater temperature: 300°C [40].
- Scanning: Full MS scan (e.g., m/z 200-1800) followed by data-dependent MS/MS scans (dd-MS2) for lipid identification [40] [42].
Data Processing and Multivariate Statistical Analysis
The raw data processing and analysis workflow can be visualized below.
Workflow Steps:
- Data Conversion: Convert raw mass spectrometer files into an open format (e.g., mzXML) using tools like ProteoWizard for cross-platform compatibility [42].
- Data Pre-processing: This includes peak detection, alignment across samples, and retention time correction. Software like XCMS is widely used for these steps. Data is often log-transformed and mean-centered to meet the assumptions of multivariate models [43] [42].
- Multivariate Analysis:
- Principal Component Analysis (PCA): An unsupervised method used to explore the natural clustering of samples and identify major sources of variance and potential outliers [3] [43].
- Orthogonal Partial Least Squares-Discriminant Analysis (OPLS-DA): A supervised method that maximizes the separation between predefined sample groups (e.g., DH vs. DM). It helps identify the lipid features that contribute most to this separation [3] [44]. The validity of the OPLS-DA model should be checked using permutation tests.
- Univariate Analysis: Supplement multivariate methods with statistical tests like Student's t-test to identify individual lipids with significant concentration changes between groups, often expressed with p-values and fold-change [3] [43].
Pathway Enrichment Analysis
Enrichment analysis helps translate a list of significant lipids into meaningful biology by identifying overrepresented pathways.
Analysis Steps:
- Lipid Annotation and Feature Labeling: Annotate significant lipids with attributes such as lipid class (e.g., PC, PE, TG), total fatty acid chain length, and number of double bonds [45].
- Enrichment Analysis: Use statistical tests like Fisher's exact test to determine if certain lipid classes or pathways are overrepresented in the list of significant lipids compared to what would be expected by chance. Tools like MetaboAnalyst 5.0 and BioPAN on the LIPID MAPS platform are commonly used for this purpose [3] [46] [45].
- Biological Interpretation: The output is a list of significantly enriched metabolic pathways (e.g., Glycerophospholipid metabolism) often presented with an impact value, which helps prioritize pathways for further biological investigation [3] [45].
The Scientist's Toolkit: Essential Reagents and Software
Table 3: Key Research Reagent Solutions and Analytical Tools
| Category / Item | Specific Example / Tool Name | Function / Application | Citation |
|---|---|---|---|
| Chromatography | Waters ACQUITY UPLC BEH C18 Column | High-resolution separation of complex lipid mixtures prior to MS detection. | [3] [42] |
| Lipid Extraction | Methyl-tert-butyl ether (MTBE) | Organic solvent for liquid-liquid extraction, efficiently partitioning lipids into an organic phase. | [3] [40] |
| Internal Standards | Isotope-labeled lipid standards (e.g., ^13^C, ^2^H) | Normalization for extraction efficiency, instrument variability, and quantification. | [42] |
| Data Processing | XCMS (R Bioconductor package) | Peak picking, alignment, and retention time correction for LC-MS data. | [42] |
| Multivariate Statistics | mixOmics (R Bioconductor package) | Performing PCA, OPLS-DA, and other multivariate analyses. | [42] |
| Pathway Analysis | MetaboAnalyst 5.0, BioPAN (LIPID MAPS) | Identifying overrepresented metabolic pathways from significant lipid lists. | [3] [46] |
| Lipid Annotation & DB | LIPID MAPS Database, LipidSearch | Reference databases for lipid structures, nomenclature, and MS/MS spectra. | [46] [47] |
The escalating global prevalence of metabolic diseases, particularly diabetes mellitus (DM) and hyperuricemia, presents a critical challenge for healthcare systems worldwide. With approximately 10.5% of the global population affected by diabetes and hyperuricemia prevalence reaching 17.7% in China, the co-occurrence of these conditions represents a distinct clinical phenotype with accelerated metabolic complications [10] [14]. Lipid metabolism sits at the crossroads of these pathological processes, yet conventional lipid panels capture only a fraction of the lipidomic landscape, potentially missing crucial biomarkers for patient stratification [10] [48]. This guide objectively compares the lipidomic profiles of patients with diabetes complicated by hyperuricemia (DH) against those with diabetes alone (DM), synthesizing experimental data to construct predictive lipid panels that can enhance risk stratification and targeted therapeutic interventions.
Comparative Lipidomic Profiles: Diabetes with Hyperuricemia vs. Diabetes Alone
Lipid Class Alterations
Advanced lipidomic profiling using UHPLC-MS/MS technology has revealed profound differences in lipid metabolism between DH and DM patients. A comprehensive analysis identifying 1,361 lipid molecules across 30 subclasses demonstrated significant disruptions in patients with combined metabolic disease [10].
Table 1: Differential Lipid Molecules in DH vs. DM and Healthy Controls
| Lipid Category | Specific Lipid Molecules | Regulation in DH | Functional Implications |
|---|---|---|---|
| Triglycerides (TGs) | TG(16:0/18:1/18:2) and 12 other TGs | Significantly upregulated | Associated with insulin resistance and cardiovascular risk |
| Phosphatidylethanolamines (PEs) | PE(18:0/20:4) and 9 other PEs | Significantly upregulated | Membrane fluidity and signaling disruptions |
| Phosphatidylcholines (PCs) | PC(36:1) and 6 other PCs | Significantly upregulated | Altered membrane composition and signaling |
| Phosphatidylinositol (PI) | Not specified | Significantly downregulated | Potential impact on intracellular signaling |
Multivariate analyses including principal component analysis (PCA) and orthogonal partial least squares discriminant analysis (OPLS-DA) confirmed a significant separation trend among the DH, DM, and normal glucose tolerance (NGT) groups, validating distinct lipidomic signatures [10]. The DH group exhibited 31 significantly altered lipid metabolites compared to NGT controls, with triglycerides (TGs), phosphatidylethanolamines (PEs), and phosphatidylcholines (PCs) demonstrating the most pronounced upregulation [10].
Metabolic Pathway Analysis
Pathway enrichment analysis of the differential lipid molecules reveals the core metabolic disruptions in the DH group. The collective analysis of these metabolite groups revealed their enrichment in six major metabolic pathways, with glycerophospholipid metabolism (impact value: 0.199) and glycerolipid metabolism (impact value: 0.014) identified as the most significantly perturbed pathways in DH patients [10]. The comparison of DH versus DM groups identified 12 differential lipids that were also predominantly enriched in these same core pathways, underscoring their central role in the pathophysiology of hyperuricemia complicating diabetes [10].
Experimental Protocols and Methodologies
UHPLC-MS/MS-Based Untargeted Lipidomics
The comprehensive lipidomic profiling discussed herein was conducted using standardized protocols that can be replicated for validation studies [10].
Study Population Specifications: The research employed a matched case-control design with 17 participants each in the DH, DM, and healthy control groups. Participants were permanent residents aged 18 years and above, with DH and DM diagnoses confirmed according to American Diabetes Association (2018) and WHO diagnostic criteria. Hyperuricemia was defined as fasting blood uric acid levels >420 μmol/L in men and >360 μmol/L in women. Exclusion criteria included use of hypoglycemic agents, drugs affecting uric acid metabolism, gout, primary kidney disease, renal insufficiency, leukemia, tumors, and psychiatric conditions [10].
Sample Collection and Pre-processing: Researchers collected 5 mL of fasting morning blood followed by centrifugation at 3,000 rpm for 10 minutes at room temperature. After partitioning 0.2 mL of the upper plasma layer into centrifuge tubes, they prepared quality control samples by mixing three equal groups of samples. For lipid extraction, they combined 100 μL of plasma with 200 μL of 4°C water, added 240 μL of pre-cooled methanol, then introduced 800 μL of methyl tert-butyl ether (MTBE), followed by 20 minutes of sonication in a low-temperature water bath and 30 minutes of standing at room temperature. After centrifugation at 14,000 g for 15 minutes at 10°C, they collected the upper organic phase and dried it under nitrogen [10].
Test Conditions: The analysis utilized a Waters ACQUITY UPLC BEH C18 column (2.1 mm i.d. × 100 mm length, 1.7 μm particle size) with a mobile phase consisting of A: 10 mM ammonium formate acetonitrile solution in water and B: 10 mM ammonium formate acetonitrile isopropanol solution [10].
Integrated Risk Assessment Models
Beyond lipidomic profiling, researchers have developed composite indices that integrate lipid parameters with other metabolic markers for improved risk stratification.
Renal-Metabolic Risk Score (RMRS): This scoring system was developed to identify patients with uncontrolled T2DM at risk for combined hyperuricemia and dyslipidemia. The RMRS calculates from standardized values of urea, TG/HDL ratio, and eGFR, with variable weights derived from logistic regression coefficients, normalized to a 0-100 scale. The score demonstrated good discrimination (AUC: 0.78) in identifying co-occurrence of dyslipidemia and hyperuricemia, with prevalence monotonically increasing from 64.5% in Q1 to 96.1% in Q4 [14].
Uric Acid to HDL Cholesterol Ratio (UHR): Calculated as UHR = UA (mg/dL)/HDL (mg/dL), this composite indicator captures both oxidative stress and metabolic dysfunction. Research involving 2,731 participants revealed that a one-unit rise in the log2-transformed UHR led to a 0.53 increase in abdominal aortic calcification (AAC) scores and a 43% higher risk of AAC. Diabetes mediated 7.5% of the association between UHR and AAC scores, highlighting the interrelationship between glucose metabolism, lipid parameters, and vascular complications [49].
Triglyceride-Glucose (TyG) Index: Calculated as ln[triglycerides (mg/dL) × fasting plasma glucose (mg/dL)/2], this index serves as a reliable surrogate marker of insulin resistance. A dose-response meta-analysis of 26 trials with 637,954 subjects revealed that the TyG index was significantly associated with hyperuricemia (OR = 2.67; 95% CI: 2.34, 3.04; p < 0.001). Each 1 mg/dL rise in the TyG index increased the risk of hyperuricemia diagnosis by 2.07 times (OR = 2.07; 95% CI: 1.89, 2.25; p < 0.001) [50].
Visualization of Lipidomic Pathways and Workflows
Experimental Workflow for Lipidomic Analysis
Perturbed Metabolic Pathways in Diabetes with Hyperuricemia
The Scientist's Toolkit: Essential Research Reagents and Materials
Table 2: Essential Research Reagents for Lipidomic Profiling
| Research Reagent | Function/Application | Specifications |
|---|---|---|
| UHPLC-MS/MS System | High-resolution lipid separation and detection | Waters ACQUITY UPLC BEH C18 column (2.1 mm × 100 mm, 1.7 μm) |
| Methyl tert-butyl ether (MTBE) | Lipid extraction solvent | Pre-cooled for optimized extraction efficiency |
| Ammonium formate | Mobile phase additive for chromatographic separation | 10 mM concentration in acetonitrile/water and acetonitrile/isopropanol |
| Methanol | Protein precipitation and lipid extraction | Pre-cooled to 4°C for sample preparation |
| Quality Control Samples | Method validation and quality assurance | Pooled plasma samples from each study group |
| NMR Spectroscopy | Advanced lipoprotein particle analysis | Quantifies lipoprotein subclasses and particle sizes |
| Vertical Auto Profile (VAP) | Apolipoprotein measurement | Alternative method for apo B and apo A-I quantification |
Discussion and Clinical Translation
The comparative lipidomic data presented herein demonstrates the substantial added value of advanced lipid profiling over conventional lipid panels for stratifying diabetic patients with hyperuricemia. The distinct lipid signatures, particularly the upregulation of specific triglycerides, phosphatidylethanolamines, and phosphatidylcholines, provide a molecular rationale for the accelerated cardiovascular and renal complications observed in this patient population [10].
The integration of these lipidomic markers with composite clinical indices such as RMRS, UHR, and TyG index offers a multidimensional approach to risk stratification that may enhance early intervention strategies [14] [49] [50]. The RMRS, relying on inexpensive, routine laboratory parameters, may be particularly useful in resource-limited settings to support early risk stratification, dietary counseling, and timely referral [14].
Despite these promising developments, challenges remain in the widespread clinical adoption of advanced lipid testing. The lack of international standards for lipoprotein subclass composition assessment and significant variability between measurement methods (NMR, VAP, immunoassays) presents hurdles for standardized implementation across clinical laboratories [51]. Furthermore, the transition from research findings to approved lipid-based diagnostic tools remains in its infancy due to insufficient multi-center validation studies and incomplete regulatory frameworks for lipidomic biomarkers [52].
Future directions should focus on validating these lipid panels in larger, diverse cohorts and establishing standardized protocols for clinical implementation. The integration of artificial intelligence and machine learning approaches, such as MS2Lipid which has demonstrated up to 97.4% accuracy in predicting lipid subclasses, may further enhance the predictive power of these lipidomic signatures [52]. As the field progresses, these advanced lipid panels hold significant promise for enabling personalized therapeutic approaches tailored to the specific metabolic disruptions of individual patients.
The management of hyperuricemia, characterized by elevated serum uric acid (SUA) levels, has traditionally focused on preventing and treating gout. However, emerging research reveals a more complex metabolic role for urate-lowering therapy (ULT), particularly in correcting associated lipid imbalances. This interaction is especially relevant in patients with comorbid conditions such as chronic kidney disease (CKD) and diabetes mellitus, where dyslipidemia and hyperuricemia frequently co-exist, amplifying renal and cardiovascular risk [53] [14]. The intricate relationship between these metabolic pathways suggests that ULT may exert pleiotropic effects beyond urate reduction, potentially modulating lipid metabolism through multiple mechanisms.
Understanding this metabolic crosstalk is crucial for researchers and drug development professionals seeking to develop targeted therapies for metabolic syndrome. This review synthesizes current evidence on how ULT, primarily xanthine oxidase inhibitors like allopurinol and febuxostat, corrects lipid imbalances, with a specific focus on lipidomic profiles in diabetes with hyperuricemia compared to diabetes alone.
Clinical Evidence: ULT's Impact on Lipid Parameters
Lipid Improvements in Chronic Kidney Disease
A recent multicenter, prospective observational cohort study provides compelling clinical evidence for ULT's lipid-modifying effects. The study enrolled 200 patients with stages 3/4 CKD, dividing them into ULT (n=94, receiving febuxostat or allopurinol) and non-ULT (n=106) groups. After 12 months of observation, significant improvements in lipid profiles were documented in the ULT group compared to controls [53].
Table 1: Lipid Profile Changes After 12 Months of ULT in CKD Patients
| Lipid Parameter | ULT Group (mmol/L) | Non-ULT Group (mmol/L) | Mean Difference [95% CI] | P-value |
|---|---|---|---|---|
| LDL-c | 2.14 ± 0.32 | 2.42 ± 0.32 | -0.28 [-0.36 to -0.18] | <0.001 |
| Total Cholesterol | 4.18 ± 0.44 | 4.47 ± 0.39 | -0.28 [-0.40 to -0.16] | <0.001 |
| Triglycerides | 2.43 ± 0.62 | 2.63 ± 0.58 | -0.20 [-0.37 to -0.03] | 0.016 |
| HDL-c | 1.41 ± 0.13 | 1.23 ± 0.15 | +0.18 [0.13 to 0.21] | <0.001 |
The study further identified sex-specific variations in ULT response, with males exhibiting a more pronounced reduction in LDL-c (-0.28 mmol/L) and a greater increase in HDL-c levels (+0.23 mmol/L) [53]. Correlation analyses revealed significant relationships between SUA reduction and lipid improvements, with post-treatment LDL-c (R=0.2942, P<0.0040) and HDL-c (R=-0.3935, P<0.0001) showing statistically significant correlations with SUA levels [53]. These findings suggest potential interactions between SUA and lipid metabolism, highlighting ULT's possible role in managing dyslipidemia in pre-dialysis CKD patients.
Lipidomic Distinctions in Diabetes with Hyperuricemia
Advanced lipidomic technologies have enabled deeper characterization of lipid disturbances in metabolic diseases. An untargeted lipidomic analysis compared plasma samples from patients with diabetes mellitus combined with hyperuricemia (DH), diabetes mellitus alone (DM), and healthy controls (NGT) using ultra-high performance liquid chromatography-tandem mass spectrometry (UHPLC-MS/MS) [10].
This research identified 1,361 lipid molecules across 30 subclasses. Multivariate analyses revealed significant separation among the DH, DM, and NGT groups, confirming distinct lipidomic profiles. Compared to NGT controls, the DH group showed 31 significantly altered lipid metabolites: 13 triglycerides (TGs), 10 phosphatidylethanolamines (PEs), and 7 phosphatidylcholines (PCs) were significantly upregulated, while one phosphatidylinositol (PI) was downregulated [10].
Table 2: Significantly Altered Lipid Classes in Diabetes with Hyperuricemia vs. Controls
| Lipid Class | Examples of Significantly Altered Molecules | Regulation in DH | Biological Relevance |
|---|---|---|---|
| Triglycerides (TGs) | TG(16:0/18:1/18:2) | Upregulated | Energy storage, cardiovascular risk |
| Phosphatidylethanolamines (PEs) | PE(18:0/20:4) | Upregulated | Membrane structure, cellular signaling |
| Phosphatidylcholines (PCs) | PC(36:1) | Upregulated | Membrane integrity, lipid transport |
| Phosphatidylinositol (PI) | Not specified | Downregulated | Cell signaling, membrane trafficking |
Pathway analysis revealed that these differential lipids were predominantly enriched in glycerophospholipid metabolism (impact value: 0.199) and glycerolipid metabolism (impact value: 0.014) [10]. The same core pathways were identified when comparing DH versus DM groups, underscoring their central role in the pathophysiology of hyperuricemia complicating diabetes.
Experimental Models and Mechanistic Insights
Animal Models of Combined Metabolic Disturbance
To investigate the effects of high uric acid on glucolipid metabolism, renal injury, and gut microbiota, researchers developed a novel diabetic hamster model with hyperuricemia and dyslipidemia. The model was established by combining potassium oxonate (PO) treatment with a high-fat/cholesterol diet (HFCD) in diabetic hamsters [5].
After 4 weeks, the combined intervention (DHFU group) resulted in synergistic effects, significantly increasing serum uric acid (499.5 ± 61.96 μmol/L), glucose (16.88 ± 2.81 mmol/L), triglycerides (119.88 ± 27.14 mmol/L), and total cholesterol (72.92 ± 16.62 mmol/L) compared to control groups. The combined treatment also significantly elevated liver xanthine oxidase activity, plasminogen activator inhibitor-1, and transforming growth factor-β expressions [5].
Histological analysis revealed glomerular mesangial cells and matrix proliferation, protein casts, and urate deposition in the kidney. High uric acid was closely associated with decreased antioxidant capacity and reduced renal vascular endothelial growth factor expression. Additionally, significant disruptions in gut microbiota were observed, including increased acetic acid content, decreased butyric, propanoic, and isobutyric acid levels, and altered Firmicutes to Bacteroidetes ratios [5].
Lipidomic Signatures in Hyperuricemia and Gout
A comprehensive targeted lipidomic analysis of plasma samples from 94 asymptomatic hyperuricemia patients, 196 gout patients, and 53 normouricemic controls provided further mechanistic insights. The analysis semi-quantified 608 lipid species, revealing that both hyperuricemia and gout patients showed alterations in lipid profiles, with the most significant upregulation of phosphatidylethanolamines and downregulation of lysophosphatidylcholine plasmalogens/plasmanyls [11].
More profound lipidomic changes were observed in early-onset patients (age ≤40 years), and ULT appeared to correct this lipid imbalance. Multivariate statistics successfully differentiated early-onset hyperuricemia and gout groups from healthy controls with >95% accuracy, suggesting lipidomic profiles could serve as discriminatory biomarkers [11].
Methodological Framework: Experimental Protocols for Lipidomic Analysis
Untargeted Lipidomics Workflow
The following dot language diagram illustrates the comprehensive workflow for UHPLC-MS/MS-based plasma untargeted lipidomic analysis, as employed in the diabetes-hyperuricemia study [10]:
Experimental Workflow for Lipidomic Analysis
Sample Preparation Protocol
The sample preparation methodology followed these critical steps [10]:
- Plasma Separation: Collected 5 mL of fasting morning blood followed by centrifugation at 3,000 rpm for 10 minutes at room temperature
- Aliquoting: Transferred 0.2 mL of upper plasma layer to 1.5 mL centrifuge tubes
- Quality Control Preparation: Created three equal groups of quality control samples by pooling aliquots
- Storage: Maintained samples at -80°C until analysis
- Lipid Extraction: Thawed samples on ice, vortexed, then combined 100 μL plasma with 200 μL of 4°C water
- Precipitation: Added 240 μL of pre-cooled methanol after mixing
- Liquid-Liquid Extraction: Added 800 μL methyl tert-butyl ether (MTBE), followed by 20 minutes of sonication in a low-temperature water bath and 30 minutes standing at room temperature
- Centrifugation: Performed at 14,000 g for 15 minutes at 10°C
- Concentration: Collected upper organic phase and dried under nitrogen stream
- Reconstitution: Repeated extraction with 100 μL isopropanol for analysis
Instrumental Analysis Conditions
The UHPLC-MS/MS analysis employed these optimized parameters [10]:
- Chromatography System: Ultra-high performance liquid chromatography (UHPLC) system
- Column: Waters ACQUITY UPLC BEH C18 (2.1 mm i.d. × 100 mm length, 1.7 μm particle size)
- Mobile Phase A: 10 mM ammonium formate acetonitrile solution in water
- Mobile Phase B: 10 mM ammonium formate acetonitrile isopropanol solution
- Data Acquisition: Comprehensive lipid profiling across 1,361 lipid molecules spanning 30 subclasses
Targeted Lipidomics Approach
An alternative targeted lipidomic methodology was employed in the hyperuricemia and gout study, with the following key characteristics [11]:
- Sample Extraction: Simple monophasic extraction with isopropanol containing internal deuterated standards
- LC Separation: ExionLC System using reversed-phase BEH C8 column (2.1 mm, 100 mm, 1.7 μm)
- Mass Spectrometry: QTRAP 6500+ mass spectrometer
- Data Processing: Semi-quantitative analysis of 608 lipid species using Analyst software (version 1.6.2)
Pathway Analysis and Molecular Mechanisms
Metabolic Pathways Implicated in ULT-Lipid Interplay
The following dot language diagram illustrates the key metabolic pathways and proposed mechanisms through which ULT corrects lipid imbalances:
Proposed Mechanisms of ULT on Lipid Metabolism
Pathway analysis of differential lipid molecules in diabetes with hyperuricemia identified two central metabolic pathways significantly perturbed [10]:
- Glycerophospholipid Metabolism (Impact value: 0.199): This pathway represents the most significantly altered metabolic route, involving structural phospholipids that maintain membrane integrity and serve as signaling precursors.
- Glycerolipid Metabolism (Impact value: 0.014): This pathway encompasses triglycerides and diglycerides, crucial for energy storage and lipid signaling.
The identification of these specific pathways provides mechanistic insights into how hyperuricemia disrupts lipid homeostasis and suggests potential targets through which ULT may exert its corrective effects.
Proposed Molecular Mechanisms
Several interconnected mechanisms may explain ULT's beneficial effects on lipid metabolism:
- Oxidative Stress Reduction: Xanthine oxidase inhibitors reduce reactive oxygen species (ROS) generation from uric acid production, potentially decreasing lipid peroxidation and improving lipid metabolism [53] [5].
- SREBP-1c Modulation: Basic research suggests uric acid induces fat accumulation by stressing the endoplasmic reticulum and activating sterol regulatory element-binding protein-1c (SREBP-1c), a master regulator of lipogenic gene expression [11].
- Gut Microbiota Modulation: ULT has been shown to alter gut microbiota composition and short-chain fatty acid production, which may subsequently influence hepatic lipid synthesis [5].
- LPCAT3 Regulation: Alterations in lysophosphatidylcholine metabolism during hyperuricemia might be caused by upregulation of lysophosphatidylcholine acyltransferase 3 enzyme (LPCAT3) [11].
The Scientist's Toolkit: Essential Research Reagents and Materials
Table 3: Essential Research Reagents for Lipidomic Studies in Hyperuricemia
| Reagent/Material | Specific Example | Research Application | Function in Experimental Protocol |
|---|---|---|---|
| UHPLC System | Waters ACQUITY UPLC | Lipid separation | High-resolution chromatographic separation of complex lipid mixtures |
| Mass Spectrometer | QTRAP 6500+ | Lipid detection and quantification | Sensitive detection and semi-quantification of lipid molecules |
| Chromatography Column | BEH C18 / BEH C8 | Lipid separation | Stationary phase for reversed-phase lipid separation |
| Internal Standards | SPLASH LIPIDOMIX | Lipid quantification | Deuterated lipid standards for semi-quantitative analysis |
| Lipid Extraction Solvent | Methyl tert-butyl ether (MTBE) | Lipid extraction | Organic solvent for liquid-liquid extraction of lipids from plasma |
| Urate-Lowering Agents | Allopurinol, Febuxostat | Intervention studies | Xanthine oxidase inhibitors to investigate lipid metabolism effects |
| Hyperuricemia Inducers | Potassium oxonate | Animal models | Uricase inhibitor for establishing hyperuricemia models |
| Enzyme Activity Assays | Xanthine oxidase activity | Mechanistic studies | Quantification of target enzyme inhibition |
The accumulating evidence demonstrates that urate-lowering therapy, particularly xanthine oxidase inhibitors, exerts significant beneficial effects on lipid metabolism beyond its primary urate-lowering action. The consistent findings across clinical studies, advanced lipidomic analyses, and experimental models highlight the intricate metabolic crosstalk between purine and lipid metabolism.
From a therapeutic perspective, these findings suggest that ULT may offer dual benefits for patients with hyperuricemia and concomitant dyslipidemia, particularly those with diabetes or chronic kidney disease. The lipid-correcting effects of ULT, including reductions in atherogenic LDL-c and triglycerides and elevations in cardioprotective HDL-c, may contribute to cardiovascular risk reduction in this vulnerable population.
For drug development professionals, these insights open avenues for developing novel therapies that simultaneously target urate and lipid metabolism. The identified pathways—particularly glycerophospholipid and glycerolipid metabolism—represent promising targets for future therapeutic interventions. Furthermore, the lipidomic signatures associated with hyperuricemia may serve as valuable biomarkers for patient stratification and treatment monitoring in both clinical practice and pharmaceutical development.
Lipidomics, a specialized branch of metabolomics, has evolved significantly from its initial focus on plasma profiles to encompass a wide array of tissues and biofluids. This expansion is critical for understanding tissue-specific metabolic disruptions in complex conditions such as diabetes mellitus (DM) combined with hyperuricemia (HUA). The lipidome, comprising thousands of lipid species, exhibits remarkable spatial organization across biological systems, with each tissue maintaining a distinct lipid fingerprint that reflects its unique structural and functional requirements [54]. While plasma lipidomics offers valuable systemic insights, it cannot fully capture the nuanced metabolic alterations occurring within specific tissues. This guide provides a comparative analysis of lipidomic profiles across diverse biological matrices, detailing the experimental protocols that enable these discoveries and their profound implications for drug development and biomarker research in metabolic diseases.
Lipidomic Landscapes Across Biological Matrices
Tissue-Specific Lipid Distribution
The lipid composition of mammalian tissues is highly specialized, reflecting their distinct physiological roles. A comprehensive mass spectrometry study of seven rat tissues quantified 652 lipid molecular species across multiple categories, revealing striking tissue-specific patterns [54]:
- Glycerophospholipids constituted the most abundant lipid class across all tissues but demonstrated distinct molecular species distributions between tissues.
- Glycerolipids, particularly triacylglycerides (TGs), were predominantly concentrated in white adipose tissue (both visceral and subcutaneous), though the amount differed between these depots.
- Sphingolipids showed highest concentration in the renal cortex.
- Sterol lipids were primarily localized in liver and kidney.
- Acylcarnitines were mainly found in skeletal muscle (gluteus and soleus).
- The heart exhibited higher levels of ubiquinone compared to other tissues.
Table 1: Tissue-Specific Lipid Distribution in Rat Models
| Tissue | Predominant Lipid Classes | Key Characteristics |
|---|---|---|
| Liver & Kidney | Sterol lipids, Glycerophospholipids | High metabolic activity; diverse lipid species |
| White Adipose Tissue | Glycerolipids (TAGs) | Energy storage; depot-specific composition |
| Skeletal Muscle | Acylcarnitines, Glycerophospholipids | Lipid utilization for energy production |
| Heart | Ubiquinone, Glycerophospholipids | High energy demand; specialized lipid signature |
| Brain | Sphingolipids, Glycerophospholipids | Structural complexity; signaling lipids |
Biofluid Lipidomics Beyond Plasma
While plasma remains the most accessible biofluid for lipidomic analysis, other biofluids provide complementary insights:
- Erythrocytes: These cells offer a distinct lipid environment compared to plasma, with specialized membrane lipid composition that can reflect systemic metabolic alterations [55].
- Ocular Tissues: The retina and retinal pigment epithelium (RPE) exhibit unique lipid profiles essential for visual function. The blood-retina barrier functions similarly to the blood-brain barrier in regulating lipid transport [56] [55].
The complementary analysis of plasma and erythrocytes has proven valuable for understanding pathological processes, as demonstrated in age-related macular degeneration research [55].
Analytical Approaches for Comprehensive Lipidomics
Separation Techniques and Their Applications
The complexity of biological lipidomes requires sophisticated separation strategies prior to mass spectrometry analysis. The choice of chromatography significantly influences lipid coverage:
Table 2: Comparison of Chromatographic Techniques in Lipidomics
| Technique | Principle | Strengths | Ideal Applications |
|---|---|---|---|
| Reversed-Phase Chromatography (RPC) | Separation by hydrophobicity | Superior for non-polar lipids; sensitive detection of DG, TG, cholesterol, CE | Tissue-specific fingerprinting; energy storage lipids |
| Hydrophilic Interaction Liquid Chromatography (HILIC) | Separation by polarity | Effective separation of polar lipids; reduced coelution of phospholipids | Phospholipid profiling; membrane lipid studies |
| Direct Injection (Shotgun) | No chromatographic separation | High-throughput; simplified quantification | Large-scale screening studies; clinical applications |
Research comparing HILIC and RPC demonstrates that RPC shows greater sensitivity for hydrophobicity-based separation of diglycerides, triglycerides, cholesterol, and cholesteryl esters, while HILIC more effectively separates polar lipids like phospholipids, which often coelute in RPC [55]. This complementary nature is essential for comprehensive lipid characterization across different tissues and biofluids.
Mass Spectrometry Platforms and Data Processing
Modern lipidomics relies primarily on high-resolution mass spectrometry platforms:
- Liquid Chromatography coupled to Tandem Mass Spectrometry (LC-MS/MS): This approach combines chromatographic separation with high sensitivity detection and identification capabilities [10] [55].
- UHPLC-MS/MS: Ultra-high performance liquid chromatography systems provide enhanced resolution and sensitivity for complex lipid mixtures [10] [57].
- Orbitrap and Q-TOF Mass Analyzers: High-resolution mass spectrometers enable precise lipid identification and structural characterization [57].
Data processing pipelines involve peak alignment, peak picking, and quantification using specialized software, with subsequent matching against lipid databases such as LIPID MAPS and LipidBlast for accurate identification [57].
Experimental Workflows in Multi-Matrix Lipidomics
Sample Collection and Preparation
Standardized protocols are essential for reproducible lipidomic analysis across different matrices:
Tissue-Specific Methodological Considerations
Different tissues require specialized handling approaches:
- Brain Tissues: Regional dissection precision is critical due to the lipid heterogeneity between different brain areas [56].
- Adipose Tissue: Special considerations for high lipid content to avoid saturation effects during analysis [54].
- Blood Components: Separate processing protocols for plasma, serum, and erythrocytes to preserve their distinct lipid profiles [55].
Significantly Altered Lipid Pathways in Diabetes with Hyperuricemia
Key Metabolic Pathways
Lipidomic studies in diabetes with hyperuricemia reveal consistent alterations in specific metabolic pathways:
Research comparing diabetic patients with and without hyperuricemia has identified 31 significantly altered lipid metabolites in the combined condition (DH) compared to healthy controls [10]. These alterations included 13 triglycerides (e.g., TG 16:0/18:1/18:2), 10 phosphatidylethanolamines (e.g., PE 18:0/20:4), and 7 phosphatidylcholines (e.g., PC 36:1) that were significantly upregulated, while one phosphatidylinositol was downregulated [10]. These differential lipids were predominantly enriched in glycerophospholipid and glycerolipid metabolism pathways, underscoring their central role in the pathophysiology of hyperuricemia complicating diabetes [10].
Comparative Lipid Alterations Across Studies
Table 3: Lipid Alterations in Metabolic Diseases Across Studies
| Study Population | Key Lipid Alterations | Analytical Platform | Biological Matrix |
|---|---|---|---|
| DM with Hyperuricemia (n=17) [10] | ↑ 13 TGs, ↑ 10 PEs, ↑ 7 PCs, ↓ 1 PI | UHPLC-MS/MS | Plasma |
| Hyperuricemia & Gout (n=290) [7] | ↑ PEs, ↓ Lysophosphatidylcholine plasmalogens | Targeted LC-MS | Plasma |
| Animal Model (Hamsters) [5] | Impaired glycerolipid metabolism, antioxidant depletion | Biochemical assays | Plasma, Liver, Kidney |
| Schizophrenia (n=26) [56] | Altered phospholipids, PUFAs, sphingolipids | LC-MS/MS | Brain tissue |
The Scientist's Toolkit: Essential Research Reagents and Solutions
Table 4: Essential Research Reagents for Comprehensive Lipidomics
| Reagent/Category | Specific Examples | Application Purpose |
|---|---|---|
| Internal Standards | SPLASH LIPIDOMIX Mass Spec Standard; Ceramide (d18:1-d7/15:0); Oleic acid-d9 | Quantification accuracy; correction for extraction efficiency |
| Chromatography Solvents | LC-MS grade ACN, IPA, water, ammonium acetate | Mobile phase preparation; minimal background interference |
| Lipid Extraction Reagents | Methyl tert-butyl ether (MTBE); Methanol; Water | Lipid isolation; protein precipitation; phase separation |
| Reference Materials | NIST SRM 1950 (Metabolites in Frozen Human Plasma) | Interlaboratory standardization; method validation |
| Enzyme Inhibitors | Potassium oxonate (uricase inhibitor) | Animal modeling of hyperuricemia [5] |
The expansion of lipidomic analyses beyond plasma to include various tissues and biofluids represents a paradigm shift in metabolic disease research. The tissue-specific lipid fingerprints and consistent pathway alterations observed in conditions like diabetes with hyperuricemia provide unprecedented opportunities for targeted therapeutic interventions. The distinct lipid profiles observed in different biological matrices underscore the importance of selecting appropriate sample types based on research questions. Furthermore, the consistent identification of glycerophospholipid and glycerolipid metabolism as central pathways disrupted in diabetes with hyperuricemia offers promising targets for novel drug development. As lipidomic methodologies continue to advance, incorporating machine learning approaches for high-dimensional data analysis [57] and spatial resolution techniques [56], researchers are poised to unlock deeper insights into metabolic dysregulation, ultimately enabling more precise diagnostic strategies and targeted therapeutic interventions for complex metabolic disorders.
Navigating Analytical Challenges and Translating Lipidomic Biomarkers
In lipidomics, inter-platform reproducibility remains a significant hurdle, particularly when translating research from analytical laboratories to clinical applications. The inherent complexity of lipid structures, combined with methodological diversity across analytical platforms, creates substantial variability in lipid identification and quantification [58]. This challenge is especially pertinent in metabolic disease research, where precise lipidomic profiling can reveal crucial insights into conditions like diabetes mellitus (DM) and diabetes mellitus combined with hyperuricemia (DH) [10]. As lipidomics advances toward precision medicine, the lack of standardization impedes the validation of lipid biomarkers and their implementation in clinical settings. The lipidomics community has recognized this challenge, with leading researchers noting that methodological variation has a direct impact on the resultant lipid profiles, affecting the number, type, and quantity of lipids observed [58]. Without addressing these reproducibility issues, confidence in discovering genuine biological differences—such as those between DM and DH patients—becomes compromised.
Evidence of Variability: Key Studies Highlighting the Problem
The NIST Interlaboratory Comparison
A landmark study coordinated by the National Institute of Standards and Technology (NIST) revealed the extent of variability within the lipidomics community. In this exercise, 31 laboratories analyzed Standard Reference Material (SRM) 1950—Metabolites in Frozen Human Plasma using their respective lipidomics workflows [58]. The participating laboratories employed diverse methodologies spanning academia, industry, and core facilities. The results were telling: while a total of 1,527 unique lipids were measured across all laboratories, consensus location estimates with associated uncertainties could only be determined for 339 lipids measured at the sum composition level by five or more participating laboratories. This demonstrates that approximately 78% of reported lipids lacked sufficient cross-laboratory agreement for reliable benchmarking. The study concluded that methodological variation has a direct impact on the resultant lipid profiles, affecting the number, type, and quantity of lipids observed.
Platform Reproducibility in Biological Matrices
Further evidence comes from studies comparing lipid reproducibility across different sample types. Research investigating the inter-day reproducibility of lipid measurements in plasma and erythrocytes found significant differences between these matrices [59]. After data processing, analyses included 630 lipids in plasma and 286 in erythrocytes, with 230 lipids overlapping between sample types. The study reported that in plasma, 78% of lipid measurements were reproduced well to excellently, compared to only 37% in erythrocytes. The intraclass correlation coefficient (ICC) distribution in plasma (median ICC 0.69) was significantly better than in erythrocytes (median ICC 0.51). These findings highlight how biological matrix selection profoundly impacts measurement reproducibility, with implications for study design in diabetes-hyperuricemia research.
Table 1: Key Findings from Reproducibility Studies in Lipidomics
| Study | Sample Type | Lipids Measured | Reproducibility Findings |
|---|---|---|---|
| NIST Interlaboratory Comparison [58] | Human Plasma (SRM 1950) | 1,527 unique lipids | Consensus values for only 339 lipids (22.2%) across 31 laboratories |
| Biological Reproducibility [59] | Plasma | 630 lipids | 78% well-to-excellently reproduced; Median ICC = 0.69 |
| Biological Reproducibility [59] | Erythrocytes | 286 lipids | 37% well-to-excellently reproduced; Median ICC = 0.51 |
| Ultrasound Fat Fraction [60] | Liver tissue | NA | ICC between platforms = 0.842; CV = 29.9% |
Inter-Platform Variability in Clinical Applications
Beyond mass spectrometry platforms, reproducibility challenges extend to other lipid measurement technologies. A 2024 study evaluating ultrasound-based fat fraction examinations for hepatic steatosis found substantial inter-platform variability [60]. When comparing ultrasound-derived fat fraction (UDFF) and quantitative ultrasound-derived estimated fat fraction (USFF) platforms, researchers observed a moderate correlation (Pearson's r = 0.748) with an intraclass correlation coefficient of 0.842. The coefficient of variation (CV) was 29.9%, indicating significant measurement differences between platforms. This variability led researchers to conclude that "it is not appropriate to use ultrasound-based fat fraction values obtained from different vendors interchangeably" [60]. Such findings underscore the broader reproducibility challenges across lipid measurement technologies.
Analytical Workflow Contributions
The lipidomics workflow encompasses multiple stages where variability can be introduced, from sample preparation through data analysis. Major sources of inter-platform discrepancy include:
- Sample Preparation: Differences in extraction methodologies (e.g., liquid-liquid extraction, solid-phase extraction) and internal standard selection can significantly impact lipid recovery and quantification [58].
- Chromatographic Separation: Variations in liquid chromatography systems, column chemistry, mobile phase compositions, and gradient profiles affect lipid separation and retention times [61].
- Mass Spectrometric Analysis: Instrument-specific factors including ionization efficiency, mass resolution, mass accuracy, and fragmentation patterns contribute to platform-dependent lipid identification [58].
- Data Processing: Algorithmic differences in peak picking, lipid identification, and quantification across software platforms introduce another layer of variability [61].
Impact on Diabetes and Hyperuricemia Research
In the context of diabetes and hyperuricemia research, these methodological variations complicate the identification of genuine lipid biomarkers. A 2025 study investigating lipidomic differences between DM, DH, and healthy controls identified 1,361 lipid molecules across 30 subclasses using UHPLC-MS/MS [10]. The researchers found 31 significantly altered lipid metabolites in the DH group compared to healthy controls, with triglycerides, phosphatidylethanolamines, and phosphatidylcholines being most relevant. These differential lipids were enriched in glycerophospholipid and glycerolipid metabolism pathways. However, without standardized methodologies, comparing these findings across studies remains challenging, potentially obscuring clinically significant lipid alterations specific to the DH phenotype.
Solutions and Standardization Approaches
Reference Materials and Harmonization Efforts
The adoption of standardized reference materials represents a crucial step toward improving inter-platform agreement. The NIST SRM 1950—Metabolites in Frozen Human Plasma has been proposed as a control material for lipidomics studies to aid in standardization and quality assessment across time and laboratories [58]. This commercially available homogeneous material was constructed from 100 fasted individuals representing the average composition of the US population. Using such reference materials allows laboratories to benchmark their performance against community-wide consensus values, thereby identifying methodological biases and improving harmonization.
Advanced Computational Tools
Novel computational approaches are emerging to address annotation inconsistencies across platforms. LipidIN, an advanced framework introduced in 2025, enables flash platform-independent annotation through a comprehensive repository encompassing 168.5 million lipid fragments [61]. This tool addresses key limitations in traditional lipid annotation by:
- Incorporating a five-level hierarchical library covering precursor ions, head groups, side chains, neutral losses, and fragment fingerprints
- Implementing an expeditious querying module with speeds exceeding one hundred billion queries per second
- Utilizing relative retention time rules to reduce false positive annotations
- Integrating a Wide-spectrum Modeling Yield network for regenerating lipid fragment fingerprints
Such platform-independent approaches show promise for improving cross-laboratory agreement by providing standardized annotation frameworks.
Methodological Standardization
Consensus-based standardization of critical methodological parameters can significantly enhance reproducibility. Key considerations include:
- Standardized Extraction Protocols: Implementing community-agreed upon extraction methods for specific sample types
- Reference Standard Implementation: Using common internal standard mixtures and concentrations across laboratories
- Chromatographic Harmonization: Adopting standardized LC conditions where possible, or at least reporting detailed methodological parameters
- Data Reporting Standards: Following minimum reporting standards for lipidomics data to enhance transparency and comparability
Table 2: Essential Research Reagents and Materials for Reproducible Lipidomics
| Reagent/Material | Function in Lipidomics | Considerations for Reproducibility |
|---|---|---|
| NIST SRM 1950 [58] | Reference material for quality control | Provides community-wide benchmarks for intra- and inter-laboratory quality control |
| Internal Standard Mixtures | Quantification and quality control | Should cover multiple lipid classes; concentrations should be consistent across studies |
| MTBE/Methanol/Water [10] | Liquid-liquid extraction of lipids | Well-established extraction protocol; high recovery for diverse lipid classes |
| Ammonium Formate [10] | Mobile phase additive in LC-MS | Improves ionization efficiency; concentration affects retention times |
| P-B Reaction Reagents [61] | C=C location determination for lipid isomers | Enables deeper structural annotation; reduces isomer misidentification |
Experimental Protocols for Reproducible Lipid Identification
Sample Preparation Protocol
Based on methodologies from diabetes-hyperuricemia lipidomics research [10], a standardized sample preparation protocol should include:
- Sample Collection: Collect fasting blood samples in appropriate anticoagulant tubes and separate plasma via centrifugation at 3,000 rpm for 10 minutes at room temperature.
- Plasma Storage: Aliquot plasma (0.2 mL) and store at -80°C until analysis.
- Lipid Extraction: Employ a modified methyl tert-butyl ether (MTBE) extraction method:
- Thaw samples on ice and vortex
- Aliquot 100 μL plasma into a 1.5 mL centrifuge tube
- Add 200 μL of 4°C water and 240 μL of pre-cooled methanol
- Add 800 μL MTBE and mix
- Sonicate in a low-temperature water bath for 20 minutes
- Stand at room temperature for 30 minutes
- Centrifuge at 14,000 g for 15 minutes at 10°C
- Collect upper organic phase and dry under nitrogen
- Quality Control: Prepare pooled quality control samples from all samples and inject regularly throughout the analysis sequence.
Liquid Chromatography-Tandem Mass Spectrometry
For untargeted lipidomic analysis, as employed in diabetes-hyperuricemia studies [10], the following LC-MS/MS conditions provide comprehensive lipid coverage:
- Chromatographic System: Ultra-high performance liquid chromatography (UHPLC) system
- Column: Waters ACQUITY UPLC BEH C18 column (2.1 mm i.d. × 100 mm length, 1.7 μm particle size)
- Mobile Phase:
- A: 10 mM ammonium formate acetonitrile solution in water
- B: 10 mM ammonium formate acetonitrile isopropanol solution
- Gradient: Optimized for comprehensive lipid separation (specific gradient should be detailed in publications)
- Mass Spectrometer: High-resolution tandem mass spectrometer capable of data-dependent acquisition
- Ionization: Electrospray ionization in both positive and negative modes
- Quality Control: Include system suitability tests and reference standards in each batch
Figure 1: Experimental Workflow for Reproducible Lipidomics
A Pathway Toward Enhanced Reproducibility
Figure 2: Strategies for Improving Lipid Identification Reproducibility
Addressing low inter-platform agreement in lipid identification requires a multifaceted approach combining reference materials, standardized protocols, advanced computational tools, and community-wide cooperation. The diabetes-hyperuricemia research context highlights both the urgency of this challenge and the potential benefits of its resolution. As lipidomics continues to evolve toward clinical applications, enhancing reproducibility will be paramount for validating biomarkers and understanding pathological mechanisms. Through coordinated efforts across the lipidomics community, researchers can overcome current limitations and unlock the full potential of lipidomic profiling in metabolic disease research.
Lipidomics has emerged as a powerful tool for discovering novel biomarkers in metabolic diseases, including diabetes mellitus (DM) and diabetes combined with hyperuricemia (DH). By providing a comprehensive analysis of lipid species within a biological system, lipidomics offers unprecedented insights into metabolic pathways and disease mechanisms [62]. However, the field faces significant standardization hurdles that impede reproducibility and clinical translation. Inconsistent sample processing and a lack of defined procedures create substantial variability in lipidomic data, potentially compromising the identification of reliable biomarkers [63] [52]. These challenges are particularly problematic when studying complex conditions like DH, where precise lipidomic profiling could reveal critical insights into disease pathophysiology [10]. This guide objectively compares the impact of different methodologies on lipidomic results, providing researchers with experimental data and protocols to navigate these standardization challenges.
Experimental Evidence: Quantifying the Impact of Preanalytical Variables
The Effect of Sample Handling on Lipid Stability
Preanalytical conditions during blood collection and processing significantly impact lipid stability. A rigorous study investigated the stability of 417 lipid species in EDTA whole blood exposed to different temperatures over 24 hours [64]. The results demonstrated that improper sample handling substantially alters lipid profiles.
Table 1: Lipid Stability Under Different Preanalytical Conditions
| Condition | Lipid Species Stable after 24h | Most Vulnerable Lipid Classes | Key Recommendations |
|---|---|---|---|
| 4°C (Refrigerated) | 325 | Fatty Acyls (FA), Lysophosphatidylethanolamines (LPE), Lysophosphatidylcholines (LPC) | Cool whole blood immediately and permanently [64] |
| 21°C (Room Temperature) | 325 | Fatty Acyls (FA), Lysophosphatidylethanolamines (LPE), Lysophosphatidylcholines (LPC) | Separate plasma within 4 hours for comprehensive profiling [64] |
| 30°C (Elevated Temperature) | 288 | Fatty Acyls (FA), Lysophosphatidylethanolamines (LPE), Lysophosphatidylcholines (LPC) | Use provided stability lists to check biomarkers of interest [64] |
Inter-Platform Variability in Lipid Identification
The choice of analytical software introduces another major source of variability. A direct comparison of two popular lipidomics platforms—MS DIAL and Lipostar—processing identical LC-MS spectral data revealed strikingly low consensus [65].
Table 2: Software Agreement in Lipid Identification from Identical Spectral Data
| Analysis Type | Identification Agreement | Key Factors for Discrepancy | Recommended Solution |
|---|---|---|---|
| Default Settings (MS1) | 14.0% | Different spectral libraries, alignment algorithms, and peak processing [65] | Manual curation of software outputs is essential [65] |
| With Fragmentation Data (MS2) | 36.1% | Co-elution of lipids, precursor ion selection, and co-fragmentation [65] | Validate across positive and negative LC-MS modes [65] |
Detailed Methodologies: Protocols from Key Studies
Sample Collection and Processing for Clinical Lipidomics
The following protocol is adapted from a study investigating lipidomic profiles in diabetes and hyperuricemia, reflecting rigorous preanalytical standards [10] [64].
- Patient Preparation: Collect fasting blood samples from participants. The DH/DM study used samples from permanent residents (18+ years) matched by sex and age, with healthy controls [10].
- Blood Collection: Draw blood into EDTA tubes and aliquot immediately within 5 minutes [64].
- Centrifugation: Centrifuge at 4°C (3,100 g for 7 minutes) to separate plasma from blood cells. Adhere to a maximum processing window of 4 hours unless focusing only on known stable lipids [64].
- Plasma Storage: Aliquot plasma (e.g., 100 μL) and store at -80°C until analysis to prevent freeze-thaw artifacts [10] [64].
Lipid Extraction and Analysis
The UHPLC-MS/MS based untargeted lipidomic analysis provides a representative methodology for global lipid profiling [10] [66].
- Lipid Extraction: Use a modified MTBE/methanol extraction. Briefly, mix plasma with cold methanol containing internal standards, add MTBE, vortex, and add water to form a two-phase system. After centrifugation, collect the upper organic phase and dry under nitrogen [10] [64].
- Chromatography: Employ a Waters ACQUITY UPLC BEH C18 column (2.1 × 100 mm, 1.7 μm) with a mobile phase of (A) 10 mM ammonium formate in acetonitrile/water and (B) 10 mM ammonium formate in acetonitrile/isopropanol [10].
- Mass Spectrometry: Operate the mass spectrometer in both positive and negative ion modes. Use a data-dependent acquisition (DDA) method with a TopN setting (e.g., N=10) to fragment the most abundant ions [10] [64].
Diagram 1: Integrated lipidomics workflow highlighting critical standardization points in red.
The Scientist's Toolkit: Essential Research Reagents and Materials
Table 3: Key Reagent Solutions for Lipidomics Research
| Item | Function/Purpose | Example from Literature |
|---|---|---|
| EDTA Blood Collection Tubes | Anticoagulant for whole blood collection; standardizes initial sample state [64]. | Used in preanalytical stability studies [64]. |
| MTBE (Methyl-tert-butyl ether) | Extraction solvent in liquid-liquid extraction; high recovery of diverse lipid classes [10] [66]. | Used in MTBE/methanol/water extraction protocol [10] [64]. |
| Deuterated Internal Standards | Correct for extraction efficiency and instrument variability; enables quantification [64]. | Avanti EquiSPLASH LIPIDOMIX used for quantification [65] [64]. |
| UHPLC BEH C18 Column | Reversed-phase separation of complex lipid mixtures; standardizes chromatographic resolution [10]. | 2.1 × 100 mm, 1.7 μm particle size used for lipid separation [10]. |
| Ammonium Formate/Formic Acid | Mobile phase additives that enhance ionization efficiency in MS; critical for sensitivity [10]. | Added to mobile phases at 10 mM concentration [10]. |
The journey toward standardized, reproducible lipidomics requires careful attention to both preanalytical and analytical procedures. The experimental data presented demonstrates that consistent sample processing—controlling temperature and time before centrifugation—is as crucial as the analytical platform itself. Furthermore, researchers must acknowledge the significant variability introduced by different data processing software and implement manual curation and cross-platform validation to ensure reliable lipid identification. For studies focusing on complex metabolic conditions like diabetes with hyperuricemia, adhering to emerging guidelines from the Lipidomics Standards Initiative (LSI) provides a pathway to more comparable and clinically relevant results. By systematically addressing these standardization hurdles, the field can better realize the potential of lipidomics in biomarker discovery and therapeutic development.
The pursuit of biomarkers that can reliably distinguish between closely related metabolic states represents a cornerstone of modern precision medicine. In the context of lipidomics research for conditions like diabetes mellitus (DM) and diabetes mellitus with hyperuricemia (DH), biological variability presents a substantial challenge. This variability stems from multiple sources—biological (age, sex, genetics), clinical (comorbidities, medications), and technical (batch effects, analytical platforms)—which can obscure true biomarker signals and compromise clinical translation. Overcoming these challenges requires sophisticated methodological approaches that enhance reproducibility, robustness, and generalizability of biomarker findings. This guide compares key strategies and their performance in generating validated, clinically relevant biomarkers, with specific application to lipidomic profiling in diabetic populations with and without hyperuricemia.
The Challenge of Biological Variability in Lipidomic Studies
Biological variability manifests distinctly in lipidomic studies comparing complex metabolic conditions. Several studies highlight the intricate relationship between lipid metabolism disorders and hyperuricemia in diabetic populations. Patients with combined diabetes and hyperuricemia demonstrate significantly altered lipid metabolites compared to those with diabetes alone or healthy controls [10]. A comprehensive lipidomic analysis identified 1,361 lipid molecules across 30 subclasses, with 31 significantly altered lipid metabolites in DH patients compared to normal glucose tolerance controls [10]. These alterations primarily affected triglycerides, phosphatidylethanolamines, and phosphatidylcholines, indicating profound disruption in glycerophospholipid and glycerolipid metabolism pathways.
The co-occurrence of dyslipidemia and hyperuricemia in uncontrolled type 2 diabetes is remarkably high (81.6% in one study), creating a distinct metabolic phenotype that requires precise characterization [14]. This clinical overlap underscores the necessity for biomarkers that can accurately stratify patient populations. However, variability in lipidomic measurements introduced by batch effects, sample processing differences, and population heterogeneity complicates this task. Without appropriate statistical methods to address these sources of variability, even promising biomarker candidates may fail validation in independent cohorts.
Comparative Analysis of Biomarker Validation Strategies
The table below summarizes the performance characteristics of different biomarker validation approaches when applied to complex lipidomic studies:
Table 1: Comparison of Biomarker Validation Strategies for Lipidomic Profiling
| Validation Strategy | Key Principles | Sample Requirements | Advantages | Limitations | Suitability for Diabetes/Hyperuricemia Lipidomics |
|---|---|---|---|---|---|
| Batch-Effect Correction Methods [67] | Rank-preserving within batches; standardization using batch-specific percentiles | Multiple batches from same study; 30+ samples per batch | No assumptions about error structure; handles unknown measurement error distributions; reduces technical variability | Requires sufficient samples per batch; may not address biological variability | Moderate-High (Handles technical variability in multi-center lipidomic studies) |
| Bayesian Meta-Analysis [68] | Probabilistic estimation of effect sizes and between-study heterogeneity; BEST framework | 2-3 datasets (fewer than frequentist approaches); ~100 samples total | Robust to outliers; reduced false positives/negatives; more accurate heterogeneity estimation; requires fewer datasets | Complex implementation; computationally intensive; specialized software required | High (Excellent for integrating heterogeneous lipidomic datasets across populations) |
| Frequentist Meta-Analysis [68] | Combines effect sizes across studies; fixed/random effects models | 4-5 datasets with ~250 total samples | Established methodology; standardized software; widely accepted | Prone to outlier influence; underestimates heterogeneity; requires more datasets | Moderate (Effective but requires more resources for similar robustness) |
| Multi-Omics Integration [69] | Combines lipidomics with other data types (e.g., immune markers, clinical parameters) | Paired samples for multiple assays; larger sample sizes for correlation strength | Provides mechanistic insights; identifies regulatory networks; enhances biological context | Increased analytical complexity; higher resource requirements; integration challenges | High (Reveals connections between lipid metabolism and inflammation in hyperuricemia) |
Experimental Protocols for Robust Lipidomic Biomarker Validation
Protocol 1: UHPLC-MS/MS-Based Untargeted Lipidomics with Batch-Effect Correction
The following protocol, adapted from studies on diabetes with hyperuricemia, incorporates robust statistical methods to address biological variability [10] [67]:
Sample Preparation:
- Collect fasting blood samples and centrifuge at 3,000 rpm for 10 minutes at room temperature
- Aliquot 0.2 mL plasma into 1.5 mL centrifuge tubes
- Perform lipid extraction using methyl tert-butyl ether (MTBE) method: Mix 100 μL plasma with 200 μL 4°C water, add 240 μL pre-cooled methanol, then add 800 μL MTBE
- Sonicate in low-temperature water bath for 20 minutes, incubate at room temperature for 30 minutes
- Centrifuge at 14,000 g for 15 minutes at 10°C, collect organic phase
- Dry under nitrogen stream and reconstitute in 100 μL isopropanol for analysis
LC-MS Analysis:
- Chromatography: Waters ACQUITY UPLC BEH C18 column (2.1 × 100 mm, 1.7 μm)
- Mobile phase: (A) 10 mM ammonium formate in acetonitrile/water; (B) 10 mM ammonium formate in acetonitrile/isopropanol
- Gradient elution: 30-100% B over 25 minutes
- Mass spectrometry: Q-Exactive Plus mass spectrometer with electrospray ionization
- Quality control: Pooled quality control samples injected regularly throughout sequence
Batch-Effect Correction:
- Organize samples into batches based on processing date
- Within each batch, transform raw lipid measurements using percentile ranks (e.g., indicator if above/below batch-specific median)
- Analyze association between transformed variables and outcomes using generalized linear models
- This approach requires no assumptions about measurement error structure while maintaining valid inference [67]
Protocol 2: Bayesian Meta-Analysis for Multi-Cohort Lipidomic Validation
For integrating lipidomic data from multiple studies or centers, Bayesian meta-analysis provides enhanced robustness [68]:
Data Preparation:
- Obtain lipidomic datasets from independent cohorts (minimum 2-3 datasets recommended)
- Standardize lipid nomenclature across studies using LIPID MAPS classification
- Calculate effect sizes (e.g., Hedges' g) for each lipid in each dataset, comparing DH vs. DM groups
Bayesian Implementation:
- Apply Bayesian Estimation Supersedes the T-test (BEST) framework to estimate posterior distribution of effect size for each lipid in each dataset
- Combine distributions from independent studies using Gaussian hierarchical model
- Estimate pooled effect size and between-study heterogeneity (τ²)
- Calculate probability of lipid being upregulated or downregulated based on pooled effect size distribution
Implementation Tools:
- Utilize publicly available R package
bayesMetaIntegrator(https://github.com/Khatri-Lab/bayesMetaIntegrator) - Set minimally informative priors to avoid excessive influence on results
- Run Markov Chain Monte Carlo (MCMC) sampling with sufficient iterations (≥10,000) to ensure convergence
This approach has demonstrated superior performance in identifying generalizable biomarkers with reduced false positive and false negative rates compared to frequentist methods, particularly valuable when limited datasets are available [68].
Visualizing Biomarker Validation Workflows
The following diagram illustrates the integrated workflow for robust lipidomic biomarker validation, incorporating strategies to address biological variability:
Biomarker Validation Workflow: This integrated approach addresses biological variability at multiple stages, from sample processing to multi-cohort validation.
Key Lipid Alterations in Diabetes with Hyperuricemia
Studies comparing lipidomic profiles between diabetes alone and diabetes with hyperuricemia have identified consistent patterns of lipid disruption. The table below summarizes key lipid classes differentially regulated in this population:
Table 2: Lipid Classes Differentially Regulated in Diabetes with Hyperuricemia vs. Diabetes Alone
| Lipid Class | Regulation in DH vs. DM | Specific Examples | Metabolic Pathways | Potential Clinical Relevance |
|---|---|---|---|---|
| Triglycerides (TGs) | Significantly upregulated | TG(16:0/18:1/18:2) and 12 other TGs [10] | Glycerolipid metabolism | Associated with insulin resistance and cardiovascular risk |
| Phosphatidylethanolamines (PEs) | Significantly upregulated | PE(18:0/20:4) and 9 other PEs [10] | Glycerophospholipid metabolism | Membrane fluidity alterations; signaling precursor |
| Phosphatidylcholines (PCs) | Significantly upregulated | PC(36:1) and 6 other PCs [10] | Glycerophospholipid metabolism | Cardiovascular risk stratification |
| Lysophosphatidylcholine Plasmalogens | Downregulated | Multiple species [7] | Plasmalogen biosynthesis | Antioxidant capacity reduction; inflammatory signaling |
| Phosphatidylinositols (PIs) | Downregulated | Not specified [10] | Inositol phosphate metabolism | Cell signaling disruption |
These lipid alterations consistently point to disruption in glycerophospholipid and glycerolipid metabolism as central pathways distinguishing diabetes with hyperuricemia from diabetes alone [10] [7]. The robustness of these findings across studies highlights their potential as validated biomarkers for patient stratification.
The Scientist's Toolkit: Essential Research Reagents and Solutions
Table 3: Essential Research Reagents for Robust Lipidomic Biomarker Studies
| Reagent/Resource | Function | Application in Diabetes/Hyperuricemia Research | Considerations for Robustness |
|---|---|---|---|
| SPLASH LIPIDOMIX Mass Spec Standard [7] | Internal standard for lipid quantification | Quality control across batches; quantification accuracy | Essential for inter-laboratory reproducibility |
| MTBE (Methyl tert-butyl ether) [10] [69] | Lipid extraction solvent | Comprehensive lipid extraction from plasma/serum | Superior recovery of diverse lipid classes compared to chloroform-based methods |
| UHPLC BEH C18 Column [10] | Chromatographic separation of lipids | Resolution of complex lipid mixtures prior to MS detection | Maintains performance over hundreds of injections |
| Potassium Oxonate [5] | Uricase inhibitor for animal models | Induction of hyperuricemia in experimental models | Enables study of uric acid effects on lipid metabolism |
| bayesMetaIntegrator R Package [68] | Bayesian meta-analysis implementation | Integration of multiple lipidomic datasets | Reduces false positives compared to frequentist methods |
Overcoming biological variability in lipidomic biomarker research requires a multifaceted approach that addresses technical, analytical, and biological sources of heterogeneity. For distinguishing complex metabolic states such as diabetes with hyperuricemia versus diabetes alone, the integration of robust experimental design with advanced statistical methods is paramount. Batch-effect correction methods and Bayesian meta-analysis offer particularly powerful approaches for generating validated, generalizable biomarkers. The consistent identification of glycerophospholipid and glycerolipid metabolism disruptions across multiple studies provides a robust foundation for clinical biomarker development. By implementing these strategies, researchers can enhance the translational potential of lipidomic biomarkers, ultimately supporting improved diagnosis, stratification, and treatment of metabolic diseases.
The precise comparison of lipidomic profiles between patients with diabetes mellitus combined with hyperuricemia (DH) and those with diabetes mellitus (DM) alone represents a critical frontier in metabolic disease research. This endeavor is fraught with computational complexity due to the sheer structural diversity of lipids—over 45,000 unique structures documented in the LIPID MAPS database—and the subtle metabolic variations that distinguish these patient populations. [70] Conventional bioinformatics tools, primarily designed for proteomics or general metabolomics, often fail to adequately process the large volumes of data (>60,000 features) generated by high-resolution mass spectrometry, allowing artifacts to be mistaken for genuine lipids and overlooking crucial low-abundance species. [71] This review objectively compares the performance of available computational platforms for lipidomic analysis, evaluates experimental methodologies for diabetes-hyperuricemia research, and identifies pressing bioinformatics gaps requiring interdisciplinary solutions.
Performance Comparison of Computational Lipidomics Platforms
Algorithmic Approaches and Capability Assessment
Table 1: Performance Comparison of Lipidomics Data Processing Platforms
| Platform Name | Primary Methodology | Lipid-Specific Optimization | Novel Lipid Discovery | Artifact Removal Capabilities | Open Source |
|---|---|---|---|---|---|
| LipidFinder [71] | Python workflow with peak filtering & stack removal | Yes (LIPID MAPS integration) | Strong (Untargeted focus) | Comprehensive (Contaminant/adduct/isotope removal) | Yes |
| LipidSearch [71] | Commercial MS/MS library matching | Limited | Weak (Focused on known lipids) | Moderate | No |
| XCMS [71] | Metabolomics-focused peak detection | No | Moderate | Basic | Yes |
| Greazy [71] | MS/MS spectral matching | Yes | Limited | Limited | Yes |
| CLAW [72] | AI-driven workflow with LLM interface | Yes (MRM profiling focus) | Strong (Isomer-specific) | Advanced (Integrated AI agents) | Not specified |
Quantitative Performance Metrics in Diabetes-Hyperuricemia Research
Table 2: Algorithm Performance on Diabetes-Hyperuricemia Lipidomic Data
| Performance Metric | LipidFinder | Standard Metabolomics Tools | Improvement Factor |
|---|---|---|---|
| Real lipid retention | High (83% of reference list) | Low (45-60% of reference list) | 1.5-1.8x [71] |
| Artifact removal | 92% of contaminant stacks | 40-65% of contaminant stacks | 1.4-2.3x [71] |
| Low-abundance species detection | Enhanced via parameter optimization | Limited | Not quantified [71] |
| Retention time alignment | Advanced correction algorithm | Basic alignment | Significant improvement [71] |
| Cross-platform prediction accuracy | Not applicable | Not applicable | Molecular F1 score: 76-87% [72] |
Experimental Protocols for Diabetes-Hyperuricemia Lipidomics
Sample Preparation and LC-MS/MS Analysis
The foundational protocol for comparative lipidomic profiling of DH versus DM populations requires rigorous standardization. Based on recent studies, the following methodology has demonstrated reliability:
Sample Collection and Pre-processing: Following an overnight fast, collect 5mL of venous blood into EDTA tubes. Centrifuge at 3,000 rpm for 10 minutes at room temperature to separate plasma. Aliquot 0.2mL of the upper plasma layer into 1.5mL centrifuge tubes and store immediately at -80°C. For analysis, thaw samples on ice and vortex. Combine 100μL plasma with 200μL of 4°C water, then add 240μL of pre-cooled methanol. After mixing, add 800μL methyl tert-butyl ether (MTBE), sonicate for 20 minutes in a low-temperature water bath, and stand at room temperature for 30 minutes. Centrifuge at 14,000g for 15 minutes at 10°C, collect the upper organic phase, and dry under nitrogen. [10]
LC-MS/MS Analysis: Utilize an ultra-high performance liquid chromatography (UHPLC) system with a Waters ACQUITY UPLC BEH C18 column (2.1 × 100mm, 1.7μm particle size). Employ a mobile phase consisting of A: 10mM ammonium formate acetonitrile solution in water and B: 10mM ammonium formate acetonitrile isopropanol solution with gradient elution. Perform tandem mass spectrometry using electrospray ionization in both positive and negative modes. [10] For targeted approaches, high-coverage quantification can be achieved using a Shimadzu Nexera X2 LC-30AD system coupled with a SCIEX 5500 QTRAP mass spectrometer. [73]
Data Processing and Multivariate Analysis
Process raw data using optimized parameters for lipid identification. For LipidFinder, this includes running the Optimiser function to determine ideal settings for peak width, frame proximity, m/z tolerance, and intensity fold difference using a representative lipid subset. Apply PeakFilter to remove contaminant stacks (series of ions differing by fixed mass) and align retention times across samples. For statistical analysis, employ both unsupervised (principal component analysis) and supervised (orthogonal partial least squares discriminant analysis) methods to identify group separations. Identify significantly altered lipids using Student's t-test with false discovery rate correction, setting significance at p<0.05 and fold-change >2.0. [10] [71] Perform pathway analysis using platforms such as MetaboAnalyst 5.0 to identify perturbed metabolic pathways based on lipid alterations. [10]
Figure 1: Integrated Workflow for Comparative Lipidomics
Differential Lipidomic Profiles in Diabetes with Hyperuricemia
Significant Lipid Alterations and Pathway Perturbations
Table 3: Lipid Species Differentially Regulated in DH vs DM and Healthy Controls
| Lipid Class | Specific Molecular Species | Regulation in DH vs Control | Fold Change | Pathway Association |
|---|---|---|---|---|
| Triglycerides | TG(16:0/18:1/18:2) | Upregulated | Significant [10] | Glycerolipid metabolism |
| Triglycerides | TAG(53:0) | Upregulated | Significant [73] | De novo lipogenesis |
| Phosphatidylethanolamines | PE(18:0/20:4) | Upregulated | Significant [10] | Glycerophospholipid metabolism |
| Phosphatidylcholines | PC(36:1) | Upregulated | Significant [10] | Glycerophospholipid metabolism |
| Phosphatidylcholines | PC(16:0/20:5) | Upregulated | Significant [73] | Glycerophospholipid metabolism |
| Diacylglycerols | DAG(16:0/22:5) | Upregulated | Significant [73] | Glycerolipid metabolism |
| Lysophosphatidylcholine | LPC(20:2) | Downregulated | Significant [73] | Glycerophospholipid metabolism |
| Phosphatidylinositol | PI (unspecified) | Downregulated | Significant [10] | Inositol phosphate metabolism |
Multivariate analyses of lipidomic data reveal significant separation trends among DH, DM, and normal glucose tolerance (NGT) groups, confirming distinct lipidomic profiles. A study identifying 1,361 lipid molecules across 30 subclasses found 31 significantly altered lipid metabolites in DH compared to NGT controls. [10] The most significantly perturbed pathways in DH patients are glycerophospholipid metabolism (impact value 0.199) and glycerolipid metabolism (impact value 0.014). [10] Comparison of DH versus DM groups identified 12 differential lipids also predominantly enriched in these same core pathways, underscoring their central role in the pathophysiology of hyperuricemia complicating diabetes. [10]
Figure 2: Metabolic Pathway Perturbations in DH
AI and Machine Learning Applications in Lipidomics
Predictive Modeling for Biomarker Discovery and Drug Repurposing
Artificial intelligence platforms are increasingly addressing critical gaps in lipidomic data analysis. The Comprehensive Lipidomic Automated Workflow (CLAW) platform represents a significant advancement with integrated AI agents, including a language user interface with large language models that allows researchers to interact via a chatbot terminal for complex statistical analyses. [72] This marks the first end-to-end application of an AI agent in mass spectrometry lipidomics, significantly improving accessibility for researchers without extensive bioinformatics training. [72]
In drug discovery, machine learning models trained on known lipid-lowering drugs (176 positive controls) versus non-lipid-lowering drugs (3,254 controls) have successfully identified 29 FDA-approved drugs with potential lipid-lowering effects, with clinical data confirming that four candidate drugs, including Argatroban, demonstrated significant lipid-lowering effects. [74] [75] These models employed a multi-tiered validation strategy encompassing large-scale retrospective clinical data analysis, standardized animal studies, and molecular docking simulations. [74] The model trained on Mass Bank of North America (MONA) data achieved an average molecular F1 score of 87% and molecular accuracy of 94%, demonstrating robust transferability across different instruments and ionization methods. [72]
Table 4: Essential Research Resources for Lipidomics Studies
| Resource Category | Specific Tool/Reagent | Function/Purpose | Key Features |
|---|---|---|---|
| Chromatography | Waters ACQUITY UPLC BEH C18 column | Lipid separation | 1.7μm particle size, 2.1×100mm [10] |
| Mass Spectrometry | SCIEX 5500 QTRAP | Lipid quantification | High-sensitivity MRM profiling [73] |
| Extraction Solvent | Methyl tert-butyl ether (MTBE) | Lipid extraction | Enriches hydrophobic species [10] |
| Computational Tool | LipidFinder | Data processing | Open-source Python workflow [71] |
| Database | LIPID MAPS | Lipid identification | >45,000 unique structures [70] |
| AI Platform | CLAW | Workflow automation | Integrated LLM chatbot interface [72] |
| Pathway Analysis | MetaboAnalyst 5.0 | Metabolic pathway mapping | Identifies perturbed pathways [10] |
The integration of advanced computational approaches, particularly AI-driven platforms, is rapidly transforming our ability to discern subtle lipidomic differences between diabetes with hyperuricemia and diabetes alone. While current tools like LipidFinder and CLAW represent significant advancements over generic metabolomics platforms, persistent gaps remain in standardized data harmonization, reproducible biomarker validation, and cross-platform interoperability. The promising application of machine learning for drug repurposing in metabolic diseases highlights the transformative potential of these approaches. Future developments must focus on creating more intuitive, integrated bioinformatics platforms that leverage AI not merely for data processing but for generating testable biological hypotheses about the complex interplay between lipid metabolism, hyperglycemia, and hyperuricemia.
The transition from discovering lipidomic biomarkers in controlled single-center studies to validating them for clinical use presents a significant challenge in metabolic disease research. This guide examines the design and implementation of multi-center validation studies, focusing on lipidomic profiles in diabetes mellitus (DM) versus diabetes with hyperuricemia (DH). We compare single-center and multi-center approaches, provide detailed experimental protocols from recent studies, and outline a framework for designing robust validation studies that ensure biomarker reliability across diverse populations and settings.
Lipidomics has emerged as a powerful tool for identifying novel biomarkers in metabolic diseases, with numerous studies revealing distinctive lipid signatures in diabetes and hyperuricemia. However, the transition from discovery to clinically applicable biomarkers remains hampered by what is known as the "discovery-validation gap" – where promising findings from single-center studies fail to validate in broader populations [52]. Multi-center studies address this gap by enhancing participant diversity, accelerating recruitment, and strengthening the generalizability of findings [76]. In the context of diabetes and hyperuricemia research, where lipid metabolic disruptions are increasingly recognized as central to disease pathophysiology [10] [14], rigorous validation approaches are particularly crucial for developing reliable diagnostic and prognostic tools.
The technical and interpretative integrity of a multicenter study depends on sound design, uniform implementation methodology, assured standardization, high-quality data, and appropriate statistical considerations [76]. This guide examines the comparative advantages of multi-center designs, provides detailed experimental protocols from recent lipidomic studies, and outlines a comprehensive framework for designing validation studies that can effectively bridge the discovery-validation gap in diabetes-hyperuricemia research.
Comparative Analysis: Single-Center vs. Multi-Center Study Designs
Advantages and Limitations of Different Study Designs
Table 1: Comparison of Single-Center and Multi-Center Study Designs for Lipidomic Validation
| Design Aspect | Single-Center Studies | Multi-Center Studies |
|---|---|---|
| Participant Recruitment | Limited to local population, slower recruitment | Rapid recruitment across diverse geographic regions [76] |
| Population Diversity | Homogeneous population, limited generalizability | Heterogeneous sample representing varied ethnicities and practice patterns [77] |
| Statistical Power | Smaller sample sizes, limited power to detect smaller effects | Larger sample sizes provide sufficient power for detecting smaller treatment effects [77] |
| Technical Variability | Consistent methodology within single laboratory | Potential for inter-site variability in sample processing and analysis [76] |
| Implementation Challenges | Straightforward protocol implementation | Requires rigorous standardization across sites and complex coordination [76] |
| Resource Requirements | Lower overall costs but limited resources | Shared resource burden but requires significant coordination infrastructure [77] |
| Generalizability | Vulnerable to local biases, limited external validity | Enhanced generalizability through diverse patient populations and practice patterns [77] |
Methodological Considerations for Multi-Center Validation
Multi-center studies are particularly advantageous for lipidomic biomarker validation as they allow for the assessment of biological variability across diverse populations while controlling for technical and analytical variations [76]. A key historical example demonstrating the importance of multi-center validation is the Patulin Clinical Trials, which effectively investigated a potential treatment for the common cold after smaller studies had produced conflicting results [77]. This early model demonstrated how multi-center approaches can resolve uncertainties from less robust designs.
In diabetes-hyperuricemia research, multi-center designs are especially valuable given the environmental and genetic heterogeneity of these conditions [10]. The larger sample sizes achievable through multi-center collaborations enable researchers to detect smaller effect sizes that may be clinically significant, while the diverse expertise from multiple investigators creates a platform upon which study protocols and conclusions are thoroughly examined for potential pitfalls [77].
Lipidomic Biomarkers in Diabetes and Hyperuricemia: Current Evidence
Distinct Lipid Signatures in Diabetes with Hyperuricemia
Recent lipidomic studies have revealed specific alterations in lipid metabolism associated with hyperuricemia complicating diabetes. A 2025 study employing UHPLC-MS/MS-based untargeted lipidomics identified significant differences in lipid metabolites between patients with diabetes mellitus combined with hyperuricemia (DH) versus diabetes mellitus (DM) alone and healthy controls [10]. The research identified 31 significantly altered lipid metabolites in the DH group compared to normal glucose tolerance controls, with 13 triglycerides (TGs), 10 phosphatidylethanolamines (PEs), and 7 phosphatidylcholines (PCs) significantly upregulated, while one phosphatidylinositol (PI) was downregulated [10].
Table 2: Significantly Altered Lipid Classes in Diabetes with Hyperuricemia vs. Diabetes Alone
| Lipid Class | Change in DH vs. DM | Specific Examples | Potential Biological Significance |
|---|---|---|---|
| Triglycerides (TGs) | Significant upregulation | TG(16:0/18:1/18:2) | Associated with insulin resistance and cardiovascular risk |
| Phosphatidylethanolamines (PEs) | Significant upregulation | PE(18:0/20:4) | Membrane fluidity, inflammatory signaling |
| Phosphatidylcholines (PCs) | Significant upregulation | PC(36:1) | Membrane integrity, lipid transport |
| Lysophosphatidylcholine Plasmalogens | Downregulation | Not specified | Reduced antioxidant capacity |
| Sphingomyelins (SMs) | Varied alterations | SM(d18:1/24:0) | Cell signaling, insulin resistance |
| Ceramides (Cer) | Varied alterations | Cer(d18:1/24:0) | Insulin resistance, apoptosis |
Another study investigating hyperuricemia and gout found the most significant upregulation of phosphatidylethanolamines and downregulation of lysophosphatidylcholine plasmalogens/plasmanyls in patient plasma [11]. More profound lipid alterations were observed in early-onset patients (age ≤40 years), suggesting different pathological mechanisms across age groups [11].
Perturbed Metabolic Pathways
Multivariate analyses of lipidomic data reveal significant separation trends among diabetes with hyperuricemia, diabetes alone, and normal glucose tolerance groups, confirming distinct lipidomic profiles [10]. The collective analysis of altered metabolites shows enrichment in specific metabolic pathways:
- Glycerophospholipid metabolism (impact value: 0.199) [10]
- Glycerolipid metabolism (impact value: 0.014) [10]
- Sphingolipid metabolism [78]
These pathway alterations highlight the interconnected nature of purine and lipid metabolism in diabetes-hyperuricemia comorbidity and suggest potential mechanistic links between uric acid elevation and lipid dysregulation.
Experimental Protocols for Lipidomic Profiling
Sample Collection and Preparation
Protocol from UHPLC-MS/MS-based Plasma Untargeted Lipidomic Analysis [10]:
- Sample Collection: Collect 5 mL of fasting morning blood in appropriate vacutainers.
- Plasma Separation: Centrifuge at 3,000 rpm for 10 minutes at room temperature.
- Aliquoting: Transfer 0.2 mL of upper layer plasma into 1.5 mL centrifuge tubes.
- Quality Control Preparation: Create three equal groups of quality control (QC) samples by pooling aliquots from multiple subjects.
- Storage: Store samples at -80°C until analysis.
- Thawing: Thaw samples on ice and vortex thoroughly.
- Lipid Extraction:
- Take 100 μL plasma into a 1.5 mL centrifuge tube
- Add 200 μL of 4°C water and mix
- Add 240 μL of pre-cooled methanol and mix
- Add 800 μL methyl tert-butyl ether (MTBE)
- Sonicate in low-temperature water bath for 20 minutes
- Let stand at room temperature for 30 minutes
- Centrifuge at 14,000 g for 15 minutes at 10°C
- Collect upper organic phase
- Dry under nitrogen stream
Lipidomic Analysis Using UHPLC-MS/MS
Chromatographic Conditions [10]:
- System: Ultra-high performance liquid chromatography (UHPLC)
- Column: Waters ACQUITY UPLC BEH C18 (2.1 mm i.d. × 100 mm length, 1.7 μm particle size)
- Mobile Phase:
- A: 10 mM ammonium formate acetonitrile solution in water
- B: 10 mM ammonium formate acetonitrile isopropanol solution
- Gradient: Optimized for comprehensive lipid separation (specific gradient details not provided in source)
Mass Spectrometry Parameters:
- Technique: Tandem mass spectrometry (MS/MS)
- Ionization: Electrospray ionization (ESI) in both positive and negative modes
- Scan Modes: Multiple reaction monitoring (MRM) for targeted analysis; full scan for untargeted analysis
Data Processing and Statistical Analysis
- Lipid Identification: Use internal standards and reference libraries for lipid identification
- Quality Control: Apply quality control measures including relative standard deviation (RSD) <30% in QC samples
- Multivariate Statistics: Perform Principal Component Analysis (PCA) and Orthogonal Partial Least Squares Discriminant Analysis (OPLS-DA) to observe overall distribution between sample groups
- Differential Analysis: Apply Student's t-test and fold change (FC) to screen differential lipid molecules
- Pathway Analysis: Use platforms like MetaboAnalyst 5.0 to analyze differential lipid metabolism pathways
Designing Multi-Center Validation Studies: A Practical Framework
Pre-Planning Phase: Establishing Foundation
The initial phase involves formulating and refining the research question using the FINER criteria (Feasible, Interesting, Novel, Ethical, Relevant) [77]:
- Feasibility: Assess adequate subject numbers, technical expertise, and time/money requirements
- Interest: Ensure question engages the collaborative team
- Novelty: Confirm the study extends previous findings on lipid biomarkers
- Ethics: Ensure protocol meets ethical standards for all participating centers
- Relevance: Verify potential to influence clinical management of diabetes-hyperuricemia
Pilot Studies: Conduct external pilot studies to troubleshoot mechanics of the study protocol, test data collection forms, determine recruitment rates, and train research coordinators [77].
Implementation Phase: Standardization and Coordination
Site Selection and Training:
- Select sites with demonstrated expertise in lipidomic analyses and patient populations
- Establish a coordinating center to oversee protocol implementation and data management [76]
- Implement rigorous training programs for standardized sample collection, processing, and storage across sites
Quality Assurance Measures:
- Develop detailed standard operating procedures (SOPs) for all technical processes
- Implement batch-to-bquality control samples to monitor analytical performance
- Establish cross-site calibration protocols for instrumentation
Data Management:
- Create centralized database with common data elements
- Implement regular data quality checks and validation procedures
- Plan for periodic audits to ensure protocol adherence
Analytical Phase: Statistical Considerations for Multi-Center Data
Addressing Center Effects:
- Use mixed-effects models to account for center-specific variability
- Test for center-by-treatment interactions when evaluating biomarker performance
- Apply harmonization techniques to adjust for technical variability across sites
Sample Size Considerations:
- Power calculations should account for the multi-center design effect
- Ensure adequate sample size to detect clinically meaningful differences in lipid levels
- Plan for stratified analyses by relevant clinical variables (e.g., age, sex, diabetes duration)
Visualization of Multi-Center Study Workflow
Multi-Center Study Workflow
Lipid Metabolic Pathways in Diabetes-Hyperuricemia
Lipid Pathway Alterations in Hyperuricemia
The Scientist's Toolkit: Essential Research Reagents
Table 3: Key Research Reagent Solutions for Lipidomic Studies
| Reagent/Equipment | Specific Examples | Function in Lipidomic Analysis |
|---|---|---|
| Chromatography Columns | Waters ACQUITY UPLC BEH C18 column (2.1 × 100 mm, 1.7 μm) [10] | Lipid separation based on hydrophobicity |
| Internal Standards | SPLASH LIPIDOMIX Mass Spec Standard [11]; PC 19:0/19:0, LPC 19:0 [79] | Quantification and quality control |
| Extraction Solvents | Methyl tert-butyl ether (MTBE) [10]; Isopropanol [79] | Lipid extraction from biological samples |
| Mass Spectrometry Systems | UHPLC-Q-TOF-MS [78]; QTRAP 6500+ [11] | Lipid detection and identification |
| Mobile Phase Additives | 10 mM ammonium formate [10]; Ammonium acetate [79] | Enhance ionization efficiency in MS |
| Data Processing Software | MetaboAnalyst 5.0 [10] | Statistical analysis and pathway mapping |
Multi-center validation studies represent an essential approach for bridging the discovery-validation gap in lipidomic research on diabetes and hyperuricemia. By implementing rigorous standardization protocols, appropriate statistical methods for multi-center data, and comprehensive quality control measures, researchers can transform promising single-center findings into clinically applicable biomarkers. The distinct lipid signatures identified in diabetes with hyperuricemia versus diabetes alone provide a compelling case for such validation efforts, offering potential pathways for improved diagnosis, risk stratification, and targeted interventions for these interconnected metabolic disorders.
Lipidomic biomarkers are increasingly critical for advancing precision medicine, offering insights into disease mechanisms, patient stratification, and therapeutic monitoring. For researchers investigating complex metabolic conditions like diabetes mellitus (DM) and diabetes mellitus combined with hyperuricemia (DH), navigating the regulatory approval pathway for these biomarkers is as crucial as the discovery process itself. Regulatory agencies worldwide have established frameworks to qualify biomarkers, ensuring they are reliable and fit-for-purpose in drug development and clinical practice. The European Medicines Agency (EMA), for instance, emphasizes enhancing early engagement with biomarker developers to facilitate regulatory qualification, a key goal in its Regulatory Science Strategy to 2025 [80]. Simultaneously, the U.S. Food and Drug Administration (FDA) has recently introduced new pathways, such as the "Plausible Mechanism Pathway," designed to streamline approvals for therapies—and by extension, their associated biomarkers—in areas of high unmet need, particularly where traditional randomized controlled trials are infeasible [81] [82]. This guide objectively compares the regulatory pathways and the experimental data supporting lipidomic biomarkers, providing a foundational resource for researchers and drug development professionals working at the intersection of lipidomics and metabolic disease.
Regulatory Pathways for Biomarker Qualification
Navigating the regulatory landscape is a critical step in translating a lipidomic biomarker from a research finding to a regulatory-accepted tool. The pathways established by the FDA and EMA provide structured, albeit complex, routes for qualification.
FDA's New "Plausible Mechanism Pathway"
Announced in late 2025, this pathway represents a significant shift in the FDA's approach to regulating bespoke therapies, including cell and gene therapies, with direct relevance to the biomarkers used to assess their efficacy [81] [82]. It is designed for conditions where a randomized controlled trial (RCT) is not feasible. The pathway is built around five core elements that sponsors must address [81]:
- Identification of a Specific Molecular Abnormality: The disease must have a known biologic cause, not just a broad set of clinical diagnostic criteria.
- Product Targets the Underlying Biology: The medical product must target the proximate biological alterations.
- Well-Characterized Natural History: The untreated disease course must be thoroughly understood to serve as a historical control.
- Confirmation of Target Engagement: There must be evidence that the intended target was successfully modulated.
- Improvement in Clinical Outcomes: There must be a demonstrated improvement in the clinical course of the disease.
For lipidomic biomarker developers, this pathway underscores the FDA's willingness to accept strong mechanistic evidence. A biomarker used to demonstrate "target engagement" (Element 4) or "improvement in clinical outcomes" (Element 5) in a series of single-patient success stories could form part of the evidence package for a broader qualification. However, this pathway requires extensive post-market surveillance and real-world evidence (RWE) collection to preserve the biomarker's qualified status [81].
EMA's Qualification of Novel Methodologies
The EMA offers a structured voluntary pathway for the regulatory qualification of novel methodologies, including biomarkers, through its Qualification of Novel Methodologies (QoNM) procedure [80]. This is a multi-stage process:
- Innovation Task Force (ITF): Serves as a first, informal point of contact for early-stage strategic discussions.
- Scientific Advice (SA): A fee-related procedure to discuss strategies for generating robust evidence for benefit-risk assessment.
- Qualification Advice (QA) and Qualification Opinion (QO): The QA agrees on evidence generation plans, while a QO is the formal endorsement that a biomarker is an acceptable regulatory standard for a specific Context of Use (CoU) in drug development.
The EMA has noted that consortia are more likely than individual companies to opt for the QoNM procedure and engage in follow-up activities, highlighting the value of collaborative efforts in biomarker qualification [80].
Rare Disease Evidence Principles
Complementing the Plausible Mechanism Pathway, the FDA has also outlined Rare Disease Evidence Principles (RDEP). This process is targeted at conditions with a known genetic defect, very small patient populations (e.g., fewer than 1,000 persons in the U.S.), and significant unmet need [81]. For a lipidomic biomarker intended to track progression or treatment response in an ultra-rare metabolic disorder, RDEP clarifies that substantial evidence of effectiveness might be established through one adequate and well-controlled trial, which could be a single-arm design, supported by robust confirmatory evidence from external controls or natural history studies [81].
Table 1: Comparison of Key Regulatory Pathways for Biomarkers
| Feature | FDA Plausible Mechanism Pathway [81] | EMA QoNM Procedure [80] | FDA Rare Disease Evidence Principles [81] |
|---|---|---|---|
| Primary Focus | Conditions where RCTs are not feasible; bespoke therapies | Regulatory qualification of novel methodologies for drug development | Rare diseases with known genetic defect and small populations |
| Key Requirements | Five core elements (specific target, confirmed engagement, etc.) | Scientific advice, qualification advice, leading to a qualification opinion | Known genetic driver, progressive deterioration, lack of alternative therapies |
| Trial Design Flexibility | Leverages single-patient outcomes; uses patients as their own controls | Accepts various sources of evidence; external controls can be considered | Accepts single-arm trials with confirmatory evidence from natural history |
| Post-Marketing Commitment | Mandatory RWE collection for safety and efficacy preservation | Not specified as a mandatory part of the qualification opinion | Focus on confirming clinical benefit in the post-approval setting |
| Ideal for Biomarkers | Demonstrating target engagement and clinical improvement in small series | Achieving a broad, publicly available endorsement for a specific CoU | Serving as a key endpoint in single-arm trials for rare metabolic diseases |
Lipidomic Profiles in Diabetes with vs. without Hyperuricemia: An Experimental Data Comparison
A direct comparison of lipidomic profiles between patient groups reveals distinct molecular signatures, providing both biological insights and candidate biomarkers for regulatory qualification.
Experimental Protocol for Untargeted Lipidomics
The following methodology, derived from a recent study, outlines a robust protocol for discovering differential lipid biomarkers in conditions like DM and DH [3]:
- Sample Collection and Pre-processing: Collect fasting blood plasma samples. After centrifugation, mix plasma with pre-cooled methanol and methyl tert-butyl ether (MTBE), followed by sonication in a low-temperature water bath. After centrifugation, the upper organic phase is collected and dried under nitrogen for analysis [3].
- Chromatography: Separate lipids using an Ultra-High-Performance Liquid Chromatography (UHPLC) system, typically with a C18 reverse-phase column (e.g., Waters ACQUITY UPLC BEH C18). A mobile phase gradient of acetonitrile and isopropanol is used for optimal lipid separation [3].
- Mass Spectrometry Analysis: Analyze the separated lipids using tandem mass spectrometry (MS/MS) with electrospray ionization to identify and quantify lipid species based on their mass-to-charge ratio and fragmentation patterns [3].
- Data Processing and Statistical Analysis: Process raw data to identify lipid molecules. Use multivariate statistical analyses like Principal Component Analysis (PCA) and Orthogonal Partial Least Squares-Discriminant Analysis (OPLS-DA) to observe group separations. Apply univariate tests (e.g., Student's t-test) and fold-change calculations to pinpoint significantly altered lipids [3].
- Pathway Analysis: Utilize platforms like MetaboAnalyst to map differentially expressed lipids onto metabolic pathways (e.g., glycerophospholipid metabolism) to understand the biological implications [3].
Comparative Lipidomic Data: DM vs. DH
Applying the above protocol, a 2025 study identified 1,361 lipid molecules across 30 subclasses, revealing a significant separation between DH, DM, and normal glucose tolerance (NGT) groups [3]. The table below summarizes key quantitative differences in lipid species when comparing DH to NGT controls.
Table 2: Significantly Altered Lipid Metabolites in Diabetes with Hyperuricemia (DH) vs. Normal Controls [3]
| Lipid Class | Example Lipid Molecules | Trend in DH vs. NGT | Number of Significant Lipids |
|---|---|---|---|
| Triglycerides (TGs) | TG (16:0/18:1/18:2) | Significantly Upregulated | 13 |
| Phosphatidylethanolamines (PEs) | PE (18:0/20:4) | Significantly Upregulated | 10 |
| Phosphatidylcholines (PCs) | PC (36:1) | Significantly Upregulated | 7 |
| Phosphatidylinositol (PI) | Not Specified | Downregulated | 1 |
When comparing the DH group directly to the DM-only group, 12 differential lipids were identified. Crucially, both the DH vs. NGT and DH vs. DM comparisons showed that these dysregulated lipids were predominantly enriched in the same core metabolic pathways: glycerophospholipid metabolism and glycerolipid metabolism [3]. This consistency reinforces the central role of these pathways in the pathophysiology of hyperuricemia complicating diabetes.
Successfully conducting lipidomic research and navigating regulatory requirements relies on a suite of essential reagents and tools.
Table 3: Research Reagent Solutions for Lipidomic Biomarker Discovery
| Item / Solution | Function / Application | Example from Literature |
|---|---|---|
| UHPLC-MS/MS Systems | High-resolution separation and accurate identification/quantification of complex lipid species. | Used to identify 1,361 lipid molecules in plasma from DM and DH patients [3]. |
| Chromatography Columns | Separate individual lipid molecules prior to mass spectrometry analysis. | Waters ACQUITY UPLC BEH C18 column (2.1 mm x 100 mm, 1.7 μm) [3]. |
| Lipid Extraction Solvents | Isolate lipids from complex biological matrices like plasma or tissue. | Methyl tert-butyl ether (MTBE) and methanol used in a pre-processing step [3]. |
| Bioinformatics Software | Process raw MS data, perform lipid identification, and conduct statistical analyses (PCA, OPLS-DA). | Tools like MS DIAL and Lipostar are used, though agreement between platforms can be low, highlighting a key challenge [52]. |
| Pathway Analysis Platforms | Interpret dysregulated lipid lists in a biological context by mapping them to known metabolic pathways. | MetaboAnalyst 5.0 platform used to identify perturbed glycerophospholipid and glycerolipid metabolism [3]. |
| Stable Isotope-Labeled Internal Standards | Enable precise absolute quantification of lipids by correcting for extraction and ionization efficiency variations. | Critical for targeted lipidomics and rigorous validation [52]. |
Visualizing Workflows and Pathways
Lipidomic Biomarker Discovery Workflow
The pathway from sample collection to clinical implementation is complex and multi-staged, requiring rigorous validation at every step.
Simplified Regulatory Pathway Logic
Engaging with regulators early and often is a critical success factor for biomarker qualification, as visualized in the pathway below.
The journey to secure regulatory qualification for lipidomic biomarkers is a structured yet flexible process, increasingly aided by new pathways like the FDA's Plausible Mechanism model. For researchers focused on metabolic diseases, the experimental data clearly shows that diabetes with concurrent hyperuricemia presents a distinct lipidomic profile characterized by significant perturbations in glycerolipid and glycerophospholipid metabolism. Success in this field hinges on a dual focus: employing rigorous, standardized experimental protocols for biomarker discovery and proactively engaging with regulatory agencies through the appropriate pathways from the earliest stages of development. This integrated approach ensures that promising lipidomic biomarkers can successfully navigate the path from the research bench to the patient's bedside.
Benchmarking Lipidomic Insights Against Conventional Clinical Metrics
In the pursuit of precision medicine for metabolic disorders, the ability to distinguish between closely related disease phenotypes is crucial for targeted therapeutic development. This is particularly true for the complex interplay between diabetes mellitus (DM) and hyperuricemia, where conventional lipid panels often fail to capture the nuanced lipidomic disturbances that characterize this high-risk patient population. The discriminatory power of a diagnostic test is quantitatively expressed by the Area Under the Receiver Operating Characteristic Curve (AUC), where values exceeding 0.95 represent outstanding classification accuracy [83]. This guide objectively compares the performance of advanced lipidomic panels against standard lipid measurements within the specific context of differentiating diabetes with hyperuricemia from diabetes alone, providing researchers and drug development professionals with critical experimental data and methodological insights.
Performance Comparison: Advanced Lipid Panels vs. Standard Lipids
The following analysis synthesizes findings from recent clinical studies to directly contrast the diagnostic capabilities of advanced lipidomic approaches with conventional lipid profiling.
Table 1: Performance Metrics of Lipid Panels in Metabolic Disease Stratification
| Analysis Type | Specific Target | Key Lipid Species / Ratios | AUC Value | Reference Context |
|---|---|---|---|---|
| Advanced Lipidomics | Diabetes Mellitus + Hyperuricemia (DH) vs. Normal | 31 Significantly altered lipids (13 TGs, 10 PEs, 7 PCs, 1 PI) [10] | > 0.95 (Classifier Performance) [10] | UHPLC-MS/MS profiling of 30 lipid subclasses [10] |
| Advanced Lipidomics | COPD vs. Healthy Controls | 4 significant lipid species; 10 lipid ratios [83] | 0.86 - 1.00 [83] | ESI-MS based serum lipidomic analysis [83] |
| AI-Enhanced Lipidology | Diagnosis of Familial Hypercholesterolemia | ML models using basic lipid profile, age, and sex [84] | 0.801 - 0.856 [84] | Machine learning analysis of electronic health records [84] |
| Standard Lipid Panel | Identification of combined Hyperuricemia & Dyslipidemia in Uncontrolled T2DM | Renal–Metabolic Risk Score (RMRS) based on urea, TG/HDL, eGFR [14] | 0.78 [14] | Retrospective analysis of routine laboratory parameters [14] |
| Standard Lipid Parameter | Association in Diabetic Patients | Uric Acid vs. Triglycerides [85] | Not Applicable (Significant correlation, p<0.05) [85] | Single-center, cross-sectional study [85] |
The data unequivocally demonstrates the superior discriminatory power of advanced lipidomic panels. A targeted lipidomics study successfully identified a signature of 31 lipid molecules that could distinguish patients with diabetes and hyperuricemia (DH) from those with diabetes alone (DM) and from healthy controls (NGT), with multivariate analyses confirming a significant separation trend and classifier performance yielding AUC values exceeding 0.95 [10]. This performance surpasses that of scores based on standard lipids, such as the Renal–Metabolic Risk Score (RMRS), which showed a moderate AUC of 0.78 for identifying the co-occurrence of dyslipidemia and hyperuricemia [14].
The underlying reason for this performance gap is the depth of information captured. Advanced lipidomics moves beyond the crude measurements of standard panels—which might only show a significant correlation between uric acid and triglycerides in diabetic patients [85]—to pinpoint specific, pathologically relevant molecular species. These include triglycerides like TG(16:0/18:1/18:2), phosphatidylethanolamines such as PE(18:0/20:4), and phosphatidylcholines including PC(36:1), which were all significantly upregulated in the DH group [10].
Experimental Protocols for High-Performance Lipidomics
To achieve the high discriminatory power noted above, specific, rigorous experimental protocols are required. The following section details the key methodologies from the cited studies that yielded AUC values greater than 0.95.
UHPLC-MS/MS-Based Plasma Untargeted Lipidomics
This protocol, adapted from the study that identified the 31-lipid signature for diabetes and hyperuricemia, provides a comprehensive workflow for biomarker discovery [10].
- Study Population & Design: A 1:1 matched case-control study is ideal. For instance, select 17 patients each with diabetes mellitus (DM) and diabetes mellitus combined with hyperuricemia (DH), along with 17 healthy controls, matched by sex and age. Inclusion should be based on standardized diagnostic criteria (e.g., ADA guidelines for diabetes, specific uric acid thresholds for hyperuricemia), with exclusions for confounding medications [10].
- Sample Collection & Pre-processing: Collect fasting blood samples (e.g., 5 mL) into appropriate tubes. Centrifuge to isolate plasma (e.g., 3,000 rpm for 10 min). Aliquot and store at -80°C. For lipid extraction, use a methyl tert-butyl ether (MTBE)-based method: thaw plasma on ice, mix with pre-cooled methanol and MTBE, sonicate in a low-temperature water bath, incubate, and centrifuge. Collect the upper organic phase and dry under a nitrogen stream [10].
- LC-MS Analysis:
- Chromatography: Use an Ultra-High-Performance Liquid Chromatography (UHPLC) system with a reversed-phase C18 column (e.g., Waters ACQUITY UPLC BEH C18, 2.1×100 mm, 1.7 μm). A binary mobile phase is standard, for example, A: 10 mM ammonium formate in acetonitrile/water and B: 10 mM ammonium formate in acetonitrile/isopropanol [10].
- Mass Spectrometry: Perform untargeted analysis using a high-resolution tandem mass spectrometer (e.g., Q-TOF or Orbitrap) coupled to the UHPLC system. Data should be acquired in both positive and negative ionization modes to capture a broad lipid spectrum.
- Data Processing & Statistical Analysis: Process raw data using specialized software (e.g., Progenesis QI, MS-DIAL) for peak picking, alignment, and lipid identification against databases. Subsequent statistical analysis should include:
- Multivariate Analysis: Use Principal Component Analysis (PCA) for an unsupervised overview and Orthogonal Projections to Latent Structures-Discriminant Analysis (OPLS-DA) to maximize separation between pre-defined groups (e.g., DH vs. DM).
- Differential Analysis: Apply univariate tests (e.g., Student's t-test) with correction for multiple testing (e.g., False Discovery Rate) and fold-change analysis to identify significantly altered lipids.
- Biomarker Performance: Evaluate the discriminatory power of significant lipids or lipid panels using Receiver Operating Characteristic (ROC) curve analysis to calculate AUC values [10].
ESI-MS Serum Lipidomic Profiling for Disease Stratification
This methodology, derived from a COPD biomarker study that achieved AUCs up to 1.00, is highly applicable for robust, quantitative lipid profiling [83].
- Sample Preparation & Lipid Extraction: Add 50 μL of serum to a mixture of 160 μL chloroform and 320 μL methanol containing an antioxidant (e.g., BHT). Vortex mix thoroughly (e.g., 20 min). Add 160 μL of water to induce phase separation, shake, and centrifuge (e.g., 2,000 g for 5 min). Collect the lower organic layer. Repeat the extraction with fresh chloroform, combine the organic phases, and wash with a KCl solution. The final lipid extract is dissolved in chloroform for infusion [83].
- Mass Spectrometric Analysis: Utilize direct infusion on an electrospray ionization mass spectrometry (ESI-MS) system, such as a Waters Xevo instrument. An automated ESI-MS/MS method is employed, which uses the ratio of head groups plus total acyl carbons to total double bonds to determine and quantify individual lipid species across multiple classes (e.g., phospholipids, sphingolipids, glycerolipids) [83].
- Data Integration & Biomarker Validation:
- Statistical Modeling: Apply OPLS-DA to the processed lipidomic data to identify the lipid species that most significantly contribute to the separation between patient and control groups.
- ROC Analysis: Test the potential biomarkers identified by OPLS-DA individually and in combination. Calculate the AUC for each candidate to validate its diagnostic capability. As demonstrated, this can yield AUC values ranging from 0.83 to 1.00 for specific lipid species and ratios [83].
Visualizing Workflows and Pathways
The following diagrams, generated using Graphviz, illustrate the core experimental workflow and the implicated metabolic pathways identified in the featured research.
Lipidomics Biomarker Discovery Workflow
Perturbed Lipid Pathways in Diabetes and Hyperuricemia
The Scientist's Toolkit: Essential Research Reagents & Solutions
Successfully implementing the high-performance protocols described above requires a specific set of high-quality reagents, standards, and software tools.
Table 2: Key Research Reagent Solutions for Lipidomic Profiling
| Item | Function / Application | Specific Example / Note |
|---|---|---|
| UHPLC-MS/MS System | High-resolution separation and detection of complex lipid mixtures. | Systems combining UHPLC (e.g., Waters ACQUITY) with a high-resolution mass spectrometer (e.g., Q-TOF, Orbitrap) are essential for untargeted profiling [10]. |
| ESI-MS System | Robust, quantitative profiling of pre-extracted lipid species. | Direct infusion systems (e.g., Waters Xevo) with automated MS/MS capabilities are used for high-throughput targeted analysis [83]. |
| Lipid Extraction Solvents | Liquid-liquid extraction of lipids from biological matrices. | Chloroform, Methyl tert-butyl ether (MTBE), and Methanol are critical. Inclusion of antioxidants like Butylated Hydroxytoluene (BHT) prevents oxidation [83] [10]. |
| Synthetic Lipid Standards | Quality control, quantification, and identification of lipid species. | Purchased from specialized vendors (e.g., Avanti Polar Lipids). Isotopically labeled internal standards are necessary for precise quantification [83]. |
| Chromatography Columns | Separation of individual lipid species prior to mass spectrometry. | Reversed-phase C18 columns (e.g., Waters ACQUITY UPLC BEH C18, 1.7 μm) are the industry standard for lipid separation [10]. |
| Data Processing Software | Peak detection, alignment, lipid identification, and statistical analysis. | Software platforms like Progenesis QI, MS-DIAL, or XCMS are used to convert raw MS data into a list of identified lipids and their abundances [10]. |
| Statistical Analysis Software | Multivariate and univariate statistical analysis and ROC curve generation. | Platforms like MetaboAnalyst 5.0, SIMCA, and R are used for OPLS-DA, PCA, and calculating AUC values to validate biomarker performance [10] [14]. |
In the study of metabolic diseases such as diabetes combined with hyperuricemia, researchers and drug developers have two powerful but distinct tools at their disposal: advanced mass spectrometry-based lipidomics and conventional laboratory-based Renal–Metabolic Risk Scores (RMRS). The former provides a deep, molecular-level snapshot of hundreds to thousands of individual lipid species, offering unparalleled insights into perturbed biological pathways. The latter leverages routinely available clinical chemistry parameters to generate practical risk stratification tools suitable for broader clinical deployment. This guide provides a detailed, objective comparison of their performance characteristics, methodologies, and applications to aid in selecting the appropriate technology for specific research objectives.
Performance and Application Comparison
The table below summarizes the core characteristics and performance metrics of lipidomics and conventional RMRS, highlighting their distinct niches in metabolic research.
Table 1: Head-to-Head Comparison of Lipidomics and Conventional RMRS
| Feature | Mass Spectrometry-Based Lipidomics | Conventional RMRS |
|---|---|---|
| Analytical Focus | Comprehensive molecular lipid species (e.g., TGs, PEs, PCs, Ceramides) [3] [86] [7] | Integrated clinical parameters (e.g., serum urea, TG/LDL ratio, eGFR) [87] [14] |
| Primary Application | Mechanistic research, novel biomarker discovery, pathway analysis [3] [88] [7] | Clinical risk stratification, patient triage, and epidemiological studies [87] [14] |
| Key Performance Data | - Differentiates DH from DM with >95% accuracy in some studies [7]- Identifies 31 significantly altered lipid metabolites in DH vs. controls [3] | - AUC = 0.67-0.78 for identifying hyperuricemia/dyslipidemia co-occurrence [87] [14]- Monotonic risk gradient from 64.5% (Q1) to 96.1% (Q4) prevalence [14] |
| Typical Sample Type | Plasma or serum [3] [7] | Plasma or serum [87] [14] |
| Throughput | Lower; requires lengthy chromatographic separation and complex data processing [88] [89] | High; utilizes automated clinical chemistry analyzers [87] |
| Cost Profile | High (specialized equipment, reagents, and expertise) [88] [90] | Low (relies on inexpensive, routine tests) [87] [14] |
| Key Advantage | Unbiased, deep mechanistic insights into glycerophospholipid and glycerolipid metabolism [3] | Pragmatic, inexpensive, and easily integrated into current clinical workflows [14] |
Detailed Experimental Protocols
Lipidomics Workflow for Diabetes and Hyperuricemia
The lipidomics protocol is a multi-stage process designed for comprehensive molecular profiling.
Table 2: Key Research Reagents for UHPLC-MS/MS Lipidomics
| Reagent / Solution | Function in the Protocol |
|---|---|
| Methyl tert-butyl ether (MTBE) | Primary solvent for lipid extraction; separates into the top organic layer [3] [88]. |
| Chloroform-Methanol (2:1, v/v) | Alternative lipid extraction solvent system; separates into the bottom organic layer [88] [86]. |
| SPLASH LIPIDOMIX Mass Spec Standard | A cocktail of stable isotope-labeled internal standards added to correct for extraction efficiency and instrument variability [7] [90]. |
| Ammonium Formate (10 mM) in Acetonitrile/Water | Mobile phase A for UHPLC, aiding in chromatographic separation and ionization [3] [86]. |
| Ammonium Formate (10 mM) in Acetonitrile/Isopropanol | Mobile phase B for UHPLC gradient elution [3] [86]. |
| Leucine Enkephalin | Used as a "lock mass" for real-time mass accuracy correction during MS analysis [86]. |
Step-by-Step Protocol:
- Sample Preparation: Plasma samples are collected after fasting and centrifuged to remove cellular components. Aliquots are stored at -80°C until analysis [3] [86].
- Lipid Extraction: The preferred MTBE method involves adding a mixture of MTBE, methanol, and water to the plasma sample. After vortexing and sonication, the mixture separates into two phases. The upper organic phase (containing the lipids) is collected and dried under a gentle stream of nitrogen gas [3] [88].
- LC-MS Analysis: The dried lipid extract is reconstituted in an appropriate solvent and injected into a UHPLC system. Lipids are separated on a reversed-phase C18 column using a gradient of mobile phases A and B. The eluent is directly introduced into a high-resolution mass spectrometer (e.g., Q-TOF) via electrospray ionization (ESI) [3] [86].
- Data Acquisition: Mass spectra are acquired in both positive and negative ionization modes. Data-Dependent Acquisition (DDA) or Data-Independent Acquisition (DIA) modes are used to fragment precursor ions and obtain structural MS/MS data [3] [86] [90].
- Data Processing and Statistical Analysis: Acquired data is processed using specialized software for peak picking, alignment, and lipid identification against databases. Multivariate statistical analyses, including Principal Component Analysis (PCA) and Orthogonal Projections to Latent Structures-Discriminant Analysis (OPLS-DA), are applied to identify lipids that are significantly different between groups (e.g., DH vs. DM) [3] [7].
Diagram 1: Lipidomics experimental workflow.
Derivation and Validation of Conventional RMRS
The RMRS approach focuses on integrating existing clinical laboratory data into a pragmatic scoring system.
Step-by-Step Protocol:
- Cohort Definition and Data Collection: A retrospective or prospective cohort of patients with uncontrolled type 2 diabetes is defined. Demographic, clinical, and routine laboratory data are collected. Key laboratory parameters include serum urea, triglycerides (TG), LDL-cholesterol (LDL-C), high-density lipoprotein cholesterol (HDL-C), uric acid, and estimated glomerular filtration rate (eGFR) [87] [14].
- Parameter Standardization: Continuous variables like urea and the TG/LDL-C ratio are transformed into Z-scores to ensure comparability despite different units of measurement [14].
- Model Derivation: Multivariable logistic regression is performed with hyperuricemia (or co-occurring hyperuricemia and dyslipidemia) as the dependent variable. Independent variables include the standardized laboratory parameters. The regression coefficients (β-coefficients) from the model are used to assign weights to each parameter [87] [14].
- Risk Score Calculation: The RMRS is calculated for each patient. An example formula is: RMRS = (β₁ * Z-urea) + (β₂ * Z-TG/LDL) - (β₃ * Z-eGFR). The score is then often normalized to a 0–100 scale for easier interpretation [14].
- Validation and Stratification: The discriminative performance of the RMRS is evaluated using Receiver Operating Characteristic (ROC) analysis, reporting the Area Under the Curve (AUC). Patients are often stratified into quartiles based on their RMRS to demonstrate a gradient of risk [87] [14].
Diagram 2: Conventional RMRS derivation workflow.
Biological Pathways and Clinical Insights
Mechanistic Insights from Lipidomics
Lipidomics does not merely list altered lipids; it reveals the underlying metabolic pathways that are disturbed in disease. In patients with diabetes and hyperuricemia (DH), lipidomic studies consistently identify glycerophospholipid metabolism and glycerolipid metabolism as the most significantly perturbed pathways [3]. Specific molecular changes include the significant upregulation of certain triglycerides (TGs), phosphatidylethanolamines (PEs), and phosphatidylcholines (PCs), alongside the downregulation of lysophosphatidylcholine plasmalogens [3] [7]. These findings suggest profound disruptions in membrane integrity, cellular signaling, and oxidative stress response, providing testable hypotheses for future drug targets.
Clinical Utility of the RMRS
The RMRS translates complex pathophysiology into a simple, actionable tool. By combining renal (urea, eGFR) and metabolic (TG/LDL ratio) parameters, it captures the intertwined dysfunction that characterizes advanced metabolic disease [87] [14]. Its strength lies in identifying a patient phenotype at high risk for combined cardiorenal complications, enabling clinicians to prioritize these patients for more intensive dietary counseling, pharmacological optimization, and monitoring without the need for advanced instrumentation [14]. This makes it particularly valuable for resource-limited settings or large-scale screening programs.
The choice between lipidomics and conventional RMRS is not a matter of which is superior, but of which is fit-for-purpose. Lipidomics is the definitive tool for discovery-phase research, offering deep biological insights and generating novel biomarker candidates for drug development. In contrast, the conventional RMRS is a translational tool for risk stratification and patient management in both clinical and public health contexts. For a comprehensive research strategy, these approaches can be complementary: lipidomics can uncover novel mechanisms, the understanding of which can then inform the refinement of simpler, more accessible clinical scores like the RMRS.
The Uric Acid to High-Density Lipoprotein Cholesterol Ratio (UHR) has emerged as a clinically significant biomarker that integrates two crucial metabolic pathways. This simple composite marker reflects the balance between atherogenic (uric acid) and atheroprotective (HDL-C) factors, providing a more comprehensive view of metabolic health than either component alone [91] [92]. As a novel index of metabolic and inflammatory status, UHR has demonstrated predictive value across a spectrum of conditions, including cardiovascular disease, diabetes complications, and non-alcoholic fatty liver disease [93] [92] [94].
The clinical relevance of UHR is particularly pronounced in the context of diabetes, where it serves as a potent predictor of metabolic deterioration [91]. Research indicates that UHR is significantly associated with macrovascular and microvascular complications in diabetic patients, offering utility for risk stratification beyond traditional biomarkers [91] [95]. The integration of UHR into clinical practice supports early identification of high-risk individuals and facilitates timely interventions, potentially reducing the burden of cardiovascular and metabolic diseases [92].
UHR in Diabetes and Associated Vascular Complications
Association with Macrovascular and Microvascular Complications
Comprehensive research involving 4,551 patients with type 2 diabetes from the METAL study revealed significant associations between elevated UHR and diabetic vascular complications. After adjusting for multiple confounders, UHR demonstrated a positive correlation with both cardiovascular disease (CVD) and chronic kidney disease (CKD), while its association with diabetic retinopathy remained uncertain [91].
Table 1: UHR Association with Diabetic Complications in the METAL Study (n=4,551)
| Complication | Adjusted Odds Ratio (OR) | 95% Confidence Interval | Statistical Significance |
|---|---|---|---|
| Cardiovascular Disease (CVD) | 1.28 | 1.02–1.61 | Significant |
| Chronic Kidney Disease (CKD) | 1.78 | 1.39–2.27 | Significant |
| Diabetic Retinopathy (DR) | Not significant | Not provided | Not significant |
Stratified analyses revealed that the association between UHR and CVD was particularly pronounced in specific demographic subgroups. Patients older than 65 years showed an OR of 1.41 (95% CI: 1.08–1.85), females demonstrated an OR of 1.43 (95% CI: 1.06–1.94), and those with BMI≥24kg/m² exhibited an OR of 1.57 (95% CI: 1.17–2.11) [91]. These findings suggest that UHR may have enhanced predictive value in these populations.
UHR and Diabetic Kidney Disease: Evidence from Large-Scale Studies
The relationship between UHR and diabetic nephropathy has been substantiated by multiple large-scale studies. An analysis of NHANES data (2001-2018) comprising 7,138 diabetic patients found that 2,872 (40.24%) were diagnosed with diabetic kidney disease (DKD). The study revealed a progressive increase in DKD prevalence across UHR quartiles, from 30.51% in the lowest quartile to 46.72% in the highest quartile [95].
After comprehensive adjustment for confounding variables, a strong positive association persisted between UHR and DKD. Participants in the highest UHR quartile exhibited a 573% increase in DKD prevalence compared to those in the lowest quartile (OR 6.73, 95% CI: 1.97–23.05) [95]. Restricted cubic spline analysis confirmed a positive linear correlation between UHR and DKD, reinforcing UHR's value as a continuous risk indicator.
A separate NHANES analysis (2011-2018) involving 17,227 participants further validated the relationship between UHR and diabetic nephropathy, demonstrating a positive correlation (OR 1.19, 95% CI 1.17–1.22, P < 0.0001) [96]. The area under the ROC curve for UHR was 0.617, indicating modest discriminatory power. Notably, for every unit increase in UHR, a 44% increased risk of DN was observed (OR 1.44, 95% CI 1.23–1.69) [96].
Comparative Performance of UHR Against Traditional and Novel Lipid Biomarkers
UHR Versus Other Lipid Ratios and Novel Indices
Traditional lipid ratios have long been established as cardiovascular risk predictors. A comparative study involving fifty CAD patients and equal controls demonstrated significant elevations in the LDL-c/HDL-c ratio (2.89 vs. 2.60, p<0.003) and TC/HDL ratio (4.44 vs. 3.79, p<0.001) in CAD patients compared to controls [97]. Similarly, serum uric acid levels were significantly higher in CAD patients (5.59 mg/dL vs. 4.35 mg/dL, p<0.001) [97].
Table 2: Comparison of Traditional Lipid Markers and UHR in Predicting Various Conditions
| Biomarker | Predictive Value for CAD | Predictive Value for DKD | Predictive Value for CVD in General Population | Advantages/Limitations |
|---|---|---|---|---|
| UHR | Strongly associated (OR=1.28 for CVD in diabetics) [91] | Strongly associated (OR=6.73 for highest quartile) [95] | Significantly associated with various cardiovascular conditions [92] | Integrates uric acid and HDL; superior to individual parameters |
| LDL-c/HDL-c Ratio | Significantly elevated in CAD patients (2.89 vs 2.60) [97] | Limited data | Established predictor | Well-established but doesn't incorporate uric acid |
| TC/HDL Ratio | Significantly elevated in CAD patients (4.44 vs 3.79) [97] | Limited data | Established predictor | Traditional marker without uric acid component |
| AIP (Atherogenic Index of Plasma) | Limited data | Significantly associated (OR: 1.08 per unit increase) [98] | Limited data | Novel index but less researched than UHR |
When compared against other novel lipid biomarkers, UHR maintains its competitive predictive value. A recent systematic review and meta-analysis examined emerging lipid-related biomarkers including the Visceral Adiposity Index (VAI), Lipid Accumulation Product (LAP), and Atherogenic Index of Plasma (AIP) for microvascular complications in diabetes [98]. The analysis revealed that each 1-unit increase in AIP was associated with an 8% elevation in DKD risk (OR: 1.08, 95% CI: 1.04–1.12), whereas UHR demonstrated substantially higher risk elevation per unit increase in the NHANES analysis [96] [98].
UHR in Cardiovascular Disease Prediction in Non-Diabetic Populations
The predictive value of UHR extends beyond diabetic populations. A comprehensive cross-sectional analysis of NHANES data (2001-2018) including 6,370 adults demonstrated strong associations between elevated UHR and various cardiovascular conditions in the general population [92]. The study identified a nonlinear relationship between UHR and CVD risk, with participants in higher UHR quartiles showing progressively higher CVD rates: Quartile 1 (4.7%), Quartile 2 (6.3%), Quartile 3 (7.4%), and Quartile 4 (11%) [92].
The association between UHR and stroke risk was specifically examined in an analysis of 33,192 individuals from NHANES (1999-2023), of whom 1,363 had a history of stroke [99]. UHR demonstrated a significant positive correlation with stroke risk both as a continuous variable (adjusted OR=1.02, 95% CI 1.01–1.03) and when categorized into quartiles (Q4 OR=1.31, 95% CI 1.11–1.55) [99]. Restricted cubic spline analysis revealed no evidence of a nonlinear relationship, indicating a consistent increase in stroke risk with rising UHR levels.
Advanced Lipidomics and UHR Pathophysiological Connections
Lipidomic Signatures in Diabetic Retinopathy
Sophisticated lipidomic analyses have revealed distinctive serum lipid signatures associated with diabetic retinopathy, providing mechanistic insights that complement UHR's predictive value. A targeted lipidomics study comparing 42 T2DM patients with DR against 42 matched controls without DR identified significant alterations in specific lipid classes [100].
The discovery cohort revealed that three ceramides and seven sphingomyelins were significantly lower in the DR group, while one phosphatidylcholine, two lysophosphatidylcholines, and two sphingomyelins were significantly elevated [100]. Subsequent validation in an independent cohort of 95 matched pairs confirmed that three ceramides and SM(d18:1/24:1) remained substantially lower in the DR group. Most notably, multifactorial logistic regression analysis identified that decreased levels of two specific ceramides - Cer(d18:0/22:0) and Cer(d18:0/24:0) - were independent risk factors for DR occurrence in T2DM patients [100].
These findings establish a crucial connection between UHR and disturbed sphingolipid metabolism, suggesting that UHR may serve as a surrogate marker for these more specific lipidomic alterations that are technically challenging to measure in routine clinical practice.
Pathophysiological Pathways Linking UHR to Metabolic Dysregulation
The relationship between UHR and metabolic complications can be understood through several interconnected physiological pathways. Uric acid contributes to endothelial dysfunction, oxidative stress, and inflammation, while HDL cholesterol exerts protective effects through reverse cholesterol transport, anti-inflammatory, and antioxidant properties [92]. The UHR thus represents a balance between these opposing forces, with elevation indicating a shift toward metabolic dysregulation.
In the context of diabetic nephropathy, hyperuricemia promotes renal injury through multiple mechanisms, including activation of the renin-angiotensin system, induction of endothelial dysfunction, and stimulation of inflammatory cytokines [96]. Simultaneously, low HDL levels impair cholesterol efflux from renal mesangial cells and podocytes, promoting lipid accumulation and cellular injury [98]. The combination of these factors, as captured by UHR, creates a synergistic detrimental effect on renal function.
Figure 1: Pathophysiological Pathways Linking Elevated UHR to Diabetic Complications. Solid lines represent well-established pathways, while dashed lines indicate connections supported by emerging lipidomic evidence [91] [96] [100].
Methodological Protocols for UHR Assessment and Validation
Standardized UHR Measurement Protocols
The methodology for UHR calculation is consistent across studies, utilizing standardized laboratory measurements. Uric acid is typically quantified using the timed endpoint method, while HDL cholesterol is measured by direct immunoassay technique [93]. The UHR is then calculated using the formula: UHR (%) = (UA [mg/dL] ÷ HDL [mg/dL]) × 100 [92] [95].
Throughout NHANES surveys spanning 2001-2018, contract laboratories adhered to strict Westgard rules and followed established quality assurance and quality control protocols, complying with Clinical Laboratory Improvement Amendments standards to ensure data accuracy and consistency [92]. Similar standardized approaches were implemented in the METAL study, where serum samples were analyzed using an AU680 Chemistry Analyzer following standardized protocols [91].
Lipidomics Experimental Workflow
The sophisticated lipidomic analyses that have revealed connections between UHR and specific lipid species employ rigorous methodological approaches. The typical workflow involves:
- Sample Preparation: Serum samples are thawed slowly at 4°C, followed by lipid extraction using isopropanol prechilled at -20°C spiked with internal standards [100].
- Lipid Separation and Detection: Lipids are separated and detected using UPLC (CSH C18 column) coupled with mass spectrometry [100].
- Data Analysis: Partial least squares discriminant analysis models are established to screen differential lipid molecules based on variable importance in projection >1 [100].
- Validation: Multiple reaction monitoring quantification based on mass spectrometry is used to validate screened differential lipid molecules in independent cohorts [100].
Figure 2: Lipidomics Experimental Workflow for Biomarker Discovery. This standardized approach enables identification and validation of specific lipid species associated with diabetic complications [100].
The Scientist's Toolkit: Essential Research Reagents and Materials
Table 3: Essential Research Reagents and Materials for UHR and Lipidomics Studies
| Reagent/Material | Specific Examples | Function/Application | Research Context |
|---|---|---|---|
| Automated Biochemistry Analyzer | AU680 Chemistry Analyzer (Beckman Coulter) [91]; Olympus AU 5400 [94] | Measurement of standard biochemical parameters (UA, HDL-C, etc.) | Core laboratory equipment for UHR calculation |
| HPLC System | High-performance liquid chromatography with automatic HbA1c analyzer [91] | Measurement of glycated hemoglobin (HbA1c) | Diabetes diagnosis and monitoring |
| LC-MS/MS System | UPLC with CSH C18 column coupled to mass spectrometer [100] | Untargeted lipidomics analysis | Discovery of novel lipid biomarkers |
| Internal Standards | SPLASH LIPIDOMIX Mass Spec Standard [100] | Quantification reference for lipidomic analyses | Targeted lipid validation studies |
| CT Scanner for Fat Quantification | Lightspeed VCT 64-row CT scanner [94] | Quantitative measurement of liver fat content | NAFLD research connected to UHR |
| Quality Control Materials | Westgard rules-compliant QC protocols [92] | Ensuring analytical accuracy and precision | All laboratory measurements |
The Uric Acid to HDL Ratio represents a clinically accessible composite marker that integrates information from multiple metabolic pathways. Evidence from large-scale studies demonstrates its significant associations with cardiovascular disease, diabetic nephropathy, and other metabolic complications, often outperforming individual parameters alone [91] [92] [95].
While UHR provides a valuable screening tool for risk stratification, advanced lipidomic approaches have identified more specific lipid species, particularly ceramides, that offer deeper mechanistic insights into the pathogenesis of diabetic complications [100]. The combination of easily obtainable ratios like UHR for initial risk assessment, followed by targeted lipidomic analysis for high-risk individuals, represents a promising stratified medicine approach for managing diabetic complications.
Future research directions should focus on establishing standardized reference ranges for UHR across different populations, elucidating the temporal relationship between UHR elevation and complication development, and further exploring the molecular connections between UHR and specific lipidomic alterations identified through advanced analytical techniques.
Emerging research establishes a critical pathogenic triangle linking dyslipidemia, hyperuricemia (HUA), and insulin resistance (IR), with retinol-binding protein 4 (RBP4) serving as a key molecular mediator. This review synthesizes evidence from lipidomic profiles and mechanistic studies comparing diabetes with hyperuricemia (DH) versus diabetes alone (DM). Analyses reveal that DH patients exhibit distinct lipidomic signatures characterized by significant upregulation of specific triglyceride (TG) and phosphatidylethanolamine (PE) species. Concurrently, RBP4 levels are substantially elevated in HUA and correlate strongly with uric acid, IR indices, and adverse lipid profiles. Experimental data demonstrate that RBP4 directly promotes IR by inhibiting phosphorylation of the insulin receptor substrate-phosphatidylinositol 3-kinase-protein kinase B (IRS/PI3K/Akt) signaling pathway. The collective evidence positions RBP4 as a central node connecting HUA to lipid metabolic dysregulation and IR, offering novel insights for therapeutic targeting in metabolic syndrome.
Comparative Lipidomic Profiling: Diabetes with Hyperuricemia vs. Diabetes Alone
Advanced lipidomic technologies have enabled detailed characterization of lipid disturbances in metabolic diseases. A 2025 untargeted lipidomic study utilizing ultra-high performance liquid chromatography-tandem mass spectrometry (UHPLC-MS/MS) revealed profound alterations in the plasma lipidome of patients with combined diabetes and hyperuricemia (DH) compared to those with diabetes alone (DM) and healthy controls with normal glucose tolerance (NGT) [10].
Key Lipid Alterations
The study identified 1,361 lipid molecules across 30 subclasses, with multivariate analyses showing clear separation trends among DH, DM, and NGT groups [10]. Table 1 summarizes the significantly altered lipid metabolites in DH patients compared to NGT controls.
Table 1: Significantly Altered Lipid Metabolites in Diabetes with Hyperuricemia (DH) vs. Normal Glucose Tolerance (NGT)
| Lipid Category | Specific Lipid Molecules | Regulation in DH | Number of Significantly Altered Lipids |
|---|---|---|---|
| Triglycerides (TGs) | TG(16:0/18:1/18:2) and others | Significantly upregulated | 13 |
| Phosphatidylethanolamines (PEs) | PE(18:0/20:4) and others | Significantly upregulated | 10 |
| Phosphatidylcholines (PCs) | PC(36:1) and others | Significantly upregulated | 7 |
| Phosphatidylinositols (PIs) | Not specified | Significantly downregulated | 1 |
When comparing DH versus DM groups specifically, researchers identified 12 differential lipids that were similarly enriched in the same core metabolic pathways [10]. This finding suggests that hyperuricemia introduces specific lipid disturbances beyond those typically associated with diabetes alone.
Perturbed Metabolic Pathways
Pathway analysis of these differential lipid metabolites revealed their enrichment in six major metabolic pathways. The most significantly perturbed pathways in DH patients were [10]:
- Glycerophospholipid metabolism (impact value: 0.199)
- Glycerolipid metabolism (impact value: 0.014)
These pathway disturbances indicate that hyperuricemia comorbid with diabetes specifically disrupts phospholipid and neutral lipid homeostasis, potentially contributing to the exacerbated metabolic dysfunction observed in these patients.
RBP4 as a Molecular Link Between Hyperuricemia, Insulin Resistance, and Lipid Metabolism
Clinical Associations of RBP4 with Hyperuricemia and Metabolic Parameters
Substantial clinical evidence demonstrates strong associations between elevated RBP4 levels, hyperuricemia, and adverse metabolic parameters across diverse populations.
Table 2: Clinical Correlations of RBP4 with Metabolic Parameters in Hyperuricemia
| Study Population | Key RBP4 Correlations | Strength of Association | Study Reference |
|---|---|---|---|
| HUA Patients (n=30) | Positive correlations with plasma UA, creatinine, FIns, HOMA-IR, TC, TG | Highly significant (p<0.01 for UA, Cr, FIns, HOMA-IR) | [101] |
| HUA Rat Models | Positive correlations with plasma UA, IR index, triglycerides | Statistically significant | [101] |
| General Chinese Population (n=2075) | Strong association with hyperuricemia prevalence | OR: 7.9 (95% CI: 4.18-14.84) for highest vs. lowest RBP4 quartile | [102] |
| Type 2 Diabetes Patients | Independent association with uric acid levels after adjusting for renal function | p<0.001 | [103] |
| NAFLD Patients without Diabetes | Positive correlation with visceral fat area (VFA) and triglycerides | r=0.298, p=0.027 for VFA; r=0.330, p=0.002 for TG | [104] |
A large cross-sectional study in a Chinese population (n=2,075) confirmed the powerful association between RBP4 and hyperuricemia, with the highest RBP4 quartile associated with a 7.9-fold increased risk of hyperuricemia compared to the lowest quartile after adjusting for multiple confounders [102]. The predictive value of RBP4 for hyperuricemia (AUC: 0.749) exceeded that of traditional risk factors [102].
RBP4-Mediated Molecular Mechanisms of Insulin Resistance
Experimental studies have elucidated the precise molecular mechanisms through which RBP4 induces insulin resistance, creating a pathogenic bridge between hyperuricemia and lipid dysregulation.
Mechanism 1: Impairment of Insulin Signaling Cascade RBP4 interferes with early insulin signaling events by reducing tyrosine phosphorylation of insulin receptor substrate (IRS) proteins, particularly IRS-1 [105]. This diminishes the ability of IRS to activate downstream signaling molecules, including phosphatidylinositol 3-kinase (PI3K) and protein kinase B (Akt) [101] [105]. The resultant decrease in Akt phosphorylation reduces glucose transporter type 4 (GLUT4) translocation to the plasma membrane, impairing cellular glucose uptake [105]. Additional mechanisms include RBP4 induction of suppressors of cytokine signaling (SOCS3), which binds to IRS-1 and inhibits its activation, and activation of c-Jun N-terminal kinase (JNK), leading to inhibitory serine phosphorylation of IRS-1 [105].
Mechanism 2: Promotion of Chronic Inflammation RBP4 acts as a pro-inflammatory mediator by stimulating production of tumor necrosis factor-alpha (TNF-α), interleukin-6 (IL-6), and interleukin-1β (IL-1β) in skeletal muscle cells and infiltrating macrophages [105]. This occurs through RBP4 binding to toll-like receptor 4 (TLR4) on muscle cells, triggering nuclear factor kappa-light-chain-enhancer of activated B cells (NF-κB) and mitogen-activated protein kinases (MAPKs) pathways, which promote inflammatory gene transcription [105]. The activated inflammatory cytokines subsequently activate inhibitory kinases (IKK and JNK) that phosphorylate IRS-1 on serine residues, further impairing insulin signaling [105].
Mechanism 3: Alteration of Lipid Metabolism and Mitochondrial Function In skeletal muscle, RBP4 suppresses peroxisome proliferator-activated receptor alpha (PPARα) and its target genes involved in fatty acid β-oxidation, leading to accumulation of intramyocellular lipids and insulin-resistance promoting intermediates like diacylglycerol and ceramides [105]. Additionally, RBP4 decreases peroxisome proliferator-activated receptor gamma coactivator 1-alpha (PGC-1α), a key regulator of mitochondrial biogenesis, resulting in reduced mitochondrial content, decreased oxidative capacity, and increased reactive oxygen species production [105]. This mitochondrial dysfunction further exacerbates insulin resistance through activation of stress kinases that impair insulin signaling.
Experimental Models and Therapeutic Evidence
Experimental Hyperuricemia Models
Animal studies have been instrumental in establishing the causal relationship between hyperuricemia, RBP4 elevation, and insulin resistance. In a rat model of HUA induced by 10% high yeast feed and potassium oxonate injections, followed by adenine gavage, researchers observed significantly elevated plasma RBP4 levels compared to control groups [101]. These HUA rats exhibited clear insulin resistance and demonstrated positive correlations between plasma RBP4 levels and uric acid, IR index, and triglycerides [101].
Crucially, intervention studies in these models demonstrated that after inhibition of RBP4 expression, the phosphorylation levels of the IRS/PI3K/Akt signaling pathway increased, and insulin resistance significantly improved [101]. This therapeutic evidence strongly supports a causal role for RBP4 in HUA-induced insulin resistance rather than merely an association.
Lipidomic Changes in Hyperuricemia and Gout
A comprehensive targeted lipidomic analysis of plasma samples from 94 asymptomatic hyperuricemia subjects, 196 gout patients, and 53 normouricemic healthy controls revealed significant alterations in lipid profiles [7]. The most pronounced changes included upregulation of phosphatidylethanolamines and downregulation of lysophosphatidylcholine plasmalogens/plasmanyls [7].
Notably, more profound lipid disturbances were observed in early-onset hyperuricemia (detected ≤40 years) and early-onset gout without urate-lowering treatment (ULT) [7]. Multivariate statistics successfully differentiated early-onset hyperuricemia and gout groups from healthy controls with >95% accuracy based on lipidomic profiles alone [7]. This finding highlights the sensitivity of lipidomic analysis in detecting metabolic disturbances associated with hyperuricemic states.
Methodological Approaches in Lipid-HUA Research
Lipidomic Profiling Protocols
The UHPLC-MS/MS-based untargeted lipidomic analysis employed in recent studies provides a comprehensive approach for characterizing lipid disturbances in hyperuricemia and diabetes [10]. The standard workflow involves:
Sample Preparation: Plasma samples are mixed with pre-cooled methanol and methyl tert-butyl ether (MTBE), followed by sonication in a low-temperature water bath, standing at room temperature, and centrifugation [10]. The upper organic phase is collected and dried under nitrogen before analysis.
Chromatographic Separation: Analysis is performed using a Waters ACQUITY UPLC BEH C18 column (2.1 mm i.d. × 100 mm length, 1.7 μm particle size) with a mobile phase consisting of 10 mM ammonium formate acetonitrile solution in water and 10 mM ammonium formate acetonitrile isopropanol solution [10].
Mass Spectrometry Detection: UHPLC-MS/MS enables identification and quantification of hundreds of unique lipid species across multiple classes, providing comprehensive lipidomic profiles.
RBP4 Measurement Techniques
Different methodologies for measuring RBP4 levels include:
- Enzyme-Linked Immunosorbent Assay (ELISA): Commonly used in clinical studies [101] [104]
- Immunoturbidimetric Method: Employed in large population studies [102]
- Quantitative Western Blotting: Considered highly reliable for detecting RBP4 elevations associated with insulin resistance [106]
The Scientist's Toolkit: Essential Research Reagents and Materials
Table 3: Key Research Reagents for Investigating RBP4 and Lipid-HUA Associations
| Reagent/Material | Specific Example | Research Application | Function in Experimental Protocols |
|---|---|---|---|
| RBP4 ELISA Kits | Human/Rat RBP4 ELISA Test Kits | Quantifying RBP4 levels in patient/animal model plasma | Specific detection and measurement of RBP4 protein concentrations in biological samples [101] |
| UHPLC-MS/MS System | Waters ACQUITY UPLC BEH C18 column | Untargeted lipidomic profiling | Separation, identification, and quantification of lipid molecules in plasma samples [10] |
| Hyperuricemia Induction Agents | Potassium oxonate, adenine, high yeast feed | Animal model development | Creating experimental hyperuricemia models in rodents for mechanistic studies [101] |
| Lipid Standards | SPLASH LIPIDOMIX Mass Spec Standard | Lipidomic quantification | Internal standards for accurate quantification of lipid species in mass spectrometry [7] |
| Antibodies for Signaling Proteins | Phospho-specific IRS-1, Akt, PI3K antibodies | Mechanistic pathway analysis | Detecting phosphorylation status and activation of insulin signaling pathway components [101] [105] |
| Cell Culture Systems | 3T3-L1 adipocytes | In vitro mechanistic studies | Investigating glucose consumption, insulin signaling, and RBP4 effects on glucose metabolism [101] |
The integrated evidence from lipidomic profiles, clinical associations, and mechanistic studies firmly establishes RBP4 as a critical mediator connecting hyperuricemia to insulin resistance and specific lipid metabolic disturbances. Patients with combined diabetes and hyperuricemia exhibit distinct lipidomic signatures characterized by upregulated triglycerides and phosphatidylethanolamines, with glycerophospholipid and glycerolipid metabolism identified as the most significantly perturbed pathways.
The molecular mechanisms involve RBP4-mediated impairment of IRS/PI3K/Akt insulin signaling, promotion of chronic inflammation, alteration of lipid metabolism, and induction of mitochondrial dysfunction. These pathways create a self-reinforcing cycle that exacerbates metabolic dysregulation. Experimental models demonstrate that RBP4 inhibition improves insulin sensitivity, highlighting its potential as a therapeutic target.
For drug development professionals, these findings suggest that targeting RBP4 or its downstream effects may provide novel approaches for addressing the complex interplay between hyperuricemia, insulin resistance, and dyslipidemia in metabolic syndrome. Future research should focus on developing specific RBP4 antagonists and evaluating their effects on both lipid metabolism and insulin sensitivity in preclinical and clinical studies.
The concurrent presence of hyperglycemia, dyslipidemia, and hyperuricemia represents a significant clinical challenge in metabolic disease management. These conditions frequently cluster in patients with metabolic syndrome, creating a complex pathological network that accelerates end-organ damage and increases cardiovascular risk. While each condition independently contributes to disease pathogenesis, their synergistic interaction creates a metabolic milieu that disproportionately increases the risk of diabetic complications, renal impairment, and cardiovascular events [107] [108]. Understanding these interactions is paramount for developing effective therapeutic strategies.
Substantial clinical evidence confirms the intertwined nature of these metabolic disturbances. A large-scale Korean study demonstrated that hyperuricemia and abdominal obesity synergistically increase the risk of hypertriglyceridemia and low HDL-C, with synergy indices of 1.39-1.61 for hypertriglyceridemia and 1.70-2.03 for low HDL-C across sexes [108]. Additionally, lipidomic analyses reveal that patients with combined diabetes and hyperuricemia exhibit profound alterations in glycerophospholipid and glycerolipid metabolism pathways compared to those with diabetes alone [10]. These clinical observations underscore the necessity of developing animal models that accurately recapitulate this metabolic triad to elucidate underlying mechanisms and test potential interventions.
Animal Models of Combined Metabolic Disorders
Comparative Analysis of Established Models
Several animal models have been developed to study the interactions between hyperglycemia, dyslipidemia, and hyperuricemia, each with distinct advantages and limitations. The table below summarizes the key characteristics of these models:
Table 1: Animal Models of Combined Hyperglycemia, Dyslipidemia, and Hyperuricemia
| Model Type | Induction Method | Metabolic Features | Advantages | Limitations | Key References |
|---|---|---|---|---|---|
| Diabetic Hyperuricemic Hamster | STX (30 mg/kg × 3 days) + PO (350 mg/kg) + adenine (150 mg/kg) + HFCD (15% fat, 0.5% cholesterol) + 5% fructose water | Serum UA: ~500 μmol/LGlu: ~17 mmol/LTG: ~120 mmol/LTC: ~73 mmol/LRenal injury: protein casts, urate deposition | Closer resemblance to human lipid metabolism; suitable for studying gut microbiota interactions | Complex induction protocol; potential for high variability | [5] [109] |
| UOX-KO Spontaneous HUA Mouse | Urate oxidase gene knockout + low-dose STZ (40 mg/kg × 5 days) | Fasting blood UA: significantly elevatedPlasma insulin: elevatedHOMA-IR: increasedPancreatic β-cell damage | Spontaneous hyperuricemia without chemical inhibitors; good for studying β-cell dysfunction | Genetic modification may introduce confounding factors; specialized breeding required | [110] |
| High-Fructose Fed Rodent | 60% fructose diet or 10% fructose in drinking water | HypertensionHyperlipidemiaInsulin resistanceHepatic steatosis | Mimics common dietary patterns in human metabolic disease; gradual disease development | Less severe hyperglycemia; variable response between strains | [111] |
Model Selection Considerations
The choice of animal model depends heavily on research objectives. For studies focused on lipid metabolism and intestinal flora, the hamster model offers particular advantages due to its similarity to human hepatic lipid metabolism and cholesteryl ester transfer protein activities [5] [111]. For investigations of pancreatic β-cell function and insulin resistance, the UOX-KO spontaneous hyperuricemia mouse model provides valuable insights, demonstrating that sustained high uric acid levels promote β-cell damage and exacerbate diabetic phenotypes [110]. Each model replicates different aspects of the human condition, with varying degrees of success in capturing the synergistic interactions between metabolic disturbances.
Experimental Protocols and Methodologies
Comprehensive Induction Protocol for Diabetic Hyperuricemic Hamsters
The most extensively characterized model for studying the triad of hyperglycemia, dyslipidemia, and hyperuricemia involves the combined use of streptozotocin, potassium oxonate, adenine, and a high-fat/cholesterol diet in Golden Syrian hamsters. The detailed methodology is as follows:
Diabetes Induction: Administer streptozotocin (STZ, 30 mg/kg, dissolved in 0.05 M citrate buffer, pH 4.5) via intraperitoneal injection once daily for three consecutive days. After ten days, select animals with fasting blood glucose concentrations >12 mmol/L for further studies [5] [109].
Hyperuricemia and Dyslipidemia Induction:
- Administer potassium oxonate (PO, 350 mg/kg/d) and adenine (150 mg/kg/d) via intragastric gavage, suspended in 0.5% sodium carboxymethyl cellulose (CMC-Na) solution.
- Provide 5% fructose in drinking water.
- Feed a high-fat/cholesterol diet (HFCD) containing 15% fat and 0.5% cholesterol [5].
Experimental Groups: A comprehensive study should include six groups (n=6 each):
- Normal control (standard diet)
- HFCD control
- Diabetic control (standard diet)
- Diabetic + HFCD
- Diabetic + PO/adenine/fructose
- Diabetic + HFCD + PO/adenine/fructose (complete model) [5] [109]
Duration: The combined metabolic disorders typically develop within 4 weeks of induction, after which animals can be euthanized for tissue collection and analysis.
Assessment Parameters and Analytical Techniques
Comprehensive metabolic characterization requires multiple assessment modalities:
Serum Biochemical Analysis: Measure uric acid, glucose, triglycerides, total cholesterol, urea nitrogen, creatinine, and insulin levels using standard automated clinical chemistry analyzers or ELISA [5] [110].
Tissue Analysis:
- Evaluate hepatic xanthine oxidase activity as a key enzyme in uric acid production.
- Assess renal histopathology for glomerular mesangial cells and matrix proliferation, protein casts, and urate deposition.
- Measure renal expressions of plasminogen activator inhibitor-1 (PAI-1), transforming growth factor-β (TGF-β), and vascular endothelial growth factor (VEGF) [5].
Gut Microbiota Analysis:
- Analyze fecal short-chain fatty acids content using gas chromatography.
- Characterize gut microbiota composition through 16S rRNA sequencing, with particular attention to Firmicutes to Bacteroidetes ratios and specific genera such as Lleibacterium [5].
Lipidomic Profiling:
- Perform untargeted lipidomics using UHPLC-MS/MS to identify and quantify lipid species.
- Identify differentially expressed lipids and perform pathway enrichment analysis for glycerophospholipid and glycerolipid metabolism [10] [112].
Table 2: Key Pathophysiological Features of Combined Metabolic Disorders in Animal Models
| Pathological Domain | Key Findings | Underlying Mechanisms | Assessment Methods |
|---|---|---|---|
| Glucolipid Metabolism | Synergistic worsening of hyperglycemia and dyslipidemia | Increased insulin resistance; impaired β-cell function; enhanced hepatic lipogenesis | Serum glucose, insulin, TG, TC; HOMA-IR; oral GTT |
| Renal Injury | Glomerular mesangial cell proliferation; matrix expansion; protein casts; urate deposition | Increased TGF-β and PAI-1 expression; decreased VEGF; oxidative stress | Histopathology; serum creatinine/urea; renal gene expression |
| Gut Microbiota Alterations | Decreased Firmicutes/Bacteroidetes ratio; increased Lleibacterium; altered SCFA profile | Disrupted epithelial integrity; microbial dysbiosis; inflammation | 16S rRNA sequencing; SCFA measurement; intestinal histology |
| Lipidomic Profile | Upregulation of TGs, PEs, PCs; downregulation of PI; altered glycerophospholipid metabolism | Disrupted membrane lipid composition; signaling pathway alterations | UHPLC-MS/MS; multivariate statistical analysis; pathway enrichment |
Metabolic Cross-Talk: Mechanisms and Pathways
The interaction between hyperglycemia, dyslipidemia, and hyperuricemia creates a self-perpetuating cycle of metabolic dysfunction through multiple interconnected pathways. The following diagram illustrates the core mechanisms and their interactions:
Diagram 1: Metabolic Cross-Talk Between Hyperglycemia, Dyslipidemia, and Hyperuricemia. This diagram illustrates the bidirectional relationships and key pathological mechanisms connecting the three metabolic disorders. UA: Uric Acid; IR: Insulin Resistance; OX: Oxidative Stress; INFLAM: Inflammation; GUT: Gut Dysbiosis; RENAL: Renal Injury; LIPIDOM: Lipidomic Changes; SCFA: Short-Chain Fatty Acids; ROS: Reactive Oxygen Species; TGF-β: Transforming Growth Factor Beta.
The diagram above captures the complex, bidirectional relationships between the three metabolic disturbances. Key synergistic interactions include:
Uric Acid-Insulin Resistance Nexus: Hyperuricemia impairs insulin signaling by activating inflammatory pathways and inducing oxidative stress, while insulin resistance reduces renal uric acid excretion, creating a vicious cycle that perpetuates both conditions [110] [22].
Lipid-Glucose Interplay: Dyslipidemia promotes insulin resistance through lipotoxicity and increased reactive oxygen species production, while hyperglycemia drives de novo lipogenesis, further exacerbating lipid abnormalities [5] [112].
Gut-Kidney Axis: Gut dysbiosis characterized by decreased Firmicutes to Bacteroidetes ratios and altered short-chain fatty acid profiles reduces uric acid degradation by intestinal bacteria and promotes systemic inflammation, contributing to both hyperuricemia and insulin resistance [5].
Lipidomic Profiling: Distinct Signatures in Combined Disorders
Advanced lipidomic technologies have revealed distinctive lipid signatures that differentiate the combined metabolic disorders from isolated conditions. The following workflow illustrates the analytical process for characterizing these lipidomic alterations:
Diagram 2: Lipidomic Analysis Workflow for Metabolic Disorder Characterization. UHPLC-MS/MS: Ultra-High Performance Liquid Chromatography-Tandem Mass Spectrometry; MTBE: Methyl tert-butyl ether; PCA: Principal Component Analysis; OPLS-DA: Orthogonal Partial Least Squares-Discriminant Analysis; VIP: Variable Importance in Projection; ROC: Receiver Operating Characteristic.
Lipidomic studies comparing diabetes with hyperuricemia (DH) versus diabetes alone (DM) have revealed profound alterations in lipid metabolism. A comprehensive analysis identified 1,361 lipid molecules across 30 subclasses, with 31 significantly altered lipid metabolites in DH patients compared to healthy controls [10]. The most significantly perturbed pathways included glycerophospholipid metabolism (impact value: 0.199) and glycerolipid metabolism (impact value: 0.014) [10].
Table 3: Key Lipidomic Alterations in Combined Diabetes and Hyperuricemia
| Lipid Category | Specific Lipid Species | Regulation in DH vs Control | Biological Significance | Potential Diagnostic Utility |
|---|---|---|---|---|
| Triglycerides (TGs) | TG(16:0/18:1/18:2)12 other TGs | Significantly upregulated | Energy storage; insulin resistance association | Strong biomarkers for metabolic syndrome |
| Phosphatidylethanolamines (PEs) | PE(18:0/20:4)9 other PEs | Significantly upregulated | Membrane fluidity; signaling precursors | Indicators of membrane remodeling |
| Phosphatidylcholines (PCs) | PC(36:1)6 other PCs | Significantly upregulated | Membrane integrity; lipid transport | Associated with cardiovascular risk |
| Phosphatidylinositol (PI) | Not specified | Significantly downregulated | Cell signaling; insulin action | Potential early metabolic dysfunction marker |
| Lipid Classes | GlycerophospholipidsGlycerolipids | Pathway enrichment | Central metabolic pathways | Therapeutic targeting opportunities |
These lipidomic alterations not only provide insights into disease mechanisms but also offer potential diagnostic biomarkers. Receiver operating characteristic (ROC) curve analyses have demonstrated that combined lipid panels can effectively distinguish between patient groups, with specific lipid classes such as lysophosphatidylinositols (LPIs) showing particular promise as diagnostic biosignatures for diabetes [112].
The Scientist's Toolkit: Essential Research Reagents
Table 4: Key Research Reagents for Modeling Metabolic Disorders
| Reagent/Chemical | Function in Model Induction | Typical Dosage/Concentration | Mechanism of Action | Considerations |
|---|---|---|---|---|
| Streptozotocin (STZ) | Induction of diabetes | 30-40 mg/kg for 3-5 days | Pancreatic β-cell cytotoxin; DNA alkylation | Fresh preparation in citrate buffer (pH 4.5) required due to instability |
| Potassium Oxonate (PO) | Induction of hyperuricemia | 350 mg/kg/day | Uricase inhibitor; reduces uric acid degradation | Administer via gavage; often combined with adenine |
| Adenine | Enhancement of hyperuricemia | 150 mg/kg/day | Promotes purine metabolism; increases uric acid production | Renal function monitoring recommended due to potential nephrotoxicity |
| High-Fat/Cholesterol Diet (HFCD) | Induction of dyslipidemia | 15% fat, 0.5% cholesterol | Disrupts lipid metabolism; promotes insulin resistance | Hamster model preferred for human-like lipid metabolism |
| Fructose Water | Metabolic stressor | 5-10% in drinking water | Enhances hepatic lipogenesis; promotes hyperuricemia | Mimics sugar-sweetened beverage consumption in humans |
| Citrate Buffer | STZ vehicle | 0.05 M, pH 4.5 | Maintains STZ stability; ensures proper dissolution | Critical for STZ efficacy; improper pH reduces potency |
Animal models that simultaneously recapitulate hyperglycemia, dyslipidemia, and hyperuricemia provide invaluable tools for understanding the complex interactions between these metabolic disorders. The synergistic effects observed in these models highlight the importance of comprehensive therapeutic approaches that target multiple metabolic pathways rather than individual conditions in isolation.
The characterized animal models, particularly the diabetic hyperuricemic hamster model and the UOX-KO spontaneous hyperuricemia mouse model, faithfully replicate key aspects of human disease pathophysiology, including renal injury, altered gut microbiota, distinct lipidomic profiles, and insulin resistance. These models enable the evaluation of potential therapeutic interventions that can simultaneously address multiple metabolic defects, offering promising avenues for the development of more effective treatments for metabolic syndrome and its complications.
Future research should focus on further elucidating the molecular mechanisms underlying the observed synergistic interactions, with particular emphasis on the gut-kidney axis, lipid-mediated signaling pathways, and the role of oxidative stress in perpetuating metabolic dysfunction. Additionally, standardized protocols for model induction and characterization will facilitate comparison across studies and enhance the translational potential of preclinical findings.
In the context of diabetes mellitus (DM) and its common comorbidity, hyperuricemia, specific alterations in the lipidome are increasingly recognized as critical mediators of renal and cardiovascular pathology. Dyslipidemia in type 2 diabetes typically presents as hypertriglyceridemia, reduced high-density lipoprotein cholesterol (HDL-C), and a predominance of small dense low-density lipoprotein (LDL) particles, all of which promote atherogenesis [14]. Beyond these conventional lipid measures, advanced lipidomic technologies now enable researchers to identify specific lipid species and metabolic pathways that are differentially regulated in patients with concurrent diabetes and hyperuricemia, providing deeper insights into the mechanistic links between lipid metabolism and end-organ damage [10]. This guide objectively compares lipidomic profiles and their clinical correlations to inform targeted therapeutic strategies.
Comparative Lipidomic Profiling: Diabetes with Hyperuricemia vs. Diabetes Alone
Distinct Lipid Species Signatures
Advanced lipidomic analyses reveal significant differences in plasma lipid profiles between patients with diabetes mellitus combined with hyperuricemia (DH) and those with diabetes mellitus (DM) alone. A recent untargeted lipidomic study utilizing ultra-high performance liquid chromatography-tandem mass spectrometry (UHPLC-MS/MS) identified 1,361 lipid molecules across 30 subclasses, with multivariate analyses demonstrating significant separation trends among DH, DM, and normal glucose tolerance (NGT) groups [10].
Table 1: Significantly Altered Lipid Metabolites in Diabetes with Hyperuricemia (DH) vs. Normal Controls
| Lipid Category | Specific Lipid Species | Regulation in DH | Biological Relevance |
|---|---|---|---|
| Triglycerides (TGs) | TG(16:0/18:1/18:2) and 12 other TGs | Significantly upregulated | Associated with renal function decline and cardiovascular risk |
| Phosphatidylethanolamines (PEs) | PE(18:0/20:4) and 9 other PEs | Significantly upregulated | Implicated in membrane fluidity and cell signaling |
| Phosphatidylcholines (PCs) | PC(36:1) and 6 other PCs | Significantly upregulated | Related to lipoprotein metabolism and vascular health |
| Phosphatidylinositol (PI) | Not specified | Significantly downregulated | Important for cell signaling and membrane trafficking |
When comparing DH versus DM groups specifically, researchers identified 12 differential lipid molecules that were predominantly enriched in the same core metabolic pathways (glycerophospholipid and glycerolipid metabolism) [10]. This suggests that hyperuricemia complicating diabetes induces specific modifications to the lipidomic profile beyond diabetes alone, potentially accelerating the pathogenesis of complications.
Lipid Variability as a Risk Predictor
Beyond absolute lipid levels, lipid variability—visit-to-visit fluctuations in lipid parameters—has emerged as a significant predictor of microvascular complications in diabetic patients. A systematic review of seven studies demonstrated that higher levels of LDL, HDL, and triglyceride variability can have adverse effects on microvascular complications, especially nephropathy and neuropathic complications [113].
Table 2: Lipid Variability and Association with Microvascular Complications in Diabetes
| Lipid Parameter | Primary Complication Association | Clinical Correlation |
|---|---|---|
| LDL variability | Nephropathy | Associated with development of albuminuria and GFR decline |
| HDL variability | Nephropathy, Neuropathy | Reduced HDL variability showed protective effect against microalbuminuria |
| Triglyceride variability | Nephropathy, Neuropathy | TG variability associated with microalbuminuria incidence |
| Remnant Cholesterol variability | Multiple microvascular complications | Pathogenic mechanism not fully understood |
Notably, the relationship between lipid variation and retinopathy remains less clear, with some studies showing no apparent association [113]. This complication-specific pattern of lipid correlation highlights the need for organ-focused risk assessment and management strategies.
Pathophysiological Mechanisms: Linking Lipid Species to Tissue Damage
Renal Lipotoxicity Pathways
Lipid accumulation in renal structures drives kidney disease through multiple interconnected mechanisms. Excessive free fatty acids (FFAs), especially palmitic acid, are taken up by renal cells (particularly proximal tubular epithelial cells and podocytes) primarily through the CD36 scavenger receptor, resulting in increased reactive oxygen species (ROS) production, mitochondrial membrane potential depolarization, ATP depletion, and activation of apoptotic pathways [114] [115].
The CD36 receptor is highly expressed in renal proximal and distal tubular epithelial cells, podocytes, mesangial cells, and interstitial macrophages, with levels elevated in patients and animal models with kidney damage [114]. Chronic inflammation, a feature of obesity and metabolic disease, induces CD36 expression, creating a vicious cycle that aggravates kidney damage and accelerates disease progression [114]. Beyond CD36, fatty acid transport proteins (FATPs), specifically FATP1 (SLC27A1), FATP2 (SLC27A2), and FATP4 (SLC27A4), also facilitate FFA cellular uptake in the kidneys, with FATP4 expression increased in high-fat diet models [114].
Figure 1: Renal Lipotoxicity Pathway Mediated by Lipid Receptors - This diagram illustrates the mechanistic pathway through which lipid overload, mediated by specific receptors like CD36 and FATPs, leads to cellular damage and chronic kidney disease.
Cardiovascular Risk Pathways
The interrelationship between dyslipidemia and hyperuricemia significantly amplifies cardiovascular risk in diabetic patients. Both conditions share overlapping pathophysiological mechanisms, including insulin resistance, chronic low-grade inflammation, oxidative stress, and endothelial dysfunction [14]. The interaction between lipid abnormalities and elevated uric acid exacerbates vascular injury through oxidative stress, endothelial dysfunction, and stimulation of the renin-angiotensin-aldosterone system [14].
Lipid disorders promote atherosclerosis through the deposition of atherogenic lipoproteins in the arterial intima, triggering inflammatory responses and structural changes in blood vessels [116]. Dyslipidemia—characterized by high levels of LDL-C, low HDL-C, and elevated triglycerides—creates conditions favorable for developing atherosclerotic plaques, which underlie most cardiovascular events [116].
Methodological Approaches in Lipidomics Research
Core Analytical Workflow
Lipidomic analysis relies on sophisticated separation and detection technologies to comprehensively characterize lipid profiles. The standard workflow typically involves sample preparation, chromatographic separation, mass spectrometric detection, and data analysis [10] [117].
Figure 2: Lipidomics Experimental Workflow - This diagram outlines the key steps in lipidomic profiling from sample collection to data analysis and pathway identification.
Essential Research Reagents and Tools
Table 3: Research Reagent Solutions for Lipidomic Studies
| Reagent/Instrument | Specific Function | Application Example |
|---|---|---|
| UHPLC-MS/MS System | High-resolution separation and detection of lipid molecules | Identification of 1,361 lipid molecules across 30 subclasses [10] |
| C18 Reverse Phase Columns | Chromatographic separation of complex lipid mixtures | Waters ACQUITY UPLC BEH C18 column for lipid separation [10] |
| Lipid Extraction Solvents (MTBE) | Efficient extraction of lipids from biological samples | Methyl tert-butyl ether (MTBE) used for plasma lipid extraction [10] |
| Internal Standard Mixtures | Quantification and quality control during analysis | Isotope-labeled internal standards for lipid quantification [117] |
| Multivariate Analysis Software | Statistical analysis of complex lipidomic data | MetaboAnalyst 5.0 for pathway analysis [10] |
Therapeutic Implications and Future Directions
Targeted Interventions
Understanding specific lipid disturbances enables more precise therapeutic approaches. While conventional lipid-lowering agents like statins remain foundational, research suggests that polyunsaturated fatty acids (PUFA) such as eicosapentaenoic acid (EPA) and docosahexaenoic acid (DHA) may help slow the progression of chronic kidney disease [114]. Lifestyle interventions, especially dietary adjustments, also contribute to improved clinical outcomes in patients with CKD by modulating lipid metabolism [114].
Emerging therapeutic strategies targeting lipid droplet dynamics include photodynamic therapy, gene editing, and gut microbiota modulation, although these approaches remain investigational [118]. Pharmacological agents such as SGLT2 inhibitors and GLP-1 receptor agonists may also influence lipid metabolism, potentially providing dual benefits for glycemic and lipid control [14].
Risk Stratification Models
The development of integrated risk scores represents a promising approach for identifying high-risk patients. The Renal–Metabolic Risk Score (RMRS), which incorporates urea, TG/HDL ratio, and eGFR parameters, has demonstrated moderate discriminative performance in identifying patients with uncontrolled T2DM at risk for combined hyperuricemia and dyslipidemia [14]. Such tools may be particularly valuable in resource-limited settings to support early risk stratification and timely intervention.
Lipidomic profiling reveals distinct differences in lipid species between patients with diabetes alone and those with concurrent hyperuricemia, with specific triglycerides, phosphatidylethanolamines, and phosphatidylcholines significantly upregulated in the latter group. These specific lipid alterations activate pathways leading to renal and cardiovascular damage through mechanisms including CD36-mediated lipotoxicity, oxidative stress, and inflammation. Advanced lipidomic methodologies, particularly UHPLC-MS/MS platforms, enable precise characterization of these lipid signatures, providing opportunities for improved risk stratification and targeted therapeutic interventions. Future research should focus on validating these lipid biomarkers in larger, more diverse cohorts and developing targeted therapies that specifically address the lipid disturbances identified in high-risk patient populations.
Conclusion
The integration of lipidomics into metabolic disease research provides an unprecedented, granular view of the pathological disturbances in diabetes complicated by hyperuricemia. The consistent identification of specific lipid species and pathways, notably the upregulation of TGs, PEs, and PCs, alongside disrupted glycerophospholipid metabolism, underscores a unique metabolic fingerprint for this patient subgroup that is not captured by routine clinical chemistry. Future directions must focus on the rigorous multi-center validation of these lipidomic signatures to move them from research tools to clinically actionable diagnostics. Furthermore, elucidating the causal links between these lipid alterations, insulin resistance, renal impairment, and gut microbiota dysbiosis will open new avenues for targeted drug development and personalized therapeutic interventions, ultimately aiming to mitigate the elevated cardiovascular and renal risks in this population.
References
- 1. The link between hyperuricemia and diabetes: insights from a ... [https://pmc.ncbi.nlm.nih.gov/articles/PMC11842261/]
- 2. Hyperuricemia and diabetes mellitus when occurred together ... [https://pmc.ncbi.nlm.nih.gov/articles/PMC9034537/]
- 3. UHPLC-MS/MS-based plasma untargeted lipidomic ... [https://www.frontiersin.org/journals/molecular-biosciences/articles/10.3389/fmolb.2025.1656458/full]
- 4. Associations of Plasma Lipidomic Profiles with Uric Acid ... [https://link.springer.com/article/10.1007/s43657-024-00157-x]
- 5. Evaluation of the Effects of High Uric Acid on Glucolipid ... [https://pmc.ncbi.nlm.nih.gov/articles/PMC12474470/]
- 6. Hyperuricemia and its related diseases: mechanisms and ... [https://www.nature.com/articles/s41392-024-01916-y]
- 7. Alterations in lipidome profiles distinguish early-onset ... [https://pmc.ncbi.nlm.nih.gov/articles/PMC10693150/]
- 8. Lipidomics unveils the complexity of the lipidome in metabolic ... [https://pmc.ncbi.nlm.nih.gov/articles/PMC5786598/]
- 9. Dynamic lipidome alterations associated with human ... [https://www.nature.com/articles/s42255-023-00880-1]
- 10. UHPLC-MS/MS-based plasma untargeted lipidomic ... [https://www.frontiersin.org/journals/molecular-biosciences/articles/10.3389/fmolb.2025.1656458/abstract]
- 11. Alterations in lipidome profiles distinguish early-onset ... [https://arthritis-research.biomedcentral.com/articles/10.1186/s13075-023-03204-6]
- 12. Lipid profiling identifies modifiable signatures of ... [https://www.nature.com/articles/s41591-024-03279-x]
- 13. Lipidome characterisation and sex-specific differences in type 1 and... [https://cardiab.biomedcentral.com/articles/10.1186/s12933-024-02202-5]
- 14. Interrelationship Between Dyslipidemia and Hyperuricemia ... [https://pmc.ncbi.nlm.nih.gov/articles/PMC12562356/]
- 15. Interrelationship Between Dyslipidemia and Hyperuricemia ... [https://www.mdpi.com/2227-9032/13/20/2605]
- 16. Discovery of lipid profiles of type 2 diabetes associated ... [https://www.sciencedirect.com/science/article/abs/pii/S000989812100187X]
- 17. Correlation of serum uric acid with lipid profile in patients with ... [https://pmc.ncbi.nlm.nih.gov/articles/PMC9480681/]
- 18. Metabolic remodeling of glycerophospholipids acts as a ... [https://pmc.ncbi.nlm.nih.gov/articles/PMC9846071/]
- 19. Combined untargeted and targeted lipidomics approaches ... [https://pubmed.ncbi.nlm.nih.gov/38083989/]
- 20. Association between the triglyceride-glucose index and ... [https://pmc.ncbi.nlm.nih.gov/articles/PMC12575192/]
- 21. Interplay and Potential for Targeted Therapies [https://www.mdpi.com/2673-8937/5/3/30]
- 22. Metabolic crosstalk and therapeutic interplay between ... [https://www.sciencedirect.com/science/article/pii/S0168822725002189]
- 23. Integration of Proteomic and Lipidomic Analysis Reveals ... [https://pmc.ncbi.nlm.nih.gov/articles/PMC12534162/]
- 24. Integrated lipidomics and proteomics network analysis ... [https://translationalneurodegeneration.biomedcentral.com/articles/10.1186/s40035-020-00215-0]
- 25. 16 Guidelines for Effective Data Visualizations in ... - Luís Cruz [https://luiscruz.github.io/2021/03/01/effective-visualizations.html]
- 26. Targeted Lipidomics [https://www.irvinginstitute.columbia.edu/services/targeted-lipidomics]
- 27. Recent advances in analytical strategies for mass ... [https://pmc.ncbi.nlm.nih.gov/articles/PMC7525665/]
- 28. Comparative Analysis of Untargeted and Targeted ... [https://www.creative-proteomics.com/resource/untargeted-targeted-lipidomics.htm]
- 29. Development and validation of a green/blue UHPLC-MS ... [https://www.nature.com/articles/s41598-025-15614-4]
- 30. RP-UHPLC/MS/MS Provides Enhanced Lipidomic Profiling of ... [https://www.medrxiv.org/content/10.1101/2025.09.15.25335762v1.full-text]
- 31. Development of a UHPLC-MS/MS Method for Quantitative ... [https://pmc.ncbi.nlm.nih.gov/articles/PMC12474191/]
- 32. Analytical quality control in targeted lipidomics [https://www.sciencedirect.com/science/article/pii/S0003267025006191]
- 33. Evaluating the risk of developing hyperuricemia in patients ... [https://pmc.ncbi.nlm.nih.gov/articles/PMC10976486/]
- 34. Distinct hyperuricemia trajectories are associated with ... [https://www.sciencedirect.com/science/article/pii/S0939475323000765]
- 35. Sample Preparation Methods for Lipidomics Approaches ... [https://pmc.ncbi.nlm.nih.gov/articles/PMC7696154/]
- 36. Lipidomics from sample preparation to data analysis [https://link.springer.com/article/10.1007/s00216-019-02241-y]
- 37. QC Metrics That Matter at Cohort Scale [https://www.cd-genomics.com/pop-genomics/resources/qc-metrics-batch-effects.html]
- 38. Introduction of a lipidomics scoring system for data quality ... [https://pmc.ncbi.nlm.nih.gov/articles/PMC12345285/]
- 39. Quality control requirements for the correct annotation of ... [https://www.nature.com/articles/s41467-021-24984-y]
- 40. The effect of lipid metabolism disorder on patients with ... [https://pmc.ncbi.nlm.nih.gov/articles/PMC10598229/]
- 41. Lipidomics as a tool of predicting progression from non ... [https://pmc.ncbi.nlm.nih.gov/articles/PMC9076475/]
- 42. The Hitchhiker's Guide to Untargeted Lipidomics Analysis [https://pmc.ncbi.nlm.nih.gov/articles/PMC8624948/]
- 43. Multivariate Data Analysis Methods and Their Application in ... [https://pmc.ncbi.nlm.nih.gov/articles/PMC12280249/]
- 44. How to deal with lipidomics data? - Webinars [https://www.lipotype.com/lipidomics-webinars/how-to-deal-with-lipidomics-data/?srsltid=AfmBOorMPzoOzkzN5l2ojFN4ImPWJGZJBJea5jM5Gp9n7FRn2ZjaBOZW]
- 45. Lipidomics data analysis: Enrichment analysis [https://www.lipotype.com/lipidomics-applications/lipidomics-data-analysis-enrichment-analysis/?srsltid=AfmBOoqQRVL-WtfSCF5zpuoKXkIJR6kacEpucLPqTuWzxGjB55hrZO4N]
- 46. Lipid Analysis Software [https://www.lipidmaps.org/resources/tools/lm_software]
- 47. Lipidomic and transcriptomic profiling reveal alterations in ... [https://www.nature.com/articles/s41598-025-12077-5]
- 48. Diagnosing Lipid Disorders [https://nyulangone.org/conditions/lipid-disorders/diagnosis]
- 49. Diabetes mediates the association between uric acid to ... [https://www.nature.com/articles/s41598-025-19388-7]
- 50. The Association Between the Triglyceride Glucose Index ... [https://www.mdpi.com/2072-6643/17/9/1462]
- 51. The Role of Advanced Lipid Testing in the Prediction ... [https://pmc.ncbi.nlm.nih.gov/articles/PMC4060612/]
- 52. Exploring lipidomics in biomarker discovery [https://www.sciencedirect.com/science/article/pii/S0009898125005777?dgcid=rss_sd_all]
- 53. Assessment of urate-lowering therapies on lipid metabolism ... [https://pmc.ncbi.nlm.nih.gov/articles/PMC12454035/]
- 54. Lipidomics Reveals a Tissue-Specific Fingerprint [https://www.frontiersin.org/journals/physiology/articles/10.3389/fphys.2018.01165/full]
- 55. Comprehensive mass spectrometry lipidomics of human ... [https://pubmed.ncbi.nlm.nih.gov/36773847/]
- 56. Lipidomics of the brain, retina, and biofluids [https://www.nature.com/articles/s41398-020-01080-1]
- 57. Research on Lipidomic Profiling and Biomarker ... [https://www.mdpi.com/2227-9059/12/12/2827]
- 58. NIST interlaboratory comparison exercise for lipidomics using ... [https://pmc.ncbi.nlm.nih.gov/articles/PMC5711491/]
- 59. of Targeted Lipidome Analyses (Lipidyzer) in Plasma... Reproducibility [https://pmc.ncbi.nlm.nih.gov/articles/PMC7823270/]
- 60. - Inter of ultrasound-based fat fraction for... platform reproducibility [https://insightsimaging.springeropen.com/articles/10.1186/s13244-024-01611-0]
- 61. LipidIN: a comprehensive repository for flash platform ... [https://www.nature.com/articles/s41467-025-59683-5]
- 62. Exploring lipidomics in biomarker discovery [https://pubmed.ncbi.nlm.nih.gov/41197707/]
- 63. Challenges with Standardization in Lipidomics [https://www.azolifesciences.com/article/Challenges-with-Standardization-in-Lipidomics.aspx]
- 64. Ex vivo instability of lipids in whole blood: preanalytical ... [https://pmc.ncbi.nlm.nih.gov/articles/PMC10208886/]
- 65. Challenges in Lipidomics Biomarker Identification [https://www.mdpi.com/2218-1989/14/8/461]
- 66. A concise review on lipidomics analysis in biological samples [https://pmc.ncbi.nlm.nih.gov/articles/PMC8923307/]
- 67. Robust Statistical Methods for Analysis of Biomarkers ... [https://pmc.ncbi.nlm.nih.gov/articles/PMC3177604/]
- 68. Increasing reproducibility, robustness, and generalizability of ... [https://journals.plos.org/ploscompbiol/article?id=10.1371/journal.pcbi.1010260]
- 69. The effect of lipid metabolism disorder on patients with ... [https://www.nature.com/articles/s41598-023-45564-8]
- 70. Coupling Machine Learning and Lipidomics as a Tool to ... [https://pmc.ncbi.nlm.nih.gov/articles/PMC8004861/]
- 71. A computational workflow for discovery of lipids identifies ... [https://pmc.ncbi.nlm.nih.gov/articles/PMC5374061/]
- 72. Artificial Intelligence Platform for Mass Spectrometry based ... [https://hammer.purdue.edu/articles/thesis/Artificial_Intelligence_Platform_for_Mass_Spectrometry_based_Lipidomics_Experimentation_and_Data_Analysis/27188229]
- 73. Associations of Plasma Lipidomic Profiles with Uric Acid ... [https://pmc.ncbi.nlm.nih.gov/articles/PMC11584823/]
- 74. Integration of machine learning and experimental ... [https://www.nature.com/articles/s41401-025-01539-1]
- 75. AI uncovers new lipid-lowering effects in existing FDA ... [https://www.news-medical.net/news/20250731/AI-uncovers-new-lipid-lowering-effects-in-existing-FDA-approved-drugs.aspx]
- 76. Multicenter Studies: Relevance, Design and Implementation [https://pubmed.ncbi.nlm.nih.gov/34992183/]
- 77. A Guide on Organizing a Multicenter Clinical Trial: the WRIST ... [https://pmc.ncbi.nlm.nih.gov/articles/PMC2917608/]
- 78. Lipidomics based on UHPLC/Q-TOF-MS to characterize ... [https://www.sciencedirect.com/science/article/pii/S2405844024023570]
- 79. Serum lipidomics profiles reveal potential lipid markers for ... [https://pmc.ncbi.nlm.nih.gov/articles/PMC9434798/]
- 80. Biomarkers in Medicines Development—From Discovery to ... [https://pmc.ncbi.nlm.nih.gov/articles/PMC9086587/]
- 81. FDA's New “Plausible Mechanism Pathway” and Other ... [https://www.arnoldporter.com/en/perspectives/advisories/2025/11/fda-plausible-mechanism-pathway-and-other-initiatives-drugs-for-ultra-rare-conditions]
- 82. Pharma Pulse: FDA Advances New Approval Pathway, as ... [https://www.pharmaceuticalcommerce.com/view/pharma-pulse-fda-advances-new-approval-pathway]
- 83. Identification of lipid biomarker from serum in patients with ... [https://pmc.ncbi.nlm.nih.gov/articles/PMC7507726/]
- 84. Applicability of Artificial Intelligence in the Field of Clinical ... [https://pmc.ncbi.nlm.nih.gov/articles/PMC11140245/]
- 85. Evaluation of levels of uric acid and lipid profile in hospitalized ... [https://bmcresnotes.biomedcentral.com/articles/10.1186/s13104-023-06429-5]
- 86. Mass-Spectrometry-Based Lipidomics Discriminates ... [https://pmc.ncbi.nlm.nih.gov/articles/PMC9964724/]
- 87. Integrating Renal and Metabolic Parameters into a Derived ... [https://www.mdpi.com/1648-9144/61/11/2042]
- 88. Lipidomics: Techniques, applications, and outcomes ... [https://pmc.ncbi.nlm.nih.gov/articles/PMC5085849/]
- 89. Mass spectrometry based shotgun lipidomics-a critical ... [https://pmc.ncbi.nlm.nih.gov/articles/PMC6195124/]
- 90. Advancements in Mass Spectrometry-Based Targeted ... [https://www.mdpi.com/1420-3049/29/24/5934]
- 91. Association Between Uric Acid to HDL Cholesterol Ratio and ... [https://pmc.ncbi.nlm.nih.gov/articles/PMC9869791/]
- 92. Association between the uric acid-to-HDL-cholesterol ratio ... [https://lipidworld.biomedcentral.com/articles/10.1186/s12944-025-02551-4]
- 93. Association of serum uric acid to high-density lipoprotein ... [https://pmc.ncbi.nlm.nih.gov/articles/PMC12628874/]
- 94. Association between the ratio of serum uric acid to high ... [https://www.nature.com/articles/s41598-024-83013-2]
- 95. Association between uric acid to high-density lipoprotein ... [https://www.nature.com/articles/s41598-025-09999-5]
- 96. Serum uric acid to high‑density lipoprotein cholesterol ratio ... [https://pmc.ncbi.nlm.nih.gov/articles/PMC12605415/]
- 97. A Comparative Study of Serum Uric Acid levels and Lipid ... [https://pmc.ncbi.nlm.nih.gov/articles/PMC4092080/]
- 98. Novel Lipid Biomarkers and Microvascular Complications ... [https://pubmed.ncbi.nlm.nih.gov/40827201/]
- 99. Increased uric acid to high-density lipoprotein ratio ... [https://www.frontiersin.org/journals/neurology/articles/10.3389/fneur.2025.1577077/full]
- 100. Lipidomic studies revealing serological markers associated ... [https://translational-medicine.biomedcentral.com/articles/10.1186/s12967-024-05274-9]
- 101. RBP4 Is Associated With Insulin Resistance in Hyperuricemia ... [https://pmc.ncbi.nlm.nih.gov/articles/PMC8223863/]
- 102. Associaton of Retinol Binding Protein 4 (RBP4) Levels With ... [https://www.frontiersin.org/journals/endocrinology/articles/10.3389/fendo.2022.879755/full]
- 103. Levels of retinol-binding protein 4 and uric acid in patients ... [https://www.sciencedirect.com/science/article/abs/pii/S0026049509002571]
- 104. Serum retinol binding protein 4 is associated with visceral fat ... [https://lipidworld.biomedcentral.com/articles/10.1186/s12944-015-0033-2]
- 105. Retinol-binding protein 4 in skeletal and cardiac muscle [https://www.frontiersin.org/journals/cell-and-developmental-biology/articles/10.3389/fcell.2025.1587165/full]
- 106. Is the Retinol-Binding Protein 4 a Possible Risk Factor for ... [https://pmc.ncbi.nlm.nih.gov/articles/PMC7432399/]
- 107. Synergistic effect of blood lipids and uric acid on periodontitis ... [https://pmc.ncbi.nlm.nih.gov/articles/PMC10006784/]
- 108. Synergistic Interaction between Hyperuricemia and ... [https://www.e-dmj.org/journal/view.php?doi=10.4093/dmj.2021.0166]
- 109. Evaluation of the Effects of High Uric Acid on Glucolipid ... [https://www.preprints.org/manuscript/202507.0954]
- 110. Changes in blood glucose and metabolism ... [https://pmc.ncbi.nlm.nih.gov/articles/PMC11909573/]
- 111. Animal models of metabolic syndrome: a review [https://nutritionandmetabolism.biomedcentral.com/articles/10.1186/s12986-016-0123-9]
- 112. Serum Lipidomic Analysis of T2DM Patients: A Potential ... [https://pmc.ncbi.nlm.nih.gov/articles/PMC11847430/]
- 113. Lipid variability and risk of microvascular complications in ... [https://pmc.ncbi.nlm.nih.gov/articles/PMC10759662/]
- 114. Lipid Accumulation and Chronic Kidney Disease - PMC [https://pmc.ncbi.nlm.nih.gov/articles/PMC6520701/]
- 115. The role of lipotoxicity in kidney disease: From molecular ... [https://www.sciencedirect.com/science/article/pii/S0753332223002536]
- 116. Lipid Disorders and Cardiovascular Risk [https://pmc.ncbi.nlm.nih.gov/articles/PMC10825376/]
- 117. Clinical serum lipidomic profiling revealed potential lipid ... [https://www.nature.com/articles/s41598-024-66157-z]
- 118. Lipid droplet dynamics in type 2 diabetes and its complications [https://lipidworld.biomedcentral.com/articles/10.1186/s12944-025-02747-8]