Dynamic Programming in Protein Structural Alignment: From Foundational Algorithms to Cutting-Edge AI Applications
This article provides a comprehensive overview of dynamic programming (DP) strategies for protein structural alignment, a cornerstone technique in computational biology.
Dynamic Programming in Protein Structural Alignment: From Foundational Algorithms to Cutting-Edge AI Applications
Abstract
This article provides a comprehensive overview of dynamic programming (DP) strategies for protein structural alignment, a cornerstone technique in computational biology. Aimed at researchers, scientists, and drug development professionals, it explores the foundational principles of DP, detailing its robustness and inherent limitations. The content delves into modern methodological advancements, including hybrid algorithms that combine DP with genetic algorithms and machine learning, as well as novel formulations using optimal transport. It further addresses critical troubleshooting aspects, such as parameter sensitivity and strategies to avoid local optima, and provides a rigorous framework for the validation and comparative analysis of alignment tools against established benchmarks. By synthesizing traditional approaches with the latest AI-driven innovations, this article serves as a vital resource for leveraging structural alignment to accelerate discoveries in protein function annotation, evolutionary studies, and drug design.
The Core Engine: Understanding Dynamic Programming's Role in Protein Structural Alignment
Frequently Asked Questions (FAQs)
FAQ 1: What is the core recursive relation at the heart of the Needleman-Wunsch algorithm, and how does it enable global sequence alignment?
The core recursion for the Needleman-Wunsch algorithm, which performs global sequence alignment, is defined for a matrix F where F[i, j] represents the score of the optimal alignment between the first i characters of sequence A and the first j characters of sequence B [1]. The recurrence relation is calculated for each cell (i, j) as follows [1] [2]:
F[i, j] = max( F[i-1, j-1] + S(A_i, B_j), F[i-1, j] + gap, F[i, j-1] + gap )
Where:
F[i-1, j-1] + S(A_i, B_j)represents a match or mismatch, whereS(A_i, B_j)is the similarity score between charactersA_iandB_j[1].F[i-1, j] + gaprepresents an insertion of a gap in sequence B (a deletion from sequence A) [1].F[i, j-1] + gaprepresents an insertion of a gap in sequence A (a deletion from sequence B) [1].
This relation breaks the problem into smaller subproblems, and by solving and storing their solutions in a matrix (a process central to dynamic programming), it constructs the optimal full alignment [3] [4]. The algorithm guarantees finding the alignment with the highest possible score across the entire length of both sequences [3].
FAQ 2: How does the fundamental DP recursion extend from sequence alignment to protein structural alignment?
In protein structural alignment, the fundamental DP concept remains the same, but the "similarity score" S(i, j) is replaced by a measure of three-dimensional structural similarity between residues i and j, often based on the spatial coordinates of their Cα atoms [5] [6]. The recursion maximizes the sum of structural similarity scores instead of sequence similarity scores [6].
A common recursion form for structural alignment is [6]:
V_{ij} = min( V_{i-1,j} + ρ, V_{i,j-1} + ρ, V_{i-1,j-1} + S_{ij} )
Here, S_{ij} is a structural similarity measure, and ρ is a gap penalty. This allows the algorithm to find spatially equivalent residue pairs between two protein structures, which is critical for inferring functional, structural, and evolutionary relationships that are not always evident from sequence alone [5] [6].
FAQ 3: What are the advantages of using a bottom-up dynamic programming approach over a top-down recursive approach with memoization?
The primary advantages are reduced space complexity and a guaranteed optimal computation order [4] [7].
- Bottom-Up Approach: The computation starts from the smallest subproblems and iteratively builds up to the main problem. This allows for careful management of memory, as only the immediately required previous solutions need to be stored. For example, in the Needleman-Wunsch algorithm, the entire
m x nmatrix is filled, but for problems like Fibonacci or the House Robber, only the last two results are needed, resulting in constant space complexity, O(1) [4]. - Top-Down Approach (Memoization): The algorithm starts with the main problem and recursively breaks it down, caching the results of subproblems to avoid recomputation. While this avoids redundant calculations, it still requires storing all subproblem solutions (O(n) or O(mn) space) and incurs the overhead of recursive function calls [4].
For researchers, the bottom-up approach is often preferred in structural bioinformatics for its efficiency and straightforward implementation when the order of subproblem evaluation is clear [4] [7].
FAQ 4: My structural alignment algorithm is highly sensitive to small changes in the gap penalty parameter. How can I improve its robustness?
Sensitivity to parameters like gap penalty is a known challenge. Research indicates that DP-based solutions can be inherently robust to parametric variation within certain ranges [6]. A study on the EIGAs structural alignment algorithm showed it remained highly effective at identifying similar proteins over a breadth of parametric values [6].
To improve robustness in your experiments:
- Use an Affine Gap Penalty: Instead of a single gap penalty
ρ, use two parameters:ρ_ofor initiating a gap andρ_cfor continuing a gap. This model is more biologically realistic as extending a gap is often considered less penalizing than starting a new one. However, this adds a parameter that may require tuning [6]. - Parameter Sweeping: Systematically test a range of parameter values and evaluate the resulting alignments against a benchmark dataset of known structural relationships to identify a stable, effective range for your specific application [6].
FAQ 5: What are the key software tools and visualizers available for debugging and understanding DP algorithms in bioinformatics?
Several tools can help visualize and debug the DP matrix filling process, which is crucial for learning and troubleshooting.
Table: Key Dynamic Programming Visualization and Analysis Tools
| Tool Name | Primary Functionality | Key Features / Benefits | Potential Limitations |
|---|---|---|---|
| dpvis [7] | A Python library for visualizing DP algorithms. | Step-by-step animation; Interactive self-testing mode; Minimal code modification required. | Requires initial setup in a Python environment. |
| VisuAlgo [8] | Web-based visualization of recursion trees and DAGs. | Shows the Directed Acyclic Graph (DAG) of subproblems; Illustrates dramatic search-space difference. | The DAG can become cluttered for larger problems. |
| Easy Hard DP Visualizer [7] | Visualizes 1D/2D DP subproblem arrays from JavaScript code. | Highlights dependencies for each subproblem. | Lacks rewind/pause features for specific frames. |
Troubleshooting Guides
Issue 1: Non-Optimal Alignments or Incorrect Scores
This issue arises when the DP algorithm does not find the correct optimal alignment, leading to biologically implausible results.
- Step 1: Verify the Scoring System. Check that the values in your similarity matrix
Sand the gap penaltyρare appropriate for your data (e.g., protein vs. DNA). A mismatch in scoring semantics can completely alter the outcome [1]. - Step 2: Check the Recurrence Relation Implementation. Manually trace the calculation of a few cells in your DP matrix, especially where a branching decision (diagonal, left, or up) occurs. Ensure the
max(ormin) function is correctly implemented and that all three terms are being considered [1]. - Step 3: Validate the Traceback Procedure. The optimal path might be correct, but an error in the traceback can produce a wrong alignment. Ensure you correctly handle branches if multiple paths lead to the optimal score [1]. Use a visualization tool like dpvis or VisuAlgo to step through the matrix filling and traceback process [8] [7].
Issue 2: Unacceptable Computational Performance for Large Structures
Protein structural comparisons can be computationally intensive, scaling with the product of the sequence lengths, O(mn) [1] [6].
- Step 1: Profile Your Code. Identify bottlenecks. The DP matrix filling itself is inherently O(mn), but expensive distance calculations for
S_{ij}in structural alignment can be a major slowdown [6]. - Step 2: Consider Heuristic Pre-Filtering. For large database searches, use a fast, less accurate algorithm (e.g., a 0D "finger-print" method like FragBag that compares histograms) to filter out obviously dissimilar structures before running the accurate, slower DP algorithm [6].
- Step 3: Explore Algorithmic Optimizations. Investigate the use of GPUs, as some studies report significant speedups (e.g., 36-fold for TM-align) by porting the computationally intensive parts to a graphics card [6].
Issue 3: Algorithm Fails to Handle Non-Sequential Alignments
A key limitation of classical sequential DP is its inability to find non-sequential alignments, where the order of residues in the backbone is not preserved, which is important in some protein comparisons [6].
- Potential Solution 1: Investigate Alternative Algorithms. Classical DP iterates sequentially along the backbone. Future research could investigate adapting DP to iterate in a different order or using bipartite graph matching in place of DP to obtain non-sequential alignments [6].
- Potential Solution 2: Use Specialized Structural Aligners. For production work requiring non-sequential alignment, rely on established, specialized algorithms that are designed to handle such cases, though they may be slower [6].
Experimental Protocols & Data Presentation
Quantitative Data for Common Scoring Parameters
Table: Example Scoring Schemes for Needleman-Wunsch Algorithm [1]
| Scoring Scheme Purpose | Match Score | Mismatch Score | Gap Penalty (ρ) | Comments |
|---|---|---|---|---|
| Standard Similarity | +1 | -1 | -1 | The original scheme used by Needleman and Wunsch. |
| Edit Distance | 0 | -1 | -1 | The final alignment score directly represents the edit distance. |
| Heavy Gap Penalization | +1 | -1 | -10 | Useful when gaps are considered highly undesirable in the alignment. |
The Scientist's Toolkit: Research Reagent Solutions
Table: Essential Computational "Reagents" for DP-Based Alignment
| Item / Concept | Function / Explanation | Example in Bioinformatics |
|---|---|---|
| Similarity Matrix (S) | A lookup table that defines the score for aligning any two residues (or nucleotides) with each other. It encodes biological likelihood [1] [2]. | BLOSUM, PAM matrices for amino acids; Identity matrix for simple DNA matches [2]. |
| Gap Penalty (ρ) | A cost deducted from the alignment score for introducing a gap (insertion or deletion). It can be constant (linear) or variable (affine) [1] [6]. | A linear penalty of -2; An affine penalty with open=-5 and extend=-1. |
| DP Matrix (F or V) | A two-dimensional array that stores the optimal scores for all subproblems (alignments of sequence prefixes). The solution is built by filling this matrix [1] [7]. | The core data structure in Needleman-Wunsch and many structural alignment algorithms like EIGAs. |
| Traceback Matrix | An auxiliary data structure (often integrated into the DP matrix) that records the path taken to reach each cell, enabling the reconstruction of the optimal alignment [1]. | Stores arrows pointing to the parent cell (diagonal, left, or up). |
Mandatory Visualizations
Diagram: DP Alignment Workflow
Diagram: From Sequence to Structure Alignment
Why DP? Addressing the NP-Hard Challenge of Residue Correspondence
Frequently Asked Questions
Why is finding the optimal residue correspondence considered NP-hard? The problem requires evaluating all possible mappings between the residues of two protein structures to find the set that maximizes structural similarity after optimal superposition. An exhaustive search of this solution space is computationally intractable for all but the smallest proteins, as the number of possible alignments grows exponentially with protein length, placing it in the NP-hard complexity class [9] [10].
If the problem is NP-hard, how can Dynamic Programming (DP) provide a solution? DP does not solve the NP-hard problem in its entirety. Instead, it efficiently finds the optimal sequence-order preserving alignment for a given scoring function. It works by breaking the problem into smaller, overlapping subproblems (aligning protein prefixes), solving each once, and storing the solution. This avoids redundant computations but relies on a pre-defined scoring scheme to compare residues and is typically restricted to alignments where the residue order is preserved [6] [10].
My DP-based alignment has a low RMSD but a poor TM-score. What does this mean? This indicates that your alignment, while geometrically precise for a small subset of residues (low RMSD), fails to capture a large, biologically meaningful structural core. Root Mean Square Deviation (RMSD) is sensitive to local deviations and can be inflated by poorly aligned regions. The Template Modeling Score (TM-score) is a length-normalized measure that is more sensitive to global topology. A low TM-score suggests the aligned regions may not represent a significant fold similarity, often with scores below 0.2 indicating randomly unrelated proteins [11] [12].
What can I do if my proteins have the same fold but different domain connectivity (e.g., circular permutations)? Standard DP, which requires sequential residue matching, will fail in this scenario. You should use algorithms specifically designed for non-sequential or flexible alignments. Tools like jCE-CP (Combinatorial Extension with Circular Permutations) or the flexible version of jFATCAT are capable of detecting similarities in proteins with different topologies [11].
How can I escape local optima during structural alignment? Relying solely on a single initial guess for correspondence can trap an algorithm in a local optimum. Advanced methods combine DP with global search heuristics. For example, the GADP-align algorithm uses a Genetic Algorithm (GA) to explore a wide range of initial alignments globally before refining them with iterative DP, thereby reducing the risk of local traps [9].
Troubleshooting Common Experimental Issues
Problem: High Sensitivity to Gap Penalty Parameters
- Symptoms: Small changes in gap opening (
ρ_o) or extension (ρ_c) penalties lead to dramatically different alignments. - Underlying Cause: The DP scoring function is overly sensitive to the chosen parameters, making the alignment unstable.
- Solution:
- Robustness Testing: Run your alignment across a range of gap penalties and observe if the core aligned regions remain stable. Algorithms like EIGAs have been shown to be robust across a breadth of parametric values [6].
- Use a Size-Independent Score: Employ a scoring function like TM-score for evaluation, as it is less sensitive to protein size and alignment length [9] [12].
- Consult Literature: Use gap penalty values that are standard for your chosen algorithm or have been validated in benchmark studies.
Problem: Inaccurate Alignment for Proteins with Low Sequence Identity
- Symptoms: The alignment fails to identify obvious structural similarities between proteins with no detectable sequence relationship.
- Underlying Cause: The scoring function for residue similarity may be overly reliant on sequence-derived information.
- Solution:
- Leverage Structural Information: Use algorithms that define residue similarity based on structural fingerprints, such as local fragment geometry [6] or the alignment of Secondary Structure Elements (SSEs) [9].
- Apply Consistency Transformation: Pre-process with methods that enhance the residue affinity matrix by incorporating information from all pairwise alignments in a set, which improves accuracy for distant homologs [13].
- Choose the Right Tool: Opt for methods known for sequence-independent alignment, such as TM-align or DALI [11] [12] [10].
Problem: Long Computation Times for Large-Scale Database Comparisons
- Symptoms: An all-against-all comparison of a large set of protein structures is computationally prohibitive.
- Underlying Cause: Classical structural alignment algorithms (DALI, CE, SSAP) are accurate but can be too slow for database-scale applications [6].
- Solution:
- Employ Fast Filtering Algorithms: Use efficient "1D" or "0D" algorithms like FragBag (which uses a histogram of backbone fragments) as a pre-filter to identify potential matches before running a more accurate, slower aligner [6].
- Utilize Hybrid Methods: Implement algorithms like CATHEDRAL, which combine a fast secondary structure-based search with a more precise double-dynamic programming algorithm [6].
- Leverage Hardware Acceleration: Some implementations of algorithms like TM-align have been modified to run on GPUs, providing significant speedups [6].
Experimental Protocols & Data
Methodology: The GADP-align Hybrid Protocol
This protocol combines a Genetic Algorithm (GA) with iterative Dynamic Programming to find a global alignment [9].
- Initial SSE Matching: Encode the secondary structure of each protein as a sequence of elements (H for helix, S for strand). Use the Needleman-Wunsch algorithm to generate an initial correspondence between these SSE sequences.
- Genetic Algorithm Population Initialization: Create a population of chromosomes. Each chromosome represents a possible alignment, defined by matched SSE pairs and a random set of corresponding residues within those SSEs.
- Fitness Evaluation: Calculate the fitness of each chromosome using the TM-score after applying the optimal superposition based on its proposed residue correspondence.
- Genetic Operations:
- Selection: Use tournament selection to choose parent chromosomes.
- Crossover: Combine segments of two parent chromosomes to produce offspring.
- Mutation: Randomly increase or decrease the number of aligned residues within an SSE pair.
- Shift: Shift SSE correspondences left or right to explore new matchings.
- Dynamic Programming Refinement: For the highest-scoring chromosomes, run an iterative DP algorithm to refine the residue-level alignment and compute the final Kabsch transformation for superposition.
- Termination: The algorithm terminates when the maximum fitness score remains unchanged for 30 generations or after 100 generations.
Quantitative Performance Comparison
The following table summarizes key metrics for evaluating structural alignments, as used by tools like those on the RCSB PDB site [11] and in research [9].
| Metric | Description | Interpretation | Typical Values for Related Proteins |
|---|---|---|---|
| TM-score | Measures topological similarity, normalized by protein length. | 0-1 scale; <0.2: random, >0.5: same fold [11] [12]. | >0.5 |
| RMSD | Root Mean Square Deviation of superposed Cα atoms. | Lower is better, but sensitive to local errors and length. | < 2.0 - 4.0 Å |
| Aligned Length | Number of residue pairs in the final alignment. | Larger values generally indicate greater similarity. | Varies with protein size and similarity. |
| Sequence Identity | Percentage of aligned residues that are identical. | Not a structural metric, but provides evolutionary context. | Can be very low (<20%) even with high TM-score. |
Research Reagent Solutions
| Item / Resource | Function in Structural Alignment |
|---|---|
| RCSB PDB Pairwise Structure Alignment Tool | Web-accessible interface to run multiple alignment algorithms (jFATCAT, CE, TM-align) without local installation [11] [14]. |
| TM-align Standalone Code | Downloadable C++ or Fortran source code for local, high-volume or integrated alignment pipelines [12]. |
| DaliLite | Standalone program for structural alignments based on the DALI method, useful for fold comparisons [10]. |
| PDBx/mmCIF File Format | Standard format for protein structure coordinate files, required by most modern alignment tools [11]. |
| Kabsch Algorithm | A method for calculating the optimal rotation matrix that minimizes the RMSD between two sets of points [9]. |
| Mol* Viewer | An interactive molecular visualization tool integrated into the RCSB PDB for viewing and analyzing alignment results [11]. |
Workflow Visualization
The following diagram illustrates the hybrid GADP-align algorithm, which tackles the NP-hard challenge by combining global search with local optimization.
Advanced Method: SAS-Pro Bilevel Optimization
For researchers requiring high-precision alignments, the SAS-Pro (Simultaneous Alignment and Superposition) model presents an advanced alternative. It formulates the alignment problem as a single bilevel optimization problem, thereby avoiding the suboptimal solutions that can arise from the traditional two-stage approach [15].
Traditional Two-Stage Approach:
- Stage 1 (Assignment): Use heuristics or DP to find residue correspondences based on a simplified scoring function.
- Stage 2 (Superposition): Use the Kabsch algorithm to find the optimal rotation-translation for the current assignment.
- These stages are repeated iteratively, but the decoupling means the final alignment is not guaranteed to be globally optimal [15].
SAS-Pro Bilevel Formulation:
- Master Problem: Optimizes the binary assignment variables (
x_ij). - Subproblem: For any given assignment, computes the optimal rotation-translation transformation (
T) by minimizing RMSD. - This model simultaneously addresses assignment and superposition, which can lead to alignments with better RMSD values and larger lengths than two-stage methods. It can also be extended to find non-sequential alignments by relaxing the sequentiality constraints [15].
- Master Problem: Optimizes the binary assignment variables (
Frequently Asked Questions
About Scoring Functions
Q1: What is the difference between a general-purpose and a family-specific amino acid similarity matrix?
General-purpose matrices, like BLOSUM or PAM, are derived by averaging substitution frequencies across many diverse protein families to represent the entire "protein universe." They are essential for tasks like database searches where a query sequence is aligned against millions of diverse sequences. In contrast, family-specific matrices are derived from the substitution patterns observed within a single protein family or structural fold. Using a family-specific matrix for sequences from that family can significantly improve alignment quality, as it utilizes substitution patterns that were averaged out in general-purpose matrices [16].
Q2: How do I choose the right substitution matrix for my protein sequences?
The choice depends on the relatedness of your sequences and the biological question. For general purposes or searching databases, BLOSUM62 is a robust default for proteins [17]. For closely related sequences, use matrices with higher numbers (e.g., BLOSUM80); for distantly related sequences, use lower numbers (e.g., BLOSUM45) [17]. If you are working with a specific, well-characterized protein family, a family-specific matrix, if available, will likely yield the most accurate alignments [16]. The VTML series are also high-quality general-purpose matrices [16].
About Gap Penalties
Q3: What are the main types of gap penalties, and when should I use them?
The three primary types of gap penalties are:
- Linear: A fixed cost per gap unit. It is computationally simple but less biologically realistic [18].
- Affine: The most widely used type, it consists of a gap opening penalty and a (smaller) gap extension penalty. This model reflects the biological observation that initiating an insertion or deletion event is less likely than extending an existing one [17] [18].
- Convex: A non-linear penalty where the cost per unit decreases as the gap length increases. This can be more biologically realistic for long gaps but is computationally complex [17] [18]. For most applications, the affine gap penalty is recommended due to its balance of biological realism and computational efficiency [17].
Q4: How do I set the values for gap opening and gap extension penalties?
There is no universal set of values, but common practices exist. The gap opening penalty is typically set higher than the extension penalty, with ratios often ranging from 10:1 to 20:1 [18]. Empirical determination using benchmark datasets with known correct alignments (like BAliBASE) is considered a robust method [18]. The table below summarizes typical values and determination methods.
| Consideration | Typical Values / Methods |
|---|---|
| Protein vs. DNA | Protein sequences generally use higher gap penalties than DNA [18]. |
| Protein Example | Gap opening: -10 to -15; Gap extension: -0.5 to -2 [18]. |
| DNA Example | Gap opening: -15 to -20; Gap extension: -1 to -2 [18]. |
| Empirical Determination | Use benchmark datasets (e.g., BAliBASE, PREFAB) and parameter sweeping [18]. |
About the Optimization Model
Q5: Why is dynamic programming considered "robust" in the context of structural alignment?
Dynamic programming (DP) finds an optimal alignment by solving a series of smaller sub-problems. The solution at each cell in the DP matrix is selected from a few possibilities (e.g., match/mismatch or indel). Research on the EIGAs structural alignment algorithm has shown that the optimal path through this matrix often remains unchanged over a substantial range of parameter values (like gap penalty) and similarity scores. This means that minor perturbations in the input parameters or structural similarity measures do not necessarily alter the final alignment, making the DP approach inherently stable and robust for many practical applications [6].
Q6: What is the difference between global, local, and semi-global alignment?
- Global Alignment: Forces the alignment to span the entire length of all sequences. It is best suited for sequences of similar length and high similarity. The Needleman-Wunsch algorithm is used for this [19] [1].
- Local Alignment: Identifies regions of high similarity within longer sequences. It is useful for finding conserved domains in otherwise divergent sequences. The Smith-Waterman algorithm is used for this [19].
- Semi-Global Alignment: A hybrid used when one wishes to align a sequence fully against a part of a much longer sequence (e.g., a gene against a chromosome) without penalizing gaps at the ends of the shorter sequence [19].
Troubleshooting Guides
Problem: Poor Alignment Quality or Biologically Implausible Gaps
Potential Cause 1: Incorrect gap penalty parameters.
- Symptoms: Alignments with too many short gaps (over-gapping) or too few gaps, forcing mismatches.
- Solution:
- Adjust the ratio: If you see many fragmented short gaps, your gap extension penalty may be too low relative to the opening penalty. Try increasing the extension penalty.
- Benchmark: Use a set of sequences with a known reference alignment (from structural data, e.g., SABmark [16]) and perform a parameter sweep. Systematically vary the gap opening and extension penalties and select the pair that produces alignments with the highest percentage of correctly aligned positions against the reference [18].
- Consider context: If available, use position-specific gap penalties. Tools like MAFFT and PSI-BLAST can apply lower gap penalties in variable loop regions and higher penalties in conserved core secondary structures [18].
Potential Cause 2: A suboptimal substitution matrix.
- Symptoms: Low overall alignment score, failure to align known conserved motifs.
- Solution:
- Switch matrices: If you are using a general-purpose matrix like BLOSUM62, try BLOSUM45 for distantly related sequences or BLOSUM80 for close relatives [17].
- Use a family-specific matrix: If your proteins belong to a well-studied family, check if a family-specific matrix has been published. Studies show these can significantly improve alignment accuracy [16].
Problem: Algorithm is Too Slow for Large-Scale Analysis
Potential Cause: The O(mn) time/space complexity of full dynamic programming is prohibitive for many long sequences.
- Solution: Utilize heuristic strategies that leverage faster algorithms.
- Divide and Conquer: Use tools like MUMmer or Minimap2 that find exact matches ("anchors") between sequences first. These anchors segment the dynamic programming matrix, drastically reducing the search space and computation time [20].
- Bounded Dynamic Programming: For highly similar sequences, use algorithms that restrict the dynamic programming calculation to a narrow "strip" around the matrix diagonal. This assumes the optimal path will not deviate far from the diagonal [20].
- Profile-Based Alignment: For multiple sequence alignment, build a profile from a smaller subset of sequences and then align remaining sequences to the profile, which is computationally more efficient than all-vs-all pairwise alignment [18].
Experimental Protocol: Evaluating a New Scoring Function
This protocol can be used to benchmark a new scoring function (e.g., a novel substitution matrix or set of gap penalties) against existing standards.
1. Acquire a Benchmark Dataset:
- Obtain a standardized set of reference alignments, such as those from SABmark [16]. This database provides pairs and groups of sequences with reference alignments based on structural superpositions, which are considered a "gold standard." It is divided into superfamily (homologous) and twilight zone (analogous) subsets.
2. Generate Test Alignments:
- Using your new scoring function and a standard dynamic programming algorithm (e.g., Needleman-Wunsch for global alignment), perform pairwise alignments for all sequence pairs in the benchmark dataset.
3. Quantify Alignment Accuracy:
- Compare each test alignment to its corresponding reference structural alignment.
- Calculate the percentage of correctly aligned positions. A standard metric is the number of aligned residue pairs in the test alignment that are also aligned in the reference alignment.
4. Statistical Analysis:
- Compute the average accuracy across all alignments in the dataset for your new function.
- Perform a statistical test (e.g., a paired t-test) to determine if the difference in performance between your new function and an established standard (e.g., using BLOSUM62 with affine gap penalties) is statistically significant [16].
Workflow Visualization
The following diagram illustrates the logical workflow and decision points for optimizing a dynamic programming-based alignment.
The Scientist's Toolkit: Research Reagent Solutions
The following table details key computational "reagents" and resources used in the field of protein structural alignment.
| Resource / Tool | Type | Function / Application | Reference / Source |
|---|---|---|---|
| SABmark | Benchmark Dataset | A "gold standard" set of reference sequence alignments based on structural superposition; used for evaluating alignment algorithm performance. | [16] |
| BLOSUM Matrices | Substitution Matrix | A family of general-purpose amino acid similarity matrices. Higher numbers (e.g., BLOSUM80) for close, lower (e.g., BLOSUM45) for distant relationships. | [17] [16] |
| VTML Matrices | Substitution Matrix | Another series of high-quality, general-purpose amino acid substitution matrices. | [16] |
| Family-Specific Matrices | Substitution Matrix | Custom similarity matrices derived from the substitution patterns of a single protein family, which can improve alignment accuracy. | [16] |
| Affine Gap Penalty | Scoring Parameter | A two-part penalty consisting of a gap opening and a gap extension cost, reflecting the biological reality of indels. | [17] [18] |
| SAT (Sequence Alignment Teacher) | Educational Software | An interactive Java tool to visualize the dynamic programming matrix and understand the effect of parameter changes. | [21] |
| MUSTANG, TM-align, CE | Alignment Algorithms | Classical structural alignment algorithms used for benchmarking and obtaining reference structural alignments. | [22] |
Troubleshooting Guide: Parametric Sensitivity in DP-Based Alignment
This guide addresses common challenges researchers face regarding the sensitivity of Dynamic Programming (DP) parameters in protein structural alignment.
FAQ 1: How sensitive is my structural alignment to the choice of gap penalty?
Issue: The optimal alignment produced by a DP algorithm can appear to change significantly with small adjustments to the gap penalty parameters, leading to uncertainty in results.
Explanation: The sensitivity to gap penalties is often problem-dependent. Research on the EIGAs algorithm demonstrates that DP solutions can be remarkably stable over a substantial range of parametric values [6]. The underlying reason is that the DP recursion selects optimal values from a few possibilities; these values can adjust over nearby numbers without necessarily altering the final optimal solution [6].
Solution:
- Conduct a Parametric Sweep: Systematically vary the gap open (
ρ_o) and gap extension (ρ_c) penalties over a reasonable range and observe the resulting alignments. - Identify the Stability Range: As demonstrated in foundational DP examples, a unique solution may remain optimal over a broad range of penalty values (e.g.,
0.15 < ρ < ∞in a model case) [6]. Focus on parameter ranges where your core alignment is conserved. - Use Robustness as a Metric: Calculate the robustness score for individual aligned residues (edges). This score measures the fraction of near-optimal alignments in which a particular residue match appears. Edges with high robustness are more likely to be structurally correct and less sensitive to parameter changes [23].
Experimental Protocol for Parametric Stability Assessment:
- Input: Your target protein structures (P, Q).
- Parameters: Define a matrix of gap open (
ρ_o) and gap extension (ρ_c) penalties. - Procedure: For each parameter combination, compute the optimal sequence alignment using the DP algorithm.
- Analysis: Compare alignments using the stability of the core structural alignment and the robustness scores of aligned residues.
- Output: A report identifying the range of parameters that produce a stable, high-confidence alignment core.
FAQ 2: How can I account for uncertainty in atomic coordinates (e.g., from B-factors) in my structural alignment?
Issue: Experimental protein structures have inherent uncertainty in the precise 3D coordinates of their atoms, which is often quantified by B-factors. A rigid alignment algorithm might be overly sensitive to these small perturbations.
Explanation: Modern fast algorithms, such as EIGAs, have been shown to be robust against this type of structural uncertainty. Efficacy in identifying structurally similar proteins is maintained even when the coordinates of Cα atoms are perturbed randomly within probability distributions scaled by their B-factors [6].
Solution:
- Incorporate Uncertainty Explicitly: Model the atomic coordinates as probability distributions instead of fixed points. The standard deviation of these distributions can be derived from experimental B-factors [6].
- Utilize Robust Algorithms: Leverage modern DP-based algorithms designed for such robustness. Their underlying optimization model can tolerate small variations within appropriate tolerances without significant degradation in alignment quality.
- Validate with Multiple Samples: Generate multiple perturbed versions of your input structure (within the uncertainty bounds) and run alignments. A robust result will show a consistent alignment core across most samples.
FAQ 3: My sequence alignment is optimal, but it poorly matches the "true" structural alignment. Why?
Issue: An alignment that is optimal in terms of sequence score may differ from the alignment based on 3D structural superposition, which is often considered a gold standard.
Explanation: This is a known challenge. Structurally accurate alignments often have sub-optimal sequence alignment scores [23]. The "optimal" sequence alignment is tied to a specific scoring matrix and gap penalty set, which may not perfectly capture the evolutionary and physical constraints that preserve 3D structure.
Solution:
- Explore Near-Optimal Alignments: Do not rely solely on the single optimal alignment. Generate a set of near-optimal alignments (those with scores close to the best). The pool of these alignments has been shown to substantially overlap with structure-based alignments [23].
- Use a Probabilistic Model: Employ methods like the probA program that generate a set of probabilistic alignments. This ensemble can more effectively sample the alignment space and often includes alignments closer to the structural truth [23].
- Build a Predictive Model: Develop a logistic regression model that uses features from near-optimal alignments—such as robustness, edge frequency, and maximum bits-per-position—to classify which aligned residues are likely to appear in a structural alignment [23].
Quantitative Data on DP Robustness
Table 1: Features for Predicting Structurally Accurate Alignments from Near-Optimal Pools [23]
| Feature | Description | Utility in Prediction |
|---|---|---|
| Robustness | The fraction of near-optimal alignments in which a specific residue pair (edge) appears. | High robustness strongly predicts that an edge is correct and structurally conserved. |
| Edge Frequency | How often an edge appears across the entire ensemble of alternative alignments. | Correlates with structural accuracy; correct edges tend to persist. |
| Maximum Bits-per-Position | A measure of the local conservation and information content at a position. | Identifies functionally or structurally critical residues that are likely to be aligned correctly. |
Table 2: Performance of Robustness in Classifying Structural Alignment Edges [23]
| Sequence Similarity Tier | Average % Identity | Performance of Robustness Classifier |
|---|---|---|
| High (E() < 10⁻¹⁰) | ~48% | Excellent accuracy in identifying structurally correct edges. |
| Medium (10⁻¹⁰ < E() < 10⁻⁵) | ~26.9% | Good performance, but benefits from additional features. |
| Low (E() ~ 10⁻⁵) | ~22.6% | Remains a useful predictor, though alignment ambiguity increases. |
Workflow Visualization: Assessing Parametric Robustness
The following diagram illustrates a recommended workflow for evaluating the robustness of your DP alignment against parametric variation.
The Scientist's Toolkit: Research Reagent Solutions
Table 3: Essential Software and Metrics for Robust Structural Alignment Research
| Tool / Metric | Type | Function in Analysis |
|---|---|---|
| EIGAs Algorithm | DP-based Alignment Algorithm | A specific algorithm noted for its demonstrated robustness against both parametric and structural variation [6]. |
| Zuker Algorithm | Near-Optimal Alignment Generator | Produces a set of suboptimal alignments for a given sequence pair, used to calculate robustness scores [23]. |
| probA Program | Probabilistic Alignment Tool | Generates an ensemble of alignments based on statistical weighting, useful for sampling a wider variety of structurally accurate solutions [23]. |
| TM-score | Structural Similarity Metric | A scale for measuring the topological similarity of protein structures, often used as a benchmark for evaluating sequence alignments [24]. |
| RMSD (Root Mean Square Deviation) | Structural Distance Metric | Measures the average distance between atoms of superimposed proteins. The LCP problem aims to find the largest subset with RMSD below a threshold [25]. |
| Robustness Score | Alignment Confidence Metric | Quantifies the reliability of an individual aligned residue pair by its persistence in near-optimal alignments [23]. |
Beyond the Basics: Advanced DP Methods and Real-World Applications in Biomedicine
Fundamental Concepts and Definitions
What is the core principle behind the SARST2 filter-and-refine strategy? SARST2 employs a two-stage methodology to balance search speed with alignment accuracy. The filter stage rapidly reduces the search space by integrating primary, secondary, and tertiary structural features with evolutionary statistics to create a simplified representation of protein structures. The refine stage then performs detailed, accurate alignments on the promising candidate structures identified by the filter, using a weighted contact number-based scoring scheme and a variable gap penalty based on substitution entropy [26].
How does SARST2 relate to Dynamic Programming (DP) in structural alignment? While SARST2 itself uses fast linear encoding for its initial filter, its philosophy is aligned with a central theme in structural bioinformatics: using efficient methods to enable the application of more computationally intensive, accurate algorithms like DP. Many efficient structural alignment algorithms have a single application of dynamic programming at their core [6]. SARST2’s filter-and-refine approach makes large-scale studies feasible, allowing for subsequent deeper analysis with DP-based methods, which are known for finding optimal alignments but can be slow for database-wide comparisons [26] [6].
What performance advantage does SARST2 offer over other methods? In large-scale benchmarks, SARST2 has demonstrated superior performance by completing searches of the AlphaFold Database significantly faster and with substantially less memory usage than both BLAST and Foldseek, all while achieving state-of-the-art accuracy [26].
Implementation and Troubleshooting
FAQs: Common Setup and Execution Issues
Q1: I am getting compilation errors for the SARST2 source code. What are the prerequisites? SARST2 is implemented in Golang and is available as a standalone program. To avoid compilation issues, you can download the pre-built standalone programs directly from the official website (https://10lab.ceb.nycu.edu.tw/sarst2) or the GitHub repository (https://github.com/NYCU-10lab/sarst2) [26]. Ensure your system meets the basic requirements to run these executables.
Q2: How can I perform a massive database search on a standard personal computer? SARST2 is specifically designed for this scenario. Its high resource efficiency enables massive database searches using ordinary personal computers. The algorithm’s design, which includes a diagonal shortcut for word-matching and a machine learning-enhanced filter, minimizes both CPU time and memory footprint, making large-scale structural genomics projects more accessible [26].
Q3: The search results seem inaccurate for certain structural classes. How can I improve this? The accuracy of linear encoding methods like SARST2 can vary across different protein structural classes (e.g., all-alpha, all-beta, alpha/beta). The original SARST method was evaluated on these different classes. If you encounter issues, consult the benchmark studies in the SARST2 publication to understand its performance limitations for your specific protein class of interest [27].
Troubleshooting Guide: Performance and Accuracy
| Problem | Possible Cause | Solution |
|---|---|---|
| High False Positive Rate | Filtering stage threshold is set too low, allowing too many non-homologous structures to pass. | Adjust the filtering threshold to a more stringent value. Review the expectation values (E-values) provided in the results to assess reliability [27]. |
| High False Negative Rate | Filter is too aggressive, discarding true homologs. Evolutionary statistics may not be capturing remote homology. | Lower the filtering threshold. Ensure the integrated evolutionary statistics are computed from a diverse and representative multiple sequence alignment [26]. |
| Long Search Times | Database size is very large, and the filter is not pruning candidates efficiently. | The diagonal shortcut for word-matching is designed to speed up this process. Verify you are using the latest version of SARST2, as it includes optimizations for speed [26]. |
| Low Alignment Accuracy | The refinement stage may be using suboptimal parameters for your specific dataset. | Tune the parameters of the weighted contact number-based scoring scheme and the variable gap penalty, which depends on substitution entropy [26]. |
Performance Optimization and Analysis
Quantitative Performance Metrics of SARST2
The following table summarizes the key quantitative performance data for SARST2 as reported in large-scale benchmarks.
| Metric | SARST2 Performance | Comparative Method (BLAST) | Comparative Method (Foldseek) |
|---|---|---|---|
| Search Speed | Significantly faster | Slower | Slower |
| Memory Usage | Substantially less | Higher | Higher |
| Accuracy | Outperforms state-of-the-art methods | Lower | Lower |
| Scalability | Enables massive DB searches on ordinary PCs | Less efficient for large DB | Less efficient for large DB |
| E-value | Provides statistically meaningful expectation values | Not Applicable | Not Applicable |
Workflow Diagram: SARST2 Filter-and-Refine Strategy
The diagram below illustrates the logical workflow and data flow of the SARST2 algorithm.
Research Reagent Solutions
The following table details key computational tools and resources essential for research in protein structural alignment, particularly in the context of methods like SARST2.
| Resource Name | Type | Primary Function in Research |
|---|---|---|
| SARST2 | Standalone Program | High-throughput, resource-efficient protein structure alignment against massive databases [26]. |
| TM-align | Algorithm & Server | Sequence-independent protein structure alignment based on TM-score, using heuristic dynamic programming iterations [12]. |
| US-align | Algorithm & Server | Universal structure alignment for proteins, RNAs, and DNAs; extended from TM-align [28]. |
| RCSB PDB Alignment Tool | Web Server | Provides a unified interface for multiple pairwise structural alignment algorithms (jFATCAT, CE, TM-align) [14] [11]. |
| AlphaFold Database | Database | Source of predicted protein structures for use as input or as a search target in database scans [26] [11]. |
Experimental Protocols and Methodologies
Detailed Protocol: Benchmarking SARST2 Performance
This protocol outlines the methodology for replicating large-scale benchmark tests of SARST2, as cited in the search results [26].
Objective: To evaluate the accuracy, speed, and memory efficiency of SARST2 against state-of-the-art methods like BLAST and Foldseek in a database search scenario.
Materials and Software:
- SARST2: Download the standalone program from https://10lab.ceb.nycu.edu.tw/sarst2 or https://github.com/NYCU-10lab/sarst2 [26].
- Comparison Tools: Install BLAST and Foldseek for comparative analysis.
- Hardware: An ordinary personal computer is sufficient for SARST2.
- Query Set: A curated set of protein structures with known folds.
- Target Database: The AlphaFold Database or a similar large-scale structural database.
Procedure:
- Preparation:
- Format the target database for use with each tool (SARST2, BLAST, Foldseek).
- Prepare a set of query protein structures.
Execution:
- Run SARST2 to search each query against the target database. Record the time-to-completion and peak memory usage.
- Repeat the search process using BLAST and Foldseek with their default parameters, recording the same performance metrics.
Accuracy Assessment:
- For each tool, collect the hit list and alignment scores for each query.
- Use a ground-truth classification (e.g., from SCOP or CATH) to determine true and false positives.
- Calculate standard metrics such as sensitivity and precision to quantify accuracy.
Data Analysis:
- Compare the search speed (queries per second) and memory usage (peak RAM) of SARST2 against the other methods.
- Plot ROC curves or precision-recall curves to visually compare the alignment accuracy.
Troubleshooting Diagram: Alignment Inaccuracy
For diagnosing issues with alignment results, follow the logical process below.
Frequently Asked Questions (FAQs)
Q1: What is the primary advantage of combining a Genetic Algorithm (GA) with Iterative Dynamic Programming (DP) in GADP-align?
The primary advantage is that this hybrid approach helps in exploring the global alignment space and prevents the algorithm from getting trapped in local optimal solutions. The genetic algorithm performs a broad, heuristic search for correspondence between secondary structure elements, while the iterative dynamic programming technique refines this alignment. This combination avoids the limitations of methods that rely solely on an initial guess for corresponding residues, which can lead to suboptimal alignments, especially when sequence identity is low or secondary structure elements have different sizes [29].
Q2: My alignment results have a low TM-score. What parameters should I investigate adjusting first?
A low TM-score indicates poor structural similarity. You should first investigate the genetic algorithm parameters that control the search space and convergence. Key parameters to adjust are listed in the table below [29]:
| Parameter | Description | Default Value | Adjustment for Low TM-score |
|---|---|---|---|
| Population Size (N) | Number of chromosomes in each generation. | 100 | Consider increasing to enhance genetic diversity. |
| Crossover Probability (Pc) | Likelihood that two chromosomes will exchange genetic material. | 0.75 | Slightly increasing may help, but avoid values too high. |
| Mutation Probability (Pm) | Likelihood of a random change in a chromosome. | 0.04 | Try a small increase to help escape local optima. |
| Shift Probability (Ps) | Likelihood of shifting SSE matching left or right. | 0.45 | This is a key operator; ensure it is not set too low. |
Q3: How does GADP-align handle initial matching, and why might this fail on proteins with few secondary structure elements?
GADP-align first creates an initial map of correspondence between Secondary Structure Elements (SSEs) — α-helices and β-strands — of the two proteins. It encodes the SSEs as a sequence (e.g., 'H' for helix, 'S' for strand) and uses the Needleman-Wunsch global sequence alignment algorithm to find the best match. Coils and loops are ignored in this initial stage [29]. This method might fail if the proteins have very few or no defined SSEs, as the initial match would have little information to guide the subsequent residue-level alignment. In such cases, the algorithm would rely heavily on the genetic operators (mutation, shift) to discover a good alignment from a poor starting point.
Q4: What is the function of the "Shift Operator" in the Genetic Algorithm, and when is it most critical?
The Shift Operator is a specialized genetic operator in GADP-align that generates a new matching between the SSE sequences by shifting them left or right relative to each other. Its primary function is to prevent the algorithm from converging on a local optimal matching and to help it explore the global optimal matching instead. It is most critical when the initial alignment from the Needleman-Wunsch algorithm on SSEs is incorrect or suboptimal, allowing the algorithm to correct the frame of the alignment [29].
Q5: Can GADP-align be used for multiple sequence alignment, or is it strictly for pairwise comparison?
The GADP-align algorithm, as described in the available research, is designed for pairwise protein structure alignment. The search results do not indicate an extension for multiple sequence alignment. Another study in the search results mentions a procedure for multiple alignments by first performing all pairwise alignments to find a "median" structure and then aligning everything to it [30], but this is a separate method and not part of GADP-align.
Troubleshooting Guides
Issue 1: Algorithm Convergence Problems
Problem: The algorithm converges too quickly to a suboptimal solution (premature convergence) or fails to converge after a reasonable number of generations.
| Possible Cause | Solution |
|---|---|
| Mutation rate is too low. | Increase the mutation probability (Pm) to introduce more diversity into the population. |
| Selection pressure is too high. | Review your tournament selection size (k). A very high k means only the very best individuals are selected, reducing diversity. |
| Shift probability is too low. | The shift operator (Ps) is crucial for global exploration. Ensure it is not set to a very low value. |
| Population size is too small. | A small population lacks genetic diversity. Increase the population size (N) to give the algorithm more material to work with. |
Issue 2: Inaccurate Alignment in Specific Regions
Problem: The final alignment is generally good but shows significant errors in regions like loops or coils.
Explanation: GADP-align's initial matching is based solely on Secondary Structure Elements (SSEs), and coils/loops are explicitly ignored in this phase. The alignment in these regions is determined later during the residue-level alignment. Inaccuracies here are common because these regions are inherently more flexible and variable.
Solution:
- Post-processing: Consider using the output of GADP-align as an initial alignment for a more refined, local alignment tool that is sensitive to flexible regions.
- Fitness Function: The TM-score fitness function is a global measure. While it is effective, it may not prioritize local errors. Visually inspect the alignment in molecular visualization software to determine if the local inaccuracy is critical for your analysis.
Issue 3: Poor Handling of Proteins with Low Secondary Structure
Problem: The alignment performance degrades for proteins that are largely composed of coils or loops.
Explanation: This is a fundamental limitation of the GADP-align approach, as its heuristic search is guided by the initial SSE matching. Without a sufficient number of SSEs, the algorithm lacks a strong directional cue.
Solution:
- Alternative Methods: For proteins with very low secondary structure content, consider using alignment methods that do not rely heavily on SSEs for initial guidance. Tools like TM-align [12] or others that use different heuristics (e.g., gapless threading, fragment matching) might be more robust in these specific cases.
Experimental Protocols & Workflows
The following diagram illustrates the core workflow of the GADP-align algorithm:
Detailed Protocol: Running a GADP-align Experiment
Objective: To obtain an accurate pairwise structural alignment of two protein structures using the GADP-align hybrid method.
Inputs:
- Two protein structures in PDB format.
Procedure:
- Preprocessing:
- Extract the secondary structure assignment for each protein from the PDB files or calculate it using a tool like DSSP.
- Encode the secondary structure elements into a sequence of 'H' (α-helix) and 'S' (β-strand). Ignore coils and loops.
Initial SSE Matching:
- Align the two SSE sequences using the Needleman-Wunsch algorithm.
- Use a scoring system: +2 for identical SSEs, -1 for non-identical SSEs, and a gap-opening penalty of -2.
- This produces the initial correspondence map between SSEs.
Genetic Algorithm Setup:
- Initial Population: Generate an initial population of 100 chromosomes. Each chromosome represents the initial SSE matching. For each pair of matched SSEs in a chromosome, randomly select an initial list of corresponding residues (between 20% and 100% of the shorter SSE's length).
- Fitness Evaluation: For each chromosome, calculate its fitness using the TM-score function. The formula used is:
TM-score = max [ Σ<sub>i</sub> 1 / (1 + (d<sub>i</sub>/d<sub>0</sub>)²) ] / L<sub>Target</sub>whereL<sub>Target</sub>is the length of the shorter protein,L<sub>ali</sub>is the number of aligned residues,d<sub>i</sub>is the distance between the i-th pair of aligned residues, andd<sub>0</sub>(L<sub>Target</sub>) = 1.24 * ∛(L<sub>Target</sub> - 15) - 1.8[29]. - Selection: Use tournament selection (with tournament size
k=3) to choose parents for the next generation. - Genetic Operators:
- Crossover: Perform a two-point crossover on selected parents with a probability
Pc=0.75. - Mutation: Randomly increase or decrease the number of aligned residues within a matched SSE pair with a probability
Pm=0.04. - Shift: Shift the SSEs left or right in the matching with a probability
Ps=0.45.
- Crossover: Perform a two-point crossover on selected parents with a probability
Iterative Dynamic Programming:
- For the high-fitness alignments proposed by the genetic algorithm, an iterative dynamic programming technique is applied to refine the residue-to-residue alignment.
Termination:
- The algorithm repeats steps 3-4 for a predefined number of generations or until the TM-score improvement falls below a threshold.
Output:
- The alignment with the highest TM-score is selected as the final result. This includes the list of equivalent residues and the optimal superposition of the two structures.
The Scientist's Toolkit: Research Reagent Solutions
The following table details key computational "reagents" and their functions in a GADP-align experiment.
| Item | Function in the Experiment | Key Parameters / Notes |
|---|---|---|
| Needleman-Wunsch Algorithm | To generate the initial global alignment of Secondary Structure Element (SSE) sequences. | Scoring: +2 (match), -1 (mismatch), -2 (gap penalty). Provides the initial heuristic [29]. |
| TM-score | A size-independent scoring function used as the fitness measure to evaluate the quality of structural alignments. | Values > 0.5 indicate generally the same fold; values < 0.2 suggest unrelated proteins [12]. |
| Tournament Selection | A selection method in the GA that chooses the fittest individual from a random subset of the population for reproduction. | Helps maintain selection pressure. Tournament size k=3 is used in GADP-align [29]. |
| Shift Operator | A specialized GA operator that shifts the correspondence of SSEs to explore different global matchings. | Critical for avoiding local optima. Probability Ps=0.45 [29]. |
| Iterative Dynamic Programming | A technique that refines the residue-level alignment based on the correspondence map provided by the GA. | Used to optimize the spatial superposition and final residue matching iteratively [29] [30]. |
Frequently Asked Questions (FAQs)
Q1: My PSSM is not detecting divergent homologs effectively. What could be wrong? The sensitivity of a Position-Specific Scoring Matrix (PSSM) is highly dependent on the quality and diversity of its seed alignment. If the seed alignment contains sequences that are too similar, the PSSM will not be informative enough for detecting remote homologs. The optimal diversity for a seed alignment is around 30–50% average pairwise identity [31]. Furthermore, the algorithm used to construct the seed alignment significantly impacts performance. For the most accurate detection of a core structural scaffold, consider using seed alignments based on structural similarity (e.g., from VAST) rather than sequence similarity alone, as this has been shown to produce superior results [31].
Q2: What are the primary limitations of using Dynamic Programming (DP) in my reinforcement learning model for protein alignment? While DP provides a strong theoretical foundation, it has key limitations for real-world biological applications:
- Model Dependency: DP algorithms assume a perfect and complete model of the environment, including known transition probabilities and reward functions. In protein research, these are often unknown or too complex to model accurately [32].
- Computational Complexity: The state and action spaces for protein structures are extremely large. DP methods can become computationally prohibitive and time-consuming, suffering from exponential growth in complexity with high-dimensional spaces [32].
Q3: I am working with membrane proteins. Which structural alignment method is most accurate? No single method is universally superior for membrane proteins. A consensus approach is recommended for higher reliability. Fragment-based methods, such as FR-TM-align, have been shown to be particularly useful for aligning membrane protein structures and are better suited for handling large conformational changes [33]. For robust results, combine alignments from multiple methods (e.g., FR-TM-align, DaliLite, MATT, and FATCAT) and use their agreement to assign confidence values to each position in the final alignment [33].
Q4: How can neural networks like DeepBLAST improve my structural alignments when I only have sequence data? Tools like DeepBLAST use neural networks to estimate structural similarity and generate alignments from sequence information alone. They are trained to predict structural alignments that are nearly identical to those produced by state-of-the-art structural alignment algorithms, providing a powerful method for remote homology search and alignment without requiring known 3D structures for all sequences in your analysis [34].
Q5: What does a significant PSSM E-value tell me in a fold recognition server like 3D-PSSM? In servers like 3D-PSSM, a significant E-value indicates that the match between your query sequence and a library template is statistically unlikely to have occurred by chance. This E-value is a composite score based on the compatibility of your sequence with the template's 3D structure, incorporating factors like 1D-PSSMs, 3D-PSSMs, secondary structure matching, and solvent accessibility propensities [35]. A lower E-value corresponds to a higher confidence in the proposed fold assignment.
Troubleshooting Guides
Issue: Low Accuracy in PSSM-Sequence Alignments
Problem: The molecular models generated from your PSSM-sequence alignments have low contact specificity when compared to the known protein structures.
Investigation & Resolution:
Diagnose the Seed Alignment:
- Check the average pairwise identity of the sequences in your seed alignment. If it is above 50%, the PSSM may lack the diversity needed to recognize distant relatives [31].
- Examine the alignment method used. Global sequence aligners (e.g., ClustalW) can produce less accurate PSSM-sequence alignments compared to local or structure-based methods, especially for sequences with low identity [31].
Recommended Protocol for High-Accuracy PSSMs:
- Curate a diverse sequence set: Aim for a seed alignment with 30–50% average pairwise identity [31].
- Use a structure-based alignment algorithm: If 3D structures are available for some family members, construct the seed alignment using a structural alignment tool like VAST or a fragment-based method. Research shows this leads to PSSM-sequence alignments with contact specificity nearly as good as full structure-structure alignments [31] [33].
- Validate with contact specificity: Use a metric like contact specificity to quantitatively assess the accuracy of your predicted molecular models against known structures [31].
Issue: Neural Network Model Fails to Converge During PPI Network Alignment
Problem: Your deep learning model for protein-protein interaction (PPI) network alignment does not converge or produces poor results.
Investigation & Resolution:
Verify Input Features: The RENA (REcurrent neural network Alignment) method demonstrates that successful network alignment relies on combining multiple data types [36] [37]. Ensure your model's input features include:
- Sequence similarity: Incorporate BLAST scores or other sequence comparison metrics.
- Topological similarity: Calculate network-based features like the Page Rank score for nodes in both networks.
Reframe the Problem: The network alignment problem is NP-hard. The RENA approach successfully transforms it into a binary classification problem [37]. For each potential node pair (one from each network), the task is to classify the pair as "Align" or "NotAlign." This structured approach can significantly improve model performance.
Adopt a Proven Architecture: Implement a deep learning architecture that has been shown to work, such as a network with Embedding layers, Recurrent Neural Network (RNN) layers, and Fully Connected (Dense) layers with a softmax activator function for the final classification [37].
Experimental Data & Protocols
Table 1: PSSM-Sequence Alignment Accuracy by Seed Alignment Method
Table comparing the median contact specificity of molecular models derived from PSSMs built using different seed alignment algorithms, across varying levels of sequence diversity [31].
| Seed Alignment Algorithm | Alignment Type | >50% Avg Pairwise Identity | <50% Avg Pairwise Identity |
|---|---|---|---|
| VAST | Local-Structure | ~80% | ~70% |
| BLAST | Local-Sequence | ~80% | Lower than VAST |
| ClustalW-pairwise | Global-Sequence | ~80% | Lower than BLAST |
| ClustalW | Global-Sequence | ~80% | Lowest |
Protocol: Constructing an Optimal PSSM for Remote Homology Detection
This protocol is designed to create a PSSM with high sensitivity and alignment accuracy for detecting divergent protein family members [31].
- Gather Sequences: Collect a diverse set of homologous protein sequences. Use tools like PSI-BLAST to find initial family members.
- Create Seed Alignment:
- Assess Diversity: Calculate the average pairwise identity within the seed alignment. If it is outside the 30-50% range, consider curating the sequence set to achieve better diversity [31].
- Build the PSSM: Use the refined seed alignment as input to a PSSM-construction program, such as the one implemented in PSI-BLAST.
- Iterate and Validate: Use the PSSM to search a sequence database. Statistically significant new hits can be added to the seed alignment to refine the PSSM in an iterative process.
Protocol: Deep Learning-Based PPI Network Alignment (RENA method)
This protocol outlines the steps for predicting node alignments between two PPI networks using a recurrent neural network [37].
- Preprocessing & Feature Extraction:
- Input: Two PPI networks,
N1 = (V1, E1)andN2 = (V2, E2). - Sequence Similarity: For every possible node pair (u, v) where u is in V1 and v is in V2, compute a BLAST score.
- Topological Similarity: For every node in both networks, calculate a Page Rank score. Compute other network topological features as required.
- Input: Two PPI networks,
- Dataset Creation:
- Form a dataset where each data point represents a potential node pair (u, v).
- The features for this pair are the extracted sequence and topological similarities.
- The label is "Align" if the nodes are considered equivalent (e.g., based on known orthology), otherwise "NotAlign."
- Model Training:
- Architecture: Construct a neural network with Embedding layers, RNN layers (e.g., LSTM or GRU), and Fully Connected layers.
- Output Layer: Use a softmax activator function for the binary classification ("Align"/"NotAlign").
- Train the model on the created dataset.
- Alignment Prediction:
- Feed the feature data for all potential node pairs into the trained model.
- The model outputs the predicted probability of alignment for each pair.
Research Reagent Solutions
Table 2: Essential Tools for Machine Learning-Enhanced Protein Alignment
A table of key software tools and their primary functions in this field.
| Tool Name | Type | Primary Function | Relevant Use Case |
|---|---|---|---|
| PSI-BLAST | Algorithm / Server | Constructs PSSMs and performs iterative homology searches [31]. | Building and refining PSSMs from sequence data. |
| VAST | Algorithm | Performs 3D structure-structure alignment [31] [10]. | Creating high-quality seed alignments for PSSMs. |
| DALI / DaliLite | Algorithm / Server | Performs 3D structure alignment based on contact patterns [33] [10]. | Fold comparison and structure-based seed alignment. |
| FR-TM-align | Algorithm | Fragment-based structure alignment, robust for conformational changes [33]. | Aligning membrane proteins or structures with large shifts. |
| DeepBLAST | Algorithm / Software | Neural network for predicting structural alignments from sequence [34]. | Estimating structural similarity when only sequence data is available. |
| T-Coffee (Expresso) | Server | Multiple sequence aligner that can incorporate structural information [38]. | Creating accurate MSAs using 3D structure data. |
| 3D-PSSM | Server | Threading-based fold recognition using 3D profiles [35]. | Predicting 3D structure and function for a protein sequence. |
Workflow and Relationship Diagrams
Protein Structural Alignment Research Workflow
PSSM Quality Factors
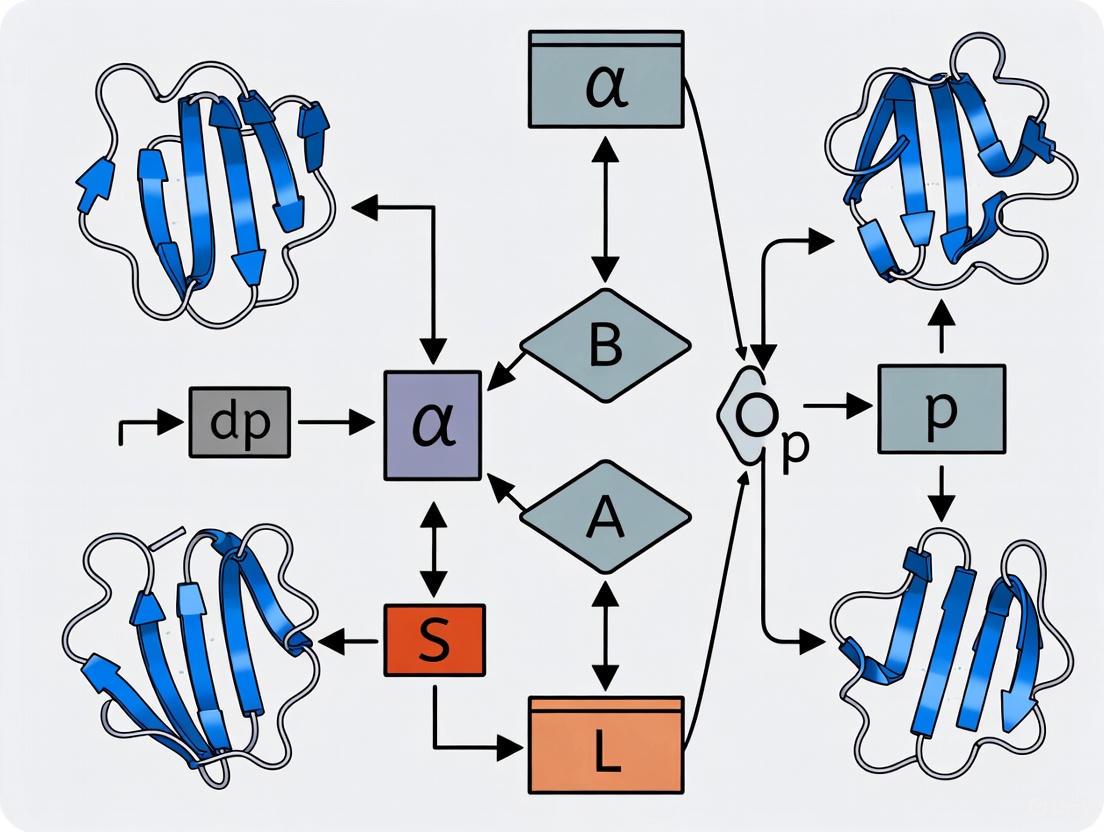
Protein substructure alignment is a fundamental task in computational biology, essential for understanding protein function, evolution, and enabling structure-based drug design. Traditional methods have largely relied on dynamic programming (DP) approaches, which, while effective, face limitations in identifying local functional motifs embedded within different overall fold architectures [39]. PLASMA (Pluggable Local Alignment via Sinkhorn MAtrix) represents a paradigm shift, reformulating the alignment problem as a regularized optimal transport (OT) task [39]. This novel framework leverages differentiable Sinkhorn iterations to provide a learnable, efficient, and interpretable alternative to DP-based methods, capable of accurately aligning partial and variable-length substructures between proteins [39].
The following workflow illustrates PLASMA's core operational process:
Key Research Reagents and Computational Tools
The table below details the essential computational components and their functions within the PLASMA framework:
| Component Name | Type/Function | Key Parameters & Characteristics |
|---|---|---|
| Residue Embeddings [39] | Input Features | d-dimensional vectors from pre-trained protein language models; encode structural/biochemical context |
| Siamese Network [39] | Cost Computation | Learns task-specific residue similarities; uses Layer Normalization (LN) |
| Sinkhorn Iterations [39] | Optimization Core | Entropy-regularized OT solver; produces soft alignment matrix; differentiable |
| Plan Assessor [39] | Similarity Scoring | Summarizes alignment matrix into interpretable κ score [0,1] |
| PLASMA-PF [39] | Parameter-Free Variant | Training-free alternative; maintains competitive performance without task-specific data |
Frequently Asked Questions (FAQs)
Q1: How does PLASMA fundamentally differ from traditional dynamic programming approaches for structural alignment?
PLASMA differs from DP-based methods in both its underlying mathematical framework and its output characteristics. While DP methods rely on recursive scoring and explicit gap penalties to find an optimal path [6], PLASMA reformulates alignment as an entropy-regularized optimal transport problem [39]. This key difference enables PLASMA to naturally handle partial and variable-length matches without requiring explicit fragment enumeration. Additionally, unlike traditional DP with fixed, position-independent gap penalties [6], PLASMA's cost matrix is learnable, allowing it to adapt to specific biological contexts through training. The output also differs significantly: whereas DP produces a single optimal alignment path, PLASMA generates a soft alignment matrix that captures probabilistic correspondences between all residue pairs, providing richer interpretability [39].
Q2: What are the computational complexity requirements of PLASMA, and how do they scale with protein size?
PLASMA achieves a computational complexity of O(N²) [39], where N represents the number of residues in the larger of the two proteins being aligned. This complexity stems primarily from the construction of the pairwise cost matrix and the Sinkhorn iterations. When compared to established methods, this places PLASMA in a favorable position for practical applications: it is approximately 4 times faster than CE and 20 times faster than DALI and SAL [40], making it suitable for large-scale structural comparisons, such as mining the AlphaFold Database (AFDB) for conserved functional motifs.
Q3: My PLASMA alignments appear noisy with weak biological relevance. How can I improve alignment quality?
Poor alignment quality typically stems from suboptimal residue embeddings or cost function miscalibration. Implement the following troubleshooting steps:
- Validate Embedding Quality: Ensure the pre-trained protein language model generating your residue embeddings was trained on diverse structural data. Domain-specific fine-tuning may be necessary for specialized applications.
- Inspect Cost Matrix: Visualize the learned cost matrix to verify it reflects meaningful biochemical or structural similarities. High costs should correspond to residue pairs with low compatibility.
- Adjust Regularization: The entropy regularization parameter (ε) in Sinkhorn iterations balances alignment precision and computational ease. Decrease ε for sharper, more deterministic alignments, but be aware this may increase numerical instability and require more iterations to converge.
- Utilize PLASMA-PF: If you lack high-quality training data, switch to the PLASMA-PF (parameter-free) variant, which provides a robust, training-free alternative that often performs comparably [39].
Q4: During training, the Sinkhorn iterations fail to converge. What could be causing this issue?
Divergence in Sinkhorn iterations often indicates numerical instability, frequently related to the regularization parameter or cost matrix values:
- Regularization Strength: Excessively weak regularization (ε too small) makes the OT problem closer to its original "hard" formulation, leading to numerical overflow. Increase ε to strengthen entropy regularization, which stabilizes the iterative process [39].
- Cost Matrix Scaling: Ensure your cost matrix values are within a reasonable numerical range. Experiment with normalizing or standardizing cost values before feeding them into the Sinkhorn loop.
- Iteration Limit: Implement a practical iteration limit (e.g., 100-1000 steps) with convergence monitoring based on the change in the alignment matrix between steps (e.g., L2-norm difference < 1e-6).
Experimental Protocols and Methodologies
Protocol: Performing Residue-Level Substructure Alignment with PLASMA
This protocol details the steps to align a query protein against a candidate protein to identify conserved local motifs using PLASMA.
Inputs: Two protein structures (Query 𝒫q and Candidate 𝒫c) in PDB format.
Outputs: Soft alignment matrix Ω and interpretable similarity score κ.
Feature Extraction:
- Generate residue-level embeddings
𝑯q ∈ ℝ^(N×d)and𝑯c ∈ ℝ^(M×d)for the query and candidate proteins, respectively, using a pre-trained protein representation model (e.g., a protein language model). The dimensiondis defined by the chosen model [39].
- Generate residue-level embeddings
Cost Matrix Computation:
- Feed the embeddings through the Siamese network architecture to compute the learnable cost matrix
𝒞. - The cost between residue
iof the query and residuejof the candidate is calculated as:𝒞ij = ‖[ϕθ(LN(𝒉q,i)) - ϕθ(LN(𝒉c,j))]+‖1[39] whereϕθis a learnable network,LNdenotes Layer Normalization, and[·]+is the ReLU activation.
- Feed the embeddings through the Siamese network architecture to compute the learnable cost matrix
Optimal Transport Solution:
- Solve the entropy-regularized OT problem using differentiable Sinkhorn iterations.
- Initialize the Sinkhorn kernel:
K = exp(-𝒞/ε), whereεis the regularization parameter. - Iterate until convergence (or for a fixed number of steps):
- The resulting soft alignment matrix is:
Ω = diag(u) · K · diag(v).
Similarity Scoring:
- Pass the alignment matrix
Ωto the Plan Assessor module. - This module summarizes
Ωinto a single, interpretable similarity scoreκin the range [0,1], quantifying the overall quality of the substructure match [39].
- Pass the alignment matrix
Protocol: Large-Scale Database Screening with PLASMA-PF
This protocol uses the parameter-free PLASMA-PF variant for screening a query motif against a large structural database.
Inputs: Query substructure, Database of protein structures. Outputs: Ranked list of candidate proteins with similarity scores.
Preprocessing:
- Convert the entire structural database into residue-level embeddings offline to maximize efficiency.
Alignment:
- For each database protein, run the PLASMA-PF alignment against the query substructure.
- Since PLASMA-PF is training-free, it uses a fixed, biologically informed cost function instead of a learnable one [39].
Post-processing:
- Collect the similarity scores
κfor all query-database pairs. - Rank database proteins in descending order of their
κscores. - Apply a significance threshold (e.g.,
κ > 0.5) to filter low-quality matches and focus on biologically relevant hits.
- Collect the similarity scores
Performance Metrics and Quantitative Evaluation
The table below summarizes key quantitative results demonstrating PLASMA's performance against traditional methods:
| Methodological Category | Example Methods | Key Performance Metrics & Advantages |
|---|---|---|
| Novel OT-Based Alignment [39] | PLASMA, PLASMA-PF | Provides interpretable residue-level alignment; Handles partial/variable-length matches; O(N²) complexity; Accurate on interpolation & extrapolation tasks |
| Classical DP-Based Alignment [6] [40] | TM-align, EIGAs | TM-align: ~4x faster than CE, 20x faster than DALI [40]; EIGAS: Robust to parameter variation & structural uncertainty [6] |
| OT Theory & Applications [41] [42] | Sinkhorn Algorithm | Provides theoretical foundation for PLASMA; Enables differentiable, probabilistic alignments; Foundation for Wasserstein metric |
Frequently Asked Questions (FAQs)
Q1: What is the core innovation of DeepBLAST compared to traditional sequence alignment tools like BLAST? DeepBLAST uses neural networks, trained on protein structures, to predict structural alignments directly from protein sequences. Unlike BLAST, which finds regions of sequence similarity, DeepBLAST identifies structurally homologous regions, allowing it to detect remote evolutionary relationships even when sequence similarity is very low (e.g., below 25% identity) [43] [44].
Q2: I encountered an error: AttributeError: 'function' object has no attribute 'score' when running deepblast-search. How can I resolve it?
This error occurred when using a specific script in the DeepBLAST repository. The issue is documented on the project's GitHub page [45]. For a resolution, check the "Troubleshooting Guide" below and the official GitHub repository's issue tracker for updated scripts and installation instructions.
Q3: Can DeepBLAST perform database-scale searches for structurally similar proteins? While DeepBLAST specializes in performing detailed pairwise structural alignments, its companion tool, TM-Vec, is designed for scalable structural similarity searches in large sequence databases. TM-Vec creates vector embeddings for proteins, enabling fast, index-based queries to find structurally similar proteins before using DeepBLAST for a detailed alignment [43] [44].
Q4: What input data does DeepBLAST require? DeepBLAST requires only the amino acid sequences of the proteins you wish to align. It does not require experimentally determined 3D structures as input. The model has been trained to infer structural relationships directly from sequence information [43].
Troubleshooting Guide
Issue:AttributeError: 'function' object has no attribute 'score'duringdeepblast-search
Problem Description:
When running the deepblast-search script, the program crashes and returns the following traceback error:
This indicates a problem with the align.score function call in the script [45].
Steps to Resolve:
- Verify Installation: Ensure DeepBLAST is installed correctly in a virtual environment using the instructions from the official GitHub repository (
https://github.com/flatironinstitute/deepblast) [45] [34]. - Check Script Version: This error may be due to a version incompatibility or a bug in the script. Consult the "Issues" section of the DeepBLAST GitHub repository to see if a patch or updated script is available.
- Alternative Workflow: If the script is not immediately fixable, consider an alternative approach using the core DeepBLAST model for alignment without the search wrapper. You can load the model checkpoint and perform alignments as demonstrated in the repository's main documentation and examples [34].
Issue: Poor or Unexpected Alignment Results
Problem Description: The alignments produced by DeepBLAST do not match expectations or known structural relationships.
Steps to Resolve:
- Check Sequence Quality: Ensure input sequences are valid amino acid sequences without non-standard characters or formatting errors.
- Understand Limitations: DeepBLAST's accuracy may decline for proteins with very low structural similarity (TM-scores below 0.5, which generally indicate different folds) or for proteins with folds that were not well-represented in the training data [43].
- Validate with Known Structures: If possible, validate the alignment using a known protein structure and a traditional structural alignment tool like TM-align to establish a baseline for performance [12].
Experimental Protocols & Data
Protocol: Benchmarking DeepBLAST on Remote Homology Detection
Objective: To evaluate DeepBLAST's performance against sequence- and structure-based alignment methods on protein pairs with low sequence identity [43].
Methodology:
Dataset Preparation:
- Use standard benchmark datasets such as Malidup (for homologous proteins with structural divergence) and Malisam (for analogous proteins with structural similarity but no common ancestry) [43].
- Ensure test protein pairs have less than 25% sequence identity to focus on the "remote homology" regime.
Execution:
- Run DeepBLAST to generate pairwise alignments for all protein pairs in the test set.
- In parallel, run control alignments using:
- Sequence-based methods: BLAST, HMMER.
- Structure-based methods: TM-align (if structures are available for reference).
Analysis:
- Compare the accuracy of the predicted alignments against a ground truth, which is typically the structural alignment from TM-align.
- Use metrics like TM-score to quantify the quality of the structural superposition implied by the sequence-based alignment.
Key Results from Published Benchmarks: The following table summarizes DeepBLAST's performance compared to other methods on remote homology detection tasks [43].
| Method | Input Type | Alignment Type | Performance on low-sequence-identity pairs (<25%) |
|---|---|---|---|
| DeepBLAST | Sequence | Structural | High accuracy, similar to structure-based methods |
| BLAST | Sequence | Sequence | Fails to detect significant similarity |
| HMMER | Sequence | Sequence (Profile) | Struggles with very low sequence identity |
| TM-align | Structure | Structural | Gold standard, but requires 3D structures |
Workflow Diagram
The Scientist's Toolkit: Research Reagent Solutions
The following table details key computational tools and resources essential for working with DeepBLAST and related structural alignment research.
| Tool / Resource | Type | Primary Function | Relevance to DeepBLAST Research |
|---|---|---|---|
| DeepBLAST | Software Tool | Predicts structural alignments from protein sequences. | Core method for sequence-based structural alignment. Used for final pairwise alignment after a search. |
| TM-Vec | Software Tool | Performs fast, scalable searches for structurally similar proteins in sequence databases. | Companion tool for database-scale structural homology detection before detailed DeepBLAST alignment [43] [44]. |
| TM-align | Software Tool | Measures structural similarity between two 3D protein structures. | Provides the "ground truth" structural alignments and TM-scores used to train and benchmark DeepBLAST [43] [12]. |
| CATH/SWISS-MODEL | Protein Database | Curated databases of protein structures and domains. | Source of high-quality data for training and benchmarking remote homology detection tools [43]. |
| AlphaFold2/ESMFold | Structure Prediction Tool | Predicts 3D protein structures from amino acid sequences. | Can be used to generate predicted structures for validation or to expand the set of proteins with structural information [46]. |
| Protein Language Models (e.g., ESM-2) | Computational Model | Generates numerical representations (embeddings) of protein sequences. | The foundational technology that provides the input features for DeepBLAST's neural network, capturing evolutionary and structural information [46]. |
Optimizing Performance: Overcoming Common Challenges and Parameter Tuning
Frequently Asked Questions (FAQs)
FAQ 1: What is the fundamental difference between linear and affine gap penalties, and when should I use each?
Linear gap penalties assign a fixed cost for each gap character, calculated as Penalty = k * length [18]. While computationally simple, this model often lacks biological realism as it does not account for the empirical observation that initiating a gap (a rare evolutionary event) is costlier than extending an existing one [18]. Affine gap penalties address this by implementing a two-part cost: a gap opening penalty applied once for a new gap, and a smaller gap extension penalty for each subsequent extension, calculated as Penalty = o + e * (length - 1) [18]. You should use affine gap penalties for most protein structural alignment tasks, as they are more biologically realistic and are widely used in algorithms like BLAST and CLUSTAL [18]. Reserve linear gap penalties for initial, computationally inexpensive explorations.
FAQ 2: How do I select appropriate gap opening and gap extension penalties for my protein alignment project?
Selecting gap penalties depends on your sequences and the biological question [18]. However, typical values provide a starting point for experimentation. For protein sequences, common gap opening penalties range from -10 to -15, and gap extension penalties from -0.5 to -2, maintaining an opening-to-extension ratio between 10:1 and 20:1 [18]. For DNA sequences, gap opening penalties are typically higher, ranging from -15 to -20, with extension penalties from -1 to -2 [18]. Empirical determination using benchmark datasets with known correct alignments (like BAliBASE) or parameter sweeping is recommended for fine-tuning these values for your specific protein family [18].
FAQ 3: Should I use a general-purpose scoring matrix like BLOSUM62, or is a specialized matrix better for protein structural alignment?
Your choice should be guided by the context of your analysis. General-purpose matrices (e.g., BLOSUM, PAM) are derived from averaged substitution frequencies across many protein families and are essential for tasks like database searches where the query sequence may be aligned with millions of diverse sequences [16]. However, for aligning sequences from a known protein family, family-specific similarity matrices can significantly improve alignment quality by capturing unique substitution patterns that general-purpose matrices average out [16]. Research indicates that using family-specific matrices offers significant improvements for homologous sequences, while fold-specific matrices provide only marginal gains for analogous proteins sharing the same fold but no common evolutionary origin [16].
FAQ 4: Why does my alignment change dramatically with small changes in gap penalties, and how can I achieve more stable results?
This high sensitivity is a known challenge, often indicating that your alignment is in a region of "parameter space" where the optimal solution shifts abruptly. To achieve stability:
- Use Empirical Validation: Benchmark your parameter choices on a subset of sequences with known correct alignments (from structural superpositions) to find a robust parameter set [16].
- Adopt an Adaptive Procedure: Implement or use tools that automatically select appropriate similarity matrices and optimized gap penalties based on the properties of the input sequences [16].
- Iterative Refinement: Employ algorithms that use iterative refinement techniques, which can dynamically adjust gap penalties during the process to prevent errors like gap propagation [18].
- Explore Hybrid Methods: Consider advanced algorithms like GADP-align, which combines a genetic algorithm with dynamic programming to explore the global alignment space and avoid getting trapped in local optima caused by unsuitable initial parameters [9].
Troubleshooting Guides
Problem: Over-fragmented Alignments with Excessive Short Gaps
- Symptoms: The resulting alignment contains many short, scattered gaps, making it difficult to identify conserved blocks and domains.
- Possible Causes:
- Gap opening penalty is too high relative to the extension penalty: The algorithm finds it cheaper to open multiple new short gaps rather than extending a single existing gap [18].
- Gap extension penalty is too low: Extending a gap is so inexpensive that there is no disincentive against creating many of them [18].
- Solutions:
- Decrease the gap opening penalty or increase the gap extension penalty to make extending an existing gap more favorable than opening a new one [18].
- Ensure the ratio between your gap opening and extension penalties is appropriate (e.g., between 5:1 and 20:1 for proteins).
- Switch from a linear to an affine gap penalty model if you haven't already [18].
Problem: Excessively Long Gaps That Do Not Reflect Biological Reality
- Symptoms: The alignment contains a few, unusually long gaps that likely do not represent true evolutionary events.
- Possible Causes:
- Gap extension penalty is too low: Once a gap is opened, the cost to extend it is minimal, allowing it to grow with little penalty [18].
- The scoring matrix or gap penalties are not optimized for the specific protein family.
- Solutions:
- Increase the gap extension penalty to impose a higher cost for each additional gap character.
- Consider implementing convex or non-linear gap penalties, where the cost per additional gap decreases as the gap length increases, which can be more biologically realistic for certain genomic regions [18].
- Investigate if family-specific scoring matrices yield more biologically plausible gaps [16].
Problem: Poor Alignment Quality with Distantly Related Proteins
- Symptoms: Key structural motifs fail to align, or the overall alignment score is low even when structural similarity suggests a relationship.
- Possible Causes:
- Use of an inappropriate general-purpose scoring matrix: Default matrices may not capture the viable substitutions for your specific protein family [16].
- Overly stringent gap penalties preventing the introduction of necessary gaps in low-similarity regions.
- Solutions:
- Use a family-specific similarity matrix if one is available for your protein family of interest [16].
- Derive a custom scoring matrix from a curated multiple sequence alignment of your target protein family, if sufficient data is available [16].
- Slightly lower gap opening penalties to allow for more indels, which are more common in divergent sequences, but monitor for over-fragmentation.
Quantitative Data Reference
Typical Gap Penalty Ranges
| Sequence Type | Gap Opening Penalty | Gap Extension Penalty | Common Ratio (Open:Extend) |
|---|---|---|---|
| Protein | -10 to -15 | -0.5 to -2.0 | 10:1 to 20:1 [18] |
| DNA | -15 to -20 | -1.0 to -2.0 | ~10:1 [18] |
Performance Comparison of Scoring Matrices
| Matrix Type | Basis of Derivation | Best Use Case | Relative Performance |
|---|---|---|---|
| General-Purpose (e.g., BLOSUM62) | Average of many diverse protein families [16] | Database searches, initial analysis | Baseline |
| Family-Specific | Substitutions within a specific protein superfamily [16] | Aligning known homologs | Significant improvement for homologous sequences [16] |
| Fold-Specific | Substitutions within a common structural fold (analogous proteins) [16] | Analyzing structural analogy | Marginal improvement for analogous sequences [16] |
Experimental Protocols
Protocol 1: Empirical Determination of Optimal Gap Penalties
This protocol uses a benchmark dataset to find the gap penalty pair that produces the most accurate alignments for your specific type of data [16].
- Obtain a Benchmark Dataset: Use a curated set of protein pairs with known reference alignments based on structural superposition (e.g., from SABmark or BAliBASE) [16].
- Define a Parameter Grid: Create a grid of gap opening penalties (e.g., from -5 to -20 in steps of 2) and gap extension penalties (e.g., from -0.5 to -3 in steps of 0.5).
- Run Alignment and Evaluation: For each (opening, extension) penalty pair in the grid, perform a global pairwise alignment of each benchmark pair.
- Measure Accuracy: Compare each test alignment to its reference structural alignment. Calculate a quality metric, such as the percentage of correctly aligned positions (Q-score) [16].
- Identify Optimal Parameters: The penalty pair that yields the highest average Q-score across the benchmark dataset is optimal for your data type.
Protocol 2: Derivation of a Family-Specific Scoring Matrix
This methodology outlines how to create a custom log-odds similarity matrix tailored to a specific protein family [16].
- Compile Reference Alignments: Gather a set of high-quality, structure-based pairwise sequence alignments for a specific protein family or superfamily (e.g., from the SABmark Superfamily set) [16].
- Calculate Observed Frequencies: For the set of alignments, count the occurrences
f(i, j)of each amino acid pair(i, j)in aligned positions. The observed frequencyq(i, j)isf(i, j)divided by the total number of aligned pairsn[16]. - Calculate Expected Frequencies: Compute the background frequency
p(i)of each amino acidiin the dataset. The expected frequency of pair(i, j)under random association ise(i, i) = p(i)^2for matches ande(i, j) = 2 * p(i) * p(j)for mismatches(i ≠ j)[16]. - Compute Log-Odds Scores: Calculate the raw score for each pair as
2 * log2( q(i,j) / e(i,j) )[16]. - Handle Sparse Data: To account for limited data in small families, form a weighted combination of the new score and a score from a general-purpose matrix (e.g., VTML200). The weight
wfavors the family-specific data as the total number of aligned pairsnincreases:w = 1 - 10^(-n/8000)[16]. - Round and Format: Round the final combined scores to the nearest integer to create the family-specific scoring matrix.
Workflow Visualizations
The Scientist's Toolkit: Research Reagent Solutions
| Item | Function & Application |
|---|---|
| SABmark Database | A "gold standard" database of reference protein alignments based on structural superposition. Used for benchmarking the accuracy of alignment algorithms and parameters [16]. |
| BAliBASE | A benchmark database of manually refined multiple sequence alignments, specifically designed for evaluating and comparing multiple alignment programs. |
| Family-Specific Similarity Matrices | Custom scoring matrices derived from the substitution patterns of a specific protein family. They significantly improve alignment accuracy for homologous sequences over general-purpose matrices [16]. |
| ESPript/ENDscript | A tool for rendering sequence alignments with secondary structure information and mapping this data onto 3D protein structures, facilitating visual analysis of alignment quality [47]. |
| GADP-align Algorithm | A hybrid method for protein structure alignment that combines a genetic algorithm with iterative dynamic programming, helping to avoid local optimal traps and find globally better alignments [9]. |
| NCBIs MSA Viewer | A web application for visualizing multiple sequence alignments, allowing for easy navigation, assessment of conservation, and identification of gaps and insertions [48]. |
For researchers in computational biology and drug development, accurately aligning protein structures is a fundamental task for inferring evolutionary relationships, predicting protein function, and identifying novel drug targets. Dynamic programming (DP) provides a computationally efficient, polynomial-time solution for finding optimal alignments by breaking the problem into simpler sub-problems [6]. However, a significant limitation of standard DP is its susceptibility to becoming trapped in local optima—good but suboptimal alignments that prevent the discovery of the true global best solution, especially when comparing distantly related proteins with low sequence similarity (the "twilight zone") [49]. To overcome this, the field has developed hybrid algorithms that combine the robustness of dynamic programming with other strategic search and refinement techniques. These hybrids are engineered to escape local optima, thereby enhancing the global search for the most biologically meaningful structural alignments. This technical support center is designed to help you understand, implement, and troubleshoot these advanced methodologies within your research.
Frequently Asked Questions (FAQs)
Q1: Why would my structural alignment algorithm fail to identify a known homologous structure, and how can a hybrid approach help?
A1: This failure often occurs when the algorithm's search gets trapped in a local optimum, a common pitfall when using a single scoring function or search strategy. Hybrid approaches combat this by integrating multiple techniques.
- Mechanism: They might use a fast, coarse-grained method to identify promising regions of the search space (global search) before applying precise, DP-based alignment (local refinement) [50] [51]. Other strategies incorporate clustering (like K-means) to group similar residues or fragments, effectively reducing noise in the similarity matrix and providing a better starting point for DP [49]. Furthermore, some algorithms introduce temporary local flexibility in protein backbones during intermediate alignment steps, allowing the algorithm to explore alignments that would be impossible under a rigid model, before restoring geometric consistency in the final output [52].
Q2: What is the practical difference between "sequential" and "non-sequential" alignment, and when should I consider a non-sequential method?
A2: This distinction is critical for detecting specific evolutionary events.
- Sequential Alignment requires that aligned residues appear in the same linear order along the protein backbone. This is the standard for most DP-based methods and is suitable for the majority of homologous proteins [6] [53].
- Non-sequential Alignment allows for the alignment of residues in a different order. This is essential for detecting circular permutations, where the N-terminal and C-terminal segments of a protein have been swapped during evolution [53]. If your proteins are known or suspected to exhibit such rearrangements, you should seek out methods that use techniques like geometric hashing or bipartite graph matching instead of, or in combination with, standard sequential DP [6] [53].
Q3: My alignment results are highly sensitive to small changes in gap penalties or other parameters. How can I make my pipeline more robust?
A3: Parameter sensitivity is a classic sign of an algorithm operating near a decision boundary. Hybrid strategies can enhance robustness.
- Solutions: First, consider using algorithms known for their inherent robustness. Some DP-based methods, like EIGAs, have been shown to remain effective over a broad range of parametric values due to the discrete nature of the DP recursion [6]. Second, incorporate a Double Dynamic Programming (DDP) strategy. DDP refines the initial similarity matrix by applying a second layer of DP, which helps to smooth out noise and stabilize the final alignment against minor parametric fluctuations [49]. This layered approach makes the alignment process less sensitive to the exact initial parameters.
Troubleshooting Guides
Problem: Poor Performance on Remote Homology Detection
- Symptoms: Your algorithm fails to align proteins with high structural similarity but very low sequence identity (<20%), or it returns alignments with insignificant TM-scores.
- Diagnosis: Standard sequence-based or single-method DP approaches are unable to escape local optima caused by divergent sequences.
- Solution: Implement an embedding-based hybrid pipeline.
- Generate Embeddings: Use a protein Language Model (pLM) like ProtT5 or ESM-1b to convert each amino acid in your sequences into a high-dimensional vector (embedding) that captures evolutionary and physicochemical contexts [49].
- Construct & Refine Similarity Matrix: Compute a residue-residue similarity matrix using Euclidean distance between embeddings. Refine this noisy matrix using Z-score normalization and K-means clustering to group similar residue types, which clarifies the signal [49].
- Apply Double Dynamic Programming (DDP): Use a first pass of DP to generate an initial guide. Then, apply a second DP pass on a refined matrix based on this guide to produce the final, high-quality alignment [49].
- Verification: Validate against a benchmark like PISCES (≤30% sequence identity) by checking the Spearman correlation between your alignment scores and true TM-scores [49].
Problem: Inability to Align Flexible or Multi-Domain Proteins
- Symptoms: The alignment covers only one rigid domain, missing other structurally conserved regions in flexible loops or hinged domains.
- Diagnosis: A rigid-body alignment model is unable to account for protein flexibility and conformational changes.
- Solution: Use a flexible fragment-chaining hybrid algorithm like Matt.
- Fragment Pair Generation: Break the protein structures into short, aligned fragment pairs (AFPs) [52].
- Flexible Chaining: During the dynamic programming chaining step, temporarily allow small translations and rotations between fragments. This "bending" helps bring distant AFPs into better alignment, escaping the local optimum of a single rigid-body transformation [52].
- Rigid-Body Finalization: After the flexible chaining identifies the optimal set of correspondences, perform a final rigid-body superposition on the aligned core to restore geometric plausibility [52].
- Verification: Check if the resulting alignment improves the coverage of known domains and secondary structure elements (e.g., helix ends) compared to a rigid aligner, particularly on a benchmark like SABmark [52].
Problem: Computationally Prohibitive Runtime on Large-Scale Database Searches
- Symptoms: Alignment of a single query against a large database (e.g., Swiss-Prot) takes too long for practical high-throughput research.
- Diagnosis: The O(n²) time complexity of standard DP is a bottleneck, despite its polynomial nature.
- Solution: Integrate a fast filtering step with a spatial indexing system, as used by GTalign.
- Rapid Filtering: Use a fast, lightweight method (e.g., k-mer matching or secondary structure element comparison) to quickly filter out thousands of insignificant database matches [50] [51].
- Spatial Indexing & Parallelization: For the promising candidates, use an algorithm that builds a spatial index for each structure. This allows for O(1) look-up of closest residues after superposition, bypassing the slower sequential DP in the initial phases. This entire process can be highly parallelized across CPU threads [50].
- Optimal Superposition Search: The algorithm iterates through candidate superpositions in parallel, using the spatial index to derive alignments rapidly, ultimately selecting the one with the highest TM-score [50].
- Verification: GTalign has demonstrated speedups of 104x to over 1400x compared to TM-align on full database searches while maintaining or improving accuracy [50].
Experimental Protocols & Workflows
Core Protocol: Embedding-Based Alignment with Clustering and DDP
This protocol is designed for detecting remote homology where traditional sequence alignment fails [49].
- Input: Two protein sequences (A and B) with unknown homology.
- Materials/Software: Python environment, bio-embeddings library (for ProtT5/ESM-1b), NumPy/SciPy, clustering library (e.g., scikit-learn).
| Step | Procedure | Key Parameters |
|---|---|---|
| 1. Embedding Generation | Process sequences A and B with a pretrained pLM (e.g., ProtT5) to extract residue-level embedding vectors. | Model: ProtT5-XL-UniRef50 (output dim: 1024) |
| 2. Similarity Matrix (SM) Construction | Compute pairwise Euclidean distance between all residues of A and B. Convert distances to similarities: ( SM{a,b} = \exp(-δ(pa, q_b)) ) | Distance metric: Euclidean |
| 3. Z-score Normalization | Normalize SM row-wise and column-wise to reduce noise. Calculate final score: ( SM'{a,b} = (Zr(a,b) + Z_c(a,b))/2 ) | Normalization: Standard Z-score |
| 4. K-means Clustering | Apply K-means to cluster all residue embeddings from both sequences. Create a new, cleaner similarity matrix based on cluster centroids. | n_clusters: Tunable (e.g., 50) |
| 5. Double Dynamic Programming | First Pass: Run global DP on the clustered similarity matrix to get a guide path. Second Pass: Run DP again on a refined matrix biased by the guide path for the final alignment. | Gap penalties: ( ρo ), ( ρc ) (Affine) |
Validation Protocol: Benchmarking Against Known Standards
- Objective: Quantify the performance of your hybrid alignment method.
- Datasets:
- Metrics:
- TM-score: A scale-independent measure of structural similarity. >0.5 indicates same fold, <0.2 random similarity [50].
- RMSD: Root-mean-square deviation of aligned Cα atoms (lower is better).
- Alignment Length: Number of residues in the common core.
- Procedure: Run your algorithm on the benchmark dataset. For each protein pair, calculate the TM-score of your alignment and compare it to the reference score from a high-accuracy aligner like TM-align or the dataset's curated reference.
The Scientist's Toolkit: Research Reagent Solutions
Table: Essential Computational Tools for Hybrid Protein Alignment
| Tool Name | Type | Primary Function in Hybrid Workflow | Key Hybrid Feature |
|---|---|---|---|
| ProtT5 / ESM-1b [49] | Protein Language Model | Generates contextual residue embeddings from sequence alone. | Provides the input features for embedding-based DDP. |
| GTalign [50] | Structural Aligner | Rapid database-scale protein structure alignment and search. | Combines spatial indexing & parallelization with optimal superposition search. |
| Matt [52] | Multiple Structure Aligner | Aligns protein structures allowing for local flexibility. | Uses flexible AFP chaining before final rigid-body superposition. |
| TM-align [50] | Structural Aligner | High-accuracy pairwise structure alignment; used for validation. | Employs iterative DP in a heuristic search for optimal TM-score. |
| Dali [53] [50] | Structural Aligner | Distance matrix-based alignment; good for remote homology. | Uses a heuristic search for matching contact patterns. |
Performance Data & Validation
Table: Example Performance Comparison of Alignment Strategies
| Algorithm / Strategy | Reported TM-score (Avg. on SCOPe) | Key Metric Improvement | Typical Use Case |
|---|---|---|---|
| Standard DP (e.g., early tools) | Baseline | Reference | Basic sequential alignment |
| + DDP & Clustering [49] | Increased | Improved remote homology detection (Spearman ρ vs. TM-score) | Twilight zone alignment |
| + Spatial Indexing (GTalign) [50] | Up to 7% more pairs with TM-score ≥0.5 vs. TM-align | 104x-1424x speedup on Swiss-Prot database | Large-scale database search |
| + Local Flexibility (Matt) [52] | Competitive on Homstrad, superior on SABmark | Better alignment of helix/strand ends in distant homologs | Flexible, multi-domain proteins |
Frequently Asked Questions (FAQs)
FAQ 1: Why is searching modern protein structure databases so computationally expensive? The primary reason is the massive scale of current databases. With resources like the AlphaFold Database containing over 214 million predicted structures, traditional structural alignment tools that perform iterative optimizations for each comparison are overwhelmed. A single query against a 100-million-structure database using a tool like TM-align could take a month on one CPU core [54]. The computational complexity of these algorithms, often requiring O(N³) memory or more for optimal alignment, is not scalable to this new era of structural data [55].
FAQ 2: What are the main types of computational bottlenecks I might encounter? You will typically face two distinct bottlenecks:
- Memory (RAM) Bottleneck: Optimal alignment algorithms, especially those using dynamic programming for RNA secondary structure or complex protein comparisons, can have O(N³) memory complexity. This can require over 150 GB of RAM for a single ribosomal RNA alignment, making it impractical on standard hardware [55].
- Speed (CPU Time) Bottleneck: Conventional structural aligners like Dali or TM-align rely on iterative optimization and can process only a few structures per second. Searching the entire AlphaFold DB with them could take dozens of hours or more, even with multiple CPUs [56].
FAQ 3: Are there strategies that help with both speed and memory issues? Yes. The filter-and-refine strategy is highly effective. This approach uses a fast, lightweight filter (e.g., based on structural alphabets or k-mer matching) to quickly discard the vast majority of non-homologous structures in a database. The remaining few candidate hits are then processed with a slow, accurate refinement aligner. This strategy reduces the number of costly alignments, saving both time and memory [56].
FAQ 4: My research requires mathematically optimal alignments. Are the faster methods just approximations? Not necessarily. While many fast methods use heuristics, divide-and-conquer dynamic programming algorithms can guarantee optimality while drastically reducing memory usage. For example, such an algorithm can reduce the memory needed for a ribosomal RNA alignment from 150 GB to 270 MB, albeit with a small constant-factor increase in computation time [55].
Troubleshooting Guides
Issue 1: Runs Out of Memory (RAM) During Structural Alignment
Problem: Your program fails with an "out of memory" error when aligning large protein structures or RNA sequences.
Diagnosis: This is common when using optimal alignment algorithms on large biomolecules. The memory requirement of dynamic programming often scales polynomially with sequence length (e.g., O(N²) or O(N³)).
Solution Steps:
- Switch to a Memory-Efficient Algorithm: Implement or use tools that employ a divide-and-conquer dynamic programming strategy.
- Workflow: These algorithms work by recursively splitting the alignment problem into smaller sub-problems. They calculate forward and backward DP matrices for a midpoint, identify the optimal path cell, and then solve the two smaller sub-alignments, drastically reducing the memory footprint [55].
- Example: The memory-efficient variant of the CYK/inside algorithm for RNA structural alignment [55].
- Utilize Linear Encoding Filters: For database searches, use a tool that first filters candidates using a method with low memory overhead.
- Method: Tools like SARST2 or Foldseek first encode protein structures as strings of a structural alphabet (e.g., 3Di alphabet or SSE sequences). The initial search is then a fast sequence alignment that requires significantly less memory [56] [54].
- Expected Outcome: SARST2 can search the entire AlphaFold DB using only 9.4 GiB of RAM, compared to 77.3 GiB for BLAST [56].
Issue 2: Database Searches Are Impractically Slow
Problem: A structural search against a large database (e.g., AlphaFold DB, PDB) takes days or weeks to complete.
Diagnosis: You are likely using a traditional full-scale structural aligner (like TM-align or Dali) for the entire database search.
Solution Steps:
- Adopt a Modern Filter-and-Refine Search Tool: Use tools specifically designed for massive database scales.
- Recommended Tools: Foldseek, SARST2, or GTalign.
- Protocol: a. Indexing: The tool pre-processes the database, converting 3D structures into a searchable index (e.g., 3Di strings for Foldseek, or a grouped database for SARST2). b. Fast Filtering: Your query structure is also encoded and rapidly compared against the database index using k-mer matching and fast pre-alignment algorithms. c. Refinement: A small subset of top candidate hits (e.g., a few hundred) undergoes a detailed, slow structural alignment with a method like TM-align.
- Expected Outcome: Foldseek is ~184,600x faster than Dali and ~23,000x faster than TM-align for a search in AlphaFold DB, reducing search time from days to seconds [54]. SARST2 completes a 100% answer-recalled search in just 3.4 minutes [56].
- Leverage Spatial Indexing and Parallelization: Use tools that exploit modern CPU architectures.
- How it Works: Tools like GTalign create a spatial index for each structure, allowing them to parallelize all alignment steps across residues and structure pairs. This changes the time complexity of key steps from quadratic to sub-linear [50].
- Expected Outcome: GTalign is 104–1424x faster than a highly parallelized TM-align (using 40 CPU threads) while being more accurate [50].
Issue 3: Need to Balance Speed and Accuracy for High-Throughput Work
Problem: You have thousands of structures to process and need a "good enough" result quickly, without the overhead of optimal alignment.
Solution Steps:
- Use Structural Alphabet-Based Alignment: Rely on the fast alignment step of tools like Foldseek without the final refinement.
- Method: The tool represents tertiary amino acid interactions as sequences over a 3Di alphabet. Structural similarity is then computed using highly optimized sequence alignment techniques. This bypasses the need for iterative 3D superposition [54].
- Accuracy Trade-off: This method is extremely fast (4-5 orders of magnitude faster) and maintains high sensitivity, often matching or exceeding the sensitivity of traditional aligners at the family and superfamily level [54].
- Adjust Algorithmic Parameters: Many modern tools have speed presets.
- Example: GTalign has a
--speedoption where higher values prioritize speed. You can benchmark different settings on a subset of your data to find an acceptable balance [50].
- Example: GTalign has a
Performance Comparison of Structural Search Tools
The table below summarizes the quantitative performance of modern tools as reported in benchmarks, providing a guide for selecting the right tool for your experiment.
Table 1: Performance Metrics of Protein Structure Search Tools
| Tool | Key Strategy | Reported Speed vs. TM-align | Reported Memory Use | Key Metric (vs. TM-align) |
|---|---|---|---|---|
| Foldseek [54] | 3Di structural alphabet & prefiltering | 23,000x faster (AlphaFold DB) | Not Specified | 86% sensitivity (SCOPe family) |
| SARST2 [56] | Filter-and-refine with ML, WCN scoring | 2.8x faster (AlphaFold DB) | 9.4 GiB (vs. 77.3 GiB for BLAST) | 96.3% Avg. Precision (vs. 94.1%) |
| GTalign [50] | Spatial indexing & parallelization | 104-1424x faster (Swiss-Prot) | Not Specified | Produces 7% more alignments with TM-score ≥0.5 |
| Memory-Efficient DP [55] | Divide-and-conquer algorithm | ~2x slower (time cost) | 270 MB (vs. 150 GB) | Guarantees mathematically optimal alignment |
Experimental Protocol: Fast Structural Homology Search with Foldseek
This protocol outlines how to use Foldseek for a rapid and sensitive search against a massive database like the AlphaFold Database, based on the methodology described in its publication [54].
1. Principle Foldseek accelerates protein structure search by describing the tertiary interactions of residues as a sequence of letters from a structural alphabet (3Di). This reduces the 3D structure comparison problem to a fast 1D sequence alignment problem, preceded by highly efficient prefiltering.
2. Research Reagent Solutions Table 2: Essential Components for a Foldseek Experiment
| Item | Function / Description |
|---|---|
| Foldseek Software | The main executable for local searches. Available from https://foldseek.com/ [54]. |
| Query Structure (PDB/mmCIF) | Your protein of unknown function or structure in PDB or mmCIF format. |
| Target Database (e.g., AFDB) | The pre-indexed database of structures to search against (e.g., AlphaFold DB, PDB). |
| 3Di Substitution Matrix | A pre-trained matrix that provides log-odds scores for substituting one 3Di state for another, analogous to an AA substitution matrix [54]. |
| MMseqs2 Prefilter Modules | Integrated modules from the MMseqs2 software for k-mer-based prefiltering and gapless alignment, which enable the initial high-speed screening [54]. |
3. Workflow Diagram
The following diagram illustrates the step-by-step process of the Foldseek algorithm, from input structure to final aligned hits.
4. Step-by-Step Procedure
- Step 1: Encode Structures. Foldseek converts the 3D coordinates of both the query and all database structures into a 3Di sequence. For each residue, the algorithm identifies its spatially closest neighbor and assigns a letter from the 3Di alphabet that describes the geometric conformation of this interaction [54].
- Step 2: Prefilter Database. The encoded query 3Di sequence is compared to the database of 3Di sequences using the fast MMseqs2 prefilter. This stage uses k-mer matching and gapless alignment to rapidly discard the vast majority of non-homologous structures, producing a shortlist of candidate hits [54].
- Step 3: Align 3Di Sequences. For each candidate hit from the prefilter, a local structural alignment is performed using dynamic programming. The alignment score combines the 3Di substitution score and the standard amino acid substitution score [54].
- Step 4: (Optional) Refine with 3D Superposition. For the highest-scoring hits, a final refinement can be performed using a traditional 3D aligner like TM-align. In "Foldseek-TM" mode, this step is integrated to provide a globally superposed alignment [54].
- Step 5: Output and Analyze. The results are ranked by a composite score (bit score × geometric mean of TM-score and LDDT). Foldseek provides E-values calculated by a neural network and the probability of homology for each match [54].
Frequently Asked Questions (FAQs)
FAQ 1: What is the primary advantage of using a hybrid method like GADP-align over pure dynamic programming for protein structural alignment?
GADP-align combines a genetic algorithm (GA) with iterative dynamic programming (DP) to overcome key limitations of pure DP approaches. The primary advantage is its ability to avoid local optimal traps caused by unsuitable initial guesses of corresponding residues. While DP efficiently finds an optimal alignment for a given residue correspondence, the genetic algorithm provides a global search mechanism. It explores the alignment space heuristically before refining results with DP, leading to more accurate alignments, especially for 'difficult to align' protein pairs with low sequence identity or differently sized secondary structure elements (SSEs) [9].
FAQ 2: My algorithm produces a strong structural alignment, but it contradicts known biological function. How should I proceed?
This indicates a potential misalignment. First, verify your algorithm's parameters, especially the scoring function. Ensure it incorporates biologically relevant constraints. Second, cross-validate the result using an independent method, such as:
- Manual inspection of key functional motifs (e.g., active sites).
- Consensus alignment using a different algorithmic strategy (e.g., Monte Carlo in DALI or clique-matching in CLICK) [9]. If the contradiction persists, the structural similarity might not imply functional similarity, highlighting the need to integrate evolutionary, phylogenetic, or experimental data to interpret the result correctly.
FAQ 3: What are the standard metrics for evaluating the biological relevance of a structural alignment beyond RMSD?
While Root-Mean-Square Deviation (RMSD) measures structural similarity, it is size-dependent and can be misleading. The following table summarizes key metrics for biological relevance:
Table 1: Metrics for Evaluating Biological Relevance of Structural Alignments
| Metric | Description | Interpretation |
|---|---|---|
| TM-Score | A size-independent metric that measures global structural similarity; values range from 0-1 [9]. | >0.5 suggests proteins share the same fold. <0.2 indicates random similarity. |
| GDT_TS (Global Distance Test Total Score) | Measures the average percentage of residues under a defined distance cutoff (e.g., 1, 2, 4, 8 Å) [57]. | A higher percentage indicates a more accurate and biologically plausible model. |
| Z-Score | Used in threading methods; represents the distance between the optimal alignment score and the mean score from random sequences [57]. | A higher Z-score indicates the fold is more likely to be correct and not a product of chance. |
| Conservation of Functional Residues | Checks if catalytically important residues or binding sites are aligned. | Directly assesses the alignment's functional plausibility. |
FAQ 4: How do I select an appropriate initial template for homology modeling or threading?
The selection is primarily based on sequence identity and coverage.
- High Sequence Identity (>30-40%): Use homology-based modeling. The structure of a close homolog will provide a highly reliable template [58] [57].
- Low Sequence Identity (<20-30%): Use threading. This method is based on the observation that the number of folds in nature is limited, so even distant sequences can share similar structures. It uses knowledge-based scoring functions to find the best fold from a library [58] [57]. Always use multiple criteria for template selection, including structural quality (e.g., resolution of an X-ray structure) and the presence of key functional domains, not just the highest sequence identity.
Troubleshooting Guides
Problem 1: Algorithm Fails to Align Key Secondary Structure Elements (SSEs)
Issue: The alignment algorithm produces a result where known α-helices or β-strands in one protein are misaligned or not aligned with their counterparts in the other.
Diagnosis and Solutions:
- Check Initial SSE Matching: Algorithms like GADP-align and TM-align first create an initial map of corresponding SSEs. If this step fails, the residue-level alignment will be incorrect. Verify the method used for SSE sequence alignment (e.g., Needleman-Wunsch dynamic programming) and the scoring for identical/non-identical SSEs [9].
- Adjust GA Operators: If using a hybrid GA method, the shift operator is critical for finding global optimal matching between SSE sequences. This operator shifts SSEs left or right along the protein chain. If SSEs are misaligned, tuning the shifting probability (Ps) may be necessary [9].
- Review Scoring Function: The scoring function may not adequately penalize gaps within core secondary structures. Modify the function to reflect the higher conservation of SSEs compared to loop regions.
Problem 2: Computed Structural Model is Physically Unrealistic
Issue: A predicted protein model or an alignment result has poor stereochemistry, such as clashing atoms, unusual bond lengths, or high-energy side-chain conformations.
Diagnosis and Solutions:
- Energy Minimization: Subject the final model to a round of energy minimization using molecular dynamics force fields. This process relaxes the structure into a more stable, physically realistic conformation [58].
- Quality Assessment Tools: Always run your model through quality assessment servers or software (e.g., those developed through CASP). These tools check ramachandran plot outliers, rotamer normality, and atom-atom clashes [57].
- Refinement with Experimental Data: If available, use low-resolution experimental data like Cryo-EM maps or SAXS profiles to constrain and refine the model, guiding it toward a biologically realistic state.
Problem 3: Alignment has a Low RMSD but a Biologically Implausible Residue Correspondence
Issue: The algorithm achieves a numerically low (good) RMSD, but the aligned residue pairs make no biological sense (e.g., hydrophobic cores are not aligned, catalytic triads are mismatched).
Diagnosis and Solutions:
- Use a Global Scoring Metric: RMSD can be minimized by aligning a small subset of residues. Use a global, size-independent metric like TM-Score to evaluate the alignment. The TM-Score is defined as:
- Inspect Functional Sites: Manually verify the alignment of known functional sites from databases. An algorithm may be using an overly simplistic scoring function. Incorporate knowledge-based potentials derived from known structures into the scoring function to favor biologically observed interactions.
- Implement Multi-Objective Optimization: Frame the alignment as a problem that simultaneously optimizes multiple objectives: geometric fit (RMSD), sequence similarity, and conservation of functional residue contacts.
Research Reagent Solutions
The following table details key computational tools and resources essential for protein structure alignment and validation.
Table 2: Essential Research Reagents and Tools for Protein Structure Analysis
| Item/Resource | Function/Application |
|---|---|
| Protein Data Bank (PDB) | A central repository for experimentally determined 3D structures of proteins, nucleic acids, and complex assemblies. Serves as the primary source of templates for comparative modeling and alignment [5]. |
| Dynamic Programming Algorithm | A core computational method for finding the optimal alignment path between two sequences or structures by breaking the problem into simpler sub-problems. Used in many alignment tools for residue correspondence [9] [5]. |
| TM-Score | A scoring function for assessing the topological similarity of protein structures, normalized against protein size. Crucial for evaluating the biological significance of an alignment beyond RMSD [9]. |
| Genetic Algorithm (GA) | A search heuristic inspired by natural selection used to generate high-quality solutions for optimization problems. In GADP-align, it explores possible SSE correspondences to avoid local minima before DP refinement [9]. |
| Multiple Sequence Alignment (MSA) | An alignment of three or more biological sequences. Modern structure prediction tools like AlphaFold2 use MSAs to infer evolutionary constraints that inform the accurate prediction of 3D structure [58] [57]. |
Experimental Protocol: Implementing a GADP-align Workflow
This protocol outlines the steps for performing a pairwise protein structure alignment using the hybrid GADP-align methodology [9].
1. Input Preparation:
- Obtain the 3D coordinates of the two proteins to be aligned from the PDB.
- Pre-process the structures to assign secondary structure elements (SSEs) to each residue (H for α-helix, S for β-strand).
2. Initial SSE Matching:
- Encode the secondary structure of each protein as a sequence of 'H' and 'S'.
- Use the Needleman-Wunsch dynamic programming algorithm to align the two SSE sequences.
- Use a scoring matrix: +2 for identical SSEs, -1 for non-identical SSEs.
- Apply a gap-opening penalty of -2.
- This produces an initial map of corresponding SSE pairs between the two proteins.
3. Genetic Algorithm Setup and Execution:
- Initialize Population: Create a population of chromosomes (e.g., N=100). Each chromosome represents a possible alignment, containing matched SSE pairs and a randomly selected list of corresponding residues (20-100% of the shorter SSE's length) [9].
- Evaluate Fitness: Calculate the fitness of each chromosome using the TM-Score formula.
- Apply Genetic Operators for a set number of generations (e.g., 100) or until convergence (e.g., no change in top score for 30 generations):
- Selection: Use tournament selection (e.g., k=3) to choose parent chromosomes.
- Crossover: Recombine parents at two random points with a high probability (Pc=0.75).
- Mutation: Randomly increase or decrease the number of aligned residues in an SSE pair with low probability (Pm=0.04).
- Shift Operator: Shift SSEs left or right along the chain with a defined probability (Ps=0.45) to escape local optima.
4. Iterative Dynamic Programming Refinement:
- For the best chromosome in each generation, compute the Kabsch rotation matrix to superpose the structures based on its current residue correspondence [9].
- Run dynamic programming on a similarity matrix ( S(i,j) ) calculated for all residue pairs (i from protein A, j from protein B):
- This DP step produces a new, refined alignment, which updates the chromosome.
5. Validation and Output:
- Select the final alignment with the highest TM-Score from the genetic algorithm's run.
- Validate the biological relevance by checking the alignment of known functional residues and using the quality metrics listed in Table 1.
The following diagram illustrates the core workflow of the GADP-align algorithm:
Validation Workflow for Alignment Results
After obtaining a structural alignment, it is critical to validate its biological plausibility. The following workflow provides a step-by-step guide for this process.
Benchmarking Success: How to Validate and Compare Structural Alignment Tools
Protein structure alignment is a cornerstone of computational biology, enabling researchers to decipher evolutionary relationships, predict protein function, and understand molecular mechanisms. For methods relying on dynamic programming (DP) for alignment, establishing reliable benchmarks is paramount. The Structural Classification of Proteins (SCOP) and Class, Architecture, Topology, Homologous superfamily (CATH) databases serve as the preeminent gold standards for this task. These manually curated hierarchies provide a reference framework against which the accuracy and sensitivity of novel alignment algorithms are measured. However, their differing classification philosophies and protocols can introduce inconsistencies that researchers must navigate to avoid biased benchmarking results. This guide addresses the specific challenges and solutions for using SCOP and CATH effectively within protein structural alignment research, with a particular focus on DP-based approaches.
FAQ: Understanding SCOP and CATH
Q1: What are the fundamental differences between SCOP and CATH that affect benchmarking?
The primary differences lie in their construction principles and hierarchical levels, which can lead to different classifications for the same protein structure.
- SCOP (Structural Classification of Proteins) is primarily based on expert knowledge and manual curation. Its major levels are: Class → Fold → Superfamily → Family. The "fold" level groups domains with the same major secondary structures in the same arrangement and with the same topological connections [59].
- CATH incorporates more automated steps in its classification pipeline. Its hierarchy is: Class → Architecture → Topology (Fold) → Homologous Superfamily. The "architecture" level describes the overall shape of the domain fold without considering connectivity, while "topology" is analogous to the SCOP fold level and does consider connectivity [59].
These philosophical differences mean that a protein domain might be assigned to one fold in SCOP and a different, though perhaps related, fold in CATH. Using them as a unified "ground truth" without acknowledging these differences can lead to an overestimation of errors made by structure comparison methods, including those based on dynamic programming [59].
Q2: Why might my DP-based alignment algorithm perform differently when evaluated against SCOP versus CATH?
Performance discrepancies arise from the inherent differences in classification detailed above. Your algorithm might identify a structural relationship that one database recognizes and the other does not. Key reasons include:
- Differing Domain Definitions: SCOP often defines larger domains, which may be split into several smaller domains in CATH. If your alignment method operates on whole chains versus domains, this will directly impact benchmarks [59].
- Hierarchical Partitioning: The fold space is partitioned differently at every level in the two hierarchies. An algorithm might correctly group two domains the expert curators of SCOP deemed unrelated, while CATH might group them, or vice-versa [59].
- Benchmark Contamination: A benchmark set that inadvertently includes protein pairs classified similarly in one hierarchy but differently in the other will not provide a consistent evaluation standard [59].
Q3: How can I create a consistent benchmark set from SCOP and CATH for training and evaluating my algorithm?
The most robust approach is to use a consistently mapped subset of both databases.
- Domain Mapping: Strictly map domains between SCOP and CATH based on residue overlap. A high overlap threshold (e.g., 80%) ensures that the domain definitions are largely equivalent in both hierarchies [59].
- Extract Consensus Pairs: Identify pairs of protein domains that are classified together in both SCOP and CATH. For example, select domains that are in the same SCOP superfamily and the same CATH homologous superfamily [59].
- Create Non-Redundant Sets: Apply filters to avoid over-representation of highly similar sequences, ensuring a broad coverage of the fold space.
This consensus set largely reduces errors made by structure comparison methods and provides a more reliable standard for training machine learning and DP methods [59].
Q4: What are the specific challenges in using these databases for multiple structure alignment?
Multiple structure alignment is computationally more complex (NP-hard) and presents unique challenges [53].
- Subset Alignment: An input set may contain proteins from different families. A high-quality multiple alignment method should automatically detect and align these subsets, rather than forcing a single, poor alignment on all structures [53].
- Partial Alignment: Proteins may share only a common motif or domain, not their entire structure. The algorithm must detect this local common core without being misled by unrelated regions [53].
- Non-Sequential Alignment: DP typically produces sequential alignments. However, evolutionary events can cause similar structures with different topological connections. Detecting these requires non-sequential, or order-independent, alignment methods, which are harder to benchmark against the primarily sequential classifications of SCOP and CATH [53].
Troubleshooting Guides
Guide 1: Resolving Discrepancies in Algorithm Benchmarking
Problem: Your DP algorithm shows high accuracy against SCOP but poor accuracy against CATH (or vice versa).
Solution:
| Step | Action | Rationale |
|---|---|---|
| 1. Diagnose | Isolate the specific protein pairs or families where performance diverges. Use a tool like the SCOP-CATH interactive browser to inspect their official classifications [59]. | Pinpoints whether the issue is widespread or confined to specific structural classes. |
| 2. Analyze | Check the domain definitions for the problematic proteins. Compare SCOP and CATH domain boundaries for the same PDB entry. | A large discrepancy in domain boundaries can explain alignment failures. |
| 3. Inspect | Examine the structural features. Does the alignment found by your algorithm agree with the SCOP definition (e.g., core secondary structure arrangement) or the CATH definition (e.g., overall architecture)? | Provides insight into which classification philosophy your algorithm aligns with. |
| 4. Adapt | If your algorithm is sensitive to parameters (e.g., gap penalties in DP), retune them on a consensus benchmark set derived from both SCOP and CATH. | Improves generalizability and reduces bias towards a single database. |
| 5. Report | Clearly state which database version was used for benchmarking and discuss any known discrepancies in the context of your results. | Ensures transparency and reproducibility of your research. |
Guide 2: Handling Domain Definition Conflicts
Problem: Your alignment input is a full protein chain, but SCOP and CATH define its constituent domains differently, making evaluation ambiguous.
Solution:
- Decompose into Domains: Before alignment and evaluation, decompose your query protein chain into its constituent domains as defined by a standard resource. For a more robust analysis, do this for both SCOP and CATH definitions.
- Perform Pairwise Domain Alignment: Align your target structure against the individual domain definitions from the databases, not the full chain.
- Evaluate at the Domain Level: Assess the accuracy of your alignment by comparing it to the classified domains. This provides a clearer and more reliable performance measure than using the full chain.
- Leverage Consensus Mappings: For critical benchmarks, restrict your evaluation to the set of domains that have a high degree of definition overlap (e.g., >80% residue overlap) between SCOP and CATH [59].
The workflow below illustrates the process of creating a consistent benchmark set and using it for evaluation.
Guide 3: Parameter Sensitivity in Dynamic Programming Alignment
Problem: The output of your DP structural alignment is highly sensitive to parameter choices (e.g., gap penalties, similarity score thresholds), making consistent benchmarking difficult.
Solution:
- Robustness Testing: Conduct a parameter sweep for key parameters like gap open (
ρo) and gap extend (ρc) penalties. The effectiveness of a robust DP algorithm should not degrade significantly over a broad range of values [6]. - Structural Similarity Measure (Sij): The score function that defines the structural similarity between two residues (
Sijin the DP matrix) is critical. Ensure this measure is meaningful and stable. Test its sensitivity to small random perturbations in atomic coordinates to model structural uncertainty [6]. - Consistent Training: If your DP method involves machine learning, train it on a consistent SCOP-CATH benchmark set. This prevents the model from learning database-specific artifacts that do not generalize [59].
Research Reagent Solutions
| Item | Function in Benchmarking |
|---|---|
| SCOP-CATH Consensus Benchmark Set | A pre-compiled set of protein domains with consistent classifications in both SCOP and CATH. Used for fair training and evaluation of alignment algorithms to avoid database bias [59]. |
| SCOP-CATH Interactive Browser | An online tool to visually explore and compare the classification of a protein domain in both SCOP and CATH simultaneously. Essential for diagnosing discrepancies [59]. |
| Protein Data Bank (PDB) | The single worldwide repository for 3D structural data of proteins and nucleic acids. SCOP and CATH classifications are built upon structures deposited here. |
| TM-Align, DALI, CE | Established protein structure alignment algorithms. Useful for generating independent alignments to compare against your DP algorithm's output. |
| Geometric Hashing Software | A computational technique used for non-sequential structure alignment, providing an alternative approach to DP for benchmarking order-independent structural motifs [53]. |
Decision Framework for Alignment Strategy
The flowchart below helps determine the appropriate alignment strategy based on your research goal and input data, which directly influences how you should use SCOP and CATH for benchmarking.
Within research on dynamic programming for protein structural alignment, quantitatively assessing the quality of an alignment or a predicted model is crucial. The key metrics for this evaluation are TM-score (Template Modeling Score), RMSD (Root-Mean-Square Deviation), Recall, and Precision. These metrics provide complementary views on the geometric accuracy and completeness of a structural match, each addressing different aspects of the problem, from global fold similarity to local residue-level correctness [60] [61].
Frequently Asked Questions (FAQs)
FAQ 1: What does a specific TM-score value tell me about structural similarity? The TM-score provides a normalized measure of global fold similarity. Its value ranges between 0 and 1, where 1 indicates a perfect match. Based on statistics from the PDB:
- TM-score < 0.17: Indicates a similarity level comparable to randomly chosen, unrelated proteins.
- TM-score > 0.5: Suggests that the two structures generally share the same fold in databases like SCOP/CATH [61] [62] [63]. A score of 0.5 is a commonly used threshold to confirm that two proteins assume the same overall fold [63].
FAQ 2: My RMSD value is high. Does this mean my alignment is useless? Not necessarily. A high global RMSD can be dominated by a small set of divergent loop regions or flexible termini, which can obscure a otherwise correct core alignment [64] [61]. Unlike TM-score, RMSD is also dependent on the length of the protein, making it difficult to interpret for proteins of different sizes [61] [62]. You should consult the TM-score and the number of aligned residues to get a better picture of the global topological similarity.
FAQ 3: When should I use Recall and Precision (RPF) for evaluation? Recall and Precision are particularly useful when evaluating the quality of predicted structural contacts (e.g., in residue-residue distance prediction). They are local, superposition-free measures [60].
- High Recall, Low Precision: Your method is finding most of the true contacts but is also generating many false positives.
- High Precision, Low Recall: Your method is very accurate when it predicts a contact, but it is missing a large number of true contacts. The F-measure (or RPF-score) combines these two into a single metric for an overall assessment [60].
FAQ 4: What is the fundamental difference between TM-score and RMSD? The core difference lies in their sensitivity. RMSD weights all distance errors equally, making it highly sensitive to local structural variations, especially in poorly aligned regions. In contrast, TM-score uses a length-dependent scale and weights smaller distance errors more strongly than larger ones. This makes it more sensitive to the global topology of the protein than to local deviations [61] [62] [63].
FAQ 5: How does dynamic programming integrate with these metrics in TM-align? In the TM-align algorithm, dynamic programming (DP) is used to identify the optimal residue-to-residue correspondence path that maximizes the TM-score. The TM-score itself defines the scoring function for the DP, which balances the inclusion of more aligned residues with the quality of their geometric fit. This combination of the TM-score rotation matrix and dynamic programming is what makes the algorithm both fast and accurate [40].
Troubleshooting Guides
Problem 1: Inconsistent model quality assessment between different metrics
- Symptoms: A model is ranked as "good" by one metric (e.g., TM-score) but "poor" by another (e.g., RMSD).
- Diagnosis: This is common and highlights the different focuses of each metric. A good TM-score with a high RMSD often indicates that the model has the correct global fold (which TM-score captures) but has errors in local regions or side-chain packing (which inflates RMSD) [60] [61].
- Solution:
- Do not rely on a single metric. Always use a combination (e.g., TM-score/GDT for global fold, RMSD for local quality, and RPF for contact maps).
- Visually inspect the superposition in molecular graphics software to understand the nature of the discrepancies.
- Consult the distribution of the scores across a large dataset to understand their typical correlations and variations [60].
Problem 2: Poor performance or slow computation of structural alignments
- Symptoms: The alignment program is slow or fails to produce a biologically meaningful alignment.
- Diagnosis: The heuristic search for the optimal alignment may be trapped in a local minimum, or the input structures may have complex multi-domain movements.
- Solution:
- For Speed: Utilize accelerated versions of algorithms. For example, TM-score-GPU can be 68 times faster than the CPU version for large-scale comparisons [64].
- For Accuracy: Run multiple alignment algorithms (e.g., TM-align, DALI, CE) and compare the results. The "Best-of-All" method, which takes the best alignment found by any method, has been shown to outperform individual methods [65].
- For multi-domain proteins, try aligning domains independently, as relative domain orientation can artificially inflate RMSD [10].
Quantitative Data Reference
Table 1: Key Metrics for Protein Structure Evaluation
| Metric | Typical Range | What It Measures | Key Interpretation | Superposition Required? |
|---|---|---|---|---|
| TM-score | (0, 1] | Global topological similarity, weighting local errors less [61] [62]. | >0.5: Same fold. <0.17: Random similarity [62]. | Yes |
| RMSD | [0, ∞) | Average distance between superposed Cα atoms [60]. | Lower is better, but length-dependent and sensitive to outliers. | Yes |
| GDT-TS | [0, 100] | Percentage of Cα atoms within defined distance cutoffs (1,2,4,8 Å) [60] [61]. | Higher is better. Robust to local errors. | Yes |
| Recall (RPF) | [0, 1] | Fraction of true native contacts that were correctly predicted [60]. | High recall means most true contacts were found. | No |
| Precision (RPF) | [0, 1] | Fraction of predicted contacts that are correct [60]. | High precision means predictions are reliable. | No |
| LDDT | [0, 1] | Local distance differences of atoms, without superposition [60]. | Higher is better. Good for evaluating local quality. | No |
Table 2: Comparison of Structural Alignment Methods
| Method | Key Feature | Underlying Metric | Algorithm Type |
|---|---|---|---|
| TM-align | Balances speed and accuracy [40]. | TM-score | Dynamic Programming + TM-score rotation |
| DALI | Based on distance matrix comparisons [10]. | Z-score | Monte Carlo / Heuristic |
| CE (Combinatorial Extension) | Builds alignment from fragment pairs [10]. | RMSD/Other | Combinatorial Path Building |
| STRUCTAL | Iterative dynamic programming [65]. | SAS, SI, MI | Dynamic Programming |
Experimental Protocols
Protocol 1: Evaluating a Single Protein Model Against a Native Structure
Purpose: To assess the quality of a predicted protein model by comparing it to its experimentally-solved native structure.
Materials:
- Native structure file (in PDB or mmCIF format).
- Model structure file (in PDB or mmCIF format).
- Software: TM-score program (or TM-align for sequences with low identity) [62] [66].
Procedure:
- Download and Compile: Download the TM-score C++ source code and compile it on your system [62].
- Run Analysis: Execute the program, providing the native and model structures as input.
- Record Output: The program will output the TM-score, RMSD, GDT-TS, and other metrics. It will also generate a rotation matrix and can create a superposed structure file.
- Interpret Results:
- A TM-score > 0.5 indicates a model with the correct fold.
- Analyze the RMSD in the context of the protein length and the TM-score.
- Use the superposed structure for visual inspection of local errors.
Protocol 2: Large-Scale All-vs-All Structure Comparison for Fold Analysis
Purpose: To classify a set of protein structures based on their fold similarity, such as in structural genomics projects.
Materials:
- A dataset of protein structures (e.g., representative chains from the PDB).
- High-performance computing resources (cluster or GPU workstation).
- Software: TM-align or TM-score-GPU for accelerated computation [40] [64].
Procedure:
- Prepare Structures: Curate your dataset, ensuring a sequence identity cutoff (e.g., <95%) to remove redundant sequences [40].
- Choose Software:
- For a standard CPU cluster, use TM-align.
- For a GPU-equipped workstation, use TM-score-GPU, which can be ~68x faster [64].
- Perform Pairwise Alignments: Run an all-against-all comparison of every structure pair in your dataset.
- Cluster Structures: Apply a clustering algorithm (e.g., hierarchical clustering) using the TM-score as the similarity measure. A common threshold is TM-score = 0.5 to define fold groups [40].
Workflow and Relationship Diagrams
TM-align DP Workflow
Metric Relationship Logic
The Scientist's Toolkit
Table 3: Essential Research Reagents & Computational Tools
| Item | Function in Research | Example / Source |
|---|---|---|
| TM-score Program | Calculates the TM-score and RMSD between two structures with predefined residue correspondence [62]. | http://bioinformatics.buffalo.edu/TM-align [40] |
| TM-align Algorithm | Performs structural alignment of proteins with different sequences, outputting an optimized TM-score [40] [62]. | http://zhanggroup.org/TM-score/ [66] |
| TM-score-GPU | Accelerated version of TM-score for large-scale comparisons, e.g., clustering thousands of models [64]. | http://software.compbio.washington.edu/misc/downloads/tmscore/ [64] |
| PDB Database | Source of native experimental protein structures to use as references for model evaluation. | https://www.rcsb.org |
| CATH/SCOP | Hierarchical databases of protein domain classifications, used as a gold standard for fold assessment [65] [61]. | http://www.cathdb.info, http://scop.mrc-lmb.cam.ac.uk |
Frequently Asked Questions (FAQs)
FAQ 1: What is the fundamental difference between the alignment strategy of DP-based methods and a tool like Foldseek? Dynamic Programming (DP)-based methods like those used in TM-align perform an exhaustive search to find an optimal alignment by solving a recurrence relation, often considering the spatial proximity of residues after an initial superposition [40] [67]. In contrast, Foldseek employs a revolutionary filter-and-refine strategy. It first converts the three-dimensional protein structure into a one-dimensional string of letters from a "structural alphabet" (3Di), which describes tertiary amino acid interactions. It then uses extremely fast sequence alignment methods (prefilter) to identify potential hits, and only performs detailed structural alignment on these candidates [68] [69]. This approach reduces computation time by several orders of magnitude.
FAQ 2: My primary goal is to scan the entire AlphaFold database for structural homologs. Which tool should I choose and why? For large-scale database searches like against the AlphaFold database (over 214 million structures), Foldseek is the unequivocal recommended choice. A benchmark study demonstrated that Foldseek can complete a search in a matter of seconds to minutes, while the same task would take TM-align about a month on a single CPU core and an all-against-all comparison would take millennia on a large cluster [68]. Foldseek achieves this speed (4-5 orders of magnitude faster) while maintaining high sensitivity, reported to be about 86% and 88% of Dali and TM-align, respectively [68].
FAQ 3: I need the most accurate possible structural alignment for a pair of proteins, and computation time is not a concern. What does the evidence suggest? When accuracy is the sole priority and speed is not a constraint, evidence suggests that exploring the protein superposition space more deeply can yield significant gains. One study used an approximation algorithm (MaxPairs) to more rigorously search the space of possible superpositions and found that it could improve the agreement with gold-standard reference alignments for popular tools like TM-align and STRUCTAL by 5-11% [67]. This indicates that even modern heuristic methods may not always find the globally optimal alignment, and that a "deep search" strategy, though computationally prohibitive for routine use, can set a higher accuracy benchmark.
FAQ 4: How does TM-align, a DP-based method, achieve a balance between speed and accuracy? TM-align is a DP-based algorithm that combines the TM-score rotation matrix with dynamic programming [40]. Its scoring function is protein-length specific, and it uses affine gap penalties [67]. This design makes it significantly faster than some earlier methods (about 4 times faster than CE and 20 times faster than DALI) [40], while its TM-score metric provides a more robust measure of global structural similarity than RMSD alone. Evaluations have shown it consistently performs well in maximizing the number of matched residues and produces longer alignments with high TM-scores [70].
FAQ 5: Are there hybrid methods that combine ideas from different alignment strategies? Yes, several methods use hybrid strategies. For instance, SARST2 employs a sophisticated "filter-and-refine" strategy. It uses fast filters, including machine learning models and word-matching on linearly-encoded structural strings, to discard irrelevant hits. The remaining candidates are then aligned using a refined DP step that synthesizes amino acid type, secondary structure, and weighted contact number information [71]. Another tool, GADP-align, combines a genetic algorithm with an iterative dynamic programming technique to avoid getting trapped in local optima, potentially leading to more accurate alignments [72].
Troubleshooting Common Experimental Issues
Issue 1: Excessively long runtimes for structural database searches.
- Problem: You are using a traditional structural aligner like TM-align or Dali for a search against a large database (e.g., AlphaFold DB), and the estimated completion time is unreasonably long.
- Solution:
- Recommended Action: Switch to a tool designed for massive database searches, such as Foldseek or SARST2.
- Methodology: These tools use a "filter-and-refine" approach. Your query structure is first translated into a simplified representation (e.g., a 3Di string in Foldseek). This representation is then compared to a pre-processed database using fast sequence-based search algorithms to quickly filter out obvious non-hits. Only the top candidates undergo a more computationally expensive, detailed structural alignment [68] [71].
- Example Protocol: Using the Foldseek webserver (
search.foldseek.com), upload your query structure in PDB or mmCIF format. Select the target database (e.g., AlphaFold Proteomes). The search typically completes in seconds to minutes, providing a list of hits with scores like TM-score and alignment details [68].
Issue 2: Poor alignment quality for proteins with non-sequential or circular permutations.
- Problem: Standard DP-based aligners, which assume sequential residue matching, fail to correctly align proteins that have similar folds but different topological connections, such as circular permutations.
- Solution:
- Recommended Action: Use an algorithm designed for non-sequential alignment or one that uses a global matching framework. Dali is noted for being independent of relative domain orientations and can excel here [68]. Alternatively, explore newer methods like UniOTalign, which uses Optimal Transport to find a global correspondence between residues without the constraint of a sequential path [73].
- Methodology: UniOTalign represents proteins as distributions of residues in a feature space (using embeddings from protein language models). It then finds an optimal matching by minimizing a cost function that considers both feature similarity and geometric consistency, naturally handling non-sequential similarities [73].
Issue 3: Inconsistent or low-quality alignments from heuristic methods.
- Problem: You suspect that a fast, heuristic method may be converging on a local optimum and providing a suboptimal alignment.
- Solution:
- Recommended Action: Validate critical alignments with a different, more rigorous method. For pairwise comparisons, you can run multiple aligners (e.g., TM-align, Dali, and CE) and compare the consensus.
- Methodology: Research indicates that a deeper search of the superposition space can improve alignment accuracy [67]. While optimal algorithms are not practical for large searches, using them as a benchmark can help assess the quality of heuristic results. For a practical workflow, you can use a hybrid tool like GADP-align, which uses a genetic algorithm to explore the alignment space more broadly before refining with DP, helping to avoid local optima [72].
Performance Data & Experimental Protocols
Quantitative Performance Comparison
The following table summarizes key performance metrics for various structural alignment tools as reported in benchmark studies.
- Table 1: Benchmarking Results on the SCOPe40 Dataset (All-vs-All Search)
Method Core Algorithm Search Speed (Relative to TM-align) Sensitivity (AUC vs. Family/Superfamily) Key Strength Foldseek 3Di Alphabet + Sequence Prefilter ~4,000x faster [68] 86% of Dali, 88% of TM-align [68] Extreme speed for large DBs Foldseek-TM 3Di Prefilter + TM-align Refinement N/A Higher than TM-align [68] High precision & sensitivity TM-align TM-score + Dynamic Programming 1x (Baseline) [40] Baseline Good balance of speed/accuracy Dali Heuristic (Monte Carlo) Similar to TM-align [40] High (Baseline) Accurate, handles distortions CE Heuristic (Combinatorial Extension) ~5x slower [40] Lower than TM-align & Dali [40] Established method SARST2 Filter-and-Refine (ML + DP) Faster than Foldseek & BLAST [71] 96.3% Avg. Precision [71] High accuracy & efficiency
Key Experimental Protocols from Literature
Protocol 1: Benchmarking Alignment Sensitivity with SCOPe This is a standard protocol for evaluating a method's ability to detect homologous relationships.
- Dataset: Use a non-redundant dataset like SCOPe40 (Structural Classification of Proteins—extended), clustered at 40% sequence identity [68].
- Procedure: Perform an all-versus-all comparison of the structures in the dataset.
- Evaluation: For each query protein, calculate the fraction of true positive matches (proteins from the same SCOP family or superfamily) retrieved before the first false positive match (a protein from a different SCOP fold). The results are often summarized as the Area Under the Curve (AUC) of a cumulative ROC curve [68].
Protocol 2: Reference-Free Assessment on Full-Length Proteins This protocol assesses performance on realistic, multi-domain protein structures without relying on manual classifications.
- Dataset: Cluster a large set of predicted structures (e.g., from AlphaFoldDB) using sequence-based tools like BLAST to create a diverse set. Select random query structures from this set [68].
- Procedure: Align each query against the remaining structures in the set.
- Evaluation: Use the Local Distance Difference Test (LDDT) score to define true positives (LDDT ≥ 0.6) and false positives (LDDT ≤ 0.25). Sensitivity is measured as the fraction of query residues that are part of alignments to true positive targets [68].
Core Workflow & Algorithm Relationships
The following diagram illustrates the typical workflows for different classes of structural alignment algorithms, highlighting the key differences between DP-based and newer approaches.
- Table 2: Key Research Reagents & Software Solutions
Item Name Type Function/Benefit Access Foldseek Standalone Software & Webserver Enables ultra-fast structural searches against massive databases (AFDB, PDB). https://foldseek.com/ [68] TM-align Standalone Program Robust, DP-based pairwise aligner; widely used for model quality assessment (TM-score). http://zhanglab.ccmb.med.umich.edu/TM-align/ [40] Dali Webserver Sensitive structural aligner; known for detecting distant homologs and handling distortions. http://ekhidna2.biocenter.helsinki.fi/dali/ [68] SARST2 Standalone Program Efficient filter-and-refine aligner with high reported accuracy and low memory footprint. https://github.com/NYCU-10lab/sarst [71] SCOPe Database Benchmark Dataset Curated database of protein structural relationships for method validation and benchmarking. https://scop.berkeley.edu/ [68] AlphaFold Database Target Database Vast resource of over 214 million predicted structures for large-scale homology searches. https://alphafold.ebi.ac.uk/ [68]
FAQs and Troubleshooting Guides
FAQ: Understanding Method Performance
Q1: How do sequence-based and structure-based alignment methods perform on difficult homologous pairs?
Traditional sequence-based methods like BLAST can miss distant homologies, while modern structure-based methods can detect them. A systematic analysis of over 62 million domain pairs from the SCOPe database provides a quantitative performance comparison [74].
Table 1: Performance Comparison of Alignment Methods on SCOPe Domain Pairs
| Method | Homologous Pairs Detected (E-value < 0.001) | Area Under Curve (AUC) | Key Strength |
|---|---|---|---|
| BLAST | 16,300 (7%) | 44% | High precision for close homologs |
| HHblits | 175,682 (78%) | 77% | Sensitive sequence-based detection |
| Structure Comparison (TM-score > 0.5) | 164,468 (73%) | 95% | Excellent balance of sensitivity and specificity |
Troubleshooting Guide: If your BLAST search returns no significant hits, do not conclude no homology exists. Proceed with these steps:
- Try more sensitive sequence methods: Use hidden Markov model-based tools like HHblits [74].
- Perform structural analysis: If structures are available (from PDB or AlphaFold DB), use FoldSeek, DALI, or 3D-AF-Surfer for comparison [74].
Q2: What are concrete examples where structure alignment succeeds where sequence alignment fails?
Case 1: Algal Adhesion and Bacterial Ice-Binding Proteins
- Proteins: Diatom adhesion protein (CaTrailin_4) and bacterial ice-binding protein (FfIBP) [74].
- Sequence Analysis: BLAST finds no significant similarity (E-value 0.30). HHblits also fails [74].
- Structure Analysis: Both proteins adopt a similar beta-helical fold. Structural comparison yields a TM-score of 0.6, confirming a likely evolutionary relationship [74].
Case 2: Single-Strand Annealing Proteins (SSAPs)
- Proteins: RecT/Redβ, ERF, and RAD52 [74].
- Sequence Analysis: BLAST finds no significant similarity between Rad52 and Redβ (E-value 0.38) [74].
- Structure Analysis: Structures reveal a conserved core structural element critical for oligomerization. Structural similarity (TM-score 0.5) confirms they belong to the same superfamily [74].
FAQ: Leveraging the AlphaFold Database
Q3: What is the coverage of the AlphaFold Database, and how can I access it?
The AlphaFold Protein Structure Database (AlphaFold DB) has undergone massive expansion, now providing over 214 million predicted protein structures [75]. This covers most of the UniProt knowledgebase, making predicted structures available for a vast array of known sequences.
Access Methods:
- Direct File Download: Bulk access via FTP [75].
- Web Interface: Search and visualize individual structures at https://alphafold.ebi.ac.uk [75].
- Programmatic Access: Use API endpoints for integration into analysis pipelines [75].
- Cloud Platforms: Query data using Google Cloud Public Datasets [75].
Q4: How do I interpret the confidence metrics of an AlphaFold prediction?
AlphaFold provides per-residue and global confidence scores essential for interpreting reliability [76].
Table 2: Key AlphaFold Confidence Metrics and Their Interpretation
| Metric | Scale | Interpretation | Troubleshooting Tip |
|---|---|---|---|
| pLDDT (per-residue) | 0-100 | Very High (90-100), High (70-90), Low (50-70), Very Low (<50) | Low-confidence regions may be intrinsically disordered. |
| PAE (residue-residue) | 0-30 Å | Lower values indicate higher confidence in relative positioning. | Use PAE to identify well-defined domains and flexible linkers. |
| pTM (global) | 0-1 | >0.75 indicates a reasonably accurate prediction. | For multimers, rely more on the ipTM score. |
| ipTM (interface, for multimers) | 0-1 | >0.75 indicates a confident interface prediction. | Use for complexes to assess assembly accuracy. |
Troubleshooting Guide for Low-Confidence Predictions:
- Symptom: Low pLDDT across the entire structure.
- Symptom: Low pLDDT only in terminal regions or loops.
- Interpretation: This is common and often reflects natural flexibility. These regions may be less critical for function [76].
FAQ: Advanced Structural Alignment Techniques
Q5: What is a robust experimental protocol for pairwise protein structure alignment?
For challenging pairs, a hybrid protocol combining a genetic algorithm (GA) with dynamic programming (DP) can be effective, as implemented in GADP-align [9].
Experimental Protocol: GADP-align for Pairwise Alignment
Objective: To find an optimal structural alignment between two protein structures, avoiding local minima.
Input: Two protein structures (PDB files or AlphaFold-derived models).
Methodology:
- Initial SSE Matching:
- Extract Secondary Structure Elements (SSEs) for both proteins, encoding them as a sequence (H for helix, S for strand).
- Use the Needleman-Wunsch algorithm to find an initial correspondence between SSE sequences. Use a score of +2 for matches, -1 for mismatches, and -2 for gap opening [9].
Genetic Algorithm for Global Search:
- Population: Create 100 chromosomes. Each chromosome represents a set of matched SSE pairs with randomly initialized corresponding residues (20-100% of the shorter SSE's length) [9].
- Fitness Function: Calculate TM-score for the alignment represented by each chromosome [9].
- Operators:
- Selection: Tournament selection (k=3).
- Crossover: Two-point crossover with probability Pc=0.75.
- Mutation: Adjust the number of aligned residues in an SSE by ±1 with probability Pm=0.04.
- Shift: Shift SSEs left/right along the sequence with probability Ps=0.45 to escape local optima [9].
- Termination: Stop if the best score doesn't change for 30 generations or after 100 generations [9].
Dynamic Programming for Refinement:
- In each GA generation, use the Kabsch algorithm to superpose structures based on the current alignment.
- Compute a similarity matrix S(i,j) = 1 / (1 + dij²/d₀²) for all residue pairs i and j from the two proteins, where dij is their distance after superposition.
- Run dynamic programming on this matrix to derive a refined, optimal alignment for that chromosome's correspondence map [9].
Output: The optimal alignment with the highest TM-score.
Q6: How can I handle very large protein complexes or orphaned proteins with AlphaFold?
Problem: AlphaFold can struggle with proteins exceeding 1,400 amino acids or "orphaned" proteins with no evolutionary homologs [76].
Troubleshooting Solutions:
- For Large Complexes:
- Partitioning: Split the protein into overlapping segments. Predict each segment's structure independently, then use the overlapping regions to "link" the structures together in a molecular viewer [76].
- Interface-Focused Prediction: If key interaction interfaces are known, predict the structures of isolated interface peptides to study binding motifs [76].
- For Orphaned Proteins:
- Run AlphaFold regardless. Even low-confidence predictions can offer valuable hypotheses.
- Enable the single-sequence MSA option, which has shown promise for de novo and orphaned proteins despite being less accurate for natural proteins with known homologs [76].
The Scientist's Toolkit: Research Reagent Solutions
Table 3: Essential Resources for Structural Alignment and Analysis
| Resource Name | Type | Primary Function | Access Link |
|---|---|---|---|
| AlphaFold DB | Database | Repository of over 214 million predicted protein structures. | https://alphafold.ebi.ac.uk [75] |
| FoldSeek | Software Tool | Fast and accurate protein structure search. | [74] |
| DALI | Software Tool | Protein structure comparison based on distance matrix alignment. | [74] [9] |
| MMLigne | Software Tool | Aligns structures using statistical inference. | [9] |
| GADP-align | Software Tool | Hybrid (GA+DP) algorithm for optimal structural alignment. | [9] |
| SCOPe Database | Database | Curated classification of protein structural relationships. | [74] |
| NCBI MSA Viewer | Visualization Tool | Web application for visualizing sequence and feature alignments. | https://www.ncbi.nlm.nih.gov/projects/msaviewer/ [48] [77] |
Conclusion
Dynamic programming remains a foundational and highly adaptable force in protein structural alignment. Its core robustness, when combined with modern innovations in machine learning and hybrid optimization, has led to a new generation of tools capable of tackling the 'protein structural Big Data' era. These advancements, exemplified by methods like SARST2, GADP-align, and PLASMA, deliver unprecedented gains in speed, accuracy, and resource efficiency. For biomedical and clinical research, the implications are profound. The ability to rapidly and accurately detect remote homologies and align structures on a massive scale directly accelerates functional annotation of unknown proteins, reveals deep evolutionary relationships, and provides critical insights for structure-based drug design. Future directions will likely focus on further integration of AI, handling flexible alignments and conformational changes, and creating even more scalable solutions to keep pace with the exponentially growing databases of protein structures, ultimately pushing the frontiers of biological discovery and therapeutic development.
References
- 1. Needleman–Wunsch algorithm - Wikipedia [https://en.wikipedia.org/wiki/Needleman%E2%80%93Wunsch_algorithm]
- 2. The dynamic programming alignment algorithm [https://nucpred.bioinfo.se/thesis/node27.html]
- 3. , Sequence Dynamic , and the Programming ... Alignment Needleman [https://www.linkedin.com/pulse/dynamic-programming-sequence-alignment-needleman-wunsch-mubashir-ali-zvpzf]
- 4. A graphical introduction to dynamic programming | by Avik Das | Medium [https://medium.com/@avik.das/a-graphical-introduction-to-dynamic-programming-2e981fa7ca2]
- 5. (PDF) Protein Using Structure Alignment Dynamic Programming [https://www.academia.edu/75439232/Protein_Structure_Alignment_Using_Dynamic_Programming]
- 6. Used to Dynamic with... Programming Align Protein Structures [https://pmc.ncbi.nlm.nih.gov/articles/PMC4009789/]
- 7. dpvis: A Visual and Interactive Learning Tool for Dynamic Programming [https://arxiv.org/html/2411.07705v1]
- 8. Recursion Tree and DAG (Dynamic Programming/DP) - VisuAlgo [https://visualgo.net/en/recursion]
- 9. GADP- align : A genetic algorithm and dynamic -based... programming [https://pmc.ncbi.nlm.nih.gov/articles/PMC8494253/]
- 10. Structural alignment - Wikipedia [https://en.wikipedia.org/wiki/Structural_alignment]
- 11. Pairwise Structure Alignment [https://www.rcsb.org/docs/tools/pairwise-structure-alignment]
- 12. TM-align: A protein structure alignment algorithm using TM-score ... [https://zhanggroup.org/TM-align/]
- 13. MSARC: Multiple sequence alignment by residue clustering - PMC [https://pmc.ncbi.nlm.nih.gov/articles/PMC4036715/]
- 14. RCSB PDB - Pairwise Structure Alignment Tool [https://www.rcsb.org/alignment]
- 15. SAS-Pro: Simultaneous Residue Assignment and Structure Superposition for Protein Structure Alignment - PMC [https://pmc.ncbi.nlm.nih.gov/articles/PMC3360771/]
- 16. sequence Protein with family-specific amino acid similarity... alignment [https://bmcresnotes.biomedcentral.com/articles/10.1186/1756-0500-4-296]
- 17. - Wikipedia Gap penalty [https://en.wikipedia.org/wiki/Gap_penalty]
- 18. | Bioinformatics Class Notes | Fiveable Gap penalties [https://fiveable.me/bioinformatics/unit-3/gap-penalties/study-guide/x7Za3xHK0fFUhWOh]
- 19. Sequence alignment - Wikipedia [https://en.wikipedia.org/wiki/Sequence_alignment]
- 20. Developments in Algorithms for Sequence Alignment: A Review - PMC [https://pmc.ncbi.nlm.nih.gov/articles/PMC9024764/]
- 21. Interactive software tool to comprehend the calculation of optimal sequence alignments with dynamic programming - PMC [https://pmc.ncbi.nlm.nih.gov/articles/PMC2887054/]
- 22. of multiple Alignment based on sequence and... protein structures [https://pubmed.ncbi.nlm.nih.gov/19587024/]
- 23. Improving pairwise sequence alignment accuracy using near-optimal... [https://bmcbioinformatics.biomedcentral.com/articles/10.1186/1471-2105-11-146]
- 24. remote homology detection and Protein using... structural alignment [https://www.nature.com/articles/s41587-023-01917-2?error=cookies_not_supported&code=9ea6f2bc-2b3d-43ce-9b0b-8dff517a8528]
- 25. The difficulty of protein structure alignment under the RMSD - PMC [https://pmc.ncbi.nlm.nih.gov/articles/PMC3599502/]
- 26. high-throughput and resource-efficient protein structure... SARST 2 [https://pubmed.ncbi.nlm.nih.gov/41027879/]
- 27. Protein structural similarity search by Ramachandran codes [https://bmcbioinformatics.biomedcentral.com/articles/10.1186/1471-2105-8-307]
- 28. US-align: complex structure alignment for proteins, RNAs and DNAs [https://zhanggroup.org/US-align]
- 29. - GADP : A genetic algorithm and dynamic programming-based... align [https://bi.tbzmed.ac.ir/FullHtml/bi-22013]
- 30. Using iterative dynamic programming to obtain accurate pairwise and multiple alignments of protein structures - PubMed [https://pubmed.ncbi.nlm.nih.gov/8877505/]
- 31. A comparison of position-specific score matrices based on sequence... [https://pmc.ncbi.nlm.nih.gov/articles/PMC2373449/]
- 32. Dynamic Programming in Reinforcement Learning - GeeksforGeeks [https://www.geeksforgeeks.org/machine-learning/dynamic-programming-in-reinforcement-learning/]
- 33. Structure alignment of membrane proteins: Accuracy of available tools and a consensus strategy - PubMed [https://pubmed.ncbi.nlm.nih.gov/26178143/]
- 34. GitHub - flatironinstitute/deepblast: Neural for Networks ... Protein [https://github.com/flatironinstitute/deepblast]
- 35. 3D- PSSM Help Page [https://www.sbg.bio.ic.ac.uk/3dpssm/html/3DPSSMhelp.html]
- 36. The protein - protein interaction network using recurrent... alignment [https://pubmed.ncbi.nlm.nih.gov/34529185/]
- 37. The protein - protein interaction network using recurrent... alignment [https://link.springer.com/article/10.1007/s11517-021-02428-5]
- 38. T-COFFEE Multiple Sequence Alignment Server [https://tcoffee.crg.eu/]
- 39. Fast and Interpretable Protein Substructure Alignment via Optimal ... [https://arxiv.org/html/2510.11752v1]
- 40. TM- align : a protein algorithm based on the... structure alignment [https://pubmed.ncbi.nlm.nih.gov/15849316/]
- 41. [2505.06589] Optimal Transport for Machine Learners [https://arxiv.org/abs/2505.06589]
- 42. Optimal transport: a hidden gem that empowers today’s machine learning | by Ievgen Redko | TDS Archive | Medium [https://medium.com/data-science/optimal-transport-a-hidden-gem-that-empowers-todays-machine-learning-2609bbf67e59]
- 43. Protein remote and homology alignment using... detection structural [https://pmc.ncbi.nlm.nih.gov/articles/PMC11180608/]
- 44. Deep Learning Powers New Methods for Protein Remote... - CBIRT [https://cbirt.net/deep-learning-powers-new-methods-for-protein-remote-homology-detection-and-structural-alignment/]
- 45. -search fails with AttributeError: 'function' object has no... deepblast [https://github.com/flatironinstitute/deepblast/issues/86]
- 46. Sensitive remote search by local alignment of small... homology [https://elifesciences.org/articles/91415]
- 47. Deciphering key features in protein structures with the new ENDscript server - PubMed [https://pubmed.ncbi.nlm.nih.gov/24753421/?dopt=Abstract]
- 48. Guide to Using the Multiple Sequence Alignment Viewer [https://www.ncbi.nlm.nih.gov/tools/msaviewer/tutorial1/]
- 49. Evaluating the significance of embedding-based protein ... [https://www.nature.com/articles/s41598-025-23319-x]
- 50. GTalign: spatial index-driven protein structure alignment, ... [https://www.nature.com/articles/s41467-024-51669-z]
- 51. ESA: An efficient sequence alignment algorithm for ... [https://www.sciencedirect.com/science/article/abs/pii/S0167819123000492]
- 52. Matt: Local Flexibility Aids Protein Multiple Structure Alignment [https://journals.plos.org/ploscompbiol/article?id=10.1371/journal.pcbi.0040010]
- 53. Algorithms for Multiple Protein Structure Alignment and ... [https://pmc.ncbi.nlm.nih.gov/articles/PMC10773980/]
- 54. Fast and accurate protein structure search with Foldseek | Nature Biotechnology [https://www.nature.com/articles/s41587-023-01773-0]
- 55. A memory - efficient algorithm for optimal... dynamic programming [https://bmcbioinformatics.biomedcentral.com/articles/10.1186/1471-2105-3-18]
- 56. SARST2 high-throughput and resource- efficient ... protein structure [https://www.nature.com/articles/s41467-025-63757-9?error=cookies_not_supported&code=6fd7534a-f3ca-47c1-9a66-da103c78c6b3]
- 57. sciencedirect.com/topics/medicine-and-dentistry/ protein - structure ... [https://www.sciencedirect.com/topics/medicine-and-dentistry/protein-structure-prediction]
- 58. : A Beginner's Protein to Free Tools and... Structure Prediction Guide [https://bitesizebio.com/74900/protein-structure-prediction/]
- 59. Systematic comparison of SCOP and CATH : a new gold standard for... [https://bmcstructbiol.biomedcentral.com/articles/10.1186/1472-6807-9-23]
- 60. Comparative analysis of methods for evaluation of protein models against native structures - PMC [https://pmc.ncbi.nlm.nih.gov/articles/PMC6419896/]
- 61. Template modeling score - Wikipedia [https://en.wikipedia.org/wiki/Template_modeling_score]
- 62. - TM : Quantitative assessment of similarity between protein... score [https://seq2fun.dcmb.med.umich.edu/TM-score/]
- 63. - TM | Oxford Protein Informatics Group score [https://www.blopig.com/blog/2017/01/tm-score/]
- 64. Accelerated protein structure comparison using TM - score -GPU - PMC [https://pmc.ncbi.nlm.nih.gov/articles/PMC3413391/]
- 65. Comprehensive Evaluation of Protein Structure Alignment Methods: Scoring by Geometric Measures - ScienceDirect [https://www.sciencedirect.com/science/article/abs/pii/S002228360401602X]
- 66. TM-score: Quantitative assessment of similarity between protein structures [https://zhanggroup.org/TM-score/]
- 67. On the Difference in Quality between Current Heuristic and Optimal Solutions to the Protein Structure Alignment Problem - PMC [https://www.ncbi.nlm.nih.gov/pmc/articles/PMC3591119/]
- 68. Fast and accurate protein structure search with Foldseek [https://www.nature.com/articles/s41587-023-01773-0?error=cookies_not_supported]
- 69. Hide and seek: structure similarities with FoldSeek [https://310.ai/blog/hide-and-seek-structure-similarities-with-foldseek]
- 70. Evaluating Tools for Protein - Simple Science Structure Alignment [https://scisimple.com/en/articles/2025-10-30-evaluating-tools-for-protein-structure-alignment--a9rp28q]
- 71. SARST2 high-throughput and resource-efficient protein ... structure [https://www.nature.com/articles/s41467-025-63757-9?error=cookies_not_supported&code=fac9b47b-cba3-430b-83f2-670982cd34c9]
- 72. GADP-align: A genetic algorithm and dynamic programming-based method for structural alignment of proteins - PubMed [https://pubmed.ncbi.nlm.nih.gov/34631489/]
- 73. UniOTalign: A Global Matching Framework for Protein via... Alignment [https://arxiv.org/html/2510.06554v1]
- 74. Is Protein BLAST a thing of the past? | Nature Communications [https://www.nature.com/articles/s41467-023-44082-5]
- 75. Protein Structure AlphaFold in 2024: providing structure... Database [https://pubmed.ncbi.nlm.nih.gov/37933859/]
- 76. How to Use AlphaFold 2 as a Wet Lab Biologist (Pt 3) [https://neurosnap.ai/blog/post/6422432aa55063d26e9c06a1]
- 77. NCBI Multiple Sequence Alignment Viewer 1.26.0 [https://www.ncbi.nlm.nih.gov/projects/msaviewer/]