Integrating Multi-Omics for Precision Medicine: From Data to Clinical Translation
This article provides a comprehensive overview of the multi-omics landscape in precision medicine, tailored for researchers, scientists, and drug development professionals.
Integrating Multi-Omics for Precision Medicine: From Data to Clinical Translation
Abstract
This article provides a comprehensive overview of the multi-omics landscape in precision medicine, tailored for researchers, scientists, and drug development professionals. It explores the foundational principles of integrating diverse omics layers—genomics, transcriptomics, proteomics, and metabolomics—to achieve a holistic understanding of disease mechanisms. The scope extends to evaluating advanced data integration methodologies, including statistical and machine learning-based approaches, for applications in biomarker discovery and patient stratification. It further addresses critical challenges such as data heterogeneity and analytical optimization, while offering comparative analyses of integration tools. Finally, the article examines validation frameworks and future directions, underscoring the transformative potential of multi-omics in developing personalized therapeutic strategies.
The Building Blocks: Core Concepts and Omics Layers in Precision Medicine
Defining Precision Medicine and the Multi-Omics Paradigm Shift
Precision medicine represents a transformative healthcare model that moves away from conventional, reactive disease management toward proactive prevention and customized healthcare delivery. This approach utilizes a deep understanding of an individual's genome, environment, lifestyle, and their complex interplay to inform personalized prevention, diagnostic, and treatment strategies [1]. The ultimate potential of precision medicine extends beyond individual patient benefits to population-level impacts, including improved health productivity, enhanced patient trust and satisfaction, and significant health cost-benefits across healthcare systems [1] [2].
The foundational revolution enabling this paradigm shift began with genomics, particularly following the completion of the Human Genome Project in 2003, which provided the first reference sequence for human biology [1]. However, genomics alone presents an incomplete picture—the biological blueprint without the dynamic functional layers. The emergence and integration of multiple "omics" technologies has created the necessary multi-dimensional perspective required to fully realize precision medicine's potential [3] [1]. Integrative multiomics, the combination of multiple omics data layers including their interconnections and interactions, provides a more comprehensive understanding of human health and disease than any single approach can deliver separately [1].
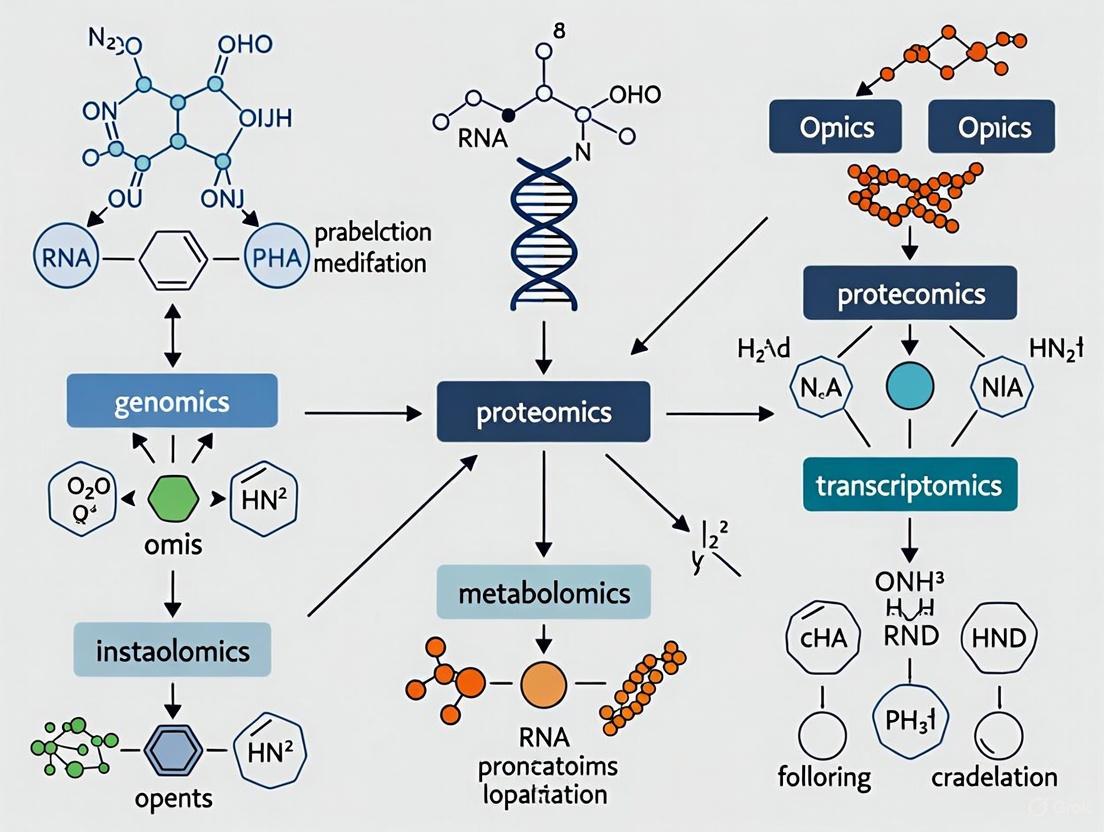
The Multi-Omics Ecosystem: Layers of Biological Complexity
The multi-omics approach systematically characterizes and quantifies diverse biological molecules to build a holistic view of biological systems. Each layer provides unique insights into the complex machinery of health and disease.
- Genomics reveals the static DNA sequence and genetic variants that constitute an individual's fundamental biological blueprint and inherited risk profile [3].
- Transcriptomics captures the dynamic expression of genes through RNA measurement, indicating which genetic instructions are actively being used by cells [3].
- Proteomics identifies and quantifies the proteins that execute cellular functions, providing a functional readout of cellular activity [3].
- Epigenomics maps chemical modifications to DNA and histones that regulate gene expression without altering the DNA sequence itself [1].
- Metabolomics measures small-molecule metabolites that serve as direct indicators of physiological state and cellular processes [3].
- Microbiomics characterizes the collective genomes of microbial communities living in symbiosis with the host, which critically modulate immunity, metabolism, and pharmacological response [4].
Table 1: Multi-Omics Data Types and Their Characteristics
| Omics Layer | Molecules Measured | Biological Significance | Common Technologies |
|---|---|---|---|
| Genomics | DNA sequence, variations | Genetic blueprint, disease risk | Whole Genome Sequencing (WGS) |
| Transcriptomics | RNA expression levels | Active gene regulation | RNA Sequencing (RNA-seq) |
| Proteomics | Protein abundance, modifications | Functional effectors, drug targets | Mass Spectrometry |
| Epigenomics | DNA methylation, histone marks | Gene regulation, environmental response | Bisulfite Sequencing, ChIP-seq |
| Metabolomics | Metabolites (sugars, lipids, etc.) | Physiological state, metabolic health | Mass Spectrometry, NMR |
| Microbiomics | Microbial genomes, genes | Host-microbe interactions, immunity | Metagenomic Sequencing |
Core Analytical Challenges in Multi-Omics Integration
The integration of multi-omics data presents substantial technical and analytical hurdles that must be overcome to extract meaningful biological and clinical insights.
Data Heterogeneity and Scale
The fundamental challenge lies in the wild diversity of data types, each with distinct formats, scales, and inherent biases [3]. Genomics data provides a static blueprint across 3 billion base pairs, while transcriptomics captures dynamic cellular activity, proteomics reflects functional tissue states, and metabolomics offers the most direct link to observable phenotype [3]. Clinical data from electronic health records (EHRs) adds another dimension of complexity with both structured information (e.g., lab values) and unstructured data (e.g., physician notes) requiring natural language processing for interpretation [3]. This combination creates the "high-dimensionality problem," where features vastly outnumber samples, potentially breaking traditional statistical methods and increasing false discovery rates [3].
Technical and Computational Hurdles
Several critical technical challenges must be addressed throughout the multi-omics workflow:
- Data normalization and harmonization: Different laboratory platforms generate data with unique technical characteristics that can obscure true biological signals, requiring sophisticated normalization techniques to make datasets comparable [3].
- Missing data management: Incomplete datasets are common in biomedical research (e.g., a patient with genomic data but missing proteomic measurements) and can seriously bias analyses if not handled with robust imputation methods [3].
- Batch effect correction: Technical variations from different technicians, reagents, or sequencing machines create systematic noise that can obscure biological variation, requiring statistical correction methods like ComBat [3].
- Massive computational requirements: Multi-omics analyses often involve petabytes of data, demanding scalable infrastructure like cloud computing and distributed computing frameworks [3].
Diagram: Multi-Omics Data Integration Workflow illustrating the pipeline from raw data collection through preprocessing, integration strategies, and AI analysis to biological insights.
AI-Powered Integration Strategies and Computational Frameworks
Artificial intelligence and machine learning have become indispensable for multi-omics integration, providing the pattern recognition capabilities needed to detect subtle connections across millions of data points that remain invisible to conventional analysis [3]. The choice of integration strategy significantly influences what biological relationships can be detected.
Integration Timing Strategies
Researchers typically employ three main strategies differentiated by when integration occurs in the analytical pipeline:
- Early Integration (Feature-level): Merges all raw features into one massive dataset before analysis, potentially capturing complex unforeseen interactions but suffering from extreme dimensionality [3].
- Intermediate Integration: First transforms each omics dataset into a more manageable representation, then combines these representations using network-based methods that incorporate biological context [3].
- Late Integration (Model-level): Builds separate predictive models for each omics type and combines their predictions, offering computational efficiency and robustness to missing data but potentially missing subtle cross-omics interactions [3].
Table 2: Multi-Omics Integration Strategies and Machine Learning Approaches
| Integration Strategy | Key Machine Learning Methods | Advantages | Ideal Use Cases |
|---|---|---|---|
| Early Integration | Deep Neural Networks, Autoencoders | Captures all cross-omics interactions | Biomarker discovery, novel pathway identification |
| Intermediate Integration | Similarity Network Fusion (SNF), Graph Convolutional Networks (GCNs) | Reduces complexity, incorporates biological context | Disease subtyping, patient stratification |
| Late Integration | Ensemble Methods, Stacking | Handles missing data well, computationally efficient | Clinical outcome prediction, diagnostic models |
| Temporal Integration | Recurrent Neural Networks (RNNs), LSTMs | Captures disease progression dynamics | Longitudinal studies, treatment response monitoring |
State-of-the-Art Machine Learning Techniques
Several advanced AI methods have proven particularly effective for multi-omics data:
- Autoencoders (AEs) and Variational Autoencoders (VAEs): Unsupervised neural networks that compress high-dimensional omics data into dense, lower-dimensional "latent spaces" where integration becomes computationally feasible while preserving biological patterns [3].
- Graph Convolutional Networks (GCNs): Specifically designed for network-structured data, making them ideal for biological networks where genes and proteins represent nodes and their interactions form edges [3].
- Similarity Network Fusion (SNF): Creates patient-similarity networks from each omics layer and iteratively fuses them into a single comprehensive network, enabling more accurate disease subtyping [3].
- Transformers: Originally developed for natural language processing, these models adapt brilliantly to biological data through self-attention mechanisms that weigh the importance of different features and data types [3].
Experimental Protocols for Multi-Omics Studies
Implementing robust multi-omics studies requires meticulous experimental design and execution across several critical phases.
Study Design and Cohort Selection
Longitudinal Cohort Establishment: Large prospective cohorts form the backbone of multi-omics research, enabling understanding of genetic determinants, environmental exposures, disease natural history, and treatment response at population level [1]. Key considerations include:
- Ensure representative population diversity to achieve equity in genomic healthcare and extend precision medicine benefits to all populations [1]
- Address current underrepresentation of non-European populations (approximately 86.3% of all genomic studies) through community-based participatory research frameworks [1]
- Develop specialized pediatric cohorts to understand genetic epidemiology of childhood diseases, as many existing cohorts have insufficient child representation [1]
Sample Collection and Processing:
- Implement standardized protocols for biospecimen collection, storage, and processing to maintain sample integrity across multiple analytical platforms [5]
- For limited tissue scenarios (e.g., oncology), consider technologies like ApoStream that capture viable whole cells from liquid biopsies, preserving cellular morphology for downstream multi-omic analysis [5]
- Apply high-resolution multiplexing technologies for simultaneous analysis of multiple molecular layers from minimal sample material [5]
Data Generation and Quality Control
Next-Generation Sequencing (NGS) Applications:
- Utilize sequencing by synthesis (Illumina platforms) for genome and exome sequencing, with modern systems like NovaSeq providing 6-16 Tb output and read lengths up to 2×250 bp [1]
- Implement RNA sequencing for transcriptome profiling with appropriate normalization (TPM, FPKM) to enable cross-sample comparison [3]
- Apply metagenomic sequencing for microbiome characterization, capturing microbial community structure and functional potential [4]
Proteomic and Metabolomic Profiling:
- Employ mass spectrometry-based platforms for protein identification and quantification, including post-translational modifications [3]
- Utilize targeted and untargeted mass spectrometry approaches for metabolomic profiling, providing snapshots of physiological state [3]
- Implement spectral flow cytometry for deep immune phenotyping, enabling analysis of 60+ markers and theoretical identification of thousands of cellular phenotypes [5]
Quality Control Measures:
- Apply batch effect correction methods (e.g., ComBat) to address technical variations from different processing batches [3]
- Implement rigorous normalization procedures specific to each omics data type to enable valid integration [3]
- Use quality metrics and visualization tools to identify outliers and technical artifacts before integration
The Scientist's Toolkit: Essential Research Reagents and Technologies
Successful multi-omics research requires specialized reagents, platforms, and computational tools. The following essential resources represent critical components of the multi-omics workflow.
Table 3: Essential Research Reagents and Platforms for Multi-Omics Studies
| Category | Specific Tools/Reagents | Primary Function | Application Context |
|---|---|---|---|
| Sequencing Platforms | Illumina NovaSeq, HiSeq | High-throughput DNA/RNA sequencing | Whole genome, exome, transcriptome sequencing |
| Proteomics Technologies | Mass spectrometry platforms | Protein identification and quantification | Proteomic profiling, post-translational modifications |
| Single-Cell Technologies | 10x Genomics, SeqWell | Single-cell RNA sequencing | Cellular heterogeneity, rare cell populations |
| Spatial Omics Platforms | 10x Visium, NanoString GeoMx | Tissue context preservation | Spatial transcriptomics, protein localization |
| Flow Cytometry | Spectral flow cytometers | Deep immunophenotyping | Immune cell characterization, biomarker discovery |
| Liquid Biopsy Technologies | ApoStream | Circulating tumor cell isolation | Non-invasive cancer monitoring, biomarker discovery |
| Variant Interpretation Tools | DeepVariant, GATK, REVEL | Genetic variant calling and annotation | Variant prioritization, pathogenicity prediction |
| AI Analysis Platforms | TensorFlow, PyTorch, custom pipelines | Pattern recognition across omics layers | Biomarker discovery, patient stratification |
The integration of multi-omics data represents a paradigm shift in biomedical research, moving from fragmented biological insights to a comprehensive systems-level understanding of health and disease. As computational capabilities advance and multi-omics technologies become more accessible, the clinical implementation of these approaches will accelerate, ultimately fulfilling the promise of precision medicine to deliver personalized, predictive, preventive, and participatory healthcare [1]. Future directions will need to address ongoing challenges in data standardization, computational infrastructure, diversity in genomic databases, and ethical implementation, but the foundation established by multi-omics integration already provides an unprecedented pathway to understanding and treating complex diseases.
Precision medicine represents a transformative healthcare model that utilizes an understanding of an individual’s genome, environment, and lifestyle to deliver customized healthcare [1]. This approach marks a paradigm shift from conventional, reactive disease control to proactive disease prevention and health preservation. The foundation of this revolution lies in the integration of diverse biological data layers, known as multi-omics. Multi-omics combines genomics, transcriptomics, proteomics, metabolomics, and other omics technologies to create a comprehensive picture of human biology [1] [6]. By 2025, multi-omics is poised to significantly advance personalized medicine, enabling more detailed patient health profiles, accelerating therapeutic development, and refining disease detection [6].
The power of multi-omics stems from its ability to overcome the limitations of single-omics approaches. While genomics provides a blueprint, it cannot fully capture the dynamic complexity of biological systems [7]. Integrative multi-omics, the combination of multiple 'omics' data layered over each other, provides a more holistic understanding of human health and disease than any single approach separately [1]. This integration is made possible through phenomenal advancements in bioinformatics, data sciences, and artificial intelligence, which allow researchers to decipher the complex interactions between genes, proteins, metabolites, and environmental factors [1] [6]. The ultimate goal is to move beyond correlative relationships to establish causal mechanisms that can be targeted for therapeutic intervention across various diseases, including cancer, cardiovascular disorders, and neuropsychiatric conditions [8] [9].
Core Omics Technologies: From Genes to Metabolites
Defining the Omics Layers
The four primary omics layers form a central dogma of molecular biology, each providing unique insights into biological systems. Genomics involves the study of a person's complete set of DNA, including all genes and intergenic regions. Unlike genetics, which focuses on individual genes, genomics examines the entire genome and how it is expressed, providing insights into inherited health risks and genetic predispositions to disease [9]. The Human Genome Project, completed in 2003, established the foundational reference sequence and revealed that the human genome contains only 20,000-25,000 protein-coding genes [1].
Transcriptomics focuses on the entire collection of RNA molecules, known as the transcriptome, within a cell. This includes messenger RNA (mRNA), which conveys genetic information for protein synthesis, as well as various non-coding RNAs. The transcriptome dynamically changes in response to cellular state and environmental stimuli, providing a snapshot of gene expression activity [9]. Notably, transcriptomes differ between cell types despite identical underlying DNA, reflecting cellular specialization [9].
Proteomics encompasses the study of the entire set of proteins—the proteome—expressed by a cell, tissue, or organism. Proteins are the functional effectors of cellular processes, and their analysis is more complex than nucleic acids due to post-translational modifications, protein-protein interactions, and structural diversity [9]. Proteomic approaches typically fall into three categories: expression proteomics (quantifying protein levels), structural proteomics (determining protein structures and locations), and functional proteomics (elucidating protein functions and interactions) [9].
Metabolomics analyzes the complete set of small-molecule metabolites (typically <1200 Da) within a biological system. The metabolome represents the downstream output of cellular processes and provides the most dynamic reflection of phenotypic state, serving as a molecular phenotype that integrates genetic, environmental, and lifestyle factors [7] [9]. Metabolites include lipids, amino acids, carbohydrates, and other biochemical intermediates that participate in and result from metabolic pathways [9].
Comparative Analysis of Omics Technologies
Table 1: Comparative analysis of the four core omics technologies
| Omics Field | Molecule Class | Key Technologies | Temporal Resolution | Key Applications |
|---|---|---|---|---|
| Genomics | DNA, genetic variants | Next-generation sequencing (NGS), Sanger sequencing, whole-genome sequencing, microarrays | Static (with exceptions for epigenetic changes) | Disease risk prediction, rare variant discovery, ancestry tracing, pharmacogenomics [1] [9] |
| Transcriptomics | RNA (mRNA, non-coding RNA) | RNA-seq, single-cell RNA-seq, microarrays, spatial transcriptomics | Minutes to hours | Gene expression profiling, alternative splicing analysis, biomarker discovery, response to therapeutics [8] [9] |
| Proteomics | Proteins, peptides | Mass spectrometry, protein microarrays, immunoassays, affinity-based profiling | Hours to days | Drug target identification, biomarker validation, signaling pathway analysis, post-translational modification mapping [9] |
| Metabolomics | Metabolites (lipids, sugars, amino acids, etc.) | Mass spectrometry, NMR spectroscopy, LC/GC-MS | Seconds to minutes | Biomarker discovery, nutrient profiling, toxicology assessment, metabolic pathway analysis [7] [9] |
Quantitative Capabilities of Omics Platforms
Table 2: Technical specifications and throughput of major omics platforms
| Technology Platform | Analytical Depth | Throughput Capacity | Key Limitations |
|---|---|---|---|
| Illumina NovaSeq (NGS) | 20-52 billion reads per run, read lengths up to 2×250 bp [1] | 6-16 terabases per run [1] | Short reads challenge haplotype phasing and structural variant detection |
| Single-cell RNA-seq | Profiles 1,000-10,000 cells per run, detects 1,000-5,000 genes per cell [8] | 10,000-100,000 cells in modern high-throughput systems | Sensitivity to cell viability, technical noise, high cost per cell |
| Mass spectrometry-based proteomics | Identifies 5,000-10,000+ proteins per sample in deep profiling, 500-1,000 proteins in high-throughput mode | 10s-100s of samples per batch | Dynamic range limitations, incomplete proteome coverage |
| LC-MS metabolomics | Detects 100s-1,000s of metabolites depending on chromatography and mass analyzer | 10s-100s of samples per batch | Unknown metabolite identification, spectral annotation challenges |
Methodological Workflows in Multi-Omics Research
Sample Preparation and Experimental Protocols
The integrity of multi-omics research begins with robust sample preparation. For genomic analyses, DNA extraction methods must preserve fragment length and minimize contamination. Modern next-generation sequencing (NGS) has evolved significantly from Sanger sequencing, with platforms like Illumina's NovaSeq technology providing outputs of 6-16 terabytes per run, representing 20-52 billion reads with maximum read lengths of up to 2×250 base pairs [1]. For transcriptomic studies, RNA isolation requires strict RNase-free conditions and rapid stabilization to preserve the authentic transcriptome representation. Single-cell RNA sequencing protocols typically involve cell dissociation, viability assessment, and either plate-based or droplet-based partitioning [8].
Proteomic sample preparation focuses on protein extraction, digestion, and purification. Typical workflows involve tissue homogenization in denaturing buffers, protein quantification, protease digestion (usually with trypsin), and peptide cleanup prior to mass spectrometry analysis. Metabolomic protocols require immediate quenching of metabolic activity upon sample collection, using cold methanol or other organic solvents to preserve the metabolic snapshot. Different extraction methods are employed for various metabolite classes (e.g., liquid-liquid extraction for lipids, solid-phase extraction for polar metabolites).
Single-Cell Omics Advancements
Single-cell omics technologies have emerged as particularly powerful tools for investigating cellular heterogeneity, especially in complex tissues like the human brain [8]. These techniques have overcome the limitations of bulk tissue analysis, where molecular signals from rare cell types are diluted or obscured. Key methodological developments include fluorescence-activated cell sorting (FACS) and fluorescence-activated nuclei sorting (FANS), which enable semi-automated isolation of specific cell populations based on fluorescent markers [8]. The evolution from manual cell picking to high-throughput droplet-based systems has enabled researchers to profile thousands to millions of individual cells in a single experiment.
Recent innovations in single-cell multi-omics allow simultaneous measurement of multiple molecular layers from the same cell. For example, technologies like CITE-seq (Cellular Indexing of Transcriptomes and Epitopes by Sequencing) enable coupled transcriptome and surface protein quantification, while methods like scNMT-seq (single-cell Nucleosome, Methylation, and Transcription sequencing) provide integrated data on chromatin accessibility, DNA methylation, and transcriptomes from the same single cells [8]. These approaches are particularly valuable for neuropsychiatric research, where they have revealed cell-type-specific molecular alterations in conditions like dementia and depression [8].
Essential Research Reagents and Materials
Table 3: Essential research reagents and materials for multi-omics investigations
| Reagent/Material Category | Specific Examples | Key Functions | Technical Considerations |
|---|---|---|---|
| Nucleic Acid Isolation Kits | DNA extraction kits, RNA stabilization reagents, magnetic bead-based purification systems | Preservation and purification of high-quality nucleic acids free of contaminants | RNase-free environment for RNA work, assessment of DNA integrity numbers (DIN) and RNA integrity numbers (RIN) |
| Enzymes for Molecular Biology | Restriction enzymes, reverse transcriptases, DNA/RNA polymerases, proteases (trypsin) | Nucleic acid modification, amplification, and digestion | Batch-to-batch consistency, activity validation under specific buffer conditions |
| Separation Materials | LC columns (C18, HILIC), electrophoresis gels, solid-phase extraction cartridges | Separation of complex mixtures prior to analysis | Column chemistry selection based on analyte properties, particle size for resolution |
| Detection Reagents | Fluorescent dyes, antibody conjugates, isotopic labels, calibration standards | Signal generation and quantification | Sensitivity, dynamic range, specificity, minimal background interference |
| Cell Isolation Tools | FACS antibodies, nucleus sorting antibodies, dissociation enzymes, microfluidic devices | Isolation of specific cell populations or single cells | Cell viability preservation, surface epitope preservation, sorting efficiency |
Data Integration and Analytical Approaches
Multi-Omics Data Integration Strategies
The integration of multiple omics datasets presents significant computational challenges but offers unparalleled biological insights. Several methodological frameworks have been developed for this purpose. Pathway- or biochemical-ontology-based integration tools like IMPALA, iPEAP, and MetaboAnalyst leverage predefined biological pathways to identify coordinated changes across omics layers [7]. These methods facilitate biological interpretation by integrating domain knowledge with experimental results, though they are constrained by the completeness and accuracy of pathway annotations.
Biological-network-based integration approaches construct networks representing complex connections between cellular components. Tools such as SAMNetWeb, pwOmics, and Metscape (a Cytoscape plugin) enable the visualization and analysis of gene-protein-metabolite networks, identifying altered graph neighborhoods without relying on predefined pathways [7]. MetaMapR extends this approach by incorporating biochemical reaction information with molecular structural and mass spectral similarity, enabling integration even for molecules with unknown biological function [7].
Empirical correlation analysis methods are particularly valuable when biochemical domain knowledge is limited. The R package mixOmics implements multivariate techniques including regularized sparse principal component analysis (sPCA) and canonical correlation analysis (rCCA) to identify relationships between two high-dimensional datasets [7]. Weighted gene correlation network analysis (WGCNA) extends correlation analysis to include graph topology measures and has been widely applied to identify clusters of highly connected genes related to clinical traits or other omics data [7].
Bioinformatics Tools for Multi-Omics Analysis
Table 4: Key bioinformatics tools for multi-omics data integration and analysis
| Tool Name | Primary Function | Input Data Types | Methodology | Access |
|---|---|---|---|---|
| IMPALA | Pathway-level analysis | Gene/protein expression, metabolomics | Pathway enrichment | Web-based [7] |
| MetaboAnalyst | Comprehensive metabolomics analysis | Transcriptomics, metabolomics | Functional enrichment, pathway analysis | Web-based [7] |
| pwOmics | Signaling network analysis | Transcriptomics, proteomics | Time-series consensus networks | R Bioconductor [7] |
| Metscape | Gene-metabolite network analysis | Gene expression, metabolite data | Metabolic pathway enrichment | Cytoscape plugin [7] |
| WGCNA | Correlation network analysis | Any omics data | Weighted correlation network analysis | R package [7] |
| Grinn | Graph-database integration | Genomics, proteomics, metabolomics | Neo4j graph database with correlation analysis | R package [7] |
| MixOmics | Multivariate analysis | Any omics data | sPCA, rCCA, sPLS-DA | R package [7] |
Artificial Intelligence in Multi-Omics Integration
Artificial intelligence and machine learning have become indispensable for analyzing complex multi-omics datasets [6]. AI approaches are particularly valuable for identifying patterns and relationships across diverse data modalities that might escape conventional statistical methods. Machine learning-based variant classification tools offer advantages over statistics-based predictors because they are data-driven and yield probabilistic pathogenicity scores for prioritizing variants of unknown significance [1]. AI also facilitates patient stratification by integrating multi-omics data with clinical outcomes, enabling prediction of disease progression, drug efficacy, and optimal treatment strategies [6].
As multi-omics technologies generate increasingly large and complex datasets, federated computing approaches and advanced data storage infrastructures are emerging to support collaborative research while addressing privacy concerns [6]. These computational advancements are crucial for realizing the full potential of multi-omics in precision medicine, transforming vast biological datasets into clinically actionable insights.
Applications in Precision Medicine and Therapeutic Development
Advancing Rare Disease Diagnosis and Treatment
Multi-omics approaches are revolutionizing rare disease diagnosis by overcoming the limitations of single-omics approaches. Initiatives like the U.K.'s 100,000 Genomes Project have demonstrated how integrating genomic data with other omics layers can provide diagnoses for patients with rare genetic disorders who remained undiagnosed after conventional testing [6]. The genotype-first approach or reverse phenotyping has the potential to identify new genotype-phenotype associations, enhance disease subclassification, and widen the phenotypic spectrum of genetic variants [1]. By combining genomic findings with transcriptomic, proteomic, and metabolomic data, clinicians can better interpret variants of uncertain significance and identify pathological mechanisms that might be amenable to therapeutic intervention.
The clinical impact of multi-omics extends beyond diagnosis to treatment selection and development. In oncology, multi-omics profiling enables the identification of driver mutations and corresponding protein expression patterns that can be targeted with specific therapeutics [9] [6]. Similarly, integrating metabolomic data with genomic information helps identify metabolic vulnerabilities in cancer cells that can be exploited therapeutically. The ability to profile multiple molecular layers from limited clinical samples, such as liquid biopsies, makes multi-omics particularly valuable for monitoring treatment response and detecting emergent resistance mechanisms [6].
Enabling Personalized Therapeutic Strategies
Multi-omics data integration facilitates the development of personalized therapeutic strategies in several key areas. In pharmacogenomics, combining genomic data about drug metabolism pathways with proteomic information about drug targets and metabolomic profiles of drug response enables more precise medication selection and dosing [1]. For cell and gene therapies, multi-omics characterization of starting materials and final products ensures quality control and helps predict therapeutic efficacy [6]. In drug discovery, multi-omics approaches enable target identification and validation through comprehensive understanding of disease pathways across molecular layers [10].
The rise of single-cell multi-omics is particularly transformative for personalized medicine applications. By characterizing cellular heterogeneity in patient samples, these technologies can identify rare cell populations that drive disease progression or treatment resistance [8] [6]. In neuropsychiatric disorders, single-cell omics applied to postmortem brain tissue has revealed cell-type-specific molecular alterations in conditions like dementia and depression, providing new targets for therapeutic intervention [8]. Similarly, in cancer, single-cell multi-omics can identify minority subclones with resistant mutations that would be missed by bulk tumor profiling.
Future Directions and Challenges
Despite significant progress, several challenges remain in the widespread implementation of multi-omics approaches in precision medicine. Data integration hurdles include technical variability between platforms, batch effects, and the computational complexity of integrating heterogeneous datasets [7] [6]. Standardization needs encompass analytical protocols, data quality metrics, and computational workflows to ensure reproducibility across laboratories [6]. Equity in genomic research requires addressing the significant underrepresentation of non-European populations in existing datasets, which currently limits the applicability of findings across diverse populations [1]. It is estimated that participants of European descent constitute 86.3% of all genomic studies conducted worldwide, while African, South Asian, and Hispanic descent participants together constitute less than 10% [1].
Future advancements will likely focus on developing more sophisticated AI-driven integration methods, creating scalable computational infrastructures for multi-omics data, and establishing frameworks for responsible data sharing [6]. The continued evolution of single-cell and spatial omics technologies will provide increasingly detailed maps of cellular organization and function in both health and disease [8]. As these technologies mature and barriers are addressed, multi-omics approaches will become increasingly central to precision medicine, enabling truly personalized approaches to disease prevention, diagnosis, and treatment across diverse populations.
Precision medicine represents a transformative healthcare model that leverages a person’s genomic, environmental, and lifestyle data to deliver customized healthcare [1]. This approach marks a paradigm shift from conventional, reactive disease control to proactive disease prevention and health preservation. The foundation of this revolution lies in the ability to move beyond isolated data types—such as genomics alone—to a holistic, systems biology view that integrates multiple layers of biological information. This integration provides an unprecedented opportunity to decipher the complex and heterogeneous interactions between genes, diet, and lifestyle that underlie human health and disease [1]. The emergence of multi-omics technologies, including transcriptomics, proteomics, epigenomics, metabolomics, and microbiomics, has substantially enhanced our capacity to maximize the applicability of genomics data for improved health outcomes [1]. Integrative multi-omics, defined as the combination of multiple 'omics' data layered over each other along with their interconnections and interactions, delivers a more comprehensive understanding of human biology than any single approach can provide separately.
The Multi-Omics Landscape: From Single Layers to Unified Views
The Omics Cascade and Technological Foundations
The journey toward a systems biology view begins with understanding the distinct yet interconnected layers of biological information. Each omics layer provides a unique perspective on cellular function, from genetic blueprint to metabolic activity.
Table 1: The Multi-Omics Cascade: Data Types, Technologies, and Insights
| Omics Layer | Biological Entity | Key Technologies | Primary Insights |
|---|---|---|---|
| Genomics | DNA | Next-Generation Sequencing (NGS), Whole Genome Sequencing | Genetic blueprint, inherited variations, disease predisposition |
| Epigenomics | DNA modifications | scATAC-seq, snmC-seq | Regulatory landscape, chromatin accessibility, methylation patterns |
| Transcriptomics | RNA | scRNA-seq, RNA-Seq | Gene expression patterns, regulatory responses, cellular activity |
| Proteomics | Proteins | Mass spectrometry | Functional effectors, protein expression and interactions |
| Metabolomics | Metabolites | Mass spectrometry, NMR | Metabolic state, physiological responses, downstream phenotypes |
| Microbiomics | Microorganisms | 16S rRNA sequencing, metagenomics | Microbial communities, host-microbe interactions, ecosystem impacts |
The technological revolution, particularly in next-generation sequencing (NGS), has been instrumental in enabling this multi-omics approach. NGS includes various methods like sequencing by synthesis, pyrosequencing, sequencing by ligation, and ion semiconductor sequencing, with sequencing by synthesis using PCR being the most widely used method for genome and exome sequencing [1]. Continuous technological refinements have led to significant advancements in NGS platforms, with output capacities increasing from 1.6–1.8 terabytes (Tb) with HiSeq technology to 6–16 Tb with NovaSeq technology, enabling the generation of billions of reads per run [1].
The Single-Cell Revolution
Single-cell technologies have dramatically enhanced the resolution of multi-omics studies by allowing researchers to probe regulatory maps through multiple omics layers at the individual cell level [11]. Techniques such as single-cell ATAC-sequencing (scATAC-seq) for chromatin accessibility, snmC-seq for DNA methylation, and scRNA-seq for the transcriptome offer a unique opportunity to unveil the underlying regulatory bases for the functionalities of diverse cell types [11]. The most recent innovation involves multimodal single-cell omics, where two omic profiles (e.g., proteomics and transcriptomics) are captured for the same cell, along with spatially resolved techniques that preserve geographical context within tissues [12].
Computational Integration Strategies: Bridging the Feature Space Gap
The Core Challenge of Multi-Omics Integration
A fundamental obstacle in integrating unpaired multi-omics data is that different modalities have distinct feature spaces—for example, accessible chromatin regions in scATAC-seq versus genes in scRNA-seq [11]. This creates a significant computational challenge for creating unified biological models. Additional complexities include data heterogeneity and scale, missing data, batch effects, and staggering computational requirements often involving petabytes of data [3].
Integration Frameworks and Machine Learning Approaches
Table 2: Multi-Omics Integration Strategies: Approaches and Applications
| Integration Strategy | Timing of Integration | Key Advantages | Ideal Use Cases | Example Methods |
|---|---|---|---|---|
| Early Integration (Feature-level) | Before analysis | Captures all cross-omics interactions; preserves raw information | Discovery of novel, unforeseen interactions across modalities | Simple concatenation, Autoencoders |
| Intermediate Integration | During analysis | Reduces complexity; incorporates biological context through networks | Network biology, pathway analysis, functional module discovery | Graph Convolutional Networks, Similarity Network Fusion |
| Late Integration (Model-level) | After individual analysis | Handles missing data well; computationally efficient | Predictive modeling, clinical outcome prediction | Ensemble methods, Stacking, Weighted averaging |
The GLUE (Graph-Linked Unified Embedding) framework represents an advanced approach to addressing the fundamental challenge of distinct feature spaces across omics layers [11]. GLUE uses a knowledge-based "guidance graph" that explicitly models cross-layer regulatory interactions—for example, connecting accessible chromatin regions to their putative downstream genes with signed edges (positive or negative regulatory effects) [11]. This graph then guides the adversarial alignment of cell embeddings learned through variational autoencoders tailored to each omics layer, resulting in accurate integration while simultaneously enabling regulatory inference [11].
Systematic benchmarking has demonstrated that GLUE achieves superior performance in matching corresponding cell states across modalities, producing cell embeddings where biological variation is faithfully conserved and omics layers are well mixed [11]. Notably, GLUE reduces single-cell level alignment error by 1.5 to 3.6-fold compared to other methods and exhibits remarkable robustness to inaccuracies in prior knowledge, maintaining performance even with up to 90% corruption of regulatory interactions in the guidance graph [11].
Artificial Intelligence and Machine Learning Solutions
Without AI and machine learning, integrating multi-modal genomic and multi-omics data for precision medicine would be impossible due to the sheer volume and complexity of the data [3]. These approaches provide superhuman pattern recognition capabilities, detecting subtle connections across millions of data points that are invisible to conventional analysis.
Key machine learning techniques powering multi-omics integration include:
- Autoencoders (AEs) and Variational Autoencoders (VAEs): Unsupervised neural networks that compress high-dimensional omics data into a dense, lower-dimensional "latent space," making integration computationally feasible while preserving key biological patterns [3].
- Graph Convolutional Networks (GCNs): Designed for network-structured data, GCNs learn from biological networks by aggregating information from a node's neighbors to make predictions, proving effective for clinical outcome prediction [3].
- Similarity Network Fusion (SNF): Creates patient-similarity networks from each omics layer and iteratively fuses them into a single comprehensive network, enabling more accurate disease subtyping and prognosis prediction [3].
- Transformers: Originally from natural language processing, transformers adapt brilliantly to biological data through self-attention mechanisms that weigh the importance of different features and data types, identifying critical biomarkers from noisy data [3].
Experimental Protocols and Research Toolkit
Detailed Methodology for Multi-Omics Integration
Protocol 1: GLUE Framework Implementation for Single-Cell Multi-Omics Integration
This protocol outlines the step-by-step procedure for implementing the GLUE framework to integrate unpaired single-cell multi-omics data, based on the approach described by Gao et al. [11].
Data Preprocessing and Feature Selection
- For each omics modality (e.g., scRNA-seq, scATAC-seq), perform quality control, normalization, and feature selection.
- For scRNA-seq: Filter cells based on mitochondrial percentage, total counts, and detected genes. Normalize using standard methods (e.g., log(TPM+1)).
- For scATAC-seq: Filter cells based on transcription start site enrichment, total fragments, and nucleosome signal. Create peak count matrices.
- Select highly variable features for each modality to reduce dimensionality and computational requirements.
Guidance Graph Construction
- Construct a knowledge-based bipartite graph connecting features across omics layers.
- For scRNA-seq and scATAC-seq integration: Connect ATAC peaks to genes if they overlap in the gene body or proximal promoter regions (typically ±2kb from transcription start site).
- Assign edge signs based on known regulatory relationships: positive edges for activating relationships, negative edges for repressive relationships (e.g., gene body DNA methylation typically receives negative edges due to negative correlation with expression).
Model Configuration and Training
- Implement separate variational autoencoders for each omics modality with modality-specific probabilistic decoders.
- Configure the adversarial alignment module with a multilayer perceptron discriminator.
- Set hyperparameters: latent dimension (typically 16-64), learning rate (typically 0.001-0.01), and number of training iterations (typically 10,000-50,000).
- Train the model using stochastic gradient descent with adversarial training until convergence.
Integration and Downstream Analysis
- Extract aligned cell embeddings from the trained model.
- Perform clustering, visualization (UMAP/t-SNE), and cell type annotation on the integrated embeddings.
- Transfer labels across modalities using neighborhood-based label transfer.
- Validate integration quality using metrics such as integration consistency score.
Regulatory Inference
- Extract feature embeddings from the trained model.
- Refine the guidance graph based on the learned feature embeddings.
- Identify significant regulatory interactions using the refined graph.
- Validate inferred regulations through comparison with known regulatory databases and experimental validation.
Essential Research Reagent Solutions
Table 3: Research Reagent Solutions for Multi-Omics Studies
| Reagent/Category | Specific Examples | Primary Function | Application Context |
|---|---|---|---|
| Single-Cell Isolation | 10x Genomics Chromium System, Fluidigm C1 | High-throughput single-cell partitioning and barcoding | Preparation of single-cell suspensions for sequencing |
| Multi-Omics Assay Kits | 10X Multiome ATAC + Gene Expression, SHARE-seq, SNARE-seq | Simultaneous measurement of multiple omics modalities from same cells | Paired multi-omics data generation for direct integration |
| Library Preparation | Illumina Nextera, Smart-seq2, ATAC-seq Kits | Preparation of sequencing libraries from specific molecular fractions | Conversion of biological samples to sequence-ready formats |
| Sequencing Reagents | Illumina NovaSeq S-Prime Kits, PacBio SMRTbell | High-throughput DNA/RNA sequencing with various read lengths | Generation of raw sequencing data from prepared libraries |
| Bioinformatics Tools | GLUE, Seurat, Scanpy, Cell Ranger | Computational processing, integration, and analysis of omics data | Downstream data analysis and biological interpretation |
Applications in Precision Medicine and Therapeutic Development
Clinical Translation and Biomarker Discovery
Integrated multi-omics approaches are demonstrating significant impact across multiple clinical domains, particularly in oncology. In glioma research, for example, multi-omics strategies are being used to decipher the molecular taxonomy of adult-type diffuse gliomas, with the integration of multilayer data combined with machine-learning-based algorithms paving the way for advancements in patient prognosis and the development of personalized, targeted therapeutic interventions [13]. By combining genomics, transcriptomics (including sex-dependent differential expression patterns), epigenomics, proteomics, metabolomics, radiomics, single-cell analysis, and spatial omics into a comprehensive framework, researchers can deepen their understanding of glioma biology and enhance diagnostic precision, prognostic accuracy, and treatment efficacy [13].
One of the most impactful applications of integrated omics is the discovery of novel biomarkers that can serve as early warning signs, diagnostic tools, or indicators of treatment response [3]. By integrating genomics, transcriptomics, and proteomics, researchers can uncover complex molecular patterns of disease long before symptoms manifest. Multi-modal approaches are showing particular promise in detecting cancers earlier, where combining liquid biopsy data (circulating tumor DNA) with proteomic markers and clinical risk factors can significantly improve early detection accuracy for multiple cancer types from a single blood draw [3].
Pharmacological Applications and Drug Development
The integration of single-cell technologies with multi-omics approaches has created extraordinary opportunities in pharmacology and therapeutic development. Single-cell biofluorescence analysis, when combined with deep neural networks, can reveal the mechanisms of action of screened drugs [12]. Similarly, the idTRAX algorithm, which combines biofluorescent drug screening with machine learning, has demonstrated success in identifying cancer-selective kinase inhibitors [12].
The trifecta of single-cell omics, systems biology, and machine learning contributes significantly to pharmacological research by enabling:
- Cell-type specific drug targeting: Identifying how drugs target and create side effects in specific cell types by molecularly deconvoluting these populations [12].
- Heterogeneous population targeting: Characterizing and targeting disease-causing cells within heterogeneous populations, particularly relevant in cancer and infectious diseases [12].
- Predictive systems development: Increasing the accuracy of predictive algorithms for drug response by incorporating cell type specificity and heterogeneity characterization [12].
Future Perspectives and Challenges
Despite significant advancements, several challenges remain in the full implementation of integrated multi-omics approaches. Data diversity continues to be a critical issue, with participants of European descent constituting approximately 86.3% of all genomic studies ever conducted worldwide, while participants of African, South Asian, and Hispanic descent together constitute less than 10% of studies [1]. This limited representation creates substantial gaps in our understanding of genetic variation across human populations and hampers the equitable application of precision medicine benefits.
Additional challenges include the accurate interpretation of genomic sequences, with only a quarter of the more than 90,000 known variants having their pathological significance classified while the rest are classified as variants of unknown significance [1]. The development of more sophisticated computational methods that can handle the increasing volume and complexity of multi-omics data while remaining interpretable to biologists and clinicians represents another significant hurdle.
Future directions will likely focus on the development of more advanced knowledge-guided deep learning frameworks, enhanced methods for temporal multi-omics integration to understand disease progression, and improved approaches for translating computational findings into clinically actionable insights. As these technologies mature, the power of integration from single layers to a systems biology view will continue to transform our understanding of human health and disease, ultimately fulfilling the promise of precision medicine for diverse populations worldwide.
Precision medicine represents a transformative healthcare model that utilizes an individual’s genomic, environmental, and lifestyle information to deliver customized healthcare [1]. Multi-omics approaches—which integrate data from genomics, transcriptomics, proteomics, epigenomics, metabolomics, and microbiomics—are fundamental to realizing this vision, providing a systems biology framework for understanding human health and disease [1]. However, the robustness and translational potential of multi-omics research critically depend on two foundational elements: longitudinal study designs and population diversity in research cohorts.
Longitudinal cohorts provide the temporal dimension necessary to understand disease progression, identify dynamic biomarkers, and decipher complex gene-environment interactions [14]. Meanwhile, diverse participant inclusion ensures that scientific discoveries benefit all populations equitably and enhances the statistical power to detect genuine biological signals [15]. This technical guide examines the integral role of longitudinal cohorts and diversity as the backbone of robust multi-omics research within the broader context of precision medicine.
The Scientific Rationale: Why Longitudinal Diversity Matters in Multi-Omics
Capturing Dynamic Biological Processes
Longitudinal multi-omics profiling enables researchers to move beyond static snapshots to capture the dynamic nature of biological systems. These designs are particularly valuable for:
Understanding disease transitions: Deep longitudinal profiling can identify molecular patterns preceding clinical diagnosis, enabling early intervention strategies [14]. For example, longitudinal studies of individuals at risk for type 2 diabetes have revealed multiple pathways to diabetes onset through integrated analysis of omics data [14].
Modeling complex biological interactions: Temporal data allows researchers to investigate the complex web of interactions between genetics, metabolism, environmental factors, and lifestyle [16]. This is especially important for understanding critical developmental periods, such as puberty, which may represent susceptibility windows for metabolic deregulations [16].
Differentiating causality from correlation: Repeated measurements enhance the ability to infer causal relationships in multi-layer omics data [17]. For instance, longitudinal twin studies have helped disentangle genetic versus environmental contributions to proteome-BMI associations [18].
Addressing Representation Gaps in Genomic Research
Despite the recognized importance of diversity, significant representation gaps persist in multi-omics research. Participants of European descent constitute approximately 86.3% of all genomic studies ever conducted worldwide, while participants of African, South Asian, and Hispanic descent together constitute less than 10% [1]. This disparity has profound implications:
Limited generalizability: Genetic variants identified in one population may not transfer effectively to others due to differences in linkage disequilibrium (LD) patterns and allele frequencies [15]. For example, the CYP2C19*2 variant is in high LD with 127 SNPs in European ancestry populations compared to only 49 SNPs in African ancestry populations [15].
Reduced discovery potential: Populations with greater genetic diversity, such as those of African ancestry, harbor more genetic variants, offering enhanced opportunities for discovery [15]. The over-reliance on European-ancestry genomes has constrained our understanding of human genetic diversity and its implications for health and disease.
Perpetuation of health disparities: Without diverse representation, precision medicine advances may disproportionately benefit certain populations while exacerbating existing health disparities [19]. For example, polygenic risk scores developed primarily in European populations show reduced predictive accuracy in other ancestral groups [19].
Designing Robust Longitudinal Multi-Omic Cohorts: Methodological Considerations
Cohort Composition and Sampling Strategies
Table 1: Key Considerations for Longitudinal Multi-Omic Cohort Design
| Design Element | Technical Considerations | Best Practices |
|---|---|---|
| Participant Recruitment | Genetic ancestry, environmental exposures, socioeconomic factors, health status | Community-engaged approaches, oversampling underrepresented groups, inclusive eligibility criteria |
| Sampling Frequency | Expected rate of change in omics measures, practical constraints | Higher frequency for rapidly changing systems (e.g., daily for gut microbiome), less frequent for stable systems |
| Sample Collection | Standardized protocols, stability of biomolecules, multi-omic compatibility | Systematic SOPs, consideration of diurnal variation, adequate sample volume for all omics |
| Temporal Duration | Natural history of disease, developmental trajectories, practical constraints | Should capture complete cycles (e.g., seasonal patterns) or critical transitions (e.g., disease onset) |
Multi-Omic Technologies and Integration Approaches
Effective longitudinal multi-omics studies require careful selection of technologies and integration strategies:
Technology selection: The choice of platforms should consider throughput, reproducibility, and compatibility across omics layers. For genomics, the Multi-Ethnic Global Array (MEGA) provides better genotyping coverage across diverse populations compared to earlier platforms [15].
Reference materials: Using common reference materials, such as those developed by the Quartet Project, enables ratio-based quantitative profiling that improves data comparability across batches, labs, and platforms [20]. These materials provide "built-in truth" defined by pedigree relationships and central dogma information flow.
Data integration approaches: Vertical (cross-omics) integration combines diverse datasets from multiple omics types from the same samples, while horizontal (within-omics) integration combines datasets from the same omics type across multiple batches [20]. The integration strategy should align with the research objectives—whether sample classification or feature network identification.
Analytical Frameworks for Longitudinal Multi-Omics Data
Statistical Modeling Approaches
Longitudinal omics data presents unique analytical challenges, including imbalanced measurements, high-dimensionality, and complex correlation structures [21]. Key analytical approaches include:
Linear Mixed Models (LMMs): These models account for within-subject correlation through random effects and are widely used for continuous omics features [21]. The basic LMM for an omics feature can be formulated as:
yᵢ = Xᵢβ + Zᵢbᵢ + εᵢ
where yᵢ represents measurements for the i-th subject, Xᵢ is the design matrix for fixed effects, Zᵢ is the design matrix for random effects, bᵢ represents subject-specific random effects, and εᵢ is Gaussian noise.
Generalized Linear Mixed Models (GLMMs): For non-Gaussian omics data (e.g., count data from sequencing), GLMMs extend LMMs through appropriate link functions [21].
Functional Data Analysis (FDA): These approaches model longitudinal trajectories as continuous functions, accommodating irregular sampling intervals [21].
Diversity-Aware Analytical Methods
Conventional genomic analysis methods may perform poorly in diverse or admixed populations. Specialized approaches include:
Local Ancestry Inference (LAI): Methods like RFMix, STRUCTURE, and LAMP infer the ancestral origin of chromosomal segments in admixed individuals, enabling more powerful association testing [15].
Ancestry-aware polygenic risk scores: New methods incorporate genetic ancestry to improve risk prediction across diverse populations, helping to address performance disparities [19].
Population-specific variant annotation: Databases like gnomAD provide population-specific allele frequency information that improves variant interpretation across diverse groups [1].
The following diagram illustrates the comprehensive workflow for longitudinal multi-omics studies, from cohort design to data integration:
Implementing Diversity in Research Practice: Beyond Recruitment
Community-Engaged Research Frameworks
Meaningful inclusion of historically excluded populations requires more than just recruitment strategies. A comprehensive community-based participatory research framework includes [1]:
- Identifying research questions relevant to community stakeholders
- Establishing diverse, cross-sector stakeholder teams
- Creating genomic infrastructure adaptable to community-centered research
- Collecting culture-sensitive data with stakeholder feedback mechanisms
- Utilizing research results to positively impact community health and policy
The development of diverse reference resources is essential for equitable multi-omics research:
Reference genomes: The origin of nearly three-fourths of the reference genome sequences from a single donor raises questions about applicability to diverse populations [1]. Efforts to develop pan-genome references that capture global genetic diversity are underway.
Variant databases: Resources like the Genome Aggregation Database (gnomAD) provide putatively benign variants across populations, serving as critical controls for variant interpretation [1]. However, continued expansion of diverse variant catalogs is needed.
Multi-omics reference materials: Projects like the Quartet Project provide reference materials from a family quartet, enabling quality control and data integration across omics technologies [20]. Expanding such resources to include diverse populations will enhance their utility.
Experimental Protocols and Reagent Solutions
Standardized Methodologies for Longitudinal Multi-Omic Studies
Table 2: Essential Research Reagents and Platforms for Multi-Omic Studies
| Reagent/Platform | Function | Application Notes |
|---|---|---|
| Quartet Reference Materials | Multi-omics quality control and data integration | Provides DNA, RNA, protein, and metabolites from matched samples; enables ratio-based profiling [20] |
| Multi-Ethnic Global Array (MEGA) | Genotyping in diverse populations | Improved coverage across diverse populations compared to earlier arrays [15] |
| LC-MS/MS Platforms | Proteomic and metabolomic profiling | Multiple platforms available; common reference materials improve cross-platform comparability [20] |
| Next-Generation Sequencing | Genomic, transcriptomic, epigenomic profiling | Consider coverage requirements in diverse populations; targeted enrichment may be needed for population-specific variants |
Protocol for Longitudinal Sample Processing
A standardized protocol for longitudinal multi-omics studies includes:
Sample collection: Use consistent collection methods across timepoints, stabilizing biomolecules immediately after collection [17].
Biomolecular extraction: Employ standardized kits and protocols to minimize batch effects. For microbiome studies, consider simultaneous extraction of DNA, RNA, and proteins [17].
Multi-omics data generation: Process samples from multiple timepoints in randomized batches to avoid confounding time effects with batch effects [20].
Quality control: Implement robust QC metrics at each step, using reference materials to monitor technical performance [20]. For quantitative omics, signal-to-noise ratio provides a useful QC metric.
Data processing: Apply reference-independent approaches when studying underrepresented populations or microbial communities without comprehensive references [17].
The following diagram illustrates the information flow in multi-omics studies and how diversity enhances discovery:
Longitudinal cohorts and population diversity are not merely desirable attributes but fundamental requirements for robust multi-omics research. The integration of these elements enables researchers to capture the dynamic nature of biological systems while ensuring that scientific discoveries benefit all populations. As precision medicine advances, continued attention to these foundational principles will be essential for realizing the full potential of multi-omics approaches to understand human health and disease.
Future directions should include: (1) expanded investment in diverse longitudinal cohorts, particularly in pediatric populations; (2) development of analytical methods that appropriately account for genetic ancestry and population structure; (3) implementation of community-engaged research frameworks that promote equitable partnerships; and (4) standardization of multi-omics technologies using diverse reference materials. Through coordinated efforts across these domains, the research community can ensure that multi-omics approaches fulfill their promise to transform healthcare for all populations.
From Data to Insights: Strategies and Real-World Applications in Drug Discovery
Multi-omics data integration has emerged as a cornerstone of modern precision medicine research, enabling a holistic understanding of biological systems by combining data from different biomolecular levels such as DNA, RNA, proteins, metabolites, and epigenetic marks [22]. This technical guide provides a comprehensive framework for multi-omics integration strategies, categorizing core methodologies into conceptual, statistical, and model-based approaches. We detail specific computational tools, experimental protocols, and visualization techniques essential for researchers and drug development professionals working to translate multi-omics data into clinically actionable insights. With the exponential growth in multi-omics publications—more than doubling between 2022 and 2023—mastering these integration strategies has become imperative for advancing biomarker discovery, identifying novel drug targets, and personalizing therapeutic interventions [23].
The fundamental premise of multi-omics integration lies in overcoming the limitations of single-omics studies, which provide valuable but incomplete insights into complex biological systems. By simultaneously analyzing data from genomics, transcriptomics, proteomics, metabolomics, and epigenomics, researchers can uncover the complex interactions and causal relationships that underlie health and disease states [22]. This integrated approach has proven particularly valuable in precision medicine, where understanding the interplay between different molecular layers enables better patient stratification, biomarker discovery, and therapeutic optimization.
The rapid advancement of high-throughput technologies has generated an explosion of complex multi-omics datasets, creating both unprecedented opportunities and significant computational challenges [24]. These challenges include data heterogeneity, high dimensionality, experimental noise, missing values, and the complex, often non-linear relationships between different omics layers [25]. Furthermore, the integration process is complicated by the fact that different omics data types exhibit unique scales, noise ratios, and preprocessing requirements, making a one-size-fits-all approach ineffective [25].
The Multi-Omics Workflow in Precision Medicine Research
The following diagram illustrates the generalized workflow for multi-omics data integration, from data generation through to biological interpretation in precision medicine contexts.
Core Multi-Omics Integration Approaches
Conceptual Integration Methods
Conceptual integration represents a knowledge-driven approach that leverages existing biological databases and ontologies to link different omics datasets based on shared concepts or entities such as genes, proteins, pathways, or diseases [22]. This method utilizes established biological relationships to generate hypotheses and explore associations between different omics datasets.
A common implementation of conceptual integration involves using gene ontology (GO) terms or pathway databases (e.g., KEGG, Reactome) to annotate and compare different omics datasets, identifying common or specific biological functions and processes [22]. For example, researchers might link differentially expressed genes from transcriptomics data with differentially abundant proteins from proteomics data through their shared pathway membership. Open-source pipelines such as STATegra and OmicsON have demonstrated enhanced capacity to detect specific features overlapping between compared omics sets [22].
Key Implementation Protocol:
- Data Annotation: Annotate each omics dataset using standardized biological ontologies (GO, KEGG, Reactome)
- Identifier Mapping: Convert molecule identifiers across platforms to enable cross-referencing
- Knowledge-Based Linking: Use pathway databases to establish connections between molecular entities
- Hypothesis Generation: Identify enriched biological processes or pathways that span multiple omics layers
Table 1: Knowledge Bases for Conceptual Integration
| Resource | Type | Application in Multi-Omics | Reference |
|---|---|---|---|
| Gene Ontology (GO) | Ontology | Functional annotation across omics layers | [22] |
| KEGG Pathways | Pathway Database | Pathway-based integration of molecules | [22] |
| Reactome | Pathway Database | Curated biological pathways | [22] |
| STRING | Protein-Protein Interactions | Physical and functional interactions | [22] |
Statistical Integration Methods
Statistical integration employs quantitative techniques to combine or compare different omics datasets based on statistical measures such as correlation, regression, clustering, or classification [22]. This data-driven approach identifies patterns, trends, and associations within and between omics datasets, though it may not inherently account for causal or mechanistic relationships.
Correlation analysis represents one of the most fundamental statistical integration approaches, identifying co-expressed genes or proteins across different omics datasets [22]. For example, researchers might calculate Pearson's or Spearman's correlation coefficients to assess the relationship between gene expression and protein abundance [26]. More advanced implementations include Weighted Gene Correlation Network Analysis (WGCNA), which identifies clusters (modules) of highly correlated genes across multiple omics datasets [26]. These modules can be summarized by their eigenmodes and linked to clinically relevant traits to identify functional relationships.
The xMWAS platform performs pairwise association analysis by combining Partial Least Squares (PLS) components and regression coefficients, then generates integrative network graphs where connections represent statistically significant associations [26]. Community detection algorithms can subsequently identify clusters of highly interconnected nodes within these networks.
Key Implementation Protocol:
- Data Normalization: Standardize each omics dataset to comparable scales
- Association Analysis: Calculate correlation matrices between features across omics layers
- Network Construction: Build association networks using correlation thresholds (e.g., R² > 0.8, p-value < 0.05)
- Module Detection: Apply community detection algorithms to identify densely connected subnetworks
- Clinical Integration: Correlate modules with phenotypic traits or clinical outcomes
Table 2: Statistical Integration Methods and Tools
| Method | Algorithm Type | Applications | Tools/Packages |
|---|---|---|---|
| Correlation Analysis | Pairwise Association | Identify co-expressed features | xMWAS [26] |
| WGCNA | Network-Based | Identify co-expression modules | WGCNA [26] |
| Canonical Correlation Analysis | Multivariate | Identify relationships between two omics sets | RGCCA [27] |
| Multi-Omics Factor Analysis | Factor Analysis | Decompose multi-omics data into latent factors | MOFA+ [25] |
Model-Based Integration
Model-based integration utilizes mathematical or computational models to simulate or predict the behavior of biological systems using multi-omics data [22]. This approach aims to capture the dynamics and regulation of biological systems, though it typically requires substantial prior knowledge and assumptions about system parameters and structure.
Network models represent a powerful approach for model-based integration, capturing interactions between genes, proteins, and metabolites across different omics datasets [22]. These models can range from simple protein-protein interaction networks to complex regulatory networks that incorporate transcription factors, epigenetic modifications, and metabolic constraints. Pharmacokinetic/pharmacodynamic (PK/PD) models represent another important application, describing the absorption, distribution, metabolism, and excretion (ADME) of drugs across different tissues or organs based on multi-omics profiles [22].
More recently, deep generative models such as variational autoencoders (VAEs) have emerged as powerful tools for model-based integration, capable of handling non-linear relationships, data imputation, joint embedding creation, and batch effect correction [24]. These methods can learn latent representations that capture the joint structure of multiple omics datasets while accommodating missing data and technical artifacts.
Key Implementation Protocol:
- Network Construction: Build biological networks using prior knowledge (e.g., protein-protein interactions)
- Data Mapping: Overlay multi-omics data onto network components
- Model Parameterization: Estimate model parameters using experimental data
- Simulation and Prediction: Simulate system behavior under different conditions or perturbations
- Experimental Validation: Design experiments to test model predictions (e.g., knockdowns, inhibitors)
Network and Pathway Integration
Network and pathway integration represents a hybrid approach that uses networks or pathways to represent the structure and function of biological systems based on different omics data [22]. Networks are graphical representations of nodes (e.g., genes, proteins) and their interactions, while pathways are collections of related biological processes that occur in specific contexts.
This approach enables the integration of multiple omics data types at different levels of granularity and complexity. For example, protein-protein interaction (PPI) networks can visualize physical interactions between proteins identified in proteomics data, while metabolic pathways can illustrate biochemical reactions involving metabolites identified through metabolomics [22]. Visualization tools such as the Cellular Overview in Pathway Tools enable simultaneous visualization of up to four types of omics data on organism-scale metabolic network diagrams, using different visual channels (e.g., color and thickness of reaction edges) to represent different omics datasets [28].
Key Implementation Protocol:
- Pathway Database Selection: Choose organism-specific or general pathway databases
- Multi-Omics Mapping: Map each omics dataset to relevant pathway components
- Visual Channel Assignment: Assign different omics types to distinct visual channels (color, thickness)
- Interactive Exploration: Use semantic zooming and filtering to explore integrated data at different scales
The following diagram illustrates the GAUDI (Group Aggregation via UMAP Data Integration) method, which represents an advanced non-linear approach for multi-omics integration that outperforms several state-of-the-art methods in capturing complex relationships [27].
Practical Implementation and Computational Tools
Tool Selection Framework
Selecting appropriate computational tools for multi-omics integration depends on multiple factors, including data types (matched vs. unmatched), sample size, biological question, and computational resources. The following table summarizes key integration tools and their characteristics.
Table 3: Multi-Omics Integration Tools and Applications
| Tool | Integration Type | Core Methodology | Data Types | Reference |
|---|---|---|---|---|
| MOFA+ | Matched/Vertical | Factor Analysis | mRNA, DNA methylation, chromatin accessibility | [25] |
| Seurat v4 | Matched/Vertical | Weighted Nearest-Neighbor | mRNA, spatial coordinates, protein, chromatin | [25] |
| GAUDI | Unmatched/Diagonal | UMAP Embeddings + Density Clustering | Genomics, transcriptomics, proteomics, metabolomics | [27] |
| GLUE | Unmatched/Diagonal | Graph Variational Autoencoder | Chromatin accessibility, DNA methylation, mRNA | [25] |
| intNMF | Unmatched/Diagonal | Non-negative Matrix Factorization | Multiple omics data types | [27] |
| SCHEMA | Matched/Vertical | Metric Learning | Chromatin accessibility, mRNA, proteins | [25] |
| Cobolt | Mosaic | Multimodal Variational Autoencoder | mRNA, chromatin accessibility | [25] |
| StabMap | Mosaic | Mosaic Data Integration | mRNA, chromatin accessibility | [25] |
Successful multi-omics integration requires both wet-lab reagents and computational resources. The following table details essential components of the multi-omics research toolkit.
Table 4: Essential Research Reagent Solutions for Multi-Omics Studies
| Resource Category | Specific Tools/Reagents | Function in Multi-Omics Pipeline |
|---|---|---|
| Sequencing Platforms | Illumina NovaSeq, PacBio | Generate genomics and transcriptomics data |
| Mass Spectrometry | LC-MS/MS Systems | Quantify proteins and metabolites |
| Single-Cell Multi-Omics | 10x Genomics Multiome | Simultaneous profiling of RNA and chromatin accessibility |
| Spatial Omics | Visium Spatial Technology | Integrate molecular data with spatial context |
| Bioinformatics Suites | Pathway Tools (PTools) | Metabolic reconstruction and multi-omics visualization |
| Reference Databases | gnomAD, ClinVar, KEGG | Variant interpretation and pathway mapping |
| Statistical Environments | R/Bioconductor, Python | Data preprocessing and statistical integration |
| Visualization Platforms | Cytoscape with plugins | Network-based integration and visualization |
Application in Precision Medicine Research
Biomarker Discovery and Validation
Multi-omics integration has revolutionized biomarker discovery by enabling the identification of molecular signatures that span multiple biological layers. Rather than relying on single biomarkers, integrated approaches can identify biomarker panels that provide higher specificity and predictive value for disease diagnosis, prognosis, and treatment response prediction [29].
For example, in oncology, multi-omics studies have identified combined biomarker signatures incorporating genomic mutations, gene expression patterns, protein abundances, and metabolic profiles that more accurately predict patient outcomes and treatment responses than single-omics biomarkers [29]. These integrated biomarkers can capture the complex interplay between different molecular mechanisms driving disease progression and therapeutic resistance.
Experimental Protocol for Multi-Omics Biomarker Discovery:
- Cohort Selection: Recruit patient cohorts with comprehensive clinical annotation
- Multi-Omics Profiling: Generate genomics, transcriptomics, proteomics, and/or metabolomics data
- Data Integration: Apply statistical or model-based integration methods
- Feature Selection: Identify discriminatory features across omics layers
- Model Building: Construct predictive models using machine learning algorithms
- Clinical Validation: Validate biomarkers in independent patient cohorts
Drug Target Identification and Validation
Multi-omics approaches significantly enhance drug target discovery by revealing the molecular networks underlying disease pathogenesis and identifying key nodes that can be therapeutically modulated [22]. Integrated analysis can prioritize drug targets based on their differential expression or regulation, network centrality, functional annotation, and known disease associations [22].
For instance, multi-omics studies of post-mortem brain samples have clarified the roles of risk-factor genes in complex diseases such as autism spectrum disorder (ASD) and Parkinson's disease, revealing novel molecular pathways and potential therapeutic targets [22]. By integrating genomic, transcriptomic, epigenomic, and proteomic data, researchers can distinguish causal drivers from secondary effects and identify targets with higher potential for therapeutic efficacy.
Experimental Protocol for Target Identification:
- Molecular Profiling: Generate multi-omics data from disease vs. control samples
- Network Construction: Build molecular interaction networks
- Target Prioritization: Rank potential targets using multi-omics evidence
- Experimental Validation: Perform knockdown, overexpression, or inhibitor experiments
- Mechanistic Studies: Investigate downstream effects of target modulation
Clinical Implementation Challenges and Solutions
Despite its tremendous potential, implementing multi-omics integration in clinical practice faces several challenges, including data heterogeneity, analytical complexity, reproducibility, and ethical considerations [23]. Technical challenges include the need for standardized protocols for sample collection, processing, and data generation to ensure reproducibility across studies and clinical sites.
Ethical challenges are equally significant, particularly regarding data privacy, informed consent, and equitable access to multi-omics-guided healthcare [23]. Emerging solutions include the use of blockchain technology for enhanced data security and federated learning approaches that enable analysis without sharing sensitive patient data [23].
Multi-omics data integration represents a transformative approach in precision medicine research, enabling a comprehensive understanding of biological systems that cannot be achieved through single-omics studies alone. The conceptual, statistical, and model-based integration strategies outlined in this guide provide researchers with a framework for extracting meaningful biological insights from complex multi-dimensional data.
As technologies continue to advance, multi-omics integration will increasingly power biomarker discovery, drug development, and clinical decision-making. However, realizing the full potential of these approaches will require continued methodological development, standardized protocols, and interdisciplinary collaboration between biologists, clinicians, computational scientists, and data analysts. The future of precision medicine will undoubtedly be shaped by our ability to effectively integrate and interpret information across multiple biological layers to deliver personalized healthcare solutions.
In the realm of precision medicine, multi-omics data integration has become indispensable for achieving a holistic understanding of disease mechanisms and developing personalized therapeutic strategies. The complexity of biological systems, encompassing genomics, transcriptomics, proteomics, metabolomics, and beyond, necessitates sophisticated computational approaches to unify these disparate data layers. Multi-omics integration methods fundamentally address the challenges of high-dimensionality, heterogeneity, and frequent missing values across data types [30]. Within this landscape, two distinct architectural paradigms have emerged: vertical (cross-omics) integration and horizontal (within-omics) integration [31] [20]. The choice between these paths profoundly influences the biological insights that can be gleaned, impacting critical applications from biomarker discovery to patient stratification. This technical guide examines the core principles, methodologies, and applications of vertical and horizontal integration, providing a framework for researchers and drug development professionals to select the optimal strategy for their multi-omics research objectives.
Demystifying Integration Pathways: Core Concepts and Definitions
Vertical Integration (Cross-Omics Integration)
Vertical integration, also termed cross-omics integration, involves linking distinct molecular layers (e.g., genome, epigenome, transcriptome, proteome, metabolome) derived from the same biological samples [31] [20]. This approach seeks to model the flow of biological information across different omics levels, effectively tracing the cascading effects from a genetic variant to a metabolite. For instance, vertical integration can connect a single nucleotide polymorphism (SNP) identified in genomic data with consequent changes in gene expression (transcriptomics), protein abundance (proteomics), and ultimately metabolic flux (metabolomics). The primary strength of this framework is its ability to uncover causal relationships and mechanistic insights within individuals or biological systems, making it exceptionally powerful for elucidating functional disease mechanisms and identifying master regulatory nodes for therapeutic intervention [31].
Horizontal Integration (Within-Omics Integration)
In contrast, horizontal integration, or within-omics integration, combines datasets of the same omics type generated across multiple batches, laboratories, studies, or cohorts [31] [20]. A classic example is the meta-analysis of genomic data from multiple independent studies to increase the statistical power for identifying disease-associated genetic loci. The main objective of horizontal integration is to strengthen reproducibility and generalizability across populations. This approach is crucial for large-scale consortium projects, such as TCGA/ICGC, where data generation is inherently distributed [30]. By mitigating batch effects and other unwanted technical variations, horizontal integration enables researchers to build robust, population-level conclusions and validate findings across diverse patient groups.
Table 1: Core Characteristics of Vertical and Horizontal Integration
| Feature | Vertical Integration | Horizontal Integration |
|---|---|---|
| Primary Goal | Uncover causal, mechanistic relationships across biological layers [31] | Enhance statistical power, reproducibility, and generalizability [31] [20] |
| Data Structure | Different omics types from the same biological samples [20] | Same omics type from multiple studies, batches, or cohorts [20] |
| Key Challenge | Handling different data structures, scales, and noise profiles across omics [30] | Correcting for batch effects and technical variability [20] |
| Typical Scale | Individual or system-level depth | Population-level breadth |
| Primary Application | Mechanistic modeling, biomarker pathway discovery, target validation [31] | Population genomics, biomarker validation, disease subtyping across cohorts [20] |
Methodological Approaches and Computational Strategies
A wide array of computational methods has been developed to tackle the distinct challenges posed by vertical and horizontal integration. These methods range from classical statistical models to advanced machine learning and deep learning architectures.
Methods for Vertical Integration
Vertical integration requires models capable of handling the heterogeneity of multi-modal data. A common strategy involves intermediate integration, where each omics dataset is first transformed into a lower-dimensional or comparable representation before being combined [3].
- Matrix Factorization techniques, such as Joint Non-Negative Matrix Factorization (jNMF), decompose multiple omics matrices into a shared basis matrix and omics-specific coefficient matrices, revealing shared patterns across data types [30]. The objective function for jNMF is formulated as minimizing the Frobenius norm of the difference between the original data and the product of the shared and specific matrices [30].
- Probabilistic Models like iCluster use a joint latent variable model to identify shared latent factors (e.g., cancer subtypes) from multi-omics data, while accounting for noise and uncertainty in the measurements [30].
- Deep Generative Models, particularly Variational Autoencoders (VAEs), have gained prominence for learning complex, non-linear relationships across omics layers. VAEs compress high-dimensional omics data into a unified, lower-dimensional "latent space" where integration occurs [30] [3]. They are especially useful for tasks like data imputation and denoising.
- Network-Based Methods construct biological networks (e.g., gene co-expression, protein-protein interaction) for each omics layer and then integrate these networks to reveal interconnected functional modules and regulatory mechanisms [30] [3].
Methods for Horizontal Integration
Horizontal integration focuses on removing non-biological technical variance to make datasets comparable.
- Batch Effect Correction: Tools like ComBat use empirical Bayes methods to adjust for batch effects, preserving biological signals while removing technical artifacts [3].
- Ratio-Based Profiling: A paradigm-shifting approach, as demonstrated by the Quartet Project, involves scaling the absolute feature values of a study sample relative to those of a concurrently measured common reference sample [20]. This method produces highly reproducible and comparable data across labs and platforms. The Quartet Project provides reference materials from a family quartet, offering built-in truth defined by Mendelian relationships and the central dogma [20].
- Similarity Network Fusion (SNF): This method constructs patient-similarity networks for each omics dataset and then iteratively fuses them into a single, combined network that reflects shared biology, which is also applicable to vertical integration [3].
A Practical Framework for Choosing the Right Path
The decision between vertical and horizontal integration is not mutually exclusive; the most powerful studies often employ elements of both. The choice should be driven by the primary research question.
When to Choose Vertical Integration
Opt for vertical integration when your research aims require a deep, mechanistic understanding of biological processes. Key scenarios include:
- Identifying Master Regulators: Uncovering key genes, proteins, or metabolites that drive a phenotypic outcome across multiple biological layers [31].
- Elucidating Causal Pathways: Tracing the flow of information from a genetic mutation to a functional outcome, thereby distinguishing causal drivers from passive correlations [31] [32].
- Biomarker Discovery & Validation: Discovering multi-omics biomarker panels that offer higher specificity and predictive power than single-omics biomarkers [29] [3]. Integrated omics can reveal complex molecular patterns long before symptoms manifest.
- Drug Target Identification: Pinpointing novel therapeutic targets by mapping the complex interplay of biological pathways involved in disease [5] [32].
When to Choose Horizontal Integration
Prioritize horizontal integration when the research objective demands broad, validated, and generalizable findings. It is essential for:
- Increasing Statistical Power: Combining genomic datasets from multiple cohorts to identify rare variants or subtle associations with complex diseases [20].
- Validating Biomarkers: Confirming the reliability of a diagnostic or prognostic signature across diverse populations and experimental conditions [20].
- Disease Subtyping: Identifying consistent molecular subtypes of a disease (e.g., cancer subtypes) that are reproducible across independent patient cohorts [30] [20].
- Quality Control and Proficiency Testing: Using reference materials and ratio-based profiling to assess the performance of different labs or platforms, ensuring data quality and comparability for downstream integration [20].
Table 2: Decision Matrix for Selecting an Integration Strategy
| Research Objective | Recommended Primary Strategy | Key Methodological Considerations |
|---|---|---|
| Understand mechanism of drug action | Vertical Integration | Use network-based methods or VAEs to model interactions from DNA to protein/metabolite. |
| Discover a diagnostic biomarker panel | Vertical Integration | Apply multi-omics factor analysis to find co-regulated features across layers. |
| Validate a genomic signature in a global cohort | Horizontal Integration | Implement ratio-based profiling with reference materials to harmonize data from multiple sites [20]. |
| Identify robust cancer subtypes | Both (Hybrid) | Use horizontal methods to merge cohorts, then vertical methods to find cross-omics subtypes. |
| Assess lab proficiency in a multi-omics study | Horizontal Integration | Utilize reference materials like the Quartet suites to evaluate data quality for each omics type [20]. |
Essential Tools and Protocols for Effective Integration
Successful multi-omics integration relies on a foundation of robust data management, reference materials, and analytical tools.
The Scientist's Toolkit: Research Reagent Solutions
Table 3: Key Resources for Multi-Omics Data Integration
| Resource | Function/Benefit | Example/Implementation |
|---|---|---|
| Quartet Reference Materials | Provides a built-in ground truth for QC and method validation. Enables ratio-based profiling [20]. | DNA, RNA, protein, and metabolites from immortalized cell lines of a family quartet (parents, monozygotic twins) [20]. |
| Laboratory Information Management System (LIMS) | Centralizes sample and data tracking, enforces metadata standardization, and ensures data provenance [31]. | A genomics LIMS tracks samples from collection through sequencing and analysis, ensuring FAIR (Findable, Accessible, Interoperable, Reusable) data principles [31]. |
| Batch Effect Correction Algorithms | Statistically removes technical variation introduced by different processing batches, labs, or platforms [3]. | Tools like ComBat or ratio-based scaling of data using a common reference sample [3] [20]. |
| AI/ML Platforms | Provides the computational power for advanced integration methods like VAEs and Graph Neural Networks [3] [31]. | Cloud-based platforms (e.g., Lifebit) offer scalable infrastructure and pre-built pipelines for multi-omics analysis [3]. |
Experimental Protocol: Ratio-Based Profiling for Enhanced Integration
The Quartet Project's ratio-based profiling protocol is a key methodology for improving both horizontal and vertical integration by addressing the irreproducibility of absolute quantification [20].
- Selection of Common Reference Material: A well-characterized reference material (e.g., one of the Quartet cell line derivatives, such as D6) is selected to be measured concurrently with all study samples across all batches and omics platforms [20].
- Concurrent Measurement: For each omics assay (WGS, RNA-seq, proteomics, etc.), the study samples and the common reference sample are processed and analyzed in the same experimental batch.
- Ratio Calculation: For each molecular feature (e.g., gene expression level, protein abundance), a ratio is calculated by dividing the absolute value measured in the study sample by the value measured in the common reference sample. This is done on a feature-by-feature basis.
- Data Integration: The resulting ratio-based measurements are used for all downstream integration analyses. These ratios are inherently normalized and more comparable, significantly reducing batch effects and enhancing the reliability of both horizontal comparisons across cohorts and vertical correlations across omics layers [20].
The path to unlocking the full potential of multi-omics data in precision medicine hinges on a strategic and deliberate approach to data integration. Vertical and horizontal integration are complementary paradigms, each designed to answer specific types of biological questions. Vertical integration provides the depth needed to deconstruct disease mechanisms and identify causal pathways, while horizontal integration offers the breadth required to ensure that findings are robust, reproducible, and applicable across diverse populations. The emerging use of reference materials, such as those from the Quartet Project, and advanced AI-driven analytical methods is bridging these two worlds, enabling hybrid frameworks that are both mechanistically insightful and broadly generalizable. For researchers and drug developers, the critical first step is to align the integration strategy with the fundamental research objective. By doing so, the immense complexity of multi-omics data can be transformed into clear, actionable insights that accelerate the development of personalized therapies and improve patient outcomes.
AI and Machine Learning as Catalysts for Multi-Omics Analysis
The progression towards precision medicine necessitates a shift from examining biological systems through a single lens to a holistic, multi-scale perspective. Multi-omics—the integrated analysis of genomics, transcriptomics, proteomics, epigenomics, and metabolomics—aims to provide this comprehensive view. However, the high-dimensionality, heterogeneity, and sheer volume of data generated by modern omics technologies present a formidable analytical challenge [3]. Artificial intelligence (AI), particularly machine learning (ML) and deep learning (DL), has emerged as the critical catalyst capable of bridging this gap, transforming disparate data layers into clinically actionable insights for diseases like cancer and cardiovascular conditions [33] [34]. These technologies enable the scalable, non-linear integration required to model complex biological systems, thereby accelerating the discovery of biomarkers, refining disease subtyping, and ultimately paving the way for personalized therapeutic strategies [33] [35] [1]. This technical guide explores the core AI methodologies, implementation protocols, and practical tools that are driving the integration of multi-omics data forward.
AI and Multi-Omics Integration: Core Methodological Approaches
The integration of multi-omics data using AI can be categorized based on the stage at which data fusion occurs. Each strategy offers distinct advantages and is suited to different biological questions and data structures.
Integration Strategies and Their Underlying Architectures
The choice of integration strategy is fundamental to the model's design and capabilities. The three primary approaches are detailed below.
Table 1: Multi-Omics Integration Strategies in Machine Learning
| Integration Strategy | Timing of Fusion | Key Advantages | Inherent Challenges |
|---|---|---|---|
| Early Integration | Before analysis [3] | Captures all potential cross-omics interactions; preserves raw information [3] | Extremely high dimensionality; computationally intensive; prone to overfitting [3] |
| Intermediate Integration | During analysis/feature change [3] | Reduces complexity; incorporates biological context through networks [3] | Requires domain knowledge for transformation; may lose some raw information [3] |
| Late Integration | After individual analysis [3] | Handles missing data robustly; computationally efficient; leverages ensemble benefits [3] | May miss subtle, non-linear cross-omics interactions not captured by single-omics models [3] |
Key Machine Learning and Deep Learning Techniques
A suite of AI algorithms has been adapted and developed to tackle the unique challenges of multi-omics data.
- Deep Learning Architectures: Autoencoders (AEs) and Variational Autoencoders (VAEs) are unsupervised neural networks that compress high-dimensional omics data into a dense, lower-dimensional "latent space," making integration computationally feasible while preserving biological patterns [3]. Graph Convolutional Networks (GCNs) are designed for network-structured data, learning from biological networks where molecules are nodes and their interactions are edges [33] [3]. Transformers, with their self-attention mechanisms, adapt to biological data by weighing the importance of different features and data types, identifying critical biomarkers from noisy datasets [33] [3].
- Traditional and Specialized ML Methods: Similarity Network Fusion (SNF) creates and fuses patient-similarity networks from each omics layer, strengthening robust similarities for accurate disease subtyping [3]. Random Forest (RF) and Support Vector Machines (SVM) remain powerful for supervised learning tasks, often serving as robust benchmarks against which more complex DL models are compared [34] [36].
Quantitative Performance and Experimental Validation
Robust validation is paramount for translating AI-driven multi-omics models into clinical practice. The following table and protocol summarize performance metrics and a standard validation workflow.
Table 2: Performance Benchmarks of AI-Driven Multi-Omics Models in Precision Oncology
| Model / Tool | Primary Task | Omics Data Used | Reported Performance | Key Application |
|---|---|---|---|---|
| AI-driven multi-omics classifiers [33] | Early detection | Multi-omics (genomics, transcriptomics, proteomics, metabolomics, radiomics) | AUC: 0.81 - 0.87 | Early cancer detection |
| Flexynesis (Deep Learning) [36] | MSI status classification | Gene expression, promoter methylation | AUC = 0.981 | Predicting microsatellite instability in cancer |
| Flexynesis (Deep Learning) [36] | Drug response prediction | Gene expression, copy-number variation | High correlation on external dataset (GDSC2) | Predicting sensitivity to Lapatinib and Selumetinib |
| Graph Convolutional Networks (GCNs) [3] | Clinical outcome prediction | Multi-omics integrated on biological networks | Effective for risk stratification | Neuroblastoma and other conditions |
Detailed Experimental Protocol for Multi-Omics Integration
The following workflow, derived from established tools and publications [34] [37] [36], outlines a generalized protocol for developing a predictive multi-omics model.
Data Acquisition and Curation:
- Data Sources: Utilize large-scale consortia data like The Cancer Genome Atlas (TCGA) or the Cancer Cell Line Encyclopedia (CCLE) [37] [36].
- Curation: Collect matched sample data across multiple omics layers (e.g., genomics, transcriptomics) along with associated clinical annotations (e.g., disease subtype, survival data, drug response) [37].
Preprocessing and Quality Control:
- Normalization: Apply platform-specific normalization (e.g., TPM/FPKM for RNA-seq, intensity normalization for proteomics) to make data comparable across samples and batches [3].
- Batch Effect Correction: Employ statistical methods like ComBat to remove technical variation introduced by different processing dates, reagents, or platforms [3].
- Data Imputation: Address missing data points using robust imputation methods such as k-nearest neighbors (k-NN) or matrix factorization [3].
Model Training and Validation:
- Data Splitting: Partition the dataset into training (~70%), validation (~15%), and hold-out test (~15%) sets, ensuring representative distribution of key clinical variables in each set [36].
- Model Selection: Choose an appropriate architecture (e.g., Autoencoder for dimensionality reduction, GCN for network data, Random Forest for tabular data) based on the data structure and biological question [36] [3].
- Hyperparameter Tuning: Optimize model parameters (e.g., learning rate, number of layers, tree depth) using the validation set to prevent overfitting [36].
- External Validation: Assess the final model's generalizability by evaluating its performance on a completely independent external dataset (e.g., training on CCLE and testing on GDSC2 for drug response) [36].
Successful implementation of AI-driven multi-omics analysis relies on a suite of computational tools, databases, and reagents.
Table 3: Research Reagent Solutions for AI-Driven Multi-Omics Analysis
| Tool / Resource | Type | Primary Function | Key Features / Components |
|---|---|---|---|
| Flexynesis [36] | Deep Learning Toolkit | Bulk multi-omics integration for precision oncology | Modular architectures (fully connected, GCN); supports single/multi-task learning for classification, regression, survival; hyperparameter tuning |
| MiBiOmics [37] | Web Application | Interactive multi-omics exploration and integration | Implements WGCNA, ordination techniques (PCA, PCoA), Procrustes analysis; intuitive interface for non-programmers |
| MOGONET [38] | Deep Learning Framework | Biomedical classification using multi-omics data | Graph Convolutional Networks (GCNs) for analyzing view-specific biological networks |
| Olink & Somalogic Proteomics [34] | Proteomics Platform | High-throughput protein quantification | Identifies up to 5,000 analytes; provides high-dimensional data for integration |
| GraphOmics [38] | Data Exploration Platform | Interactive workflow for multi-omics integration | Supports hypothesis generation via correlation analysis and visual exploration of longitudinal data |
| TCGA, CCLE, gnomAD [37] [1] [36] | Data Repository | Source of curated multi-omics and variant data | Large-scale, clinically annotated datasets essential for training and validating models |
Applications and Future Directions in Precision Medicine
The integration of AI and multi-omics is already yielding significant advances in clinical and research settings. Key applications include:
- Precision Oncology: AI-driven multi-omics models are being used for early cancer detection, with integrated classifiers achieving AUCs of 0.81-0.87 in difficult early-detection tasks [33]. They also improve therapy selection by predicting resistance to targeted therapies and enable non-invasive diagnostics through radiogenomic integration [33].
- Cardiovascular Disease (CVD) Research: ML models integrate various omics data to explore the underlying mechanisms of CVDs, enhance the prediction of disease progression, and improve clinical interpretation for prevention, diagnosis, and treatment [34].
- Biomarker Discovery: By identifying complex molecular patterns across omics layers, AI facilitates the discovery of novel diagnostic, prognostic, and predictive biomarkers, even from blood-based liquid biopsies [3].
Future developments are poised to further transform the field. Explainable AI (XAI) is critical for enhancing the transparency and interpretability of complex models, thereby building clinical trust [33]. Federated learning paradigms allow for privacy-preserving collaboration by training models across decentralized datasets without sharing sensitive patient data [33]. Furthermore, the rise of single-cell and spatial omics technologies provides unprecedented resolution for decoding the tumor microenvironment and cellular heterogeneity, while generative AI and multi-scale modeling offer potential for predicting the consequences of novel genetic and chemical perturbations [33] [35].
Precision medicine represents a transformative healthcare model that leverages an individual’s genomic, environmental, and lifestyle data to deliver customized healthcare [1]. This approach enables a paradigm shift from conventional, reactive disease control to proactive disease prevention and health preservation. The foundation of this transformation lies in the integration of multi-omics technologies—combining data from genomics, transcriptomics, proteomics, epigenomics, metabolomics, and microbiomics to construct a comprehensive understanding of human health and disease [1] [39].
Integrative multi-omics has become feasible through phenomenal advancements in bioinformatics, data sciences, and artificial intelligence [1]. This integrated approach helps researchers and clinicians understand heterogeneous etiopathogenesis of complex diseases, create frameworks for precision medicine, break down overlapping disease spectrums into definitive subtypes, and develop targeted therapies [1]. This technical guide explores specific applications of multi-omics integration in three key disease areas: cancer, inflammatory bowel disease, and neurodegenerative disorders, providing methodological insights and practical frameworks for research and drug development professionals.
Multi-Omics Data Types and Repositories
Multi-omics data encompasses information generated from multiple biological layers, each providing complementary insights into disease mechanisms. The primary omics disciplines include:
- Genomics: DNA-level variations and mutations that provide the foundational genetic blueprint [3]
- Transcriptomics: RNA expression patterns revealing actively regulated genes [3]
- Proteomics: Protein abundance and modifications reflecting functional cellular states [3]
- Epigenomics: DNA methylation and histone modifications regulating gene expression [1]
- Metabolomics: Small molecule metabolites representing downstream physiological outputs [3]
- Microbiomics: Commensal microbial communities influencing host physiology and disease [40]
Public Data Repositories for Multi-Omics Research
Several large-scale consortia provide comprehensive multi-omics datasets that researchers can leverage for disease subtyping and biomarker discovery.
Table 1: Major Public Repositories for Multi-Omics Data
| Repository | Disease Focus | Data Types Available | Research Applications |
|---|---|---|---|
| The Cancer Genome Atlas (TCGA) | Cancer (33+ types) | RNA-Seq, DNA-Seq, miRNA-Seq, SNV, CNV, DNA methylation, RPPA [39] | Pan-cancer analysis, biomarker discovery, molecular subtyping |
| International Cancer Genomics Consortium (ICGC) | Cancer (76 projects) | Whole genome sequencing, somatic and germline mutations [39] | Cataloging genomic alterations across cancer types and ethnicities |
| Clinical Proteomic Tumor Analysis Consortium (CPTAC) | Cancer | Proteomics data corresponding to TCGA cohorts [39] | Protein-level validation of genomic findings |
| TARGET | Pediatric cancers | Gene expression, miRNA expression, copy number, sequencing data [39] | Understanding molecular drivers of childhood cancers |
| Gene Expression Omnibus (GEO) | Multiple diseases | Transcriptomics datasets from various technologies [41] | Validation across independent cohorts, meta-analyses |
Technical Framework for Multi-Omics Integration
Data Preprocessing and Harmonization
The critical first step in multi-omics integration involves standardizing raw data to ensure compatibility across different technologies and platforms [42]. This process includes:
- Normalization: Accounting for differences in sample size, concentration, and technical variability using methods such as TPM and FPKM for RNA-seq data [3]
- Batch Effect Correction: Removing systematic technical variations using tools like ComBat [3]
- Missing Data Imputation: Estimating missing values using k-nearest neighbors (k-NN) or matrix factorization methods [3]
- Quality Control: Filtering outliers and low-quality data points to ensure analytical robustness [42]
Integration Strategies and Computational Approaches
Researchers typically employ three main strategies for integrating multi-omics data, each with distinct advantages and challenges.
Table 2: Multi-Omics Data Integration Strategies
| Integration Strategy | Timing of Integration | Key Advantages | Common Methods |
|---|---|---|---|
| Early Integration | Before analysis | Captures all cross-omics interactions; preserves raw information [3] | Data concatenation, matrix factorization |
| Intermediate Integration | During feature transformation | Reduces complexity; incorporates biological context [3] | Similarity Network Fusion (SNF), autoencoders |
| Late Integration | After individual analysis | Handles missing data well; computationally efficient [3] | Ensemble methods, model stacking |
AI and Machine Learning for Multi-Omics Analysis
Artificial intelligence approaches are essential for detecting complex patterns across high-dimensional multi-omics datasets:
- Autoencoders and Variational Autoencoders: Unsupervised neural networks that compress high-dimensional omics data into lower-dimensional "latent space" representations [3]
- Graph Convolutional Networks (GCNs): Designed for network-structured biological data, representing genes and proteins as nodes and their interactions as edges [3]
- Similarity Network Fusion (SNF): Creates patient-similarity networks from each omics layer and iteratively fuses them into a single comprehensive network [3]
- Recurrent Neural Networks (RNNs): Analyze longitudinal data to model temporal changes in biological systems [3]
- Transformers: Utilize self-attention mechanisms to weigh the importance of different features and data types [3]
Figure 1: Comprehensive Workflow for Multi-Omics Data Integration and Analysis
Cancer Subtyping Application: Breast Cancer
Gut Microbiome-Informed Molecular Subtyping
A 2024 study published in Molecular Cancer demonstrated a novel multi-omics approach for breast cancer subtyping based on commensal microbiome profiles [40]. This research analyzed gut microbiota data from 350 breast cancer specimens and 308 normal samples, identifying conserved metabolic pathways shared across breast, colorectal, and gastric cancers despite different microbial compositions [40].
Experimental Protocol:
- Microbiome Profiling: 16S rRNA sequencing of patient stool samples to characterize gut microbiota composition [40]
- Metabolic Pathway Analysis: PICRUSt software identified 36 differentially enriched KEGG pathways shared across cancer types [40]
- Multi-Omics Integration: Integrated TCGA-BRCA gene expression data with microbiome-related metabolic pathways [40]
- Unsupervised Clustering: k-means clustering applied to 700 genes associated with gut microbiota-related pathways and patient survival [40]
Identification of "Challenging BC" Subtype
The analysis revealed four distinct breast cancer clusters, with Cluster 2 designated "challenging BC" due to its complex molecular characteristics [40]:
Table 3: Characteristics of Multi-Omics Breast Cancer Subtypes
| Cluster | Key Molecular Features | Prognosis | Tumor Mutation Burden | Immune Microenvironment |
|---|---|---|---|---|
| Cluster 1 | Enriched in immune-related pathways | Poorest | High | Complex |
| Cluster 2 ("Challenging BC") | All PAM50 subtypes, significant TNBC enrichment | Intermediate | Highest | Most complex |
| Cluster 3 | Predominantly LumA and LumB subtypes | Good | Low | Less complex |
| Cluster 4 | Primarily LumA subtype | Best | Lowest | Least complex |
The "challenging BC" subtype showed activation of TPK1-FOXP3-mediated Hedgehog signaling and TPK1-ITGAE-mediated mTOR signaling pathways, validated in patient-derived xenograft models [40]. This subtyping system effectively predicted responses to neoadjuvant therapy regimens, with score indices significantly negatively correlated with treatment efficacy and immune cell infiltration [40].
Figure 2: Breast Cancer Subtyping Workflow Based on Gut Microbiome and Multi-Omics Data
Inflammatory Bowel Disease Subtyping
Transcriptomic Subtyping Across UC and CD
A 2025 study analyzed RNA-seq data from intestinal biopsies of 2,490 adult IBD patients to identify molecular subtypes across both ulcerative colitis and Crohn's disease [41]. This large-scale analysis addressed limitations of previous studies that focused on single disease types or small datasets.
Experimental Protocol:
- Dataset Collection: Four prospective cross-sectional cohorts from GEO (GSE193677, GSE186507, GSE137344, GSE235236) [41]
- Data Preprocessing: Filtered raw counts data, removed low-count samples, normalized using calcNormFactors function with voom transformation [41]
- Differential Expression: Linear model fitting with empirical Bayes moderation, Benjamini-Hochberg correction (FDR <0.001) [41]
- Unsupervised Clustering: k-means clustering applied independently to UC and CD samples [41]
- Functional Enrichment: Gene set enrichment and network analyses to explore molecular characteristics [41]
- Clinical Correlation: Chi-square and ANOVA tests to assess associations with disease severity and anatomical involvement [41]
Distinct Molecular Subtypes and Clinical Correlations
The analysis revealed three distinct transcriptomic subtypes in both UC and CD with specific molecular signatures:
Table 4: Transcriptomic Subtypes in Inflammatory Bowel Disease
| Disease | Cluster | Molecular Signature | Enriched Pathways | Clinical Correlation |
|---|---|---|---|---|
| Ulcerative Colitis | Cluster 1 | RNA processing, DNA repair | Nucleic acid metabolism | Inactive or mild disease |
| Cluster 2 | Autophagy, stress responses | ATG13, VPS37C, DVL2 | Variable severity | |
| Cluster 3 | Cytoskeletal organization | SRF, SRC, ABL1 | Moderate-to-severe endoscopic activity | |
| Crohn's Disease | Cluster 1 | Cytoskeletal remodeling, suppressed protein synthesis | CFL1, F11R, RAD23A | Inactive or mild disease |
| Cluster 2 | Stress and translation pathways | Protein folding, translation initiation | Variable severity | |
| Cluster 3 | Cytoskeletal structure over metabolic activity | Cytoskeletal organization | Moderate-to-severe endoscopic activity |
Cluster 3 in both conditions was significantly associated with moderate-to-severe endoscopic activity, while Cluster 1 was enriched in inactive or mild disease [41]. These findings support a stratified approach to IBD diagnosis and therapy, enabling more personalized disease management strategies.
Neurodegenerative Disease Application: Glioma
Multi-Omics Integration for Glioma Classification
A 2025 review in Annals of Clinical and Translational Neurology highlighted how multi-omics integration advances precision medicine for gliomas, which are among the most malignant and aggressive central nervous system tumors [13]. The integration of multiple omics layers provides a comprehensive framework that enhances diagnostic precision, prognostic accuracy, and treatment efficacy.
Multi-Omics Layers for Glioma Classification:
- Genomics: Somatic mutations (IDH1/2, ATRX, TERT promoter), copy number alterations [13]
- Transcriptomics: Gene expression signatures, sex-dependent differential expression patterns [13]
- Epigenomics: DNA methylation profiling for molecular classification [13]
- Proteomics: Protein signaling pathway activation states [13]
- Metabolomics: Metabolic reprogramming characteristics [13]
- Radiomics: Quantitative features extracted from medical images [13]
- Single-cell and Spatial Omics: Cellular heterogeneity and spatial organization within tumors [13]
Machine Learning for Glioma Subtyping
The combination of multilayer data with machine-learning-based algorithms enables advancements in patient prognosis and personalized therapeutic interventions [13]. The WHO 2021 classification of central nervous system tumors incorporates molecular features alongside histology, requiring integrated analysis approaches for accurate diagnosis and treatment planning [13].
The Scientist's Toolkit: Essential Research Reagents and Materials
Table 5: Essential Research Reagents and Platforms for Multi-Omics Studies
| Reagent/Platform | Function | Application Examples |
|---|---|---|
| Next-generation Sequencing (NGS) | High-throughput DNA/RNA sequencing | Whole genome, exome, transcriptome sequencing [1] |
| ApoStream Technology | Isolation of circulating tumor cells from liquid biopsies | Patient selection for targeted therapies in NSCLC [5] |
| Spectral Flow Cytometry | Analysis of 60+ cellular markers simultaneously | Immune cell profiling, biomarker discovery [5] |
| PICRUSt Software | Prediction of metagenomic functions from 16S rRNA data | Inferring metabolic pathways from microbiome data [40] |
| INTEGRATE (Python) | Multi-omics data integration tool | Combining different omics data types [42] |
| mixOmics (R) | Multivariate analysis of multi-omics data | Dimension reduction, integration, visualization [42] |
| Similarity Network Fusion (SNF) | Integrative clustering across multiple data types | Disease subtyping using multi-omics data [3] |
| TCGA2BED | Standardized TCGA data in BED format | Integrating DNA methylation and RNA-seq data [42] |
The integration of multi-omics data represents a powerful approach for advancing precision medicine across diverse disease areas, including cancer, inflammatory bowel disease, and neurodegenerative disorders. By combining molecular data from multiple biological layers—genomics, transcriptomics, proteomics, epigenomics, metabolomics, and microbiomics—researchers can identify novel disease subtypes, uncover underlying mechanisms, and develop more targeted therapeutic strategies.
The successful implementation of multi-omics approaches requires careful attention to data preprocessing, appropriate selection of integration strategies, and application of advanced machine learning methods. As these technologies continue to evolve and datasets expand, multi-omics integration will play an increasingly central role in translating complex biological data into clinically actionable insights for personalized patient care.
Navigating the Chaos: Overcoming Data Heterogeneity and Analytical Hurdles
In the era of precision medicine, multi-omics approaches have revolutionized biomedical research by providing a more comprehensive understanding of biological systems and disease mechanisms. The integration of diverse molecular data types—including genomics, transcriptomics, epigenomics, proteomics, and metabolomics—enables researchers to model complex mechanisms of cancer progression and other diseases for individual patients [43] [44] [39]. However, this integrative approach faces three fundamental computational challenges that hinder its full potential: data heterogeneity, missing values, and the High-Dimensional Low-Sample-Size (HDLSS) problem. Data heterogeneity arises from combining fundamentally different types of omics measurements with varying scales, distributions, and biological meanings. Missing values plague multi-omics datasets due to technical limitations, cost constraints, and sample quality issues, with some proteomics studies reporting 20-50% missing values [45]. Meanwhile, the HDLSS problem—where the number of features dramatically exceeds the number of samples—creates significant statistical challenges including overfitting, noise accumulation, and the curse of dimensionality [46] [47]. This technical guide examines these interconnected challenges within the context of precision medicine research and provides strategic solutions to enable more robust multi-omics analyses.
Understanding Data Heterogeneity in Multi-Omics Integration
The Nature of Multi-Omics Data Heterogeneity
Multi-omics data heterogeneity manifests at multiple levels, creating substantial barriers to effective integration. Each omics layer provides unique information about a specific level of biological organization, from DNA variations in genomics to metabolic products in metabolomics [44] [39]. This fundamental diversity results in data types with different statistical properties, measurement scales, and noise characteristics. For instance, genomic data is often categorical (e.g., mutations), while transcriptomic and proteomic data are typically continuous with different dynamic ranges. The absence of common standards across different omics platforms further exacerbates interoperability challenges [47].
The biological system itself functions through complex interactions between various omics layers, requiring integration methods that can capture non-linear relationships and hierarchical dependencies [45] [44]. As precision medicine advances, researchers increasingly recognize that analyzing only one omics data type provides limited, correlative insights, whereas integrating different omics data types can help elucidate potential causative changes that drive disease progression and identify potential therapeutic targets [44].
Technical Solutions for Heterogeneous Data Integration
Deep Learning-Based Integration: Deep learning (DL) algorithms have emerged as powerful tools for heterogeneous multi-omics data integration due to their capability to automatically capture nonlinear and hierarchical representative features through multi-layered neural network architectures [44]. Unlike conventional machine learning methods that require predefined kernel functions to handle nonlinearity, DL models learn optimal representations directly from data using multiple activation functions arranged in hierarchical layers. This approach mirrors the hierarchical organization of biological systems, where DNA is transcribed to mRNA, which is then translated into protein [44].
Multiple Factor Analysis (MFA): MFA provides a statistical framework for simultaneous exploration of multiple data tables where the same individuals are described by several sets of variables [48]. The core of MFA involves a principal component analysis (PCA) in which weights are assigned to variables to balance the influence of each table. Specifically, the matrix of variance-covariance associated with each data table Kⱼ is decomposed by PCA and its largest eigenvalue (λ₁ⱼ) is derived. Each variable belonging to Kⱼ is then weighted by 1/√(λ₁ⱼ), preventing any single table from dominating the global analysis [48].
Network-Based Integration: Weighted Gene Correlation Network Analysis (WGCNA) enables the construction of omics-specific networks where highly correlated features are grouped into modules [37]. These modules can then be correlated across omics layers and linked to clinical parameters or phenotypic traits. This approach reduces dimensionality while preserving biologically relevant patterns. Tools like MiBiOmics implement multi-WGCNA, which efficiently detects robust associations across omics layers by reducing the dimensionality of each omics dataset to increase statistical power [37].
Table 1: Multi-Omics Data Types and Their Characteristics in Precision Medicine
| Omics Layer | Biological Meaning | Data Characteristics | Common Technologies |
|---|---|---|---|
| Genomics | Complete set of genes and genetic variants | Categorical (mutations), continuous (CNV) | DNA-Seq, microarrays |
| Transcriptomics | RNA expression levels | Continuous, compositional | RNA-Seq, microarrays |
| Epigenomics | Genome-wide modifications affecting gene expression | Continuous, ratio-based | ChIP-Seq, bisulfite sequencing |
| Proteomics | Protein abundance and modifications | Continuous, often sparse | Mass spectrometry, RPPA |
| Metabolomics | Metabolic state and small molecules | Continuous, compositional | Mass spectrometry, NMR |
Addressing the Missing Data Challenge
Classification and Impact of Missing Data
Missing data represents a pervasive challenge in multi-omics studies, with the proportion and patterns of missingness varying across different omics technologies. In mass spectrometry-based proteomics, it is not uncommon to have 20-50% of possible peptide values not quantified [45]. The mechanisms generating missing values fall into three classifications established by Rubin (1976): Missing Completely at Random (MCAR), Missing at Random (MAR), and Missing Not at Random (MNAR) [45] [48].
MCAR occurs when the probability of missingness is independent of both observed and unobserved data, such as technical failures or sample processing errors. MAR describes situations where missingness depends on observed variables but not on unobserved measurements. MNAR represents the most challenging scenario where the probability of missingness depends on the unobserved values themselves, such as measurements below the detection limit of instruments [45]. The classification of missing data mechanisms is crucial because it determines which statistical methods are appropriate for handling the missingness.
Methodological Approaches for Handling Missing Data
Multiple Imputation in Multiple Factor Analysis (MI-MFA): This approach addresses the specific challenge of missing rows in multi-omics data integration, where some individuals are not present in all data tables [48]. MI-MFA employs multiple imputation to generate plausible synthetic data values for missing entries, creating M completed datasets. MFA is then applied to each completed dataset, producing M different configurations of individual coordinates. These configurations are combined to yield a single consensus solution that accounts for the uncertainty introduced by missing values. The method uses hot-deck imputation—a nonparametric approach that can handle data tables with large numbers of variables, overcoming limitations of parametric joint modeling and fully conditional specification methods when dealing with high-dimensional omics data [48].
Regularized Iterative MFA (RI-MFA): As an alternative to MI-MFA, this method alternates between estimating MFA axes and components and estimating missing values through an iterative regularization procedure [48]. The approach is derived from similar methods used in principal component analysis and can handle ignorable missing data mechanisms (MCAR and MAR).
Deep Learning with Embedded Handling: Advanced deep learning architectures can be designed to naturally accommodate missing values without requiring explicit imputation as a preprocessing step. Some models incorporate mechanisms for handling partially observed samples directly within their network structure, though this remains an active research area [45] [44].
Diagram 1: Missing Data Handling Workflow (76 characters)
Table 2: Experimental Protocols for Handling Missing Data in Multi-Omics Studies
| Protocol Step | Methodology | Key Parameters | Quality Assessment |
|---|---|---|---|
| Missing Data Assessment | Evaluate pattern and mechanism of missingness | Percentage missing per sample/feature, tests for MCAR | Patterns of missingness across sample groups |
| Imputation Method Selection | Choose based on data type and missingness mechanism | MI-MFA for missing rows, DL for embedded handling | Imputation accuracy via cross-validation |
| Integration Analysis | Apply selected integration method | MFA parameters, network inference parameters | Stability of integration across imputations |
| Uncertainty Quantification | Assess impact of missing data on results | Confidence ellipses, convex hull areas [48] | Variation in key findings across imputations |
Navigating the HDLSS Problem in Multi-Omics Research
Understanding the HDLSS Challenge
The High-Dimensional Low-Sample-Size (HDLSS) problem occurs when the number of features (dimensions) far exceeds the number of available samples, creating significant statistical challenges for multi-omics research [46] [47]. In oncology studies, for example, researchers might have complete multi-omics profiles for only hundreds of patients while measuring tens of thousands of molecular features including gene expressions, protein abundances, and metabolic concentrations [43]. This dimensionality mismatch leads to several analytical challenges: the curse of dimensionality with distance collapse in high-dimensional spaces, overfitting of machine learning models, noise accumulation, and high-variance gradients in neural network training [46].
The HDLSS setting is particularly problematic in precision medicine applications where the goal is to develop predictive models for patient stratification or treatment response. Traditional statistical methods and machine learning algorithms often fail to generalize well in this context, producing models that appear to perform excellently on training data but fail to validate on independent datasets [46] [47].
Multi-View Learning as a Solution to HDLSS
Multi-View Mid-Fusion Framework: This innovative approach addresses the HDLSS problem by splitting high-dimensional feature vectors into smaller subsets called views, then applying multi-view learning techniques that leverage the inherent redundancy and structure in omics data [46]. The methodology involves partitioning the feature index set ℐ = {1,2,...,d} into V disjoint subsets, where ℐ = ∪ᵥℐᵥ and ℐᵥ ∩ ℐᵤ = ∅ for v ≠ u. Each sample xₖ is then represented by V feature vectors xₖ[ᵛ] ∈ ℝdᵥ where d₁ + ... + dᵥ = d [46].
Feature Set Partitioning Strategies: Three primary methods exist for creating views from high-dimensional data:
- Random Partitioning: Features are randomly assigned to views, providing a baseline approach.
- Domain Knowledge Partitioning: Features are grouped based on prior biological knowledge (e.g., grouping by pathways or biological processes).
- Correlation-Based Partitioning: Features are clustered according to their correlation patterns, creating views with internal coherence [46].
Mid-Fusion Integration: Unlike early fusion (concatenating all features before analysis) or late fusion (analyzing views separately then combining results), mid-fusion methods learn joint representations from multiple views during the analysis process. These approaches have demonstrated superior performance in HDLSS settings compared to traditional single-view methods and other fusion strategies [46].
Diagram 2: HDLSS Multi-View Solution (43 characters)
Integrated Workflows and Experimental Protocols
Comprehensive Multi-Omics Integration Pipeline
Successfully addressing the triple challenge of heterogeneity, missing data, and HDLSS requires a structured workflow that incorporates solutions for each problem in a coordinated manner. The following integrated protocol outlines a robust approach for multi-omics data analysis in precision medicine research:
Stage 1: Data Preprocessing and Quality Control
- Perform individual quality assessment for each omics dataset
- Apply appropriate normalization techniques specific to each data type
- Identify and handle technical artifacts and batch effects
- Conduct initial missing data assessment and mechanism evaluation
Stage 2: View Construction and Missing Data Handling
- Implement feature set partitioning to address HDLSS problem
- Apply MI-MFA or RI-MFA for handling missing rows across omics tables
- Validate imputation quality through cross-validation procedures
- Assess view quality and coherence based on partitioning strategy
Stage 3: Multi-View Integration and Analysis
- Apply mid-fusion multi-view learning algorithms
- Construct multi-omics networks using approaches like multi-WGCNA
- Identify cross-omics modules and their associations with clinical phenotypes
- Validate integration robustness through resampling techniques
Stage 4: Interpretation and Validation
- Annotate multi-omics modules with functional information
- Perform pathway enrichment analysis across integrated modules
- Validate findings in independent cohorts where available
- Assess clinical relevance through survival analysis or treatment response associations
The Scientist's Toolkit: Essential Research Reagents and Computational Solutions
Table 3: Research Reagent Solutions for Multi-Omics Challenges
| Tool/Category | Specific Solutions | Function | Application Context |
|---|---|---|---|
| Data Integration Platforms | MiBiOmics [37], Databricks [47], MixOmics | Web-based and computational platforms for multi-omics integration | Exploratory analysis, network inference, visualization |
| Missing Data Handling | MI-MFA [48], RI-MFA [48], MICE | Multiple imputation methods for incomplete multi-omics data | Handling missing rows or features across omics tables |
| HDLSS-Compliant Algorithms | Multi-view mid-fusion [46], Grouped distance metrics | Specialized algorithms for high-dimension low-sample-size data | Predictive modeling in studies with limited samples |
| Multi-Omics Data Repositories | TCGA [39], CPTAC [39], ICGC [39] | Curated multi-omics datasets for method validation | Benchmarking algorithms, validating findings |
| Deep Learning Frameworks | DeepEC [44], SpliceAI [44], scGPT [47] | DL architectures for omics data analysis | Nonlinear integration, prediction tasks |
The integration of multi-omics data represents a transformative approach for precision medicine, yet it confronts significant technical challenges related to data heterogeneity, missing values, and the HDLSS problem. This guide has outlined strategic solutions for each challenge: sophisticated integration methods like MFA and deep learning for heterogeneity; multiple imputation approaches like MI-MFA for missing data; and multi-view mid-fusion frameworks for the HDLSS problem. The experimental protocols and toolkits provided offer practical starting points for researchers tackling these issues in their own work. As precision medicine continues to evolve, overcoming these computational barriers will be essential for translating multi-omics data into clinically actionable insights that benefit diverse patient populations [49]. Future advancements will likely come from more sophisticated AI approaches that simultaneously address all three challenges within unified computational frameworks, ultimately accelerating the development of personalized therapeutic strategies.
Optimizing Sampling Frequency Across Dynamic Omics Layers
In precision medicine research, multi-omics approaches have revolutionized our understanding of disease mechanisms by providing a holistic perspective of biological systems [30]. However, a significant challenge lies in the dynamic nature of biological systems, where molecular layers operate on vastly different timescales. The central dogma of biology portrays a flow of information from DNA to RNA to proteins and metabolites, yet each of these layers exhibits distinct temporal characteristics [50].
Optimizing sampling frequency across these dynamic omics layers is therefore critical for capturing meaningful biological variation while maintaining feasible research protocols. Without careful consideration of temporal dynamics, studies risk missing crucial transitional states or collecting redundant data, ultimately compromising the biological insights that can be derived from integrated analysis [51]. This technical guide provides a comprehensive framework for designing temporal sampling strategies in longitudinal multi-omics studies, with specific application to precision medicine research.
Biological Dynamics Across Omics Layers
Each omics layer reflects different biological processes with characteristic response times to perturbations, ranging from minutes for metabolites to years for genomic mutations. Understanding these inherent temporal dynamics is fundamental to designing effective sampling regimens.
Table: Characteristic Timescales of Different Omics Layers
| Omics Layer | Characteristic Response Time | Key Influencing Factors | Recommended Minimum Sampling Interval |
|---|---|---|---|
| Genomics | Years to lifetime | Cell division rate, mutagen exposure | Single baseline measurement typically sufficient [52] |
| Epigenomics | Hours to months | Environmental exposures, disease states | Days to weeks [52] |
| Transcriptomics | Minutes to hours | Cellular signaling, circadian rhythms | Hours [51] [52] |
| Proteomics | Hours to days | Protein synthesis and degradation rates | Days [51] [52] |
| Metabolomics | Seconds to hours | Metabolic flux, substrate availability | Minutes to hours [51] [52] |
| Microbiomics | Days to weeks | Diet, antibiotics, environment | Weeks [52] |
The static nature of genomics allows for single timepoint measurements in most studies, as changes accumulate slowly over years through mutation processes [52]. In contrast, transcriptomics captures highly dynamic processes, with mRNA levels capable of changing within minutes in response to stimuli [51]. Proteomics reflects an intermediate timeframe, as proteins generally have longer half-lives than transcripts, while metabolomics represents the most rapid responses, with metabolite fluxes occurring within seconds to minutes [51].
These differential temporal characteristics create significant challenges for data integration, as simultaneously collected samples may reflect biological states from different effective timepoints relative to a perturbation [51]. The following diagram illustrates these dynamic relationships across the omics layers:
Experimental Design Framework
Defining Study Objectives and Temporal Requirements
The optimal sampling strategy depends heavily on study objectives, which determine whether the focus should be on capturing circadian rhythms, response to interventions, or long-term progression patterns. For circadian studies, dense sampling over 24-hour periods is essential, while intervention studies require focused sampling around the stimulus application.
Three primary study types dictate different sampling approaches:
- Circadian Rhythm Studies: Require dense sampling across 24-hour cycles (approximately 4-6 hour intervals) to capture oscillatory patterns in transcriptomics and metabolomics [52].
- Intervention Response Studies: Need high-frequency sampling immediately pre- and post-intervention (minutes to hours) followed by progressively wider intervals to capture rapid response and adaptation phases.
- Disease Progression Studies: Benefit from baseline measurement with periodic follow-ups (weeks to months) to capture slower adaptive changes in proteomics and epigenomics.
Pilot studies are invaluable for determining optimal sampling schedules, as they can identify the anticipated peaks in molecular responses and help refine the main study design [51].
Practical Sampling Framework Methodology
Implementing an effective multi-omics sampling protocol requires systematic planning and coordination across research teams. The following workflow outlines a standardized approach for designing and executing temporal sampling in multi-omics studies:
For interventional studies specifically, the sampling strategy must adapt to capture both immediate responses and longer-term adaptations:
Table: Sampling Framework for a 30-Day Intervention Study
| Study Phase | Timepoints | Primary Omics Focus | Rationale |
|---|---|---|---|
| Baseline | Day 0 (pre-intervention) | All omics layers | Establish reference state |
| Acute Response | 1h, 6h, 24h post-intervention | Metabolomics, Transcriptomics | Capture immediate molecular responses |
| Adaptation | Day 3, Day 7 | Transcriptomics, Proteomics | Monitor intermediate adaptive processes |
| New Steady State | Day 14, Day 30 | Proteomics, Epigenomics, Microbiomics | Assess established changes |
This framework strategically concentrates resources during critical transition periods while maintaining coverage of slower-responding omics layers. The approach aligns with successful implementations in recent longitudinal studies that demonstrated temporal stability in certain omic layers, a critical aspect for prevention strategies [53].
Computational Methods and Data Integration
Handling Multi-Scale Temporal Data
The integration of multi-scale temporal data presents significant computational challenges, particularly when combining rapidly fluctuating metabolomic data with relatively stable genomic information. Several computational approaches have been developed to address these challenges:
Multi-layer Network Modeling creates individual temporal networks for each omics layer before integration, allowing for layer-specific temporal characteristics while ultimately revealing cross-omics interactions [51]. This approach effectively handles the different timescales inherent to each molecular layer.
Dynamic Bayesian Networks model probabilistic relationships across timepoints, inferring causal relationships across omics layers while accommodating missing data points, which are common in longitudinal studies [30].
Tensor Decomposition methods represent multi-omics data as a three-dimensional tensor (features × samples × time), simultaneously capturing temporal patterns and cross-omics relationships through factorization approaches [30].
Recurrent Neural Networks (RNNs), particularly Long Short-Term Memory (LSTM) networks, learn temporal dependencies in longitudinal omics data, enabling prediction of future states based on previous timepoints [3].
Integration Strategies for Temporal Multi-Omics Data
The timing of data integration significantly impacts how temporal relationships are captured and analyzed:
Table: Multi-Omics Integration Strategies for Temporal Data
| Integration Strategy | Temporal Handling Approach | Advantages for Temporal Studies | Limitations |
|---|---|---|---|
| Early Integration | Concatenates all omics data before analysis | Captures comprehensive cross-omics interactions at each timepoint | Amplifies dimensionality problems; difficult to align different temporal scales |
| Intermediate Integration | Transforms each omics dataset before combination | Allows for temporal normalization specific to each omics layer | May require sophisticated alignment algorithms |
| Late Integration | Analyzes datasets separately before combining results | Enables optimal temporal processing per omics type | May miss subtle temporal cross-omics interactions |
For precision medicine applications, intermediate integration approaches often provide the best balance, allowing for temporal characteristics specific to each omics layer while ultimately enabling integrated analysis [3]. Methods such as Similarity Network Fusion (SNF) create patient-similarity networks for each omics layer and timepoint before fusing them into a comprehensive network that captures both cross-omics and temporal relationships [3].
Implementation in Precision Medicine
Case Study: Cardiovascular Risk Stratification
A recent study exemplifies the application of optimized multi-omic sampling in precision medicine for early prevention strategies [53]. The research employed cross-sectional integration of genomic, metabolomic, and lipoproteomic data from 162 healthy individuals, with longitudinal follow-up in a subset of 61 individuals across three timepoints spanning three years.
The sampling strategy incorporated:
- Genomics: Single baseline measurement using whole exome sequencing and genotyping arrays
- Metabolomics/Lipoproteomics: Cross-sectional analysis with longitudinal validation at years 1, 2, and 3
- Temporal stability assessment: Evaluation of molecular profile consistency across timepoints
This approach successfully identified four distinct subgroups with differential accumulation of cardiovascular risk factors, demonstrating how multi-omic profiling of healthy individuals can inform early prevention strategies [53]. The temporal stability observed in certain molecular profiles reinforced their potential utility as stable biomarkers for long-term risk assessment.
Research Reagent Solutions
Successful implementation of temporal multi-omics studies requires specific research reagents and platforms tailored to each omics layer:
Table: Essential Research Reagents for Multi-Omics Sampling
| Reagent Category | Specific Examples | Primary Application | Critical Function |
|---|---|---|---|
| Nucleic Acid Enzymes | DNA polymerases, Reverse transcriptases, Methylation-sensitive enzymes | Genomics, Epigenomics, Transcriptomics | Nucleic acid amplification and modification [50] |
| Stabilization Solutions | RNAlater, PAXgene Blood RNA tubes, Protease inhibitors | Transcriptomics, Proteomics | Preserve molecular integrity between sampling and processing |
| Library Preparation Kits | Illumina DNA/RNA Prep, Swift Accel | Genomics, Transcriptomics | Prepare samples for high-throughput sequencing |
| MS-Grade Reagents | Trypsin, Iodoacetamide, TMT/KIT labels | Proteomics | Protein digestion, alkylation, and multiplexing for mass spectrometry |
| Metabolite Extraction | Methanol, Acetonitrile, Internal standards | Metabolomics | Extract and stabilize diverse metabolite classes |
Standardization of reagents across all timepoints is crucial to minimize technical variation that could obscure biological signals, particularly for proteomics and metabolomics where technical variability can be substantial [50] [51]. For nucleic acid-based omics layers (genomics, epigenomics, transcriptomics), molecular biology techniques including PCR, qPCR, and RT-PCR form the foundational methodology [50].
Optimizing sampling frequency across dynamic omics layers requires careful consideration of biological timescales, study objectives, and practical constraints. By aligning sampling strategies with the inherent temporal characteristics of each molecular layer, researchers can capture meaningful biological variation while efficiently utilizing resources. The integration of temporal multi-omics data presents both challenges and opportunities for precision medicine, particularly in identifying stable biomarker profiles for early disease prevention and understanding dynamic responses to interventions.
As multi-omics technologies continue to evolve toward higher throughput and lower costs, temporal sampling designs will become increasingly feasible and informative. Future developments in computational methods for analyzing time-series multi-omics data will further enhance our ability to extract biologically and clinically meaningful insights from these rich datasets.
The advancement of precision medicine hinges on our ability to move from fragmented biological insights to a holistic understanding of human health and disease. Multi-omics approaches—which integrate diverse molecular data types such as genomics, transcriptomics, proteomics, and metabolomics—are revolutionizing healthcare by providing comprehensive molecular portraits of individual patients [3]. This integration enables researchers and clinicians to reveal how genes, proteins, and metabolites interact to drive disease processes, ultimately facilitating personalized treatment matching based on unique molecular profiles [3].
However, the path to effective multi-omics integration is fraught with computational challenges. The high-dimensionality, heterogeneity, and frequent missing values across diverse omics datasets create significant barriers to meaningful integration [30]. Each biological layer generates massive, complex datasets with distinct formats, scales, and technical biases, creating a data integration problem that requires sophisticated computational solutions [3]. This technical guide explores novel frameworks and methodologies designed to overcome these challenges, providing researchers with advanced strategies for normalizing and integrating multi-omics data to accelerate discoveries in precision medicine.
Core Challenges in Multi-Omics Data Normalization
Data Heterogeneity and Scale
Multi-omics data integration involves combining wildly diverse biological data types, each telling a different part of the biological story. Genomics (DNA) provides the static blueprint and foundational risk profile through whole genome sequencing that reveals genetic variations across 3 billion base pairs. Transcriptomics (RNA) captures dynamic, real-time cellular activity by measuring messenger RNA levels, revealing how cells are responding to their current environment. Proteomics measures the functional workhorses of biology, reflecting the true functional state of tissues, while metabolomics captures small molecules that provide the most direct link to observable phenotype [3].
Beyond these molecular layers, clinical data from electronic health records (EHRs) offers rich but often unstructured patient information, including structured data like ICD codes and lab values alongside unstructured text like physician's notes that require natural language processing to unlock. Medical imaging adds another dimension, with emerging radiomics fields extracting thousands of quantitative features from images like MRIs and CT scans [3]. Each data type possesses unique formats, measurement scales, and technical biases, creating what is known as the high-dimensionality problem—far more features than samples—which can break traditional analysis methods and increase the risk of spurious correlations [3].
Technical and Analytical Hurdles
The technical problems in multi-omics data integration are substantial and multifaceted. Data normalization and harmonization represents the first critical hurdle, as different labs and platforms generate data with unique technical characteristics that can mask true biological signals. For example, RNA-seq data requires normalization (e.g., TPM, FPKM) to compare gene expression across samples, while proteomics data needs intensity normalization [3].
Missing data presents a constant challenge in biomedical research, where a patient might have genomic data but lack proteomic measurements. Incomplete datasets can seriously bias analyses if not handled with robust imputation methods, such as k-nearest neighbors (k-NN) or matrix factorization, which estimate missing values based on existing data [3]. Batch effects and noise from variations in technicians, reagents, sequencing machines, or even the time of day a sample was processed create systematic noise that obscures real biological variation, requiring careful experimental design and statistical correction methods like ComBat for removal [3].
The computational requirements for multi-omics integration are staggering, often involving petabytes of data. Analyzing a single whole genome can generate hundreds of gigabytes of raw data, and scaling this to thousands of patients across multiple omics layers demands scalable infrastructure like cloud-based solutions and distributed computing [3]. Finally, researchers need robust statistical models that can handle this complexity while producing interpretable results, requiring both computational sophistication and deep biological understanding [3].
Classical and Emerging Integration Methodologies
Classical Statistical Approaches
Classical statistical methods provide foundational approaches for multi-omics data integration, each with distinct strengths and limitations. Correlation and covariance-based methods, such as Canonical Correlation Analysis (CCA), explore relationships between two sets of variables with the same set of samples. CCA aims to find vectors that maximize correlation between linear combinations of variables from different omics datasets [30]. Sparse and regularized Generalized CCA (sGCCA/rGCCA) extensions have been developed to address high-dimensional data challenges and extend applications to more than two datasets [30]. DIABLO extends sGCCA to a supervised framework that simultaneously maximizes common information between multiple omics datasets while minimizing prediction error of a response variable, making it particularly effective for selecting co-varying modules that explain phenotypic outcomes [30].
Matrix factorization methods offer powerful techniques for joint dimensionality reduction, condensing datasets into fewer factors to reveal important patterns for identifying disease-associated biomarkers or cancer subtypes. JIVE is considered an extension of Principal Component Analysis (PCA) that decomposes each omics matrix into joint and individual low-rank approximations plus residual noise by minimizing the overall sum of squared residuals [30]. Non-Negative Matrix Factorization (NMF) and its extensions, including jNMF and intNMF, decompose multiple omics datasets into shared basis matrices and specific omics coefficient matrices, effectively identifying shared molecular patterns across omics layers [30].
Probabilistic-based methods, such as iCluster, employ joint latent variable models to identify latent cancer subtypes based on multi-omics data. These methods offer substantial advantages by incorporating uncertainty estimates and allowing for flexible regularization, effectively handling the inherent uncertainty in biological measurements [30].
Deep Learning Frameworks
Deep learning approaches have emerged as powerful tools for handling the non-linear relationships and high-dimensional nature of multi-omics data. Deep generative models, particularly variational autoencoders (VAEs), have gained prominence since 2020 for tasks such as imputation, denoising, and creating joint embeddings of multi-omics data [30]. These models learn complex nonlinear patterns through flexible architecture designs that can support missing data and denoising operations, making them particularly valuable for high-dimensional omics integration, data augmentation, and biomarker discovery [30].
Generative Adversarial Networks (GANs) represent another important deep learning approach, consisting of two networks—a generator and a discriminator—that compete to produce increasingly plausible generated samples [54]. Compared to variational autoencoders, GANs typically produce higher quality output with sharper and more realistic synthetic data, though they can present challenges in training stability [54]. The GAN framework is notably flexible, capable of training any type of generator network without restrictions on latent variable size, leading to superior performance in generating synthetic data, especially image data [54].
Flexynesis exemplifies modern deep learning toolkits specifically designed for bulk multi-omics data integration in precision oncology and beyond. This framework streamlines data processing, feature selection, hyperparameter tuning, and marker discovery, offering users choice from deep learning architectures or classical supervised machine learning methods through a standardized input interface [36]. It supports single-task modeling for regression, classification, and survival analysis, as well as multi-task modeling where multiple multi-layer perceptrons attach on top of sample encoding networks, enabling the embedding space to be shaped by multiple clinically relevant variables simultaneously [36].
Table 1: Comparison of Multi-Omics Integration Approaches
| Model Approach | Strengths | Limitations | Typical Applications |
|---|---|---|---|
| Correlation/Covariance-based | Captures relationships across omics, interpretable, flexible sparse extensions | Limited to linear associations, typically requires matched samples | Disease subtyping, detection of co-regulated modules |
| Matrix Factorisation | Efficient dimensionality reduction, identifies shared and omic-specific factors, scalable | Assumes linearity, does not explicitly model uncertainty or noise | Disease subtyping, identification of shared molecular patterns, biomarker discovery |
| Probabilistic-based | Efficient dimensionality reduction, captures uncertainty in latent factors | Computationally intensive, may require strong model assumptions | Disease subtyping, latent factors discovery, biomarker discovery |
| Deep Generative Learning | Learns complex nonlinear patterns, flexible architecture, supports missing data | High computational demands, limited interpretability, requires large data | High-dimensional omics integration, data augmentation and imputation, disease subtyping |
AI-Powered Integration Strategies
Researchers typically choose between three main integration strategies, where the timing of integration significantly shapes the analytical results and biological insights. Early integration, also known as feature-level integration, merges all features into one massive dataset before analysis. This approach, often involving simple concatenation of data vectors, is computationally expensive and susceptible to the "curse of dimensionality," but has the potential to preserve all raw information and capture complex, unforeseen interactions between modalities [3].
Intermediate integration first transforms each omics dataset into a more manageable form, then combines these representations. Network-based methods are a prime example, where each omics layer constructs a biological network (e.g., gene co-expression, protein-protein interactions) that then integrates to reveal functional relationships and modules driving disease [3]. This approach reduces complexity while incorporating biological context through networks, though it may require domain knowledge and could lose some raw information [3].
Late integration, or model-level integration, builds separate predictive models for each omics type and combines their predictions at the end. This ensemble approach, using methods like weighted averaging or stacking, is robust, computationally efficient, and handles missing data well, but may miss subtle cross-omics interactions not strong enough to be captured by any single model [3].
Table 2: AI-Powered Multi-Omics Integration Strategies
| Integration Strategy | Timing | Advantages | Challenges |
|---|---|---|---|
| Early Integration | Before analysis | Captures all cross-omics interactions; preserves raw information | Extremely high dimensionality; computationally intensive |
| Intermediate Integration | During change | Reduces complexity; incorporates biological context through networks | Requires domain knowledge; may lose some raw information |
| Late Integration | After individual analysis | Handles missing data well; computationally efficient | May miss subtle cross-omics interactions |
Experimental Protocols and Workflows
Comprehensive Multi-Omics Integration Workflow
The following diagram illustrates a standardized workflow for multi-omics data normalization and integration, incorporating both classical and deep learning approaches:
Deep Learning Model Architecture Selection
For researchers implementing deep learning approaches, the following decision framework guides architecture selection based on specific research objectives:
Detailed Experimental Protocol for Multi-Omics Classification
Objective: Implement a classification model for cancer subtype prediction using multi-omics data.
Materials and Requirements:
- Multi-omics datasets (e.g., TCGA, CCLE) containing matched genomic, transcriptomic, and epigenomic profiles
- Clinical annotations including cancer subtypes and survival information
- Computational environment with Python/R and necessary libraries
- High-performance computing resources for deep learning models
Step-by-Step Methodology:
Data Acquisition and Preprocessing
- Download multi-omics data from repositories like TCGA or CCLE [36]
- Perform quality control: remove features with >20% missing values, exclude low-quality samples
- Apply platform-specific normalization: TPM for RNA-seq, beta-value normalization for methylation arrays
- Log-transform appropriate data types (e.g., gene expression counts)
Data Integration and Model Training
- Implement early integration: concatenate normalized features from all omics layers
- Apply feature selection: retain top 5,000 most variable features per omics type
- Split data into training (70%), validation (15%), and test (15%) sets
- Train multiple classifiers: random forest, support vector machines, and deep neural networks
- Optimize hyperparameters using grid search with 5-fold cross-validation
Model Validation and Interpretation
- Evaluate model performance on held-out test set using AUC, accuracy, and F1-score
- Perform permutation testing to assess statistical significance
- Conduct feature importance analysis to identify driving omics features
- Validate findings in independent cohorts when available
Validation Metrics:
- Area Under ROC Curve (AUC-ROC)
- Precision-Recall curves
- Matthews Correlation Coefficient
- Cross-validation consistency
Table 3: Essential Research Reagents and Computational Resources for Multi-Omics Integration
| Resource Category | Specific Tools/Solutions | Function/Purpose |
|---|---|---|
| Data Repositories | The Cancer Genome Atlas (TCGA), Cancer Cell Line Encyclopedia (CCLE) | Provide curated multi-omics datasets for method development and validation [36] |
| Computational Frameworks | Flexynesis, Lifebit AI Platform | Streamline data processing, feature selection, hyperparameter tuning, and marker discovery [36] [3] |
| Deep Learning Architectures | Variational Autoencoders (VAEs), Generative Adversarial Networks (GANs), Graph Convolutional Networks | Learn complex nonlinear patterns, handle missing data, perform data augmentation and imputation [30] [54] |
| Integration Algorithms | DIABLO, iCluster, Similarity Network Fusion (SNF), JIVE | Implement specific integration strategies for dimensionality reduction, clustering, and biomarker discovery [30] |
| Visualization Tools | TensorBoard, UMAP, t-SNE, Plotly | Enable visualization of high-dimensional data, model training progress, and integration results |
The field of multi-omics data normalization and integration continues to evolve rapidly, with novel frameworks addressing the fundamental challenges of data heterogeneity, scalability, and interpretability. The integration of classical statistical approaches with modern deep learning architectures represents a promising path forward for precision medicine research. As these computational methods mature and become more accessible through platforms like Flexynesis and Lifebit, researchers will be increasingly equipped to uncover complex biological patterns, identify novel biomarkers, and ultimately advance personalized therapeutic strategies. The future of multi-omics integration lies in developing more interpretable, scalable, and robust frameworks that can seamlessly combine diverse molecular data types while providing clinically actionable insights for patient care.
Ethical Considerations and Data Security in Multi-Omics Research
The integration of multi-omics data—encompassing genomics, transcriptomics, proteomics, epigenomics, and metabolomics—represents a cornerstone of modern precision medicine research. This approach provides unprecedented insights into human biology and disease mechanisms by combining multiple biological layers to create a comprehensive view of health and disease [1]. However, this powerful research paradigm introduces complex ethical and data security challenges that researchers must navigate. The highly sensitive nature of health and omics data, coupled with its immense volume and potential for privacy breaches, demands robust ethical frameworks and stringent security protocols [55] [56]. In the context of precision medicine, where multi-omics data directly informs clinical decision-making, the ethical imperative extends beyond research settings to impact patient care and outcomes directly.
The stakes are particularly high given the escalating threat landscape. Recent evidence indicates that healthcare data remains a valuable target for cybercriminals, with 725 reportable breaches exposing more than 133 million patient records in 2023 alone—representing a 239% increase in hacking-related incidents since 2018 [55]. Simultaneously, ethical concerns regarding algorithmic bias, informed consent, and data ownership complicate the research landscape [55]. This technical guide examines these critical challenges and provides actionable methodologies for researchers, scientists, and drug development professionals working to advance precision medicine through multi-omics approaches while maintaining rigorous ethical and security standards.
Ethical Dimensions of Multi-Omics Research
Privacy, Consent, and Data Ownership
The fundamental ethical challenge in multi-omics research lies in balancing the scientific potential of data sharing against the imperative to protect individual privacy. Multi-omics data is inherently identifiable, with studies demonstrating that 99.98% of individuals can be re-identified using just 15 quasi-identifiers [55]. This identifiability persists despite anonymization techniques, creating tension between open science principles and privacy preservation.
Informed consent presents particular complexities in multi-omics studies. Traditional consent models often prove inadequate for research involving future, unspecified uses of data across multiple omics layers [55]. The scale of data sharing in multi-omics research further complicates consent, particularly as healthcare organizations increasingly share patient information with large digital platforms and research institutions [55]. Dynamic consent models that enable ongoing participant engagement and granular control over data use are emerging as potential solutions, though implementation challenges remain [55].
Data ownership questions frequently arise in multi-omics research, especially when research involves collaborations between academic institutions, healthcare providers, and commercial entities. Corporate data-sharing deals further complicate questions of data ownership and patient autonomy [55]. Clear governance frameworks that define rights and responsibilities across the data lifecycle are essential components of ethical multi-omics research.
Algorithmic Bias and Health Equity
Algorithmic bias represents a critical ethical challenge in multi-omics research, with potential to perpetuate or exacerbate health disparities. Machine learning models trained on historically biased data can reinforce health inequalities across protected groups [55]. This risk is particularly concerning in precision medicine, where biased algorithms could lead to unequal distribution of benefits across population subgroups.
The problem is compounded by the lack of diversity in genomic and multi-omics datasets. Participants of European descent constitute approximately 86.3% of all genomic studies conducted worldwide, while populations of African, South Asian, and Hispanic descent together represent less than 10% [1]. This underrepresentation creates significant gaps in understanding how genetic variations affect different populations and limits the generalizability of multi-omics findings.
Table 1: Documented Instances of Data Breaches in Healthcare and Genomic Research
| Year | Reported Breaches | Records Exposed | Percentage Increase in Hacking |
|---|---|---|---|
| 2023 | 725 | 133+ million | 239% since 2018 [55] |
| 2024 (Europe) | N/A | N/A | 35% year-over-year increase in weekly attacks [55] |
| 2024 (APAC) | N/A | N/A | 2,510 attacks per organization weekly [55] |
Addressing algorithmic bias requires both technical and methodological solutions. Technically, researchers should implement fairness-aware machine learning and regularly audit algorithms for disparate impacts [55]. Methodologically, conscious efforts to include diverse populations in research cohorts are essential. Community-engaged research frameworks that build trust with underrepresented communities can help address diversity gaps in multi-omics research [1].
Transparency and Accountability
The "black box" nature of complex multi-omics algorithms creates significant transparency challenges. Many advanced machine learning models, particularly deep learning approaches, operate in ways that are difficult to interpret, raising concerns when these models influence medical decisions [55]. In precision medicine contexts, where algorithmic outputs may directly impact patient care, understanding how decisions are made becomes crucial for clinician trust and adoption.
A comprehensive approach to transparency should span three distinct levels: dataset documentation, model interpretability, and post-deployment audit logging [55]. Dataset transparency includes detailed documentation of provenance, collection methods, and potential biases through artifacts such as "datasheets for datasets." Model transparency involves explainability techniques like LIME (Local Interpretable Model-agnostic Explanations) and SHAP (SHapley Additive exPlanations) that help make algorithmic reasoning traceable [55]. Audit logging creates a record of model predictions and performance over time, enabling retrospective analysis of errors or biases.
Accountability structures must clearly define responsibility when multi-omics research or applications lead to adverse outcomes. This includes establishing protocols for model validation, monitoring, and remediation when issues are identified. Regulatory frameworks are increasingly emphasizing accountability, with guidelines such as SPIRIT-AI, CONSORT-AI, and PROBAST-AI providing standards for reporting and validation [55].
Data Security Frameworks and Methodologies
Technical Safeguards for Multi-Omics Data
Protecting multi-omics data requires a layered security approach incorporating multiple privacy-enhancing technologies. Differential privacy provides mathematical guarantees against privacy breaches by adding carefully calibrated noise to query results or datasets [55]. Implementation requires empirically validated noise budgets that balance privacy protection with data utility preservation. For maximum security in collaborative analysis, homomorphic encryption enables computation on encrypted data without decryption, though it remains computationally intensive for routine deployment [55].
Federated learning addresses data locality concerns by training models across decentralized data sources without transferring raw data [55]. In this approach, model parameters rather than data are shared between institutions, reducing privacy risks. For genomic data analysis, this methodology can be implemented through platforms like OmnibusX, which performs all processing locally while enabling collaborative model development [57].
Table 2: Security Techniques for Multi-Omics Data Protection
| Technique | Security Mechanism | Implementation Considerations | Best Use Cases |
|---|---|---|---|
| Differential Privacy | Adds calibrated noise to outputs | Requires empirical validation of noise budgets; balances privacy vs. utility | Statistical analysis; dataset sharing |
| Homomorphic Encryption | Enables computation on encrypted data | Computationally intensive; currently cost-prohibitive for routine use | High-security collaborative analysis |
| Federated Learning | Trains models on decentralized data | Maintains data locality; requires standardized model architectures | Multi-institutional research collaborations |
| Local Processing Architecture | Keeps data within controlled environments | Implemented in platforms like OmnibusX; no external data transfer [57] | Clinical or regulated research environments |
Access control mechanisms must implement the principle of least privilege, granting researchers only the data access necessary for their specific tasks. Multi-factor authentication, role-based access controls, and comprehensive logging of data accesses provide additional security layers. For particularly sensitive operations, such as accessing individual-level genomic data, purpose-based access control systems can enforce restrictions based on the specific research purpose for which access was granted.
Data Governance and Compliance Frameworks
Effective data governance provides the structural foundation for ethical multi-omics research. Governance frameworks must address data quality, integrity, privacy, and security throughout the data lifecycle [55]. Key components include data classification schemas that categorize data based on sensitivity, retention policies that define appropriate storage durations, and deletion protocols that ensure secure data disposal.
Regulatory compliance requires adherence to region-specific regulations such as HIPAA in the United States, GDPR in Europe, and emerging frameworks worldwide [56]. These regulations typically mandate security safeguards, breach notification protocols, and individual rights regarding personal data. In multi-omics research involving multiple jurisdictions, harmonizing compliance across regulatory regimes presents significant challenges.
Ethical review processes must evolve to address the specific challenges of multi-omics research. Institutional Review Boards (IRBs) and Ethics Committees require specialized expertise to evaluate the privacy implications of multi-omics studies, assess the adequacy of consent processes for future data uses, and review data sharing agreements. Ongoing ethics review, rather than single-point approval, better addresses the iterative nature of multi-omics research.
Secure Multi-Omics Integration Platforms
Technical platforms for multi-omics analysis must prioritize security throughout their architecture. OmnibusX exemplifies this approach with its privacy-centric design, featuring local data processing that eliminates external data transfer and usage tracking [57]. The platform's modular architecture separates the analytical backend from the user interface, implementing strict access controls and maintaining all data within the researcher's computational environment.
Cloud-based platforms must implement additional security measures, including encryption both in transit and at rest, comprehensive access logging, and network security controls. Cloud environments can offer security advantages through specialized infrastructure, automated patching, and dedicated security teams, though they also introduce shared responsibility models that require careful configuration [56].
Regardless of the deployment model, platforms should incorporate security-by-design principles, conducting regular security audits, vulnerability assessments, and penetration testing. For open-source platforms, transparent security practices enable community review and contribution to security improvements.
Experimental Protocols for Ethical Multi-Omics Research
Privacy-Preserving Data Analysis Workflow
Implementing privacy-preserving multi-omics analysis requires systematic methodologies at each research stage. The following protocol outlines a secure workflow for multi-omics integration:
Data De-identification: Remove direct identifiers (names, addresses, medical record numbers) from all datasets. Implement pseudonymization using one-way cryptographic hashes for sample and participant identifiers.
Differential Privacy Application: Apply differential privacy mechanisms during data preprocessing, particularly for aggregate statistics or dataset releases. For genomic data, carefully calibrate noise to preserve utility for common analyses while providing privacy guarantees.
Federated Analysis Setup: When pooling data across institutions, implement federated learning architectures rather than centralizing raw data. Use standardized containerization (e.g., Docker) to ensure consistent execution environments across sites.
Secure Model Training: Employ privacy-preserving machine learning techniques such as differential privacy in model training or secure multi-party computation for sensitive operations. For deep learning models, consider using PyTorch or TensorFlow Privacy libraries that implement differentially private stochastic gradient descent.
Result Validation and Disclosure Control: Before releasing results, implement statistical disclosure control methods to prevent re-identification through aggregate statistics. Conduct simulated attacker analysis to identify potential privacy vulnerabilities in released outputs.
This workflow aligns with emerging best practices in privacy-preserving data analysis and can be adapted to specific multi-omics research contexts.
Bias Auditing and Mitigation Protocol
Proactive bias auditing and mitigation should be integrated throughout the multi-omics research pipeline. The following experimental protocol provides a structured approach:
Dataset Representation Assessment: Quantify representation across relevant demographic strata (including ancestry, gender, age) in training and validation datasets. Compare cohort demographics to target populations to identify representation gaps.
Pre-processing Bias Mitigation: Apply statistical sampling techniques to address representation imbalances where ethically and scientifically appropriate. Implement feature selection methods that minimize dependence on protected attributes.
Algorithmic Fairness Evaluation: During model development, evaluate multiple fairness metrics across demographic subgroups. Metrics should include demographic parity, equality of opportunity, and predictive rate parity. Use specialized libraries such as AI Fairness 360 or Fairlearn for standardized assessment.
Post-processing Equity Analysis: Evaluate model performance stratified by relevant demographic variables. For classification models, assess false positive and false negative rates across groups. For risk prediction models, evaluate calibration and discrimination within subgroups.
Continuous Monitoring: Implement ongoing monitoring of model performance in deployment settings, with particular attention to performance across demographic groups. Establish procedures for model recalibration or retraining when performance disparities are detected.
This protocol should be documented in study preregistrations and final publications to enhance transparency and reproducibility.
Visualization of Security and Ethical Frameworks
Multi-Omics Ethics and Security Integration
This framework visualization illustrates how ethical and security components integrate within a multi-omics research platform. The model emphasizes the interconnectedness of ethical principles and security mechanisms, demonstrating how they collectively contribute to trustworthy precision medicine outcomes through a unified implementation layer.
The Scientist's Toolkit: Essential Research Reagents and Solutions
Table 3: Research Reagent Solutions for Ethical Multi-Omics Research
| Tool/Category | Specific Examples | Function in Multi-Omics Research |
|---|---|---|
| Privacy-Enhancing Technologies | Differential Privacy (ε-budget); Homomorphic Encryption; Federated Learning | Protects participant privacy while enabling data analysis [55] |
| Bias Assessment Tools | AI Fairness 360; Fairlearn; SHAP | Detects and mitigates algorithmic bias in multi-omics models [55] |
| Multi-Omics Integration Platforms | OmnibusX; MOVICS; MOGONET | Provides secure environments for analyzing integrated omics data [58] [57] |
| Variant Interpretation Databases | gnomAD; ClinVar; DECIPHER | Enables accurate interpretation of genomic variants [1] |
| Secure Computation Infrastructure | Local processing architectures; Private cloud deployment | Maintains data control and security [57] |
The advancement of precision medicine through multi-omics research necessitates parallel progress in ethical frameworks and security methodologies. This technical guide has outlined the principal ethical challenges—including privacy preservation, algorithmic bias, and transparency—and provided robust security frameworks to address them. The experimental protocols and visualization frameworks offer researchers actionable methodologies for implementing these principles in practice.
As multi-omics technologies continue to evolve, ethical and security considerations must remain central to research design and implementation. The promising technical approaches outlined—including privacy-enhancing technologies, comprehensive bias auditing, and secure analysis platforms—provide a foundation for responsible innovation. By adopting these frameworks, researchers can harness the transformative potential of multi-omics data for precision medicine while maintaining the trust of participants and the public—a prerequisite for sustainable scientific progress.
Ensuring Rigor: Benchmarking Tools and Validating Clinical Relevance
Multi-omics data integration represents a cornerstone of modern precision medicine, enabling researchers to unravel complex biological systems by simultaneously analyzing multiple molecular layers. This technical guide provides a comprehensive benchmarking analysis between two prominent integration approaches: the statistical framework MOFA+ (Multi-Omics Factor Analysis) and the deep learning-based method MoGCN (Multi-omics Graph Convolutional Network). Based on recent comparative studies examining breast cancer subtype classification, MOFA+ demonstrated superior performance in feature selection capabilities, achieving an F1 score of 0.75 in nonlinear classification models and identifying 121 biologically relevant pathways compared to 100 pathways identified by MoGCN [59] [60]. Both methodologies offer distinct advantages and limitations for precision medicine applications, which we examine through detailed experimental protocols, performance metrics, and implementation considerations.
Precision medicine emphasizes tailored treatment approaches based on individual patient characteristics, with multi-omics integration serving as a critical enabler for uncovering comprehensive molecular signatures of disease [61]. The heterogeneity of complex diseases like breast cancer poses significant challenges in understanding molecular mechanisms, early diagnosis, and disease management. Multi-omics technologies allow the study of complex biological mechanisms by identifying global biomarkers and predicting patient outcomes across multiple biological layers including transcriptomics, microbiomics, and epigenomics [59]. However, relying on a single omics dataset provides only a partial view of disease progression and fails to capture latent relationships across different biological levels [59]. This limitation has spurred the development of sophisticated computational methods that can integrate diverse omics data types to provide a more holistic understanding of disease biology and facilitate the identification of novel biomarkers and therapeutic targets [62].
The integration landscape primarily comprises two philosophical approaches: statistical methods that leverage rigorous mathematical frameworks to disentangle variation sources across omics layers, and deep learning approaches that utilize neural networks to learn complex patterns and relationships from high-dimensional data. MOFA+ represents the statistical paradigm, extending Bayesian factor analysis to handle multi-modal data integration, while MoGCN exemplifies the deep learning approach, leveraging graph convolutional networks to model both feature relationships and sample similarities [63] [64]. Understanding the relative strengths, limitations, and appropriate application contexts for these approaches is essential for advancing precision medicine research and developing clinically actionable insights.
Technical Foundations of MOFA+ and MoGCN
MOFA+: Statistical Framework for Multi-Modal Data Integration
MOFA+ is a statistical framework for comprehensive integration of multi-modal single-cell data that builds upon the original Multi-Omics Factor Analysis (MOFA) method [65]. At its core, MOFA+ employs a Bayesian group factor analysis model that infers a low-dimensional representation of the data in terms of a small number of latent factors that capture global sources of variability across multiple omics modalities [65]. Intuitively, MOFA+ can be viewed as a statistically rigorous generalization of principal component analysis (PCA) to multi-omics data, employing Automatic Relevance Determination (ARD) priors to disentangle variation shared across multiple modalities from variability present in a single modality [65].
Key technical innovations in MOFA+ include:
Stochastic Variational Inference: A computationally efficient inference framework amenable to GPU computations, enabling analysis of datasets with potentially millions of cells and achieving up to 20-fold speed increases compared to conventional variational inference [65].
Group-wise ARD Priors: An extended prior hierarchy that allows simultaneous integration of multiple data modalities and sample groups, facilitating the identification of factors with differential activity across experimental conditions [65].
Sparsity Constraints: Sparsity-inducing priors on weights that promote interpretable solutions and facilitate the association of molecular features with each latent factor [65].
The model inputs for MOFA+ include multiple datasets where features are aggregated into non-overlapping sets of modalities (views) and cells are aggregated into non-overlapping sets of groups. During training, MOFA+ infers K latent factors with associated feature weight matrices that explain the major axes of variation across datasets [65].
MoGCN: Deep Learning Approach for Multi-Omics Integration
MoGCN is a multi-omics integration method based on Graph Convolutional Networks (GCNs) designed specifically for cancer subtype classification and analysis [63] [64]. This approach creatively develops a network diagnosis model based on the pipeline of "integrating multi-omics data first and then performing classification" [64]. The methodology combines two unsupervised multi-omics integration algorithms—autoencoders (AE) for dimensionality reduction and similarity network fusion (SNF) for constructing patient similarity networks—within a supervised GCN framework for final classification [66] [64].
The MoGCN architecture comprises three key components:
Multi-Modal Autoencoder: Consists of multiple encoders and decoders that share the same latent layer, with the loss function formalized as E = argminf,g(αLoss1(x1,g1(f1(x1)))+…+βLoss2(x1,g1(f1(x1)))) where α, …, β are weights assigned to each data type [64]. This architecture reduces dimensionality while preserving essential biological information from each omics layer.
Similarity Network Fusion: Constructs a fused patient similarity network by computing and integrating patient-patient similarity matrices for each data type. The algorithm uses a scaled exponential similarity matrix defined as W(i,j) = exp(-ρ²(xi,xj)/µεi,j), where ρ represents the Euclidean distance between patients, µ is a hyperparameter, and ε is used to normalize the similarity values [64].
Graph Convolutional Network: Classifies unlabeled nodes using information from both the topology of the patient similarity network and the feature vectors of the nodes extracted by the autoencoder [64]. The network structure provides inherent interpretability to the model.
Experimental Design and Benchmarking Methodology
Data Collection and Processing Protocols
A rigorous benchmarking study compared MOFA+ and MoGCN using 960 breast cancer patient samples from The Cancer Genome Atlas (TCGA-PanCanAtlas 2018) with molecular profiling across three omics layers: host transcriptomics, epigenomics, and shotgun microbiome data [59]. The patient samples represented the heterogeneity of breast cancer with the following distribution: 168 Basal, 485 Luminal A, 196 Luminal B, 76 HER2-enriched, and 35 Normal-like subtypes [59].
Data processing followed a standardized pipeline:
Batch Effect Correction: Unsupervised ComBat was applied through the Surrogate Variable Analysis (SVA) package for transcriptomic and microbiomics data, while the Harman method was implemented for methylation data to remove batch effects [59].
Feature Filtering: Features with zero expression in 50% of samples were discarded, resulting in retained features of D = 20,531 for transcriptome, D = 1,406 for microbiome, and D = 22,601 for epigenome [59].
Data Integration: Both models were trained on the same processed data to ensure fair comparison, with MOFA+ using the R implementation (v4.3.2) and MoGCN utilizing Python 3.6+ with PyTorch 1.4.0+ [59] [66].
Feature Selection and Model Training
To ensure equitable comparison, both models were configured to select the same number of features:
MOFA+ Feature Selection: Features were selected based on absolute loadings from the latent factor explaining the highest shared variance across all omics layers (specifically Factor one in the dataset), identifying the most representative multi-omics signals relevant to subtyping [59].
MoGCN Feature Selection: The built-in autoencoder-based feature extractor selected top features based on an importance score computed by multiplying absolute encoder weights by the standard deviation of each input feature, prioritizing features with high model influence and biological variability [59].
Uniform Feature Set: Both methods extracted the top 100 features per omics layer (transcriptomics, microbiome, and methylation), resulting in a unified input of 300 features per sample for both models [59].
Model training specifications differed according to each method's requirements:
MOFA+ Training: The model was trained over 400,000 iterations with a convergence threshold, with latent factors selected to explain a minimum of 5% variance in at least one data type [59].
MoGCN Training: The autoencoder model processed different omics using three separate encoder-decoder pathways, with each step followed by a hidden layer of 100 neurons using a learning rate of 0.001 [59].
Evaluation Framework: Both linear (Support Vector Classifier with linear kernel) and nonlinear (Logistic Regression) models were trained using the selected features, with grid search and five-fold cross-validation using F1 score as the evaluation metric to account for class imbalance [59].
Table 1: Experimental Dataset Composition
| Parameter | Specification |
|---|---|
| Total Samples | 960 breast cancer patients |
| Data Sources | TCGA-PanCanAtlas 2018 |
| Omics Layers | Transcriptomics, Epigenomics, Shotgun Microbiome |
| Sample Distribution | 168 Basal, 485 Luminal A, 196 Luminal B, 76 HER2-enriched, 35 Normal-like |
| Features Post-Filtering | 20,531 (Transcriptome), 1,406 (Microbiome), 22,601 (Epigenome) |
| Batch Correction | ComBat (Transcriptomics/Microbiome), Harman (Methylation) |
Evaluation Metrics and Validation Approaches
The benchmarking study employed multiple complementary evaluation criteria to assess model performance:
Clustering Quality: Assessed using t-SNE visualization alongside the Calinski-Harabasz index (measuring ratio of between-cluster to within-cluster dispersion) and Davies-Bouldin index (assessing average similarity ratio between clusters) [59].
Classification Performance: Evaluated using F1 score metrics from both linear and nonlinear classification models to assess the discriminative power of selected features for BC subtype prediction [59].
Biological Relevance: Analyzed through pathway enrichment analysis of transcriptomic features, focusing on identification of key breast cancer pathways and their implications for immune responses and tumor progression [59].
Clinical Association: Assessed using correlation and survival analysis through OncoDB, testing associations between gene expression and clinical variables including tumor stage, lymph node involvement, metastasis, age, and race [59].
Comparative Performance Analysis
Quantitative Performance Metrics
The benchmarking analysis revealed significant differences in performance between the statistical and deep learning approaches:
Classification Accuracy: MOFA+ achieved superior performance in feature selection for breast cancer subtype classification, attaining the highest F1 score of 0.75 in the nonlinear classification model compared to MoGCN [59] [60].
Biological Pathway Identification: MOFA+ identified 121 relevant pathways associated with breast cancer subtypes compared to 100 pathways identified by MoGCN, demonstrating enhanced capability in extracting biologically meaningful signals [59]. Key pathways included Fc gamma R-mediated phagocytosis and the SNARE pathway, both offering insights into immune responses and tumor progression mechanisms [59].
Clustering Performance: In unsupervised embedding-based evaluation, MOFA+ demonstrated better clustering quality metrics, including higher Calinski-Harabasz index scores and lower Davies-Bouldin index values, indicating more distinct separation of breast cancer subtypes [59].
Table 2: Performance Comparison Between MOFA+ and MoGCN
| Metric | MOFA+ | MoGCN |
|---|---|---|
| F1 Score (Nonlinear Model) | 0.75 | Lower (exact value not specified) |
| Biological Pathways Identified | 121 | 100 |
| Key Pathways | Fc gamma R-mediated phagocytosis, SNARE pathway | Not specified |
| Feature Selection Capability | Superior | Moderate |
| Interpretability | High (Sparse factor loadings) | Moderate (Network-based) |
| Scalability | High (GPU-accelerated) | Moderate |
Computational Efficiency and Scalability
The two approaches demonstrated different computational characteristics:
MOFA+ Efficiency: The stochastic variational inference framework in MOFA+ enables analysis of large-scale datasets with potentially millions of cells, with GPU acceleration providing up to 20-fold speed increases compared to conventional variational inference [65].
MoGCN Requirements: The multi-step pipeline involving autoencoders, similarity network fusion, and graph convolutional networks requires significant computational resources for training, though the final model is efficient for inference [63] [64].
Hardware Considerations: MOFA+ benefits from GPU acceleration for large datasets, while MoGCN requires adequate memory for constructing and processing patient similarity networks, which can become computationally intensive for very large sample sizes [65] [66].
Implementation Considerations and Research Applications
Experimental Workflow and Research Reagents
Successful implementation of multi-omics integration methods requires careful consideration of experimental workflows and computational resources:
Table 3: Essential Research Reagents and Computational Tools
| Resource | Function | Implementation |
|---|---|---|
| TCGA Multi-omics Data | Provides transcriptomic, epigenomic, and microbiome data for model training | 960 breast cancer samples with three omics layers [59] |
| Batch Correction Tools | Removes technical variation from different experimental batches | ComBat (SVA package) and Harman method [59] |
| MOFA+ Package | Statistical integration of multi-omics data | R package (v4.3.2) with GPU support [59] [67] |
| MoGCN Implementation | Deep learning-based integration and classification | Python 3.6+, PyTorch 1.4.0+, snfpy 0.2.2 [66] |
| Evaluation Frameworks | Assess model performance and biological relevance | Scikit-learn for ML models, pathway enrichment tools [59] |
Biological Interpretation and Clinical Translation
The biological insights generated by each method have distinct implications for precision medicine:
MOFA+ Insights: The identification of Fc gamma R-mediated phagocytosis and SNARE pathways provides mechanistic insights into immune responses and tumor progression mechanisms in breast cancer, suggesting potential therapeutic targets [59].
MoGCN Applications: The method demonstrates strong performance in cancer subtype classification and biomarker identification, with network visualization capabilities enabling clinically intuitive diagnosis [63] [64].
Clinical Association: Both methods enable correlation between molecular features and clinical variables, with MOFA+ showing particularly strong performance in linking selected features to clinical outcomes including tumor stage, lymph node involvement, and metastasis [59].
The following diagram illustrates the core workflow and logical relationships in the multi-omics integration benchmarking process:
Multi-omics Integration Workflow
Discussion and Future Perspectives
The benchmarking analysis demonstrates that statistical and deep learning approaches for multi-omics integration offer complementary strengths for precision medicine applications. MOFA+ excels in feature selection, biological interpretability, and identification of mechanistically relevant pathways, making it particularly valuable for exploratory analysis and hypothesis generation [59] [60]. Meanwhile, MoGCN provides robust classification performance and network-based visualization capabilities that may be advantageous for clinical diagnostic applications [63] [64].
Future methodological developments will likely focus on several key areas:
Hybrid Approaches: Combining statistical rigor with the pattern recognition capabilities of deep learning, as exemplified by emerging frameworks like GNNRAI that incorporate biological priors into graph neural network architectures [62].
Explainable AI: Enhancing interpretability of deep learning models through integrated gradient methods and attribution techniques that elucidate feature importance and biological relevance [62].
Temporal and Spatial Integration: Extending multi-omics integration to incorporate temporal dynamics and spatial relationships through methods like MEFISTO, which builds upon the MOFA+ framework for temporal or spatial data [67].
For precision medicine research, the choice between statistical and deep learning approaches should be guided by specific research objectives, data characteristics, and implementation constraints. MOFA+ represents a robust choice for unsupervised discovery of biological mechanisms, while MoGCN and related deep learning methods offer powerful alternatives for supervised classification tasks with adequate training data. As both methodologies continue to evolve, their synergistic application promises to accelerate the development of personalized therapeutic strategies tailored to individual molecular profiles.
This benchmarking analysis demonstrates that MOFA+ outperforms MoGCN in feature selection for breast cancer subtyping, achieving superior F1 scores and identifying more biologically relevant pathways [59] [60]. However, both statistical and deep learning approaches offer valuable capabilities for multi-omics integration in precision medicine research. MOFA+ provides a statistically rigorous framework for unsupervised integration with high interpretability, while MoGCN exemplifies the potential of deep learning to capture complex patterns in multi-omics data for classification tasks. The continuing development of both methodological paradigms will be essential for addressing the computational challenges of multi-omics data and translating molecular insights into clinically actionable knowledge for personalized patient care.
In precision medicine research, the accurate identification of disease subtypes is paramount for developing targeted therapies and improving patient outcomes. Multi-omics data, which provides a comprehensive view of biological systems across genomic, transcriptomic, epigenomic, and proteomic layers, is instrumental in this endeavor [68]. However, the high-dimensionality, heterogeneity, and frequent sparsity of these datasets present significant analytical challenges [30] [69]. Consequently, robust feature selection techniques and rigorous evaluation metrics are critical for building reliable classification models that can translate from research to clinical applications. This technical guide provides an in-depth examination of the methodologies and metrics essential for evaluating feature selection stability and subtype classification accuracy within multi-omics-based precision medicine.
Evaluating Feature Selection Stability
Feature selection is a critical preprocessing step in high-dimensional multi-omics analysis. It improves model performance, reduces overfitting, and enhances the biological interpretability of results by identifying the most relevant molecular features [70] [71]. Stability—the consistency of selected features across different training datasets or under slight data perturbations—is a key indicator of a feature selection method's reliability.
Quantifying Stability: The Nogueira Metric
Stability assesses how consistently a feature selection algorithm chooses the same set of features when applied to different subsets of data drawn from the same population. High stability increases confidence that selected features are not artifacts of a particular sample and are likely to generalize well.
The Nogueira stability metric is a prominent method for this quantification. It accounts for the overlap between selected feature subsets and corrects for chance selection [71]. For multiple feature selection runs, it is calculated as: [ \text{Stability} = \frac{2}{k(k-1)} \sum{i=1}^{k-1} \sum{j=i+1}^{k} \frac{|Si \cap Sj| - \mathbb{E}[|Si \cap Sj|]}{\sqrt{|Si| \cdot |Sj|}} ] where (Si) and (Sj) are the selected feature subsets in runs (i) and (j), (k) is the total number of runs, and (\mathbb{E}[|Si \cap Sj|]) is the expected size of the intersection by chance.
Experimental Protocol for Assessing Stability
A standardized experimental protocol is essential for obtaining reproducible and comparable stability measurements.
- Data Preparation: Begin with a complete multi-omics dataset (e.g., from TCGA), ensuring proper normalization and missing value imputation.
- Subsampling: Perform multiple iterations (e.g., 100) of random subsampling without replacement, typically retaining 80-90% of the original samples in each subset.
- Feature Selection: Apply the feature selection method of interest (e.g., Lasso-SVM, Logistic Regression with L1 penalty) to each data subset.
- Stability Calculation: For each iteration, record the set of selected features. Compute the pairwise stability between all selected feature sets using the Nogueira metric.
- Analysis: Correlate stability with model parameters (e.g., regularization strength) and performance metrics (e.g., prediction accuracy).
Key Findings on Feature Selection Stability
Recent empirical studies on cancer multi-omics data from TCGA have yielded critical insights:
- Regularization Strength: Higher L1 regularization (resulting in fewer selected features) generally leads to optimal feature-selection stability. Lower regularization, which selects more features, often decreases stability across all omics layers [71].
- Omics-Layer Variance: Stability varies significantly across different omics data types. For instance, miRNA data consistently demonstrates high stability, while mutation (DNA-seq) and RNA expression layers are typically less stable, particularly under weaker regularization [71].
- Classifier Performance: All classifiers with embedded feature selection (SVM, Logistic Regression, Lasso) can achieve high stability with appropriate regularization tuning, though the optimal setting may be omics-specific [71].
Validating Subtype Classification Accuracy
After feature selection and model training, the resulting classifier's ability to accurately predict cancer subtypes must be rigorously validated using a standard set of performance metrics.
Core Evaluation Metrics for Subtype Classification
The following metrics are fundamental for evaluating the performance of a multi-omics subtype classifier [72]. They should be reported collectively to provide a comprehensive view of model efficacy.
Table 1: Core Metrics for Evaluating Subtype Classification Models
| Metric | Calculation Formula | Interpretation |
|---|---|---|
| Accuracy (ACC) | (\frac{1}{N} \sum{i=1}^N \delta(yi, \text{map}(\hat{y}_i))) | Overall proportion of correctly classified samples. |
| Normalized Mutual Information (NMI) | (\frac{2 \times I(Y; \hat{Y})}{H(Y) + H(\hat{Y})}) | Measures the mutual dependence between true and predicted labels, normalized by entropy. |
| Adjusted Rand Index (ARI) | (\frac{2 \times (TP \cdot TN - FN \cdot FP)}{(TP+FN)(FN+TN)+(TP+FP)(FP+TN)}) | Measures the similarity between two clusterings/assignments, adjusted for chance. |
Experimental Protocol for Classification Validation
A robust validation workflow ensures that reported performance metrics are reliable and generalizable.
- Data Splitting: Partition the multi-omics dataset into a training set (e.g., 70-80%) and a held-out test set (e.g., 20-30%). The test set must not be used in any model training or feature selection steps.
- Feature Selection on Training Set: Apply the chosen feature selection method exclusively to the training data to identify the most informative feature subset.
- Model Training: Train the classification model (e.g., Deep Graph Convolutional Network, Autoencoder, ANN) using the selected features from the training set.
- Prediction and Evaluation: Use the trained model to predict subtypes for the held-out test set. Calculate Accuracy, NMI, and ARI by comparing predictions to the ground-truth labels.
Integrated Multi-Omics Workflows for Enhanced Accuracy
Advanced computational frameworks that integrate multiple omics layers have demonstrated superior performance over single-omics approaches by capturing the complex, nonlinear interactions within biological systems [30] [73] [74].
Workflow for Multi-Omics Integration and Classification
The following diagram illustrates a sophisticated deep learning workflow for multi-omics data integration and subtype classification, synthesizing methodologies from several state-of-the-art approaches [72] [73] [74].
Advanced Methodologies in Practice
- Shared and Specific Representation Learning (MOCSS): This method uses separate autoencoders for each omics type to extract both shared information (common across omics) and specific information (unique to each omic). Contrastive learning aligns shared representations, and orthogonality constraints reduce redundancy. The combined information is then used for clustering, demonstrating stronger capability for molecular subtyping [72].
- Deep Graph Convolutional Networks (DeepMoIC): This framework uses autoencoders to extract compact representations from each omics data type. A Patient Similarity Network (PSN) is constructed and integrated with the latent features using a Deep GCN. This approach effectively handles non-Euclidean data and explores high-order relationships between samples, leading to state-of-the-art classification performance on pan-cancer datasets [73].
- Biologically Explainable Feature Integration: This approach combines statistical feature selection with biological knowledge. It applies gene set enrichment analysis and Cox regression to identify survival-associated genes, then links these to targeting miRNAs and promoter methylation sites. An autoencoder integrates these pre-filtered, biologically relevant features, creating a latent space that effectively separates cancer types, stages, and subtypes, resulting in high classification accuracy and improved model explainability [74].
Successful multi-omics research relies on a foundation of high-quality data, robust computational tools, and well-characterized biological samples.
Table 2: Essential Research Reagents and Resources for Multi-Omics Studies
| Category / Item | Specific Examples | Function / Application |
|---|---|---|
| Public Data Repositories | The Cancer Genome Atlas (TCGA), International Cancer Genome Consortium (ICGC), DepMap (Cancer Dependency Map), Gene Expression Omnibus (GEO) | Provide large-scale, publicly available multi-omics datasets for model training, benchmarking, and validation [72] [68] [75]. |
| Curated Multi-omics Databases | DriverDBv4, GliomaDB, HCCDBv2 | Disease-specific databases that integrate multi-omics data from multiple sources and often include pre-processing and analysis tools [68]. |
| Feature Selection Algorithms | Lasso (L1 regularization), Random Forest (Permutation Importance), mRMR, RFE | Identify the most informative biomarkers from high-dimensional data, improving model performance and interpretability [70] [71]. |
| Multi-omics Integration Tools | Similarity Network Fusion (SNF), Multi-kernel Learning, JIVE, iCluster, DIABLO | Integrate diverse omics data types into a unified model for clustering, classification, and biomarker discovery [30] [72] [73]. |
| Deep Learning Frameworks | Variational Autoencoders (VAEs), Graph Convolutional Networks (GCNs), Standard Autoencoders (AEs) | Capture complex, non-linear relationships in multi-omics data for integration, dimensionality reduction, and classification [30] [73] [74]. |
The path to clinically viable precision medicine models hinges on the rigorous evaluation of both feature selection stability and subtype classification accuracy. As multi-omics technologies and AI methodologies continue to evolve, the adherence to standardized evaluation protocols and metrics outlined in this guide will be crucial. By prioritizing biological explainability, methodological robustness, and comprehensive validation, researchers can develop multi-omics models that not only achieve high predictive performance but also provide trustworthy insights for drug development and personalized therapeutic strategies.
Breast cancer (BC) is a critically important global health challenge and the most frequently diagnosed cancer among women worldwide [76] [77]. Its heterogeneous nature manifests through distinct molecular subtypes—Luminal A, Luminal B, HER2-positive, and triple-negative—each demonstrating unique clinical behaviors, treatment responses, and survival outcomes [78] [79]. This biological diversity poses significant challenges for accurate prognosis and treatment selection, particularly for long-term survival prediction beyond 5-10 years [77].
In precision medicine research, multi-omics approaches represent a transformative paradigm by integrating diverse molecular datasets including genomics, transcriptomics, epigenomics, proteomics, and metabolomics [79] [80]. These methodologies aim to capture the complex interplay between different biological layers, moving beyond the limitations of single-omics analyses that provide only partial insights into disease mechanisms [81] [76]. For breast cancer subtyping, multi-omics integration has demonstrated potential to reveal more robust prognostic clusters and identify novel biomarkers that transcend what can be discovered through individual omics analyses [82] [77].
This case study provides a comprehensive technical examination of computational frameworks for multi-omics integration in breast cancer subtyping, with emphasis on methodological approaches, comparative performance analyses, and experimental protocols. The focus encompasses both statistical and deep learning-based integration strategies, evaluated through rigorous benchmarks on clinical datasets with long-term follow-up.
Molecular Landscape of Breast Cancer Subtypes
The current molecular classification of breast cancer primarily relies on immunohistochemical expression of hormone receptors including estrogen receptor (ER), progesterone receptor (PR), human epidermal growth factor receptor 2 (HER2), and the proliferation marker Ki-67 [78]. These subtypes demonstrate distinct pathological features, clinical behaviors, and therapeutic responses:
- Luminal A: Characterized by ER+ and/or PR+ expression, HER2-negative status, and low Ki-67 levels (<20%). These tumors are generally low-grade, slow-growing, and demonstrate the most favorable prognosis with high response rates to hormone therapy [78].
- Luminal B: Typically ER+ but may be PR-negative, with either HER2-positive or HER2-negative status coupled with high Ki-67 levels (>20%). These intermediate/high-grade tumors exhibit more aggressive behavior than Luminal A and often require both hormonal therapy and chemotherapy [78].
- HER2-Positive: Defined by HER2 overexpression in the absence of ER and PR expression. This aggressive, fast-growing subtype has seen improved outcomes with the advent of HER2-targeted therapies [78].
- Triple-Negative Breast Cancer (TNBC): Characterized by the absence of ER, PR, and HER2 expression. This most aggressive subtype frequently affects younger women and demonstrates a pronounced tendency for early relapse and distant metastasis [78].
Table 1: Clinical Characteristics and Prognosis of Breast Cancer Molecular Subtypes
| Subtype | Receptor Status | Ki-67 Level | Incidence | 5-Year Survival | Treatment Response |
|---|---|---|---|---|---|
| Luminal A | ER+ and/or PR+, HER2- | Low (<20%) | ~60-70% | 94.4% | High response to hormone therapy |
| Luminal B | ER+, HER2+ or HER2- with high Ki-67 | High (>20%) | ~10-20% | 90.7% | Benefits from chemotherapy + hormone therapy |
| HER2-Positive | ER-, PR-, HER2+ | Variable | ~10-15% | 84.8% | Requires HER2-targeted therapies + chemotherapy |
| Triple-Negative | ER-, PR-, HER2- | High | ~15-20% | 77.1% | Limited targeted options; chemotherapy mainstay |
Substantial prognostic differences exist between these subtypes, with 5-year survival rates ranging from 94.4% for Luminal A to 77.1% for TNBC [78]. However, significant heterogeneity persists within these broad categories, necessitating more refined approaches to patient stratification [77]. Molecular profiling through multi-omics technologies provides unprecedented opportunities to characterize this heterogeneity more comprehensively, with potential to improve diagnostic precision, prognostic accuracy, and therapeutic targeting [79].
Multi-Omics Integration Methodologies
The integration of multiple omics datasets presents significant computational challenges due to differences in data dimensionality, measurement scales, and biological variance across omics layers [80]. Two primary computational paradigms have emerged for this integration: statistical-based approaches and deep learning-based frameworks.
Statistical Integration Frameworks
Statistical methods employ mathematical models to identify latent structures that explain variance across multiple omics datasets:
Multi-Omics Factor Analysis (MOFA+) is an unsupervised Bayesian framework that uses group factor analysis to infer a set of latent factors that capture common and specific sources of variability across different omics modalities [76] [77]. The model assumes that the observed multi-omics data is generated from a lower-dimensional latent representation, with sparsity-promoting priors to identify relevant features. MOFA+ generates three key outputs: (1) factors that represent the latent space capturing biological and technical sources of variability, (2) weights that indicate the importance of each feature for every factor, and (3) the percentage of variance explained by each factor in each omics dataset [76].
iClusterPlus implements a joint latent variable model based on a penalized Gaussian latent variable model, integrating multiple omics data types to identify clinically relevant cancer subtypes [80]. The framework uses lasso-type penalties for feature selection within a generalized linear regression framework to model associations between observed molecular data and latent tumor subtypes.
Deep Learning Approaches
Deep learning methods leverage neural networks to learn hierarchical representations from multi-omics data:
Multi-Omics Graph Convolutional Network (MOGCN) employs graph-based representations to model complex relationships between molecular features and patient samples [76]. The framework typically involves: (1) constructing patient similarity networks for each omics type, (2) using graph convolutional layers to learn feature representations that incorporate network topology, and (3) integrating these representations for final subtype prediction. Autoencoders are often incorporated for dimensionality reduction and noise reduction prior to network construction [76].
DiffRS-net introduces a robustness-aware Sparse Multi-View Canonical Correlation Analysis (SMCCA) to detect multi-way associations among differentially expressed genes across omics layers [83]. The framework incorporates a differential analysis step to identify statistically significant features, followed by multi-way association analysis and an attention mechanism for final classification. This approach specifically addresses the high-dimensionality challenge in biological datasets with limited samples [83].
Comparative Framework Analysis
Experimental Design and Benchmarking
Rigorous evaluation of multi-omics integration methods requires standardized datasets, consistent preprocessing protocols, and comprehensive performance metrics. The Cancer Genome Atlas Breast Invasive Carcinoma (TCGA-BRCA) dataset represents a primary resource, typically comprising mRNA expression, DNA methylation, and miRNA expression data for approximately 960-1100 patients [76] [83].
Table 2: Quantitative Performance Comparison of Multi-Omics Integration Methods
| Method | Approach Type | C-Index (Survival) | F1 Score (Subtyping) | Significant Survival Stratification | Key Advantages |
|---|---|---|---|---|---|
| MOFA+ | Statistical (Factor Analysis) | N/A | 0.75 (Nonlinear classifier) | 22/31 cancer types | Superior feature selection, biological interpretability |
| Genetic Programming Framework | Evolutionary Algorithm | 67.94 (test set) | N/A | Not specified | Adaptive feature selection, robust biomarker identification |
| MOGCN | Deep Learning (Graph CNN) | N/A | Lower than MOFA+ | Not specified | Captures complex nonlinear relationships |
| EMitool | Network Fusion | Not specified | Not specified | 22/31 cancer types | Explainable integration, quantifies omics contributions |
| DiffRS-net | Deep Learning (SMCCA) | N/A | High in binary/multi-class | Not specified | Addresses high-dimensionality challenge, detects multi-way associations |
Standard preprocessing pipelines typically include: (1) batch effect correction using ComBat or Harman methods [76], (2) removal of features with >50% zero expression across samples, and (3) normalization to account for technical variations. For feature selection, studies often standardize the number of selected features (e.g., top 100 features per omics layer) to ensure fair comparisons [76].
Evaluation metrics encompass both clinical relevance and computational performance:
- Clinical Relevance: Overall survival (OS) difference between subtypes using log-rank tests, hazard ratios from Cox proportional-hazards models [82] [77]
- Clustering Quality: Davies-Bouldin Index (DBI, lower values preferred), Calinski-Harabasz Index (CHI, higher values preferred) [76] [82]
- Classification Performance: F1-score, accuracy, precision, and recall for subtype prediction tasks [76] [83]
Performance Findings
Comparative analyses demonstrate that statistical approaches, particularly MOFA+, frequently outperform deep learning methods in feature selection and biological interpretability. In a comprehensive benchmarking study across 31 cancer types from TCGA, MOFA+ achieved significant survival stratification in 22 cancer types, compared to 20 for SNF and 18 for NEMO [82]. For breast cancer subtyping specifically, MOFA+ achieved an F1-score of 0.75 using a nonlinear classifier, identifying 121 biologically relevant pathways compared to 100 pathways identified by MOGCN [76].
The EMitool framework demonstrated superior clustering performance with lower DBI and higher CHI values compared to eight state-of-the-art methods, while providing explicit contribution scores for each omics type to enhance interpretability [82]. In survival analysis, a multi-omics framework utilizing genetic programming for adaptive integration achieved a concordance index (C-index) of 78.31 during cross-validation and 67.94 on the test set [81].
Deep learning methods like DiffRS-net excel in capturing complex nonlinear relationships but often require larger sample sizes and substantial computational resources [83]. The integration of multiple omics layers consistently outperforms single-omics approaches, with one study showing multi-omics integration achieving significantly better survival stratification compared to using only mRNA, methylation, or miRNA data alone [82].
Experimental Protocols
Data Processing and MOFA+ Integration
Sample Preparation and Data Generation
- Tissue Collection: Obtain fresh-frozen breast tumor specimens and matched normal adjacent tissues following surgical resection [76] [77]
- Nucleic Acid Extraction: Isolate DNA and RNA using commercial kits (e.g., Qiagen AllPrep DNA/RNA/miRNA kit) with quality verification (RIN > 7.0 for RNA, DIN > 7.0 for DNA) [76]
- Library Preparation and Sequencing:
- mRNA: Poly-A selection, Illumina TruSeq RNA library preparation, 75bp paired-end sequencing
- DNA Methylation: Illumina Infinium MethylationEPIC BeadChip array
- miRNA: QIAseq miRNA library kit, 50bp single-end sequencing [76]
Data Preprocessing Pipeline
- mRNA Data: STAR alignment to GRCh38, featureCounts for gene-level quantification, TPM normalization, combat batch correction [76]
- DNA Methylation: minfi preprocessing pipeline, β-value calculation, BMIQ normalization, removal of probes with detection p-value > 0.01 [76]
- miRNA Data: Bowtie alignment, miRBase21 reference, counts per million normalization, removal of lowly expressed features (<10 counts in >50% samples) [76]
MOFA+ Integration Protocol
- Input Data: Create a MultiAssayExperiment object with matched mRNA expression (20,531 features), DNA methylation (22,601 CpG sites), and miRNA expression (1,406 features) matrices for 960 samples [76]
- Model Training:
- Set convergence threshold: 1e-5
- Maximum iterations: 400,000
- Number of factors: Automatically determined (minimum variance explained: 5% in at least one omics) [76]
- Factor Interpretation:
Multi-Omics Cluster Validation
Survival Analysis Protocol
- Endpoint Definition: Overall survival (time from diagnosis to death from any cause) and breast cancer-specific survival [77] [84]
- Statistical Analysis:
- Kaplan-Meier curves with log-rank test for cluster comparison
- Univariable and multivariable Cox proportional hazards models
- Adjustment for clinical covariates (age, stage, grade) [77]
- Validation: Apply cluster centroids to independent datasets (METABRIC, TCGA) using k-nearest neighbors (k=10) [77]
Biological Characterization
- Pathway Analysis: Gene Set Enrichment Analysis (GSEA) using Hallmark and KEGG collections
- Network Construction: OmicsNet 2.0 with IntAct database for protein-protein interaction networks [76]
- Immune Microenvironment: CIBERSORTx for immune cell fraction estimation, correlation with cluster assignments [82]
Visualization of Methodological Workflows
Multi-Omics Integration and Subtyping Pipeline
Comparative Analysis Framework
Research Reagent Solutions
Table 3: Essential Research Reagents and Platforms for Multi-Omics Studies
| Reagent/Platform | Manufacturer | Function in Multi-Omics Workflow | Key Specifications |
|---|---|---|---|
| Qiagen AllPrep DNA/RNA/miRNA Kit | Qiagen | Simultaneous purification of genomic DNA, total RNA, and miRNA from single tissue sample | Maintains integrity of all molecular types; eliminates sample-to-sample variation |
| Illumina TruSeq RNA Library Prep Kit | Illumina | Library preparation for mRNA sequencing | Poly-A selection; strand-specific; compatible with low-input samples (100ng-1μg) |
| Illumina Infinium MethylationEPIC BeadChip | Illumina | Genome-wide DNA methylation profiling | >850,000 CpG sites; covers enhancer regions; low DNA requirement (250ng) |
| QIAseq miRNA Library Kit | Qiagen | miRNA sequencing library preparation | Minimal bias; unique molecular identifiers; input range 1ng-1μg |
| Dako HER2/neu Kit | Agilent Technologies | Immunohistochemical detection of HER2 protein | FDA-approved; semi-quantitative scoring (0 to 3+); companion diagnostic |
| Anti-Ki-67 Antibody (MIB-1) | Dako/Agilente | Detection of proliferation marker Ki-67 | Nuclear staining; prognostic value; cutoff ≥20% for high proliferation |
| OncoScan CNV Assay | Thermo Fisher | Copy number variation analysis | FFPE-compatible; detects LOH and UPD; resolution ~50-100 kb |
This comparative analysis demonstrates that multi-omics integration significantly advances breast cancer subtyping beyond conventional single-omics approaches. Statistical methods like MOFA+ provide superior interpretability and feature selection capabilities, while deep learning approaches excel at capturing complex nonlinear relationships. The optimal methodological selection depends on specific research objectives, dataset characteristics, and interpretability requirements.
For translational precision medicine applications, statistical frameworks offer immediate clinical applicability through biologically interpretable biomarkers and subtypes with validated prognostic significance. Deep learning methods represent promising avenues for future research as sample sizes increase and methodological transparency improves. The consistent outperformance of multi-omics approaches over single-omics analyses underscores the biological complexity of breast cancer and the necessity of integrative frameworks to capture its multifaceted nature.
Future directions should focus on: (1) standardized benchmarking platforms for method comparison, (2) incorporation of spatial omics technologies to address tumor heterogeneity, (3) development of more interpretable deep learning models, and (4) integration of real-world evidence and digital pathology data. As multi-omics technologies continue to evolve, they hold tremendous potential to redefine breast cancer classification and enable truly personalized treatment strategies based on comprehensive molecular profiling.
Conclusion
The integration of multi-omics data stands as a cornerstone for the future of precision medicine, offering an unparalleled, systems-level view of human health and disease. Success hinges on the strategic selection of integration methodologies—whether statistical or AI-driven—tailored to specific biological questions, and requires a concerted effort to overcome significant data heterogeneity and analytical challenges. Rigorous validation and biological interpretation are paramount to translating computational findings into clinically actionable insights. Future progress depends on fostering global collaboration to build diverse datasets, establishing gold standards for data integration and sharing, and seamlessly embedding these powerful analytical frameworks into clinical workflows. By doing so, the field will fully realize its potential to propel biomarker discovery, refine patient stratification, and ultimately usher in a new era of personalized, predictive, and preventive healthcare.
References
- 1. Genomics and multiomics in the age of precision medicine [https://www.nature.com/articles/s41390-025-04021-0]
- 2. Genomics and multiomics in the age of precision medicine [https://pubmed.ncbi.nlm.nih.gov/40185865/]
- 3. Integrating Multi-Omics for Precision Medicine: 2025 Guide [https://lifebit.ai/blog/integrating-multi-modal-genomic-and-multi-omics-data-for-precision-medicine/]
- 4. Microbiome-guided precision medicine: Mechanistic ... [https://www.sciencedirect.com/science/article/pii/S3050632825000186]
- 5. Lost in Translation: Turning Multi-omic Chaos into Clinical ... [https://www.precisionformedicine.com/blog/lost-in-translation-turning-multi-omics-chaos-into-clinical-clarity]
- 6. Multiomics Trends in 2025 | aimed analytics [https://aimed-analytics.com/blog/multiomics-trends-in-2025]
- 7. Genomic, Proteomic, and Metabolomic Data Integration ... - PMC [https://pmc.ncbi.nlm.nih.gov/articles/PMC4562606/]
- 8. A Single-Cell Omics Technical Guide for Advancing ... [https://www.mdpi.com/2073-4425/16/12/1394]
- 9. The Big 'Omics: Genomics, Transcriptomics, Proteomics, & ... [https://www.medreport.foundation/post/the-big-omics-genomics-transcriptomics-proteomics-metabolomics]
- 10. Whitepaper Mining Omics Data for Drug Discovery [https://www.evotec.com/page/whitepaper-mining-omics-data-for-drug-discovery]
- 11. Multi-omics single-cell data integration and regulatory ... [https://www.nature.com/articles/s41587-022-01284-4]
- 12. The Trifecta of Single-Cell, Systems-Biology, and Machine- ... [https://pmc.ncbi.nlm.nih.gov/articles/PMC8306972/]
- 13. Multi-Omics Integration for Advancing Glioma Precision ... [https://pubmed.ncbi.nlm.nih.gov/41249878/?dopt=abstract]
- 14. A Longitudinal Big Data Approach for Precision Health - PMC [https://pmc.ncbi.nlm.nih.gov/articles/PMC6713274/]
- 15. Multi-Omics Studies in Historically Excluded Populations [https://pmc.ncbi.nlm.nih.gov/articles/PMC10323857/]
- 16. Longitudinal omics modeling and integration in clinical ... [https://pmc.ncbi.nlm.nih.gov/articles/PMC4525019/]
- 17. Challenges, Strategies, and Perspectives for Reference ... [https://www.frontiersin.org/journals/genetics/articles/10.3389/fgene.2021.666244/full]
- 18. Longitudinal multi-omics study reveals common etiology ... [https://pmc.ncbi.nlm.nih.gov/articles/PMC10327285/]
- 19. The importance of diverse multiomics datasets and analyses [https://pmc.ncbi.nlm.nih.gov/articles/PMC11527434/]
- 20. Multi-omics data integration using ratio-based quantitative ... [https://www.nature.com/articles/s41587-023-01934-1]
- 21. Longitudinal Omics Data Analysis: A Review on Models, ... [https://arxiv.org/html/2506.11161v1]
- 22. Multi-Omics Integration for the Design of Novel Therapies and ... [https://pmc.ncbi.nlm.nih.gov/articles/PMC10594525/]
- 23. Navigating Challenges and Opportunities in Multi-Omics ... [https://pmc.ncbi.nlm.nih.gov/articles/PMC11274472/]
- 24. [2501.17729] A technical review of multi-omics data integration methods: from classical statistical to deep generative approaches [https://arxiv.org/abs/2501.17729]
- 25. A Guide to Multi-omics Integration Strategies - Front Line Genomics [https://frontlinegenomics.com/a-guide-to-multi-omics-integration-strategies/]
- 26. Algorithms and tools for data-driven omics integration to ... [https://translational-medicine.biomedcentral.com/articles/10.1186/s12967-025-06446-x]
- 27. GAUDI: interpretable multi-omics integration with UMAP ... [https://www.nature.com/articles/s41467-025-60822-1]
- 28. Visual analysis of multi-omics data - PMC [https://pmc.ncbi.nlm.nih.gov/articles/PMC11420163/]
- 29. Multi-omics strategies for biomarker discovery and ... [https://pubmed.ncbi.nlm.nih.gov/41269529/]
- 30. A technical review of multi-omics data integration methods [https://pmc.ncbi.nlm.nih.gov/articles/PMC12315550/]
- 31. The Role of a Genomics LIMS in Tackling Multi-Omics Data ... [https://freelims.org/the-role-of-a-genomics-lims-in-tackling-multi-omics-data-integration-challenges/]
- 32. Making Data Work: How AI and Multi-Omics Integration Are ... [https://ai.northeastern.edu/news/making-data-work]
- 33. AI-driven multi-omics integration in precision oncology [https://pubmed.ncbi.nlm.nih.gov/41266662/?utm_source=FeedFetcher&utm_medium=rss&utm_campaign=None&utm_content=0nK-FGmcPzruPpJferMpyd8mRld7hsB1ra05TRUDXN6&fc=None&ff=20251121055333&v=2.18.0.post22+67771e2]
- 34. Machine learning and multi-omics integration [https://translational-medicine.biomedcentral.com/articles/10.1186/s12967-025-06425-2]
- 35. AI-driven multi-omics integration for multi-scale predictive ... [https://www.sciencedirect.com/science/article/pii/S2001037024004513]
- 36. Flexynesis: A deep learning toolkit for bulk multi-omics data ... [https://www.nature.com/articles/s41467-025-63688-5]
- 37. MiBiOmics: an interactive web application for multi-omics data ... [https://bmcbioinformatics.biomedcentral.com/articles/10.1186/s12859-020-03921-8]
- 38. A review of multi-omics data integration through deep ... [https://www.frontiersin.org/journals/genetics/articles/10.3389/fgene.2023.1199087/full]
- 39. Multi-omics Data Integration, Interpretation, and Its Application [https://pmc.ncbi.nlm.nih.gov/articles/PMC7003173/]
- 40. Multiomics-based molecular subtyping based on the ... [https://molecular-cancer.biomedcentral.com/articles/10.1186/s12943-024-02017-8]
- 41. Identifying inflammatory bowel disease subtypes [https://pmc.ncbi.nlm.nih.gov/articles/PMC12344326/]
- 42. Ten quick tips for avoiding pitfalls in multi-omics data ... [https://journals.plos.org/ploscompbiol/article?id=10.1371/journal.pcbi.1011224]
- 43. Precision medicine in the era of multi-omics: can the data ... [https://pmc.ncbi.nlm.nih.gov/articles/PMC10539962/]
- 44. A roadmap for multi-omics data integration using deep ... [https://pmc.ncbi.nlm.nih.gov/articles/PMC8769688/]
- 45. Missing data in multi-omics integration: Recent advances ... [https://pmc.ncbi.nlm.nih.gov/articles/PMC9949722/]
- 46. a universal approach for learning in an HDLSS setting [https://arxiv.org/html/2507.06026v1]
- 47. Transforming Omics Data Management with ... [https://www.databricks.com/blog/transforming-omics-data-management-databricks-data-intelligence-platform]
- 48. Handling missing rows in multi-omics data integration [https://bmcbioinformatics.biomedcentral.com/articles/10.1186/s12859-016-1273-5]
- 49. Unveiling the Disparities in the Field of Precision Medicine [https://pmc.ncbi.nlm.nih.gov/articles/PMC12301505/]
- 50. Supporting Multi-omics Approaches [https://www.thermofisher.com/us/en/home/brands/thermo-scientific/molecular-biology/molecular-biology-learning-center/molecular-biology-resource-library/spotlight-articles/supporting-multi-omics-approaches.html]
- 51. Designing and interpreting 'multi-omic' experiments that may ... [https://pmc.ncbi.nlm.nih.gov/articles/PMC7477987/]
- 52. Multi-omics approaches to disease | Genome Biology | Full Text [https://genomebiology.biomedcentral.com/articles/10.1186/s13059-017-1215-1]
- 53. Multi-omic integration sets the path for early prevention ... [https://www.nature.com/articles/s41525-025-00491-7]
- 54. Generative Adversarial Networks–Enabled Human ... [https://www.frontiersin.org/journals/artificial-intelligence/articles/10.3389/frai.2021.604234/full]
- 55. The ethics of data mining in healthcare: challenges, ... [https://pmc.ncbi.nlm.nih.gov/articles/PMC12255135/]
- 56. 2025 and Beyond: The Future of Genomic Data Analysis ... [https://blog.crownbio.com/2025-and-beyond-the-future-of-genomic-data-analysis-and-innovations-in-genomics-services]
- 57. OmnibusX: A unified platform for accessible multi-omics ... [https://pmc.ncbi.nlm.nih.gov/articles/PMC12431643/]
- 58. Comprehensive multi-omics and machine learning ... [https://www.nature.com/articles/s41598-025-09742-0]
- 59. Comparative analysis of statistical and deep learning-based ... [https://pmc.ncbi.nlm.nih.gov/articles/PMC12210783/]
- 60. Comparative analysis of statistical and deep learning ... [https://pubmed.ncbi.nlm.nih.gov/40598554/]
- 61. Unlocking precision medicine: Innovative strategies for ... [https://www.sciencedirect.com/science/article/pii/S2950523224000010]
- 62. Effective integration of multi-omics with prior knowledge to ... [https://www.nature.com/articles/s41540-025-00519-9]
- 63. MoGCN: A Multi-Omics Integration Method Based on ... [https://pmc.ncbi.nlm.nih.gov/articles/PMC8847688/]
- 64. MoGCN: A Multi-Omics Integration Method Based on ... [https://www.frontiersin.org/journals/genetics/articles/10.3389/fgene.2022.806842/full]
- 65. MOFA+: a statistical framework for comprehensive integration ... [https://genomebiology.biomedcentral.com/articles/10.1186/s13059-020-02015-1]
- 66. Lifoof/MoGCN: Multi-omics integration method using AE ... [https://github.com/Lifoof/MoGCN]
- 67. MOFA | Multi-Omics Factor Analysis - GitHub Pages [https://biofam.github.io/MOFA2/]
- 68. Multi-omics strategies for biomarker discovery and application ... [https://pmc.ncbi.nlm.nih.gov/articles/PMC12638490/]
- 69. Research Article Benchmarking feature selection and ... [https://www.sciencedirect.com/science/article/pii/S2001037024000692]
- 70. Utilizing Feature Selection Techniques for AI-Driven Tumor ... [https://www.mdpi.com/2218-273X/15/1/81]
- 71. Stability of Feature Selection in Multi-Omics Data Analysis [https://www.mdpi.com/2076-3417/14/23/11103]
- 72. MOCSS: Multi-omics data clustering and cancer subtyping ... [https://pmc.ncbi.nlm.nih.gov/articles/PMC10407241/]
- 73. DeepMoIC: multi-omics data integration via deep graph ... [https://bmcgenomics.biomedcentral.com/articles/10.1186/s12864-024-11112-5]
- 74. Biologically explainable multi-omics feature demonstrates ... [https://www.nature.com/articles/s41598-025-24352-6]
- 75. Biomarker Identification & Validation with Multi-omics & AI [https://ardigen.com/discover-the-full-potential-of-biomarkers-identification-and-validation/]
- 76. Comparative analysis of statistical and deep learning-based ... [https://translational-medicine.biomedcentral.com/articles/10.1186/s12967-025-06662-5]
- 77. Comprehensive multi-omics analysis of breast cancer ... [https://www.nature.com/articles/s41389-024-00521-6]
- 78. Subtypes of Breast Cancer - NCBI - NIH [https://www.ncbi.nlm.nih.gov/books/NBK583808/]
- 79. Breast cancer in the era of integrating “Omics” approaches [https://www.nature.com/articles/s41389-022-00393-8]
- 80. Integrative Multi-Omics Approaches in Cancer Research [https://pmc.ncbi.nlm.nih.gov/articles/PMC8334347/]
- 81. Adaptive multi-omics integration framework for breast ... [https://www.nature.com/articles/s41598-025-22202-z]
- 82. EMitool: Explainable Multi-Omics Integration for Disease ... [https://pmc.ncbi.nlm.nih.gov/articles/PMC12072579/]
- 83. DiffRS-net: A Novel Framework for Classifying Breast ... [https://www.mdpi.com/2076-3417/14/7/2728]
- 84. Molecular subtypes as a prognostic breast cancer factor in ... [https://pmc.ncbi.nlm.nih.gov/articles/PMC10229073/]