Integrative Omics for Understanding Disease Mechanisms: From Multi-Layer Data to Precision Medicine
This article provides a comprehensive exploration of integrative multi-omics, a transformative approach that combines data from genomics, transcriptomics, proteomics, and metabolomics to unravel complex disease mechanisms.
Integrative Omics for Understanding Disease Mechanisms: From Multi-Layer Data to Precision Medicine
Abstract
This article provides a comprehensive exploration of integrative multi-omics, a transformative approach that combines data from genomics, transcriptomics, proteomics, and metabolomics to unravel complex disease mechanisms. Tailored for researchers, scientists, and drug development professionals, it covers the foundational principles of why single-omics analyses are insufficient for capturing biological complexity. It delves into cutting-edge methodological frameworks, including machine learning, foundation models, and network-based integration, highlighting their application in target discovery and personalized therapy. The content also addresses critical troubleshooting strategies for data heterogeneity and analytical challenges, and presents rigorous validation through case studies in oncology and neurodegeneration. By synthesizing current trends and real-world applications, this article serves as a guide for leveraging integrative omics to accelerate the translation of molecular insights into clinical breakthroughs.
Beyond the Blueprint: How Integrative Omics Reveals the Multi-Layered Nature of Disease
Biological systems, from individual cells to whole organisms, operate through the complex and dynamic interplay of multiple molecular layers. For decades, traditional single-omics approaches—which analyze one type of biological molecule in isolation—have provided valuable but fundamentally limited insights into these systems. The core limitation of single-omics technologies lies in their inherent inability to capture the multidimensional nature of biological processes, resulting in a fragmented view that obscures the complete functional landscape of cells and tissues [1] [2]. While well-established single-omics methods like bulk RNA sequencing have revolutionized biomedical science by enabling detailed exploration of genetic information, they represent an average across heterogeneous cell populations, merely reflecting the characteristics of cell populations or perhaps predominantly the information of the most numerous cells [1]. This approach inevitably masks critical cellular nuances, including cellular heterogeneity, rare cell populations, and the complex regulatory networks that drive disease mechanisms [2].
The transition from single-omics to multi-omics represents a paradigm shift in biological research, moving from isolated observations to integrated systems-level analysis. Single-cell RNA sequencing (scRNA-seq) marked a significant advancement over bulk sequencing by revealing cellular state and intercellular heterogeneity [1]. However, cellular information extends well beyond RNA sequencing, encompassing the genome, epigenome, proteome, metabolome, and crucial details about spatial relationships and dynamic alterations [1]. The limitations of single-omics approaches have become increasingly apparent as researchers recognize that most health-related traits result from the interaction of multiple internal features/alterations with multiple external conditions over a lifespan [3]. This review examines the technical and conceptual limitations of single-omics approaches, demonstrates their consequences through case studies, and illustrates how integrative multi-omics frameworks address these shortcomings to provide a more comprehensive understanding of disease mechanisms.
Fundamental Technical Limitations of Single-Omics Approaches
The Averaging Problem: Concealing Cellular Heterogeneity
Traditional bulk omics approaches average signals from heterogeneous cell populations, obscuring important cellular nuances and rare cell populations that may play critical roles in disease development and progression [2]. This averaging effect is particularly problematic in complex tissues like tumors, which contain diverse cell types including cancer stem cells, immune cells, and stromal cells, each contributing differently to disease pathology and treatment response [1]. While single-cell technologies have begun to address this issue, single-cell mono-omics still provides only a partial view of cellular heterogeneity, capturing just one dimension of the complex molecular landscape that defines true cellular identity and function [4].
Inability to Establish Causal Relationships
Single-omics data cannot establish causal relationships between different molecular layers, a critical limitation for understanding disease mechanisms. For instance, genomic data alone can identify disease-associated mutations, but not all mutations lead to disease phenotypes [5]. Without integrating transcriptomic, proteomic, and other molecular data, researchers cannot determine how genetic variations manifest functionally or distinguish causal mutations from inconsequential ones [5]. This represents a fundamental gap in the chain of understanding biological systems, as biological processes are driven by interactions between omics layers, and no single data type can capture the complexity of all factors relevant to understanding a phenomenon such as a disease [6].
Table 1: Key Limitations of Single-Omics Approaches in Disease Research
| Limitation Category | Specific Technical Shortcoming | Impact on Disease Research |
|---|---|---|
| Resolution Limitations | Averaging effects in bulk sequencing | Masks cellular heterogeneity and rare cell populations critical in cancer and developmental disorders |
| Mechanistic Insight Gaps | Inability to establish causal relationships between molecular layers | Prevents understanding of how genetic variants lead to functional consequences and disease phenotypes |
| Regulatory Blind Spots | Limited view of epigenetic regulation and post-translational modifications | Misses key regulatory mechanisms that drive disease progression without genomic alterations |
| Temporal Limitations | Static snapshots of dynamic processes | Fails to capture disease progression dynamics and cellular state transitions |
| Spatial Limitations | Loss of spatial context in most sequencing approaches | Eliminates crucial information about tissue microenvironment and cell-cell communication |
Regulatory Blind Spots and Missing Context
Single-omics approaches suffer from significant blind spots in capturing regulatory mechanisms. For example, scRNA-seq reveals which genes are being transcribed but cannot determine which transcripts are actually translated into proteins or how protein function is modified post-translationally [5]. Similarly, measuring chromatin accessibility alone without corresponding gene expression data provides an incomplete picture of regulatory activity, as accessible regions do not necessarily correspond to active regulation without transcriptional output [4]. These limitations are particularly problematic for understanding complex diseases like cancer, where epigenetic reprogramming and post-translational modifications often drive malignancy without underlying genomic alterations [7].
Consequences in Practice: Case Studies Highlighting Single-Omics Shortcomings
Limited Predictive Power in Disease Diagnostics
Single-omics approaches have demonstrated limited predictive ability when implemented in clinical or public health domains [3]. The relatively poor predictive ability of genomic data alone can be partly explained by the large variation of health-related traits explained by non-omics data, such as clinical and epidemiological variables [3]. For instance, in cancer research, single-omics biomarkers discovered in small cohorts often fail to validate across larger populations with different backgrounds, exposures, and comorbidities [5]. This lack of robustness stems from the inability of single-omics approaches to capture the complex, multifactorial nature of disease states, where multiple molecular layers interact to determine phenotypic outcomes.
Incomplete Disease Mechanism Elucidation
The fragmentation inherent in single-omics approaches often leads to incomplete or misleading conclusions about disease mechanisms. A notable example comes from cancer research, where integrating single-cell transcriptomics and metabolomics data was necessary to delineate how NNMT-mediated metabolic reprogramming drives lymph node metastasis in esophageal squamous cell carcinoma through modulation of E-cadherin expression [6]. This cross-level, multidimensional molecular profiling provided novel insights into disease mechanisms that would have been impossible to obtain from either transcriptomic or metabolomic data alone. Similarly, in COVID-19 research, integrative approaches were required to understand how the virus alters host gene expression and signaling pathways, leading to effective drug repurposing strategies [7].
Table 2: Experimental Methodologies Revealing Single-Omics Limitations Through Multi-Omics Integration
| Experimental Methodology | Omics Layers Integrated | Key Finding Enabled by Integration |
|---|---|---|
| Perturb-seq/CROP-seq | RNA expression + DNA perturbation | Maps information-rich genotype-phenotype landscapes by linking genetic perturbations to transcriptional outcomes [4] [7] |
| CITE-seq/REAP-seq | RNA expression + Protein expression | Reveals discrepancies between transcriptional activity and actual protein abundance, providing more accurate functional profiling [4] [1] |
| SNARE-seq/SHARE-seq | RNA expression + Chromatin accessibility | Identifies active regulatory sequences and their target genes, elucidating gene regulatory mechanisms [4] [8] |
| scNMT-seq | RNA expression + DNA methylation + Chromatin accessibility | Enables triple-omics integration to comprehensively profile epigenetic regulation and its functional outcomes [4] |
| ECCITE-seq | RNA expression + Protein expression + T cell receptor + Perturbation | Provides integrated immune profiling by capturing transcriptome, surface proteins, and immune receptor sequences simultaneously [4] |
Inefficient Drug Target Identification
Target-based drug discovery relying on single-omics data has faced high failure rates due to incomplete understanding of drug mechanisms and biological complexity [7]. Traditional approaches that rely on single-omics data, such as genomics or transcriptomics alone, often fall short in capturing the causal biological mechanisms underlying disease [5]. For example, in cancer drug discovery, targets identified through genomic approaches alone may not account for post-translational modifications, protein-protein interactions, or metabolic adaptations that significantly influence drug response [6]. The resurgence of phenotypic screening signals a shift back to a biology-first approach, made exponentially more powerful by modern omics data integration, as it allows researchers to observe how cells or organisms respond to perturbations without presupposing a target [7].
How Multi-Omics Integration Overcomes Single-Omics Limitations
Conceptual Framework for Data Integration
Multi-omics integration methods provide frameworks to overcome the fragmentation of single-omics approaches through several computational strategies. These include feature projection methods like canonical correlation analysis and manifold alignment that investigate relationships between variables by capturing anchors maximally correlated across datasets; Bayesian modeling that uses variational inference to model probabilistic relationships between different molecular layers; regression modeling that establishes quantitative relationships between omics layers; and decomposition approaches that break down complex multi-omics data into interpretable components [4]. More recently, network-based integration methods have emerged as powerful tools that incorporate biological network information (protein-protein interactions, metabolic pathways, gene regulatory networks) to integrate multiple layers of molecular data within their biological context [6]. These methods recognize that biomolecules do not perform their functions alone but interact to form biological networks, and that disease states often result from pathway disruptions rather than isolated molecular alterations [6].
Practical Implementation and Workflow
The practical implementation of multi-omics integration involves sophisticated computational frameworks designed to handle the distinct feature spaces of different omics modalities. Methods like GLUE (graph-linked unified embedding) address the fundamental challenge of integrating unpaired multi-omics data by modeling regulatory interactions across omics layers explicitly through a knowledge-based guidance graph [8]. This approach bridges different omics-specific feature spaces in a biologically intuitive manner while maintaining scalability to large datasets [8]. The integration workflow typically involves several key steps: (1) processing each omics layer using modality-specific models that account for technical noise and biological variability; (2) constructing or incorporating prior knowledge about cross-omics interactions; (3) aligning cells across modalities using advanced algorithms that preserve biological variation while removing technical artifacts; and (4) performing downstream analysis on the integrated space to extract biological insights [8].
Single-Omics vs. Multi-Omics Approaches
Research Reagent Solutions for Multi-Omics Studies
Table 3: Essential Research Reagents and Platforms for Multi-Omics Investigations
| Reagent/Platform | Function | Key Application in Multi-Omics |
|---|---|---|
| 10X Genomics Multiome | Simultaneous measurement of RNA expression and chromatin accessibility | Linked analysis of gene regulation and transcriptional output [8] |
| CITE-seq Antibodies | Oligo-tagged antibodies for protein detection | Integrated transcriptome and proteome analysis at single-cell resolution [4] [1] |
| Cell Painting Assay | Fluorescent dye-based profiling of cell morphology | Connection of morphological phenotypes with molecular profiles [7] |
| Perturb-seq Libraries | CRISPR guides paired with transcriptomic profiling | High-throughput functional screening linking genetic perturbations to transcriptional outcomes [4] [7] |
| Single-Cell Barcoding | DNA oligonucleotides for sample multiplexing | Reduction of batch effects in large-scale studies through sample pooling [1] |
The limitations of single-omics approaches fundamentally stem from their fragmented nature, which cannot capture the complex, interconnected reality of biological systems. As we have explored, these limitations include the concealing of cellular heterogeneity, inability to establish causal relationships between molecular layers, regulatory blind spots, and ultimately insufficient predictive power for clinical applications. The consequences manifest in incomplete disease mechanism elucidation and inefficient drug target identification, highlighting the critical need for paradigm shift in how we approach biological investigation.
Multi-omics integration represents this necessary evolution, moving from isolated observations to systems-level understanding. By simultaneously measuring and integrating multiple molecular dimensions, researchers can unravel the complex interactions and regulatory networks that underlie disease pathogenesis. The integrative frameworks and methodologies discussed provide a path forward, enabling researchers to construct comprehensive molecular maps that account for the true complexity of biological systems. As these approaches continue to mature and become more accessible, they hold the promise of revolutionizing our understanding of disease mechanisms and accelerating the development of more effective, personalized therapeutic strategies.
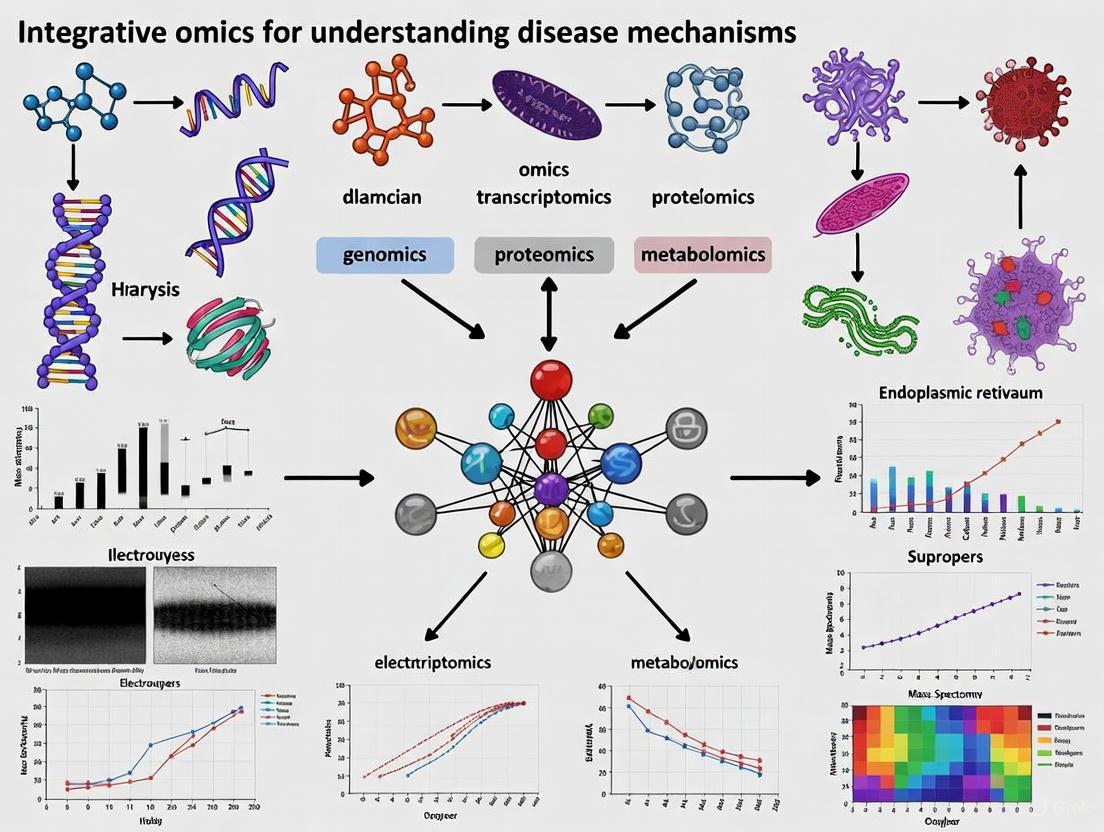
In the pursuit of understanding complex disease mechanisms, biomedical research has undergone a paradigm shift from reductionist approaches to global-integrative strategies that view biological systems as interconnected networks. This transformation has been fueled by the rise of 'omics' sciences—high-throughput technologies that enable the comprehensive study of an organism's molecular constituents. The core omics layers—genomics, transcriptomics, proteomics, and metabolomics—form a hierarchical framework that mirrors the central dogma of biology while capturing the dynamic complexity of living systems [9] [10]. When integrated, these layers provide a multidimensional perspective of biological phenomena, offering unprecedented opportunities to unravel the intricate molecular underpinnings of health and disease [11].
The fundamental value of multi-omics integration lies in its ability to bridge the gap between genetic blueprint and phenotypic manifestation. While genomics provides the static instruction manual, the subsequent layers capture the dynamic responses and functional outputs that ultimately determine cellular fate in both physiological and pathological states [9] [11]. For researchers and drug development professionals, this integrated approach enables the identification of novel biomarkers, reveals dysregulated pathways, uncovers disease subtypes, and identifies potential therapeutic targets that might remain invisible when examining single omics layers in isolation [12]. The following sections delineate each core omics layer, their technologies, methodologies, and their collective power in advancing precision medicine.
Defining the Core Omics Layers
Genomics
Genomics is the study of an organism's complete set of DNA, including all of its genes and the non-coding regions that comprise the majority of the genome [9] [10]. The genome represents the fundamental blueprint of an organism, containing the inherited instructions that guide development, functioning, and reproduction. Beyond merely sequencing DNA, genomics encompasses functional genomics (studying gene functions), comparative genomics (comparing genes across species), and structural genomics (determining 3D protein structures) [9].
In disease research, genomic approaches aim to identify variations in DNA sequence that correlate with or directly cause pathological states. These variations range from single nucleotide polymorphisms (SNPs)—variations at a single DNA base pair—to larger structural variations such as copy number variations (CNVs), insertions, deletions, and inversions [11] [10]. Genome-wide association studies (GWAS) represent a powerful application of genomics, scanning genomes from multiple individuals to identify genetic markers associated with specific diseases [11]. The completion of the Human Genome Project provided the foundational reference sequence against which individual variations can be identified, paving the way for personalized medicine approaches that account for an individual's unique genetic makeup [10].
Transcriptomics
Transcriptomics involves the comprehensive study of an organism's complete set of RNA transcripts, known as the transcriptome [9] [11]. This layer captures the expression dynamics of protein-coding messenger RNAs (mRNAs) and various non-coding RNAs (including long non-coding RNAs, microRNAs, and circular RNAs) that regulate gene expression at multiple levels [11]. The transcriptome serves as a critical intermediary between the static genetic code and the functional protein machinery, reflecting the genes that are actively expressed at a specific time under specific conditions.
Unlike the relatively stable genome, the transcriptome is highly dynamic, changing rapidly in response to environmental stimuli, developmental cues, and disease states [11]. Transcriptomic analyses can reveal how cells regulate gene expression—which genes are turned on or off, and to what degree—in healthy versus diseased tissues. In cancer research, for example, transcriptomics can identify gene fusions and alternative splicing events that contribute to oncogenesis [13]. Single-cell transcriptomics has emerged as a particularly powerful approach, enabling researchers to profile gene expression patterns in individual cells, thereby uncovering cellular heterogeneity within tissues that bulk analyses would average out [11].
Proteomics
Proteomics is the large-scale study of the entire complement of proteins—the proteome—in a biological system at a specific point in time [9]. Proteins serve as the primary functional actors within cells, performing countless tasks including structural support, catalysis of biochemical reactions, signal transduction, and molecular transport. The proteome is exceptionally complex and dynamic, with protein abundance, localization, modifications, and interactions constantly changing in response to intracellular and extracellular signals.
Proteomic analyses provide critical information that cannot be inferred from genomic or transcriptomic data alone, due to post-transcriptional regulation, varying protein half-lives, and extensive post-translational modifications (PTMs) such as phosphorylation, glycosylation, and ubiquitination that profoundly affect protein function [11]. Mass spectrometry-based techniques have become the cornerstone of modern proteomics, enabling the identification and quantification of thousands of proteins simultaneously [13]. Applications in disease research include comparing protein expression profiles between healthy and diseased tissues, mapping protein-protein interaction networks dysregulated in pathology, and identifying PTM patterns that alter cellular signaling in disorders such as Alzheimer's disease and cancer [11].
Metabolomics
Metabolomics focuses on the systematic study of small molecule metabolites, typically under 1,500 Da in molecular weight, that represent the end products of cellular processes [9]. The metabolome provides a direct readout of cellular activity and physiological status, capturing the ultimate response of a biological system to genetic, environmental, or therapeutic influences. Metabolites include substrates, intermediates, and products of metabolic pathways—such as carbohydrates, lipids, amino acids, and nucleotides—that reflect the functional outcome of molecular events at the genomic, transcriptomic, and proteomic levels.
Because metabolites are directly involved in cellular energy production, biosynthesis, and catabolism, their levels can immediately reflect pathological disruptions to homeostasis [9] [11]. Metabolomics is particularly valuable in translational research for identifying diagnostic biomarkers, understanding disease mechanisms, and monitoring therapeutic responses [13]. The close relationship between metabolite profiles and phenotype makes metabolomics a powerful tool for connecting molecular signatures to clinical manifestations, such as distinguishing metabolic subtypes of tumors or identifying circulating biomarkers for early disease detection [11].
Methodologies and Technologies for Omics Data Generation
The technological revolution in high-throughput analytical methods has been the driving force behind the rise of omics sciences. Each omics layer relies on specialized platforms and protocols designed to capture its particular class of biomolecules comprehensively and accurately.
Table 1: Core Technologies for Omics Data Generation
| Omics Layer | Primary Technologies | Key Applications in Disease Research | Sample Requirements |
|---|---|---|---|
| Genomics | Next-generation sequencing (NGS), Sanger sequencing, DNA microarrays, Third-generation sequencing (PacBio, ONT) | GWAS, variant discovery (SNPs, CNVs), whole genome/exome sequencing, cancer genomics | DNA from blood, tissue, or cells; varying input amounts based on platform |
| Transcriptomics | RNA sequencing (RNA-seq), single-cell RNA-seq (scRNA-seq), microarrays, nanostring | Gene expression profiling, alternative splicing analysis, biomarker discovery, single-cell heterogeneity | High-quality RNA (RIN >7-8); fresh-frozen tissue optimal; specific protocols for single-cell |
| Proteomics | Mass spectrometry (Orbitrap, MALDI-TOF, FT-ICR), affinity proteomics, protein microarrays | Protein expression quantification, post-translational modification analysis, protein-protein interactions, biomarker validation | Tissue lysates, biofluids; protein extraction with protease/phosphatase inhibitors |
| Metabolomics | LC-MS/MS, GC-MS, NMR spectroscopy, Raman spectroscopy | Metabolic pathway analysis, biomarker discovery, drug metabolism studies, toxicology | Serum, plasma, urine, tissue; rapid quenching of metabolism required |
Genomic Technologies and Protocols
Genomic analysis has evolved dramatically from low-throughput Sanger sequencing to highly parallelized next-generation sequencing (NGS) platforms [10]. The standard workflow begins with DNA extraction and quality control, followed by library preparation where DNA is fragmented and adapter sequences are ligated. For whole genome sequencing, these libraries are sequenced using platforms such as Illumina, which utilizes sequencing-by-synthesis with fluorescently labeled nucleotides, or third-generation platforms like PacBio and Oxford Nanopore that generate long reads ideal for resolving complex genomic regions [13]. For focused analyses, targeted sequencing panels or exome sequencing capture specific regions of interest using hybridization-based probes. Data analysis involves alignment to a reference genome (e.g., GRCh38), variant calling using tools like GATK, and annotation to determine potential functional consequences of identified variants [10].
Transcriptomic Technologies and Protocols
Transcriptomic profiling typically begins with RNA extraction, with careful attention to RNA integrity since degradation significantly impacts data quality. For bulk RNA-seq, mRNA is selected using poly-A capture or ribosomal RNA depletion, followed by cDNA synthesis, library preparation, and sequencing [13]. Single-cell RNA-seq requires specialized protocols such as CEL-seq2 or Drop-seq that incorporate cell-specific barcodes during reverse transcription, enabling transcriptome profiling of thousands of individual cells in parallel [13]. Bioinformatics pipelines for transcriptomics include quality control (FastQC), alignment (STAR, HISAT2), quantification (featureCounts, HTSeq), and differential expression analysis (DESeq2, edgeR) [11]. For non-coding RNA analysis, specific library preparation methods that capture small RNAs or long non-coding RNAs are employed.
Proteomic Technologies and Protocols
Mass spectrometry-based proteomics represents the gold standard for comprehensive protein analysis [13]. The typical workflow involves protein extraction, digestion (usually with trypsin), peptide separation via liquid chromatography, and analysis by tandem mass spectrometry. Label-free quantification compares peptide intensities across runs, while isobaric labeling methods (TMT, iTRAQ) enable multiplexed analysis of multiple samples simultaneously [11]. Post-translational modification analysis requires specialized enrichment strategies—immunoprecipitation for ubiquitination, metal oxide chromatography for phosphorylation—prior to MS analysis [11]. Data processing involves peptide identification (using search engines like MaxQuant), protein inference, and quantification. Alternative approaches include affinity-based methods such as antibody arrays or reverse-phase protein arrays that offer higher throughput for targeted protein quantification [13].
Metabolomic Technologies and Protocols
Metabolomic analyses employ either targeted approaches (quantifying a predefined set of metabolites) or untargeted approaches (comprehensively measuring all detectable metabolites) [11]. Sample preparation is critical and varies by analyte class; protein precipitation is common for biofluids, while tissue extraction often uses dual-phase methods to capture both hydrophilic and lipophilic metabolites. Liquid chromatography coupled to mass spectrometry (LC-MS) is the workhorse of metabolomics, with different chromatographic methods (reversed-phase, HILIC, ion-pairing) employed to separate diverse metabolite classes [13]. Gas chromatography-MS (GC-MS) provides excellent separation for volatile compounds, while nuclear magnetic resonance (NMR) spectroscopy offers non-destructive analysis with minimal sample preparation [13]. Data processing includes peak detection, alignment, and metabolite identification using spectral libraries, followed by statistical analysis to identify differentially abundant metabolites.
Multi-Omics Integration for Disease Mechanism Research
The true power of omics approaches emerges when multiple layers are integrated to construct comprehensive molecular models of disease pathogenesis. Multi-omics integration can be categorized into horizontal (within-omics) and vertical (cross-omics) approaches [14]. Horizontal integration combines datasets of the same omics type across different batches, platforms, or studies to increase statistical power and robustness. Vertical integration combines different omics modalities from the same set of samples to reveal interconnected molecular networks and causal relationships [12].
In practice, multi-omics integration serves several critical functions in disease research: (1) detecting disease-associated molecular patterns across multiple biological layers; (2) identifying molecular subtypes of diseases with distinct clinical outcomes; (3) understanding regulatory processes underlying disease pathogenesis; (4) improving diagnosis and prognosis through combinatorial biomarkers; and (5) predicting drug response based on multi-parametric molecular profiles [12]. For example, integrating genomic, transcriptomic, and proteomic data from tumor samples can reveal how specific mutations alter signaling pathways through changes in protein expression and activity, providing insights for targeted therapy development [11].
Computational methods for multi-omics integration range from correlation-based approaches that identify associations between different molecular layers, to network-based methods that model complex interactions, to machine learning and deep learning algorithms that predict clinical outcomes from high-dimensional multi-omics data [11]. The emergence of single-cell multi-omics and spatial omics technologies now enables researchers to capture multiple omics layers while preserving cellular resolution and tissue context, providing unprecedented insights into cellular heterogeneity and microenvironmental interactions in diseased tissues [11].
Diagram 1: Multi-Omics Integration in Disease Research. This workflow illustrates the hierarchical relationships between core omics layers and their applications in disease mechanism studies.
Essential Research Reagents and Reference Materials
Robust multi-omics research requires well-characterized reagents and reference materials that ensure analytical validity and reproducibility across experiments and laboratories. The table below outlines essential research solutions for generating high-quality multi-omics data.
Table 2: Essential Research Reagent Solutions for Multi-Omics Studies
| Reagent Category | Specific Examples | Function and Application | Quality Considerations |
|---|---|---|---|
| Reference Materials | Quartet reference materials (DNA, RNA, protein, metabolites), NIST reference materials, Coriell cell lines | Platform calibration, batch effect correction, proficiency testing, quality control | Stability, commutability, well-characterized properties, representation of diversity |
| Nucleic Acid Extraction Kits | Qiagen DNeasy/RNeasy kits, Promega Maxwell kits, Zymo Research kits | High-quality DNA/RNA isolation from diverse sample types | Yield, purity (A260/280 ratio), integrity (RIN for RNA), removal of inhibitors |
| Library Preparation Kits | Illumina Nextera, KAPA HyperPrep, NEB Next kits | Preparation of sequencing libraries from nucleic acids | Efficiency, bias, complexity, compatibility with downstream platforms |
| Mass Spectrometry Standards | Pierce Quantitative standards, iRT kits, Stable isotope-labeled internal standards | Retention time calibration, quantitative accuracy, instrument performance monitoring | Purity, solubility, stability, concentration accuracy |
| Chromatography Columns | Waters Acquity, Thermo Accucore, Agilent ZORBAX | Separation of analytes prior to mass spectrometry analysis | Reproducibility, peak shape, pressure stability, lifetime |
| Bioinformatics Tools | GATK, DESeq2, MaxQuant, XCMS, MOFA | Data processing, quality control, statistical analysis, data integration | Documentation, active development, community support, benchmarking |
The emergence of multi-omics reference materials, such as the Quartet suite developed from B-lymphoblastoid cell lines of a family quartet, represents a significant advancement for quality assurance in integrative studies [14]. These materials provide "built-in truth" defined by genetic relationships and the central dogma of information flow from DNA to RNA to protein, enabling objective assessment of data quality and integration methods across platforms and laboratories [14]. Ratio-based profiling approaches that scale absolute feature values of study samples relative to concurrently measured common reference samples have demonstrated improved reproducibility and comparability for multi-omics data integration [14].
The core omics layers—genomics, transcriptomics, proteomics, and metabolomics—provide complementary and increasingly comprehensive views of biological systems that are transforming our approach to understanding disease mechanisms. While each layer offers valuable insights independently, their integration through multi-omics strategies captures the complexity and dynamics of pathological processes more completely than any single approach. For researchers and drug development professionals, these technologies offer powerful tools for biomarker discovery, disease subtyping, target identification, and therapeutic monitoring.
Despite remarkable progress, challenges remain in standardizing methodologies, managing computational complexity, integrating diverse data types, and translating findings into clinical applications. The development of robust reference materials, improved computational integration methods, and standardized protocols will be crucial for advancing the field. As technologies continue to evolve—particularly in single-cell and spatial omics—and as large-scale initiatives such as the Multi-Omics for Health and Disease Consortium generate increasingly comprehensive datasets, integrative omics approaches promise to deepen our understanding of disease pathogenesis and accelerate the development of precision medicine interventions [15]. Through continued methodological refinement and collaborative science, multi-omics integration will undoubtedly play an increasingly central role in biomedical research and therapeutic development.
The sequencing of the first human genome marked the beginning of a new era in biological research, paving the way for the development of high-throughput technologies that generate massive-scale molecular data across multiple layers of biological regulation [16]. This post-genomic landscape now encompasses various "omics" fields, including genomics, transcriptomics, proteomics, and metabolomics, each providing distinct but interconnected insights into cellular functions and disease processes [17]. While single-omics analyses have yielded valuable discoveries, they offer limited perspectives on the complex, multi-layered nature of biological systems. Multi-omics integration has emerged as a transformative approach that combines data from these different molecular layers to provide a more comprehensive understanding of disease mechanisms and enable the transition from observing correlations to inferring causation in biological pathways [18].
The fundamental premise of multi-omics integration rests on the conceptual framework of the "omics cascade," which represents the sequential flow of biological information from genes to transcripts, proteins, and metabolites [19]. This flow is not strictly linear but involves complex regulatory interactions and feedback loops that remain poorly understood. Since each omic layer is causally tied to the next, multi-omics integration serves to disentangle these relationships to properly capture cell phenotype [20]. The core challenge—and opportunity—lies in moving beyond correlative associations to establish causal relationships that drive disease phenotypes, thereby enabling more effective diagnostic, prognostic, and therapeutic strategies [6].
Computational Frameworks for Multi-Omics Integration
Data Integration Strategies and Challenges
Integrating multi-omics data presents significant computational challenges due to the inherent heterogeneity of the data types, scales, and sources. Biological datasets are complex, noisy, biased, and heterogeneous, with potential errors arising from measurement mistakes or unknown biological variations [6]. The high-dimensional nature of omics data, often comprising thousands of variables but limited samples, further complicates integration efforts [19]. Several strategic frameworks have been developed to address these challenges, each with distinct advantages for specific research contexts.
Integration approaches can be categorized based on the relationship between samples across omics datasets. Matched integration (vertical integration) combines data from different omics layers within the same set of samples or even the same single cell, using the cell itself as an anchor [20]. Unmatched integration (diagonal integration) involves combining data from different cells or different studies, requiring computational methods to project cells into a co-embedded space to find commonality [20]. Mosaic integration represents an intermediate approach that can be used when experiments have various combinations of omics that create sufficient overlap across samples [20].
From a methodological perspective, integration strategies fall into three primary categories: correlation-based methods, multivariate approaches, and machine learning/artificial intelligence techniques [19]. Statistical and correlation-based methods slightly predominate in practical applications, followed by multivariate approaches and machine learning techniques [19]. The selection of an appropriate integration strategy depends on the research question, data characteristics, and desired biological outcomes, with no one-size-fits-all solution available [20].
Classification of Integration Methods
Table 1: Categories of Multi-Omics Integration Methods
| Category | Subtypes | Key Features | Representative Tools |
|---|---|---|---|
| Correlation-Based Methods | Gene co-expression analysis, Gene-metabolite networks, Similarity Network Fusion | Identify statistically significant associations between omics layers; Build correlation networks; Relatively straightforward implementation | WGCNA, xMWAS, Cytoscape [17] [19] |
| Multivariate Methods | Matrix factorization, Factor analysis, Projection-based methods | Simultaneously analyze multiple variables; Reduce dimensionality; Identify latent factors explaining variance across omics | MOFA+, PLS, PCA [20] [19] |
| Machine Learning/AI Approaches | Neural networks, Variational autoencoders, Graph neural networks | Handle complex nonlinear relationships; Pattern recognition in high-dimensional data; Predict disease states or drug responses | SCHEMA, DCCA, DeepMAPS, GLUE [20] [6] |
| Network-Based Methods | Network propagation/diffusion, Network inference models | Incorporate prior biological knowledge; Model biological interactions; Identify key regulatory nodes | Graph neural networks, Network propagation [6] |
Tool Selection for Specific Applications
The selection of computational tools for multi-omics integration must align with the specific analytical goals and data characteristics. For matched multi-omics data (profiled from the same cell), tools such as Seurat v4, MOFA+, and totalVI effectively leverage the cell as a natural anchor for integration [20]. These tools employ diverse computational approaches including weighted nearest-neighbor, factor analysis, and deep generative models respectively [20]. For unmatched data (from different cells), methods such as GLUE, BindSC, and Seurat v3 utilize techniques like variational autoencoders, canonical correlation analysis, and manifold alignment to project cells into a shared space where commonality can be established [20].
More recently, bridge integration and mosaic integration approaches have been developed to handle complex experimental designs where different samples have various combinations of omics measured [20]. Tools such as StabMap and Cobolt can integrate datasets with unique and shared features by creating a single representation of cells across datasets [20]. For temporal dynamics analysis, methods like MultiVelo employ probabilistic latent variable models to integrate mRNA and chromatin accessibility data across timepoints [20].
Network Biology: From Correlation to Causation
Biological Networks as an Integrative Framework
Network biology provides a powerful conceptual and computational framework for multi-omics integration by representing biological systems as interconnected networks of molecular components and their interactions [6]. This approach aligns with the fundamental organization of biological systems, where biomolecules do not function in isolation but rather through complex interactions that form biological networks [6]. Prominent examples include protein-protein interaction (PPI) networks, gene regulatory networks (GRNs), metabolic networks, and drug-target interaction (DTI) networks [6].
In these network representations, nodes represent individual biological entities (genes, proteins, metabolites), while edges represent interactions or relationships between them [6]. Network-based integration methods can be categorized into four primary types: (1) network propagation/diffusion, which spreads information across the network based on connectivity; (2) similarity-based approaches, which leverage topological similarity between nodes; (3) graph neural networks, which use deep learning on graph-structured data; and (4) network inference models, which predict novel interactions [6]. These approaches have demonstrated particular utility in drug discovery applications, including drug target identification, drug response prediction, and drug repurposing [6].
Establishing Causal Relationships in Networks
A critical challenge in network biology is distinguishing correlative relationships from causal relationships. While correlation-based methods can identify associations between molecular features, establishing causality requires additional analytical approaches and experimental validation. Several strategies have been developed to address this challenge, including the use of prior biological knowledge from databases of known interactions, temporal sequencing of omics measurements to establish chronology, and causal inference methods that leverage genetic variation or perturbation data [6].
For instance, Graph-Linked Unified Embedding (GLUE) is a network-based method that can achieve triple-omic integration using a graph variational autoencoder framework [20]. GLUE learns how to anchor features using prior biological knowledge, which it uses to link omic data and infer regulatory relationships [20]. Similarly, tools like CellOracle focus specifically on modeling gene regulatory networks by integrating mRNA expression, CRISPR screening, and chromatin accessibility data to infer causal regulatory relationships [20].
Table 2: Network-Based Approaches for Causal Inference
| Method Type | Mechanism | Data Requirements | Causal Inference Strength |
|---|---|---|---|
| Gene Regulatory Network Inference | Models regulatory relationships between transcription factors and target genes | Chromatin accessibility, TF binding motifs, Gene expression | High for transcriptional regulation |
| Network Propagation | Diffuses information through known interaction networks | Protein-protein interactions, Pathway databases | Medium (depends on reference network quality) |
| Causal Mediation Analysis | Tests whether the effect of an independent variable on a dependent variable goes through a mediator | Multi-omics data with intervention or natural variation | High for established mediators |
| Directional Network Models | Incorporates directional relationships using Bayesian or structural equation models | Time-series data, Knockdown/perturbation data | High with appropriate experimental design |
Workflow for Network-Based Multi-Omics Integration
The following diagram illustrates a generalized workflow for network-based multi-omics integration to infer causal relationships:
Experimental Design and Methodological Protocols
Correlation-Based Integration Protocols
Correlation-based methods represent a foundational approach for multi-omics integration, particularly for generating initial hypotheses about relationships between different molecular layers. The Weighted Gene Correlation Network Analysis (WGCNA) method can be extended to integrate transcriptomics and metabolomics data through a systematic protocol [17]. First, co-expression analysis is performed on transcriptomics data to identify modules of co-expressed genes. These modules are summarized by their eigengenes, which represent the overall expression pattern of the module. Simultaneously, metabolomics data is processed and normalized. The correlation between module eigengenes and metabolite abundance patterns is then calculated to identify significant associations [17]. This approach can reveal how coordinated gene expression relates to metabolic changes under specific biological conditions.
For gene-metabolite network construction, a standardized protocol involves collecting matched gene expression and metabolite abundance data from the same biological samples, followed by data normalization [17]. Pairwise correlations (e.g., Pearson or Spearman correlation coefficients) between all gene-metabolite pairs are calculated, and statistical significance is determined. A correlation network is then constructed where nodes represent genes and metabolites, and edges represent significant correlations above predetermined thresholds (e.g., R² > 0.8 and p-value < 0.05) [17]. Network visualization and analysis tools like Cytoscape are employed to identify highly connected regions and key regulatory nodes [17]. This method has been successfully applied to identify key regulatory pathways in various biological contexts, including plant stress responses and cancer metabolism [17].
Machine Learning Integration Protocols
Machine learning approaches offer powerful alternatives for detecting complex, non-linear relationships in multi-omics data. The multi-omics variational autoencoder framework provides a robust protocol for integrating multiple omics layers [20]. Each omics data type is first preprocessed and normalized separately. The model architecture consists of separate encoders for each omics type that map the input data to a shared latent representation, and separate decoders that reconstruct each omics type from the latent representation [20]. The training objective combines reconstruction loss for each omics type with regularization of the latent space. Once trained, the shared latent representation can be used for downstream tasks such as disease classification, subtyping, or survival prediction [20]. This approach has been implemented in tools like scMVAE and DCCA for single-cell multi-omics integration [20].
For temporal multi-omics integration, a protocol using MultiVelo incorporates RNA velocity concepts to model causal relationships between chromatin accessibility and gene expression [20]. The method requires paired scRNA-seq and scATAC-seq data from the same cells across multiple timepoints. First, RNA velocity is estimated from splicing dynamics, while chromatin velocity is estimated from chromatin accessibility dynamics [20]. The model then uses a probabilistic latent variable model to jointly model these velocities and infer a shared latent time that captures the underlying cellular dynamics. This allows for the prediction of future cellular states and the inference of causal relationships between epigenetic changes and transcriptional outcomes [20].
Experimental Protocol for Multi-Omics Causal Validation
Establishing causality requires experimental validation beyond computational inference. A multi-phase validation protocol begins with computational identification of candidate causal relationships using the methods described above. The second phase involves perturbation experiments using techniques such as CRISPR/Cas9 for gene knockout, RNA interference for gene knockdown, or small molecule inhibitors for protein inhibition [16]. Following perturbation, multi-omics profiling is repeated to assess the effects on downstream molecular layers. The third phase employs causal mediation analysis to statistically test whether changes in the putative causal mediator (e.g., chromatin accessibility) account for the effect of the perturbation on the outcome (e.g., gene expression) [6]. Finally, functional assays relevant to the disease context are performed to confirm the physiological relevance of the identified causal relationship [16].
Case Studies in Disease Research
Alzheimer's Disease Trajectory Prediction
In neurodegenerative disease research, a novel approach called Machine Learning for Visualizing AD (ML4VisAD) was developed to predict and visualize Alzheimer's disease progression through a color-coded visual output [21]. This method integrated multimodal data including neuroimaging (MRI, PET), neuropsychological test scores, cerebrospinal fluid biomarkers (amyloid beta, phosphorylated tau protein, total tau protein), and risk factors (age, gender, education, ApoE4 gene) [21]. The model used a convolutional neural network architecture that took baseline measurements as input to generate visual images reflecting disease progression at different time points. The approach achieved an accuracy of 0.82±0.03 for 3-way classification and 0.68±0.05 for 5-way classification, demonstrating the power of integrated multi-omics and multimodal data for predicting disease trajectories [21].
The implementation provided not just classification but also visual interpretation of the decision-making process, offering insights into which biomarkers contributed most to disease progression predictions [21]. This addresses the "black box" problem often associated with complex machine learning models and allows clinicians to assess the rationale behind specific classifications, particularly for challenging converter cases (patients who transition between diagnostic categories over time) [21].
Cancer Subtyping and Biomarker Discovery
In oncology, multi-omics integration has revolutionized cancer subtyping and biomarker discovery. The Cancer Genome Atlas (TCGA) represents one of the most comprehensive multi-omics resources, housing data for more than 33 different cancer types across 20,000 individual tumor samples [18]. TCGA includes diverse data types: RNA-Seq, DNA-Seq, miRNA-Seq, single-nucleotide variants, copy number variations, DNA methylation, and reverse phase protein array data [18]. Integrated analysis of these data has enabled molecular reclassification of tumors beyond histopathological criteria.
A notable example comes from colon and rectal cancer research, where integrated proteogenomic analysis revealed that the chromosome 20q amplicon was associated with the largest global changes at both mRNA and protein levels [18]. Integration of proteomics data helped identify potential 20q candidates, including HNF4A, TOMM34, and SRC, that might have been missed by genomic or transcriptomic analysis alone [18]. Similarly, in breast cancer, the Molecular Taxonomy of Breast Cancer International Consortium (METABRIC) used integrated analysis of clinical data, gene expression, SNPs, and CNVs to identify 10 molecular subgroups with distinct clinical outcomes and therapeutic vulnerabilities [18].
Pharmacogenomics and Drug Response Prediction
Multi-omics integration has proven particularly valuable in pharmacogenomics, where it helps elucidate the genetic basis of variable drug responses. For example, studies of the antiplatelet drug clopidogrel have demonstrated how integration of genomic and clinical data can explain treatment failure [16]. Clopidogrel is a prodrug that requires activation by the cytochrome P450 2C19 enzyme (CYP2C19). Loss-of-function variants of this enzyme (particularly CYP2C192) result in reduced drug activation and diminished antiplatelet effects [16]. Heterozygous patients show intermediate activity that may be overcome by dose adjustment, while homozygous patients derive little benefit even at increased doses [16]. Conversely, gain-of-function variants (CYP2C1917) are associated with increased bleeding risk [16].
The Cancer Cell Line Encyclopedia (CCLE) provides another powerful example, containing comprehensive molecular data (gene expression, copy number, sequencing) and pharmacological profiles for 24 anticancer drugs across 479 cancer cell lines [18]. Integration of these multi-omics and drug response data has enabled the identification of novel biomarkers and mechanistic effectors of drug response, facilitating the development of personalized treatment strategies [18].
Research Reagent Solutions
Table 3: Essential Research Reagents and Platforms for Multi-Omics Studies
| Category | Specific Reagents/Platforms | Function in Multi-Omics Research |
|---|---|---|
| Sequencing Technologies | Next-Generation Sequencing (NGS) platforms, Single-cell RNA-seq, ATAC-seq | Comprehensive profiling of genome, epigenome, transcriptome; Enables identification of genetic variants, chromatin accessibility, and transcriptional networks [16] |
| Proteomics Platforms | Liquid chromatography-mass spectrometry (LC-MS), Isobaric labeling (TMT, iTRAQ), SILAC | Identification and quantification of proteins and post-translational modifications; Provides crucial data on functional effectors of cellular processes [16] [17] |
| Metabolomics Tools | Mass spectrometry, NMR spectroscopy, Liquid/gas chromatography | Comprehensive profiling of small molecule metabolites; Captures ultimate mediators of metabolic processes and regulatory signals [17] |
| Perturbation Reagents | CRISPR/Cas9 systems, RNA interference tools, Small molecule inhibitors | Experimental manipulation of candidate causal genes/proteins; Functional validation of computationally inferred relationships [16] [6] |
| Reference Databases | Protein-protein interaction databases, Pathway databases (KEGG, Reactome), Drug-target networks | Prior biological knowledge for network construction; Context for interpreting multi-omics findings; Grounding computational predictions in established biology [6] |
Visualization and Interpretation of Integrated Data
Color-Coding Systems for Multi-Omics Visualization
Effective visualization is crucial for interpreting complex multi-omics data. The ten simple rules for colorizing biological data visualization provide essential guidance for creating accessible and informative visualizations [22]. The first rule emphasizes identifying the nature of the data, classifying variables as nominal (categorical without order), ordinal (categorical with order), interval (numerical without true zero), or ratio (numerical with true zero) [22]. This classification directly informs color palette selection, with qualitative palettes suited for nominal data, sequential palettes for ordinal and interval data, and diverging palettes for data with critical midpoint values [22].
Rule 2 highlights the importance of selecting an appropriate color space, with recommendations to use perceptually uniform color spaces like CIE Luv and CIE Lab that align with human visual perception [22]. These spaces ensure that equal numerical changes in color values correspond to approximately equal perceived changes, preventing visual distortion of data patterns [22]. Subsequent rules address critical considerations such as checking color context, evaluating color interactions, assessing color deficiencies, and ensuring accessibility for all users, including those with color vision deficiencies [22].
Multi-Omics Visualization in Practice
In applied multi-omics research, the ML4VisAD system demonstrates an innovative approach to visualization, generating color-coded visual outputs that reflect disease progression at different time points [21]. This system used a unique tensorization method to transform multimodal data into images that express disease state and progression, allowing clinicians to visually assess the nuances leading to specific classifications or predictions [21]. The visualization was generated rapidly (0.08 msec for a 23×23 output image and 0.17 msec for a 45×45 output image), enabling real-time application in clinical decision support scenarios [21].
For network visualization, tools like Cytoscape enable the creation of multi-omics networks where nodes represent biological entities across different omics layers and edges represent their relationships [17]. Advanced features allow for the encoding of multiple data dimensions through visual properties such as node color, size, shape, and edge thickness, enabling the representation of complex multi-omics relationships in an intuitive visual format [17]. These visualizations facilitate the identification of key regulatory hubs and bridges between different biological processes, guiding hypothesis generation and experimental design.
The integration of multi-omics data represents a paradigm shift in biological research, enabling the transition from observing correlations to inferring causation in disease pathways. While significant challenges remain—including data heterogeneity, computational complexity, and the need for sophisticated statistical methods—the field has developed robust frameworks for addressing these challenges [20] [19]. The synergistic application of correlation-based methods, multivariate approaches, machine learning, and network biology has demonstrated remarkable potential for unraveling complex biological mechanisms and advancing personalized medicine.
Future developments in multi-omics integration will likely focus on incorporating temporal and spatial dynamics more comprehensively, improving model interpretability, and establishing standardized evaluation frameworks [6]. The growing adoption of single-cell multi-omics technologies and spatial transcriptomics/proteomics will provide unprecedented resolution for studying cellular heterogeneity and tissue organization [20]. Additionally, the integration of clinical data with multi-omics measurements will be essential for translating molecular findings into actionable clinical insights.
As the field progresses, the development of more accessible tools and standardized protocols will be crucial for broadening the adoption of multi-omics integration across the research community. The ultimate goal remains the realization of precision medicine approaches that leverage comprehensive molecular profiling to understand disease mechanisms, predict therapeutic responses, and develop targeted interventions tailored to individual patients [16] [18]. Through continued methodological innovation and collaborative science, multi-omics integration will increasingly illuminate the causal pathways underlying human health and disease.
Biological systems are characterized by inherent complexity and variability, operating across multiple interconnected layers including the genome, transcriptome, proteome, and metabolome [23]. A comprehensive understanding of disease requires integrative, multi-omics analyses that capture these dynamic interactions [23]. Within this framework, organelle-level heterogeneity represents a crucial source of cellular "noise" that contributes significantly to intercellular phenotypic variation [24]. Unlike genetic mechanisms, this non-genetic heterogeneity arises from stochastic processes in cellular components and low molecular numbers, leading to fluctuations that can profoundly impact cellular behavior despite identical genetic backgrounds [24].
The study of organelle heterogeneity provides not only insight into normal physiological functions but also fundamental advances in understanding disease pathogenesis. In many clinically important diseases, extensive heterogeneity renders some cells more resistant to treatment than others, presenting significant therapeutic challenges [24]. This technical guide explores how integrative omics approaches are revolutionizing our understanding of organelle dysfunction, signaling networks, and cellular heterogeneity, providing researchers with methodologies to uncover novel disease mechanisms and therapeutic opportunities.
Theoretical Foundations: Organelle Heterogeneity and Cellular Noise
Cellular heterogeneity can be broadly categorized into two classes: "directed" heterogeneities that play specific roles in normal developmental processes, and "non-directed" heterogeneities that occur spontaneously due to inherent stochasticity of molecular processes [24]. A classic example of directed heterogeneity includes asymmetrical cell division in Drosophila melanogaster development, where ganglion mother cells consistently divide to produce daughter cells of differing fates [24]. In contrast, non-directed heterogeneity is exemplified by the generation of color-specific photoreceptors in the compound eye of D. melanogaster, where each photoreceptor cell independently chooses to express either blue- or green-sensitive rhodopsin [24].
The distinction between molecular-level and organelle-level variation is critical for understanding phenotypic heterogeneity. While molecular events (transcription, translation, protein turnover) have been extensively studied as sources of variation, organelles serve as reaction vessels for biochemical pathways where fluctuations in abundance, size, and shape can significantly influence functional output [24]. For instance, organelle volume affects capacity for storing reaction intermediates, while surface area influences flux of molecules between cytoplasm and organelle lumen [24].
Table 1: Types and Characteristics of Cellular Heterogeneity
| Type of Heterogeneity | Mechanism | Persistence | Example |
|---|---|---|---|
| Directed | Coordinated cellular decision-making | Often irreversible | Asymmetric cell division in Drosophila development |
| Non-directed | Stochastic molecular processes | Often reversible | Photoreceptor color choice in Drosophila eye |
| Molecular-level | Fluctuations in gene expression, signaling | Fluctuating | Variation in transcription factor concentrations |
| Organelle-level | Variations in organelle size, shape, distribution | More stable | Heterogeneity in mitochondrial morphology and function |
Organelle Dysfunction in Disease
Mitochondrial diseases represent a paradigm for studying organelle dysfunction, exhibiting exceptional clinical variability despite typically originating from mutations in either nuclear or mitochondrial DNA [25]. These primary mitochondrial diseases have an estimated prevalence of 1:2000 to 1:5000 and can manifest at any age with either systemic or tissue-specific effects across multiple organ systems [25]. The reasons why mitochondrial disorders show such tissue-specific manifestations are still poorly understood, though deficient ATP synthesis alone does not explain the phenotypic spectrum.
Beyond their role as cellular power plants, mitochondria are versatile players in anabolic cellular functions, including biosynthetic one-carbon cycle, iron-sulfur cluster synthesis, and cellular stress responses [25]. Their contributions to anabolic biosynthesis pathways represent an intriguing mechanism to explain tissue-specific disease manifestations [25]. Furthermore, mitochondria contribute to apoptosis and calcium storage, and facilitate signaling between cells [25], underlining their multifaceted roles in cellular physiology and disease.
Integrative Omics Methodologies
Multi-Omics Integration Strategies
Integrative omics approaches combine data from genomics, transcriptomics, proteomics, and metabolomics to provide unprecedented insights into disease mechanisms [19]. These methodologies can be broadly categorized into three main approaches: statistical-based methods, multivariate methods, and machine learning/artificial intelligence techniques [19]. Each offers distinct advantages for specific research applications and data characteristics.
Statistical and correlation-based methods represent fundamental approaches for assessing relationships between omics datasets. Simple scatterplots can visualize expression patterns and identify consistent or divergent trends [19]. Pearson's or Spearman's correlation analysis, including multivariate generalizations like the RV coefficient, test correlations between whole sets of differentially expressed genes in different biological contexts [19]. Correlation networks extend this analysis by transforming pairwise associations into graphical representations where nodes represent biological entities and edges are constructed based on correlation thresholds [19].
Table 2: Data-Driven Omics Integration Approaches
| Method Category | Key Techniques | Applications | Tools/Packages |
|---|---|---|---|
| Statistical & Correlation-based | Pearson/Spearman correlation, Correlation networks, WGCNA, xMWAS | Identify relationships between omics variables, Find co-expressed modules | xMWAS [19], WGCNA [19] |
| Multivariate Methods | PCA, PLS, Canonical correlation | Dimension reduction, Identify latent structures | |
| Machine Learning/AI | Integrative network models, Scissor algorithm | Classification, Biomarker discovery, Prognostic stratification | Scissor [26] |
Weighted Gene Correlation Network Analysis (WGCNA) represents a more advanced correlation-based approach that identifies clusters of co-expressed, highly correlated genes termed modules [19]. By constructing a scale-free network, WGCNA assigns weights to gene interactions, emphasizing strong correlations while reducing the impact of weaker connections [19]. These modules can be summarized by their eigenmodules and linked to clinically relevant traits, facilitating identification of functional relationships [19].
The xMWAS platform performs pairwise association analysis with omics data organized in matrices, determining correlation coefficients by combining Partial Least Squares (PLS) components and regression coefficients [19]. The resulting coefficients generate multi-data integrative network graphs, with communities of highly interconnected nodes identified through multilevel community detection methods [19].
Experimental Workflows for Multi-Omics Analysis
Workflow for Multi-Omics Data Integration
Single-Cell and Spatial Omics Technologies
Single-cell RNA sequencing (scRNA-seq) has emerged as a powerful technique for probing cellular heterogeneity, discerning distinct cell states, identifying marker genes, and elucidating associated functions [26]. When combined with spatial transcriptomics (ST), these technologies offer unprecedented opportunity to map single-cell and spatial resolution of tissues, facilitating understanding of how cellular heterogeneity contributes to disease progression and therapy response [26].
In practice, scRNA-seq analysis of lung adenocarcinoma tissues has revealed significant enrichment of proliferating cells compared to normal tissues [26]. Using algorithms like Scissor, researchers can identify cell subgroups closely associated with distinct disease phenotypes within scRNA data [26]. These approaches have enabled identification of proliferating cell genes with significant prognostic implications and revealed upregulated cell-cycling and oncogenic pathways within specific cell subpopulations [26].
Signaling Networks in Cellular Stress Responses
Mitochondrial Integrated Stress Response (ISRmt)
A milestone achievement of multi-omics approaches in mitochondrial research has been identification of novel regulators of the mitochondrial integrated stress response (ISRmt), a multifaceted tissue-specific response activated upon mitochondrial stress [25]. While some components overlap with the mitochondrial unfolded protein response (UPRmt), the key transcription factors and downstream targets differ [25].
The ISRmt signature comprises changes in gene expression mediated by activating transcription factor 4 (ATF4), ATF5, and ATF3, resulting in de novo synthesis of metabolic cytokines FGF21 and GDF15 and remodeling of one-carbon and folate metabolisms [25]. This leads to increased serine and nucleotide pools, collectively mediated by the upstream kinase mTORC1 [25]. Strikingly, inhibition of mTORC1 with rapamycin reverses these molecular defects and skeletal muscle tissue-level pathology in mouse models of mitochondrial myopathy [25].
Mitochondrial Integrated Stress Response Pathway
Intercellular Communication Networks
Spatial organization and communication between cellular subpopulations play crucial roles in disease progression. In lung adenocarcinoma, single-cell analyses have revealed complex, intersecting differentiation pathways among proliferating cell subsets, with specific clusters like C3_KRT8 emerging as central nodes [26]. Intercellular communication analysis using tools like CellChat has identified specific signaling pathways, such as MIF-CD74+CD44, as key mediators of communication among these subpopulations [26]. Spatial transcriptomics has further confirmed spatial colocalization of specific proliferating cell subtypes, supporting the notion of their potential synergistic role in cancer progression [26].
Quantitative Data and Biomarker Discovery
Metabolic Remodeling in Mitochondrial Dysfunction
Multi-omics approaches have revealed profound metabolic remodeling in mitochondrial diseases. Studies of mouse models with mutations in the mtDNA helicase Twinkle (encoded by Twnk), and human patients carrying the same mutations, identified major remodeling of the anabolic folate-driven one-carbon cycle specifically in affected tissues [25]. This drives one-carbon units for purine and glutathione synthesis, suggesting therapy targets in the folate cycle [25]. Similar findings were reported in human cells depleted for mtDNA polymerase-γ (encoded by Polg) [25].
Proteomic and transcriptomic analyses of conditional knockout mouse models of genes essential for mtDNA expression in heart tissue revealed remodeling of the one-carbon cycle, substantially reduced coenzyme Q (CoQ) levels, and decreased levels of multiple mitochondrial CoQ biosynthesis enzymes [25]. These findings propose controlled therapy trials with CoQ derivatives for patients with mtDNA maintenance defects [25].
Table 3: Key Biomarkers in Mitochondrial Disease Identified via Multi-Omics
| Biomarker | Biological Role | Detection Method | Clinical Utility |
|---|---|---|---|
| FGF21 | Metabolic hormone | Immunoassay, MS | Sensitive and specific blood biomarker for muscle-manifesting mitochondrial diseases [25] |
| GDF15 | Stress-responsive cytokine | Immunoassay, MS | Specific biomarker for mitochondrial disorders [25] |
| Coenzyme Q | Electron carrier, antioxidant | Mass spectrometry | Potential therapeutic target for mtDNA maintenance defects [25] |
| One-carbon metabolites | Folate cycle intermediates | Metabolomics, MS | Indicators of metabolic remodeling in mitochondrial stress [25] |
Prognostic Signatures in Cancer
In lung adenocarcinoma (LUAD), integrative multi-omics and machine learning approaches have identified critical functions of proliferating cells in prognosis and personalized treatment [26]. Using the Scissor algorithm, researchers identified Scissor+ proliferating cell genes associated with prognosis [26]. An integrative machine learning program comprising 111 algorithms was used to construct a Scissor+ proliferating cell risk score (SPRS) that demonstrated superior performance in predicting prognosis and clinical outcomes compared to 30 previously published models [26].
The SPRS model not only predicted prognosis but also informed therapeutic strategies. High- and low-SPRS groups exhibited different biological functions and immune cell infiltration in the tumor immune microenvironment [26]. Importantly, high SPRS patients showed resistance to immunotherapy but increased sensitivity to chemotherapeutic and targeted therapeutic agents [26], highlighting the clinical utility of such integrative approaches.
The Scientist's Toolkit: Essential Research Reagents
Table 4: Key Research Reagent Solutions for Multi-Omics Studies
| Reagent/Technology | Function | Application Examples |
|---|---|---|
| Next-generation sequencing (NGS) | Comprehensive analysis of genome, exome, transcriptome | Identification of cancer-associated mutations, Transcriptome profiling [23] |
| Mass spectrometry | Sensitive detection and quantification of proteins and metabolites | Proteomic and metabolomic profiling, Biomarker verification [25] [19] |
| Scissor algorithm | Identification of cell subgroups associated with clinical phenotypes | Prognostic stratification of proliferating cells in LUAD [26] |
| xMWAS platform | Pairwise association analysis and network graph generation | Multi-omics integration and community detection [19] |
| WGCNA | Identification of co-expressed gene modules | Finding clusters of highly correlated genes associated with traits [19] |
| CellChat | Analysis of intercellular communication | Inference of signaling pathways between cell subpopulations [26] |
Integrative multi-omics approaches represent a paradigm shift in biological research, enabling unprecedented insights into organelle dysfunction, signaling networks, and cellular heterogeneity. The combination of high-throughput technologies with advanced computational methods has already yielded significant advances in understanding disease mechanisms, particularly in complex areas like mitochondrial diseases and cancer [25] [26] [23]. These approaches have moved beyond single-omics analyses to provide holistic views of the molecular landscape of disease.
Future research will likely focus on standardizing frameworks for multi-omics data integration to address current challenges related to heterogeneity, reproducibility, and data interpretation [23]. As technologies evolve, particularly in single-cell and spatial omics, researchers will gain even finer resolution of cellular heterogeneity and its functional consequences [26]. The continued development of network-based models and machine learning approaches will enhance our ability to extract meaningful biological insights from these complex datasets [19] [23].
For researchers and drug development professionals, these advances offer exciting opportunities to identify novel therapeutic targets and develop personalized treatment strategies. The integration of multi-omics data has already begun to transform diagnostic approaches and therapeutic decision-making, particularly in oncology [26] [23]. As these methodologies become more accessible and standardized, they hold the promise of advancing personalized therapies by fully characterizing the molecular landscape of disease, ultimately improving patient outcomes through more effective and targeted treatment strategies.
Frameworks for Integration: Machine Learning, AI, and Network Biology in Action
In the field of biomedical research, the advent of high-throughput technologies has enabled the comprehensive profiling of biological systems across multiple molecular layers, including genomics, transcriptomics, proteomics, and metabolomics [17]. While single-omics analyses have provided valuable insights, they often fail to capture the complex interactions between different molecular layers that drive disease mechanisms [27]. Multi-omics integration has thus emerged as a pivotal approach for unraveling the complexity of diseases such as cancer, enabling the identification of robust biomarkers and facilitating the development of personalized treatment strategies [28] [27].
The integration of multiple omics data types presents significant computational challenges, leading to the development of various strategic frameworks. These strategies can be broadly categorized into three main approaches—early, intermediate, and late integration—based on the stage at which the data fusion occurs [28] [29]. Another framework further delineates five categories: early, mixed, intermediate, late, and hierarchical integration [29]. The selection of an appropriate integration strategy depends on the research question, data characteristics, and analytical objectives, with each approach offering distinct advantages and limitations [27]. This technical guide provides an in-depth examination of these computational strategies, their methodologies, applications, and implementation considerations within the context of disease mechanism research.
Core Integration Models
Early Integration
Early integration, also referred to as "combined omics integration," involves the concatenation of raw or preprocessed data from multiple omics layers into a single combined matrix at the beginning of the analytical pipeline [28] [29]. This combined matrix then serves as input for downstream machine learning or statistical models.
The fundamental principle underlying early integration is that simultaneous analysis of all features may capture dependencies and interactions across different omic layers [28]. For example, in a study integrating transcriptomics and metabolomics data, the merged dataset would include all genes and metabolites as features, with samples as observations. This approach allows algorithms to potentially identify complex, cross-omic relationships that might be missed when analyzing each dataset separately.
Table 1: Characteristics of Early Integration
| Aspect | Description |
|---|---|
| Integration Stage | Beginning of analysis pipeline |
| Data Structure | Single combined matrix of multiple omics datasets |
| Key Advantage | Potential to capture direct dependencies between different omics features |
| Main Challenge | High-dimensionality and different scales across omics layers require careful normalization [28] |
| Typical Applications | Tumor subtyping [28], biomarker discovery |
A significant challenge in early integration is handling the high-dimensional nature of the combined data and the varying scales, dimensions, and data types across different omics platforms [28]. Omics layers with more features may disproportionately influence the model unless proper normalization and scaling are applied. Common solutions include dimensionality reduction techniques and automatic feature learning methods, such as autoencoders, which can compress multiple omics layers into a more manageable integrated representation [28].
Intermediate Integration
Intermediate integration represents a more nuanced approach where data from different omics layers are analyzed together through simultaneous transformation or joint modeling, rather than simple concatenation [28] [29]. This strategy aims to leverage the complementary information across omics modalities while respecting their distinct characteristics.
In intermediate integration, the original datasets are simultaneously transformed into both common and omics-specific representations [29]. This approach includes techniques such as joint dimension reduction, statistical modeling, and similarity network integration [28]. For instance, the Similarity Network Fusion (SNF) method constructs similarity networks for each omics data type separately and then merges them, highlighting edges with high associations in each omics network [17]. Another example is group factor analysis methods like MOFA+, which perform Bayesian factorization to learn a shared low-dimensional representation across omics datasets while distinguishing shared from modality-specific signals using sparsity-promoting priors [27].
Table 2: Characteristics of Intermediate Integration
| Aspect | Description |
|---|---|
| Integration Stage | Middle of analysis pipeline; during feature selection or extraction |
| Data Structure | Separate but jointly transformed datasets |
| Key Advantage | Balances integration with preservation of omics-specific characteristics [27] |
| Main Challenge | Computational complexity; designing effective joint transformation models |
| Typical Applications | Cellular differentiation trajectory analysis [28], cancer biology studies [28] |
Intermediate integration has been widely applied in single-cell multi-omics studies, where it helps resolve cellular phenotypes, biological processes, and developmental stages by integrating complementary evidence from multimodal data [28]. This approach is particularly valuable for studying complex biological processes such as embryonic development, immune system development, and neuronal development, where multiple molecular layers interact dynamically [28].
Late Integration
Late integration, also known as "vertical integration," involves analyzing each omics dataset separately and combining the results at the final stage of the analytical pipeline [28] [27]. In this approach, individual models are built for each omics layer, and their outputs—such as cluster assignments, predictions, or similarity matrices—are integrated to generate a consensus result.
The conceptual foundation of late integration is that analyzing each omics layer independently preserves its unique characteristics and avoids potential confounding effects that might arise from premature data fusion [27]. This strategy is particularly useful when different omics data types have substantially different statistical properties, dimensions, or noise characteristics that make direct combination problematic.
Table 3: Characteristics of Late Integration
| Aspect | Description |
|---|---|
| Integration Stage | End of analysis pipeline |
| Data Structure | Separate analyses with integrated results |
| Key Advantage | Preserves unique characteristics of each omics dataset [27] |
| Main Challenge | Difficulty in identifying relationships between different omics layers [27] |
| Typical Applications | Multi-study validation, consensus clustering, ensemble prediction |
A common application of late integration is in consensus clustering, where clustering is performed independently on each omics dataset, followed by integration of the cluster assignments to identify stable cell types or patient subgroups across multiple molecular views [28]. Similarly, in predictive modeling, late integration can combine predictions from omics-specific models to generate a more robust final prediction. The main limitation of this approach is the potential difficulty in identifying direct relationships and interactions between different omics layers, as the integration occurs after the individual analyses are complete [27].
Experimental Protocols and Methodologies
Protocol for Early Integration in Cancer Subtyping
Objective: To identify molecular subtypes of breast cancer by integrating genomics, transcriptomics, and epigenomics data using early integration.
Materials: Multi-omics datasets from The Cancer Genome Atlas (TCGA) including gene expression, DNA methylation, and copy number variation data.
Procedure:
- Data Preprocessing: Normalize each omics dataset separately. For gene expression data, apply TPM normalization and log2 transformation. For DNA methylation data, perform beta-value quantification and probe filtering. For copy number variation data, segment and discretize the data.
- Feature Selection: Select top variable features from each omics dataset using variance filtering or significance testing to reduce dimensionality.
- Data Concatenation: Merge the selected features from all omics layers into a single unified matrix, with samples as rows and features from all omics types as columns.
- Normalization: Apply z-score normalization across the combined feature matrix to ensure comparable scales.
- Dimensionality Reduction: Perform principal component analysis (PCA) on the combined matrix to reduce dimensions while preserving maximum variance.
- Clustering: Apply k-means or hierarchical clustering to the principal components to identify distinct molecular subtypes.
- Validation: Evaluate cluster quality using silhouette scores and validate subtypes against clinical outcomes such as survival differences.
Protocol for Intermediate Integration Using Similarity Network Fusion
Objective: To integrate transcriptomic and proteomic data for discovering novel cell states using intermediate integration via Similarity Network Fusion (SNF).
Materials: Single-cell RNA sequencing data and simultaneous protein abundance data from CITE-seq experiments.
Procedure:
- Data Preprocessing: Normalize transcript counts using SCTransform and protein counts using centered log-ratio transformation.
- Similarity Network Construction: For each omics data type, construct a sample similarity network using a distance metric (e.g., Euclidean distance) and convert to a similarity matrix using a heat kernel.
- Network Fusion: Iteratively update the similarity networks for each data type using information from the other networks until they converge to a single fused network.
- Community Detection: Apply spectral clustering to the fused network to identify cell clusters that are consistent across both omics layers.
- Marker Identification: Identify genes and proteins that are differentially expressed across the identified clusters.
- Biological Interpretation: Annotate cell states based on marker genes and proteins, and validate using known biological pathways.
Protocol for Late Integration in Survival Prediction
Objective: To predict patient survival by integrating multi-omics data using late integration with genetic programming.
Materials: Breast cancer multi-omics data from TCGA including clinical survival information.
Procedure:
- Individual Model Training: Train separate survival models (e.g., Cox proportional hazards models) for each omics dataset (genomics, transcriptomics, epigenomics).
- Feature Selection: For each omics type, select features most predictive of survival using LASSO regularization or genetic programming.
- Prediction Generation: Generate risk scores for each patient from each omics-specific model.
- Consensus Prediction: Combine the individual risk scores using a weighted average or meta-learner to generate a final consensus risk score.
- Model Evaluation: Assess model performance using the concordance index (C-index) and validate using cross-validation.
- Biomarker Interpretation: Identify important features from each omics layer that contribute to the predictions and interpret their biological significance in the context of cancer pathways.
Visualization of Integration Strategies
The following diagrams illustrate the conceptual workflows and data transformations involved in each integration strategy, created using Graphviz DOT language with the specified color palette.
Diagram 1: Early integration workflow
Diagram 2: Intermediate integration workflow
Diagram 3: Late integration workflow
The Scientist's Toolkit: Research Reagent Solutions
Table 4: Essential Research Reagents and Computational Tools for Multi-Omics Integration
| Reagent/Tool | Function | Application Context |
|---|---|---|
| CITE-seq | Simultaneous measurement of transcriptome and surface proteins in single cells [28] | Characterizing immune cell types using RNA and protein markers [30] |
| 10x Genomics Multiome | Concurrent assay of gene expression and chromatin accessibility from single nuclei [28] | Studying gene regulatory mechanisms in heterogeneous tissues |
| SCENIC+ | Computational tool for inferring gene regulatory networks from multi-omics data | Identifying key transcription factors driving cellular differentiation |
| Vitessce | Interactive visualization framework for multimodal and spatial single-cell data [30] | Visual exploration of connections across omics modalities and spatial context |
| MOFA+ | Bayesian group factor analysis for learning shared representations across omics [27] | Dimensionality reduction and integration of multiple omics datasets |
| Genetic Programming | Evolutionary algorithm for optimizing feature selection and integration [27] | Adaptive multi-omics integration for survival analysis in breast cancer |
| AnnData | File format for annotated data matrices from single-cell experiments [30] | Standardized storage and exchange of single-cell omics data |
Applications in Disease Mechanism Research
Multi-omics integration strategies have demonstrated significant potential for advancing our understanding of disease mechanisms, particularly in complex conditions such as cancer. In breast cancer research, adaptive multi-omics integration employing genetic programming has been used to optimize feature selection from genomics, transcriptomics, and epigenomics data, resulting in a concordance index of 78.31 during cross-validation for survival prediction [27]. This approach highlights the importance of considering the complex interplay between different molecular layers in understanding cancer progression and developing prognostic models.
In single-cell studies, multi-omics integration has enabled the discovery of new cell types, cellular differentiation trajectories, and communication networks across cells and tissues [28]. For example, integrating single-cell RNA sequencing with single-cell ATAC-seq data has provided insights into the regulatory mechanisms underlying embryonic development, immune system development, and neuronal development [28]. These approaches are particularly valuable for resolving tumor heterogeneity, which plays a crucial role in drug resistance, relapse, and metastasis [28].
The integration of multi-omics data also holds promise for translational applications, such as the identification of distinct cellular subpopulations associated with disease versus healthy states [28]. For instance, in the context of somatic cancer evolution, heart diseases, neuronal diseases, and recurrent miscarriage, multi-omics approaches have revealed molecular signatures that could inform diagnostic and therapeutic strategies [28]. Furthermore, tools like Vitessce enable the visual validation of these findings by allowing researchers to explore cell types characterized by markers in multiple modalities simultaneously, such as validating the presence of natural killer cells based on both CD56 protein levels and expression of genes GZMB, GZMK, and PRF1 [30].
Early, intermediate, and late integration models offer complementary approaches for leveraging multi-omics data to advance our understanding of disease mechanisms. Early integration provides a straightforward framework for capturing potential interactions across omics layers but faces challenges in handling high-dimensional data. Intermediate integration balances the preservation of omics-specific characteristics with the identification of shared patterns, while late integration leverages the strengths of individual omics analyses but may miss important cross-omic relationships. The choice of integration strategy should be guided by the specific research question, data characteristics, and analytical objectives. As multi-omics technologies continue to evolve and generate increasingly complex datasets, the development of more sophisticated integration methods will be crucial for unraveling the intricate molecular networks underlying human diseases and translating these insights into improved diagnostic and therapeutic strategies.
The field of biomedical research, particularly in understanding complex disease mechanisms, is undergoing a profound transformation fueled by artificial intelligence (AI) and machine learning (ML). The integration of multi-omics data—encompassing genomics, transcriptomics, proteomics, and metabolomics—presents both unprecedented opportunities and significant analytical challenges [25]. Traditional computational approaches often fail to capture the intricate, non-Euclidean relationships inherent in biological systems, from molecular structures to cellular interaction networks. This whitepaper explores how cutting-edge AI architectures, including graph neural networks (GNNs), transformers, and autoencoders, are overcoming these limitations to provide novel insights into disease pathogenesis and therapeutic development. These technologies enable researchers to move beyond descriptive analytics to predictive modeling and generative design, fundamentally accelerating the translation of omics data into mechanistic understanding and clinical applications [31]. By representing biological systems as complex networks and leveraging deep learning's pattern recognition capabilities, these AI powerhouses are setting new standards for what's possible in integrative omics research and drug discovery.
Core AI Architectures in Biomedical Research
Graph Neural Networks (GNNs): Learning from Biological Networks
Graph Neural Networks represent a paradigm shift in how computational models handle relational data, making them exceptionally suited for biological systems where entities and interactions naturally form graph structures [32]. Unlike traditional neural networks designed for grid-like data, GNNs operate through message-passing mechanisms, where nodes in a graph aggregate information from their neighbors to learn rich, hierarchical representations [33]. This architecture directly mirrors how biological systems function, from molecular interactions to cellular signaling pathways.
In the context of integrative omics, GNNs excel at modeling the complex interdependencies between different biological entities. For example, atoms and bonds in molecules can be represented as nodes and edges for drug discovery applications [34], while proteins, metabolites, and genes can be modeled as interconnected nodes in biological pathway analysis [25]. The message-passing framework allows GNNs to capture the structural context of each component, enabling more accurate predictions of molecular properties, protein functions, and disease associations than traditional methods that treat biological entities in isolation.
Recent advancements have addressed initial limitations of GNNs, such as over-smoothing (where node representations become indistinguishable with increased network depth) and over-squashing (where information compression occurs through bottleneck edges) [33]. Solutions include sophisticated message regularization schemes and graph rewiring algorithms that optimize information flow. These improvements have solidified GNNs' position as indispensable tools for biomedical research, particularly for tasks requiring relational reasoning across multiple biological scales.
Transformer Architectures: Capturing Long-Range Dependencies
Originally developed for natural language processing, transformer architectures have found powerful applications in biological sequence analysis and omics integration through their self-attention mechanism [33]. This mechanism allows transformers to weigh the importance of different elements in a sequence when processing each component, enabling them to capture long-range dependencies that evade traditional recurrent neural networks. For genomic sequences, this means identifying functional elements that influence each other across large stretches of DNA; for protein sequences, it means recognizing structurally critical residues that may be distant in sequence space but proximate in three-dimensional folding.
In integrative omics, transformers process heterogeneous biological data by treating different omics measurements as "words" in a biological "language" [35]. This approach has proven particularly valuable for modeling the complex, non-linear relationships between genetic variants, gene expression patterns, protein abundances, and metabolic fluxes that underlie disease pathogenesis. The ability to handle context at multiple scales makes transformers exceptionally capable of identifying subtle patterns across omics layers that might indicate early disease processes or potential therapeutic targets.
Recent innovations like the Edge-Set Attention (ESA) architecture have adapted transformers specifically for graph-structured biological data, combining masked and vanilla self-attention modules to learn effective representations of edges while overcoming graph misspecification issues [33]. This approach has demonstrated state-of-the-art performance across diverse biological tasks, from molecular property prediction to heterophilous node classification in biological networks, establishing transformers as versatile tools for integrative omics analysis.
Autoencoder Frameworks: Dimensionality Reduction and Generative Modeling
Autoencoders and their variational extensions provide crucial capabilities for handling the high-dimensionality of omics data through non-linear dimensionality reduction and generative modeling [34]. These architectures consist of an encoder network that compresses input data into a lower-dimensional latent representation and a decoder network that reconstructs the original data from this compressed form. The latent space learned by autoencoders typically captures the most salient features of the input data, effectively denoising measurements and identifying biologically meaningful patterns.
In integrative omics research, Variational Autoencoders (VAEs) are particularly valuable for their ability to model complex probability distributions of biological data [34]. This enables researchers to generate novel molecular structures with desired properties, interpolate between existing biological states to hypothesize intermediate phenotypes, and identify rare cell states or disease subtypes that might be overlooked in conventional analysis. The regularization inherent in VAEs encourages the learning of smooth, continuous latent spaces where direction often corresponds to biologically interpretable transitions, such as disease progression or treatment response.
Hybrid architectures that combine autoencoders with other AI powerhouses are pushing the boundaries of generative biology. The Transformer Graph Variational Autoencoder (TGVAE) exemplifies this trend, integrating molecular graphs as input data to better capture structural relationships while addressing challenges like over-smoothing in GNN training and posterior collapse in VAEs [34]. Such architectures demonstrate how autoencoder frameworks serve as foundational components in sophisticated AI systems for biomedical discovery.
Table 1: Performance Comparison of Core AI Architectures on Biomedical Tasks
| Architecture | Primary Strength | Exemplary Application | Reported Performance |
|---|---|---|---|
| Graph Neural Networks | Modeling relational inductive biases | Molecular property prediction | 51% average improvement in classification F1-score vs. baselines [32] |
| Transformers | Capturing long-range dependencies | Protein structure prediction | Near-experimental accuracy with AlphaFold [35] |
| Autoencoders/VAEs | Dimensionality reduction & generation | Novel molecule generation | Produces larger collection of diverse, valid structures vs. approaches [34] |
| Hybrid (TGVAE) | Combining multiple advantages | Molecular graph generation | Outperforms existing approaches on diversity and novelty metrics [34] |
Methodologies and Experimental Protocols
Multi-Omics Integration Using Graph Neural Networks
Protocol Title: Integrative Analysis of Mitochondrial Diseases Using GNN-Based Multi-Omics Integration
Background and Purpose: Mitochondrial diseases exhibit exceptional clinical variability despite common downstream effects of respiratory chain dysfunction [25]. This protocol details a GNN-based approach for integrating genomics, transcriptomics, proteomics, and metabolomics data to uncover tissue-specific manifestations and identify potential treatment targets.
Experimental Workflow:
Data Collection and Preprocessing
- Collect genomic variants (whole exome/genome sequencing), transcriptomic profiles (RNA-seq), proteomic measurements (mass spectrometry), and metabolomic data (LC-MS) from patient samples and model systems
- Perform quality control, normalization, and batch effect correction for each omics dataset separately
- Annotate functional consequences of genomic variants using established prediction tools
Biological Network Construction
- Build a multi-layered network with nodes representing biological entities (genes, proteins, metabolites)
- Establish edges based on:
- Protein-protein interactions (from curated databases)
- Metabolic pathway connections (from KEGG, Reactome)
- Gene regulatory relationships (from chromatin interaction data, TF binding sites)
- Co-expression patterns (from transcriptomic data)
- Annotate node features using corresponding omics measurements
Graph Neural Network Implementation
- Implement a multi-relational GNN architecture capable of handling different edge types
- Employ message-passing layers that aggregate information from neighboring nodes according to edge type
- Use attention mechanisms to learn importance weights for different neighbors
- Include multiple readout functions for node-level (e.g., protein function prediction) and graph-level (e.g., sample classification) tasks
Model Training and Validation
- Train models using stratified k-fold cross-validation to ensure robustness
- Implement appropriate loss functions for specific prediction tasks (cross-entropy for classification, mean squared error for regression)
- Validate predictions using orthogonal experimental approaches (e.g., CRISPR screens, metabolic flux assays)
Biological Insight Extraction
- Analyze learned node embeddings to identify clusters of functionally related entities
- Use gradient-based attribution methods to identify important subnetwork components
- Generate hypotheses about key regulatory mechanisms for experimental validation
Molecular Generation with Transformer Graph Variational Autoencoders
Protocol Title: Generative Molecular Design Using Transformer Graph Variational Autoencoders for Drug Discovery
Background and Purpose: Traditional molecular generation often relies on simplified representations that limit diversity and novelty [34]. This protocol describes the use of TGVAE for generating novel molecular structures with desirable properties by directly operating on molecular graphs.
Experimental Workflow:
Molecular Graph Representation
- Represent molecules as graphs with atoms as nodes and bonds as edges
- Encode atom features (element type, hybridization, formal charge, etc.) as node attributes
- Encode bond features (bond type, conjugation, stereochemistry, etc.) as edge attributes
- Curate large-scale molecular datasets with associated property measurements for training
TGVAE Architecture Configuration
- Implement graph encoder using GNN layers to produce latent node representations
- Employ transformer layers to capture global molecular context beyond local neighborhoods
- Design variational bottleneck to learn probabilistic latent space with regularized distributions
- Implement graph decoder that reconstructs molecular structure from latent representations
Model Training Strategy
- Use reconstruction loss measuring similarity between input and reconstructed molecules
- Incorporate Kullback-Leibler divergence term to regularize latent space as in standard VAEs
- Add property prediction losses for targeted generation of molecules with specific characteristics
- Address over-smoothing in GNNs through skip connections and regularization
- Mitigate posterior collapse in VAEs through appropriate weighting of KL divergence term
Molecular Generation and Optimization
- Sample from latent space to generate novel molecular structures
- Implement property-guided generation by interpolating in latent space toward desired property values
- Use Bayesian optimization for efficient exploration of chemical space targeting specific properties
- Apply validity constraints to ensure generated structures are chemically plausible
Experimental Validation
- Synthesize top-performing generated molecules for experimental testing
- Measure binding affinities, biological activities, and ADMET properties
- Use results to refine generative models through active learning cycles
Table 2: Research Reagent Solutions for AI-Driven Biomedical Research
| Reagent/Resource | Function in AI Research | Exemplary Applications |
|---|---|---|
| Molecular Graph Datasets | Structured representation of chemical compounds | Training GNNs for molecular property prediction [34] |
| Multi-Omics Reference Sets | Integrated genomic, transcriptomic, proteomic, metabolomic data | Training models for disease mechanism elucidation [25] |
| AlphaFold Protein Structure Database | Accurate protein structure predictions | Providing structural constraints for molecular interaction models [35] |
| Graph Neural Network Frameworks | Software libraries for GNN implementation | Building models for biological network analysis [32] |
| Transformer Architectures | Base models for sequence and graph processing | Adapting to biological sequence and structure analysis [33] |
| AI-Driven Screening Platforms | High-throughput virtual screening | Identifying drug candidates from large chemical libraries [35] |
Signaling Pathways in Mitochondrial Diseases Elucidated Through AI-Driven Integrative Omics
The application of AI methodologies to integrative omics data has been particularly illuminating for understanding the complex signaling pathways underlying mitochondrial diseases. Research combining genomics, transcriptomics, proteomics, and metabolomics through GNNs and other AI approaches has revealed several key pathways that explain the tissue-specific manifestations and variable clinical presentations of these disorders [25].
Mitochondrial Integrated Stress Response (ISRmt) AI-driven analysis of multi-omics data from mitochondrial disease models identified ISRmt as a central pathway coordinating cellular adaptation to mitochondrial dysfunction [25]. This multifaceted, tissue-specific response is activated upon mitochondrial stress and involves changes in gene expression mediated by transcription factors ATF4, ATF5, and ATF3. Downstream consequences include de novo synthesis of metabolic cytokines FGF21 and GDF15, remodeling of one-carbon and folate metabolism, and increased serine and nucleotide pools. The upstream regulator of this pathway is mTORC1 (mechanistic target of rapamycin complex 1), and significantly, inhibition of mTORC1 with rapamycin reverses molecular defects and tissue-level pathology in mouse models of mitochondrial myopathy [25].
Foliate-Driven One-Carbon Metabolism Remodeling Multi-omics approaches revealed major remodeling of the anabolic folate-driven one-carbon cycle specifically in tissues affected by mitochondrial diseases [25]. This pathway directs one-carbon units for purine and glutathione synthesis, suggesting therapy targets in the folate cycle as potential treatment avenues. Similar findings were reported in human cells depleted for genes essential for mitochondrial DNA maintenance, confirming the conserved nature of this metabolic adaptation across species and different genetic causes of mitochondrial dysfunction.
Coenzyme Q Biosynthesis Pathway Integrative analysis of transcriptomic and mitochondrial proteomic data from conditional knockout mouse models of genes essential for mitochondrial DNA expression revealed substantially reduced coenzyme Q (CoQ) levels and decreased levels of multiple mitochondrial CoQ biosynthesis enzymes [25]. Since CoQ functions as an electron carrier from complexes I and II to complex III in the inner mitochondrial membrane and has antioxidant characteristics, these AI-driven findings suggest controlled therapy trials with CoQ derivatives for patients with mitochondrial DNA maintenance defects.
Quantitative Performance Analysis of AI Architectures in Biomedical Applications
Rigorous evaluation of AI architectures across diverse biomedical tasks provides critical insights into their relative strengths, limitations, and appropriate application domains. The tables below summarize key performance metrics for GNNs, transformers, autoencoders, and hybrid architectures across molecular, clinical, and omics analysis tasks.
Table 3: AI Architecture Performance on Molecular and Clinical Tasks
| Task Category | Best-Performing Architecture | Key Metric | Performance Gain vs. Baseline | Clinical/Biological Impact |
|---|---|---|---|---|
| Molecular Generation | Transformer Graph VAE (TGVAE) | Diversity/Novelty | Outperforms existing approaches; generates previously unexplored structures [34] | Expands chemical space for drug discovery; identifies novel therapeutic candidates |
| Protein Structure Prediction | Transformer-based (AlphaFold) | Accuracy vs. Experimental | Near-experimental accuracy [35] | Accelerates structure-based drug design; elucidates protein function |
| Multi-Omics Integration | GNNs with Attention | Classification F1-Score | 51% average improvement vs. baselines [32] | Improves disease subtyping; identifies novel biomarkers |
| Drug Target Identification | Hybrid GNN-Transformer | Hit Rate | 150% improvement in hit-rate vs. baseline [32] | Accelerates therapeutic development; improves success rates |
| Clinical Trial Optimization | AI-Enhanced Design | Recruitment Efficiency | Not quantified but significant time savings reported [35] | Reduces trial duration; improves patient matching |
Table 4: Computational Efficiency and Scalability Metrics
| Architecture | Training Data Requirements | Inference Speed | Scalability to Large Graphs | Interpretability |
|---|---|---|---|---|
| Basic GNNs | Moderate | Fast | Limited by graph size | Moderate (via attention weights) |
| Graph Transformers | Large | Moderate | Challenging without approximations | High (via attention maps) |
| Autoencoders | Moderate to Large | Fast | Excellent for linear dimensions | Low (black box latent space) |
| Hybrid (TGVAE) | Large | Moderate | Good with optimized implementation | Moderate to High |
The performance data reveals several key patterns. First, hybrid architectures consistently outperform single-method approaches across multiple biomedical tasks, demonstrating the value of combining complementary AI methodologies [34] [33]. Second, task-specific optimization remains crucial—while transformers excel at capturing long-range dependencies in sequences, GNNs maintain advantages for explicitly relational data. Third, scalability and interpretability often present trade-offs against predictive performance, requiring careful architecture selection based on application requirements.
Notably, the Edge-Set Attention (ESA) architecture, a purely attention-based approach for graphs, has demonstrated particularly strong performance across multiple domains [33]. Despite its simplicity, ESA outperformed fine-tuned message-passing baselines and more complex transformer-based methods on over 70 node and graph-level tasks, including challenging long-range benchmarks. This architecture also showed state-of-the-art performance in transfer learning settings relevant to drug discovery and quantum mechanics, suggesting its potential as a general-purpose solution for biological graph learning.
The integration of AI powerhouses—GNNs, transformers, and autoencoders—with integrative omics approaches is fundamentally reshaping how researchers investigate disease mechanisms and develop therapeutic strategies. These technologies have evolved from supplemental analytical tools to central drivers of biological discovery, enabling researchers to navigate the complexity of multi-omics data with unprecedented sophistication. The demonstrated success of these approaches in elucidating mitochondrial disease pathways, generating novel therapeutic compounds, and identifying biomarkers underscores their transformative potential across biomedical research [34] [25].
Looking forward, several trends suggest an accelerating impact of AI in integrative omics. First, the convergence of geometric deep learning (including GNNs) with foundation models (large-scale pre-trained transformers) promises more generalizable representations that transfer across biological domains [33]. Second, the adoption of "lab-in-the-loop" approaches, where AI predictions directly guide experimental designs whose results then refine the AI models, creates virtuous cycles of discovery and validation [36]. Third, increased attention to model interpretability and regulatory compliance will be essential for clinical translation of AI-driven findings [37].
Despite rapid progress, significant challenges remain. Data quality and standardization continue to limit model performance, particularly for rare diseases with limited datasets. Model interpretability, while improving through attention mechanisms and attribution methods, still requires advancement to fully earn the trust of clinical and regulatory stakeholders. Ethical considerations around data usage, algorithm transparency, and equitable benefit distribution demand ongoing attention as these technologies become more pervasive in biomedical research [35] [37].
As AI methodologies continue to mature and integrate more deeply with experimental biology, they hold the potential to unravel previously intractable complexities of disease mechanisms and dramatically accelerate the development of targeted therapies. The interdisciplinary collaboration between AI researchers, biologists, and clinicians will be essential to fully realize this potential and ultimately improve patient outcomes across a wide spectrum of human diseases.
The advent of single-cell multi-omics technologies has revolutionized cellular analysis by enabling unprecedented resolution in exploring cellular heterogeneity, developmental trajectories, and disease mechanisms. However, the high-dimensionality, technical noise, and multimodal nature of these datasets have exposed critical limitations in traditional computational methodologies. Foundation models, originally developed for natural language processing, are now driving a paradigm shift in the analysis of single-cell data [38]. These large, pretrained neural networks learn universal representations from vast and diverse datasets, demonstrating exceptional cross-task generalization capabilities that enable zero-shot cell type annotation and perturbation response prediction [39] [38].
Frameworks such as scGPT and scPlantFormer represent a transformative approach to decoding cellular complexity across species [38]. By adapting transformer architectures to single-cell data, these models facilitate a comprehensive understanding of cellular characteristics based on gene expression, simultaneously learning both cell and gene representations [40]. This technical advancement is particularly crucial within the context of integrative omics for understanding disease mechanisms, as it provides researchers with powerful tools to unravel the multilayered regulatory networks that underlie human pathologies and therapeutic responses.
Technical Architectures of Single-Cell Foundation Models
scGPT: A Generative Pretrained Transformer for Single-Cell Biology
The scGPT model is built on a generative pretrained transformer architecture specifically designed for single-cell multi-omic data analysis. As the first single-cell foundation model constructed through generative pre-training on over 33 million cells, scGPT incorporates innovative techniques to overcome methodological and engineering challenges specific to large-scale single-cell omic data [40] [39]. The model's architecture consists of 12 transformer blocks with 8 attention heads per block, creating an embedding size of 512 dimensions and containing approximately 53 million parameters [41].
The pretraining process employs self-supervised objectives including masked gene modeling, where random genes in the expression profile are masked and the model learns to predict them based on context [38]. This approach allows scGPT to develop a fundamental understanding of gene-gene relationships and cellular states. The model's input begins as a raw count matrix (Cell X Gene), with each gene treated as a distinct token and assigned a unique identifier [41]. A value binning technique converts all expression counts into relative values, while condition tokens encompass diverse meta information associated with individual genes, such as functional pathways or perturbation experiment alterations [41].
scPlantFormer: A Lightweight Specialized Model for Plant Biology
scPlantFormer represents a specialized foundation model optimized for plant single-cell omics, pretrained on approximately 1 million Arabidopsis thaliana cells [38]. This model integrates phylogenetic constraints directly into its attention mechanism, enabling it to capture evolutionary relationships that are crucial for cross-species analysis in plant systems [38]. Despite its smaller training dataset compared to scGPT, scPlantFormer achieves remarkable 92% cross-species annotation accuracy, demonstrating how domain-specific adaptations can yield highly performant models with more focused training data [38].
The architectural innovations in scPlantFormer highlight how foundation models can be tailored to specific biological contexts while maintaining robust performance across multiple downstream tasks. Its lightweight design makes it particularly suitable for research communities with more limited computational resources, while still excelling in cross-species data integration and cell-type annotation [38].
Table 1: Comparative Architecture of Single-Cell Foundation Models
| Feature | scGPT | scPlantFormer |
|---|---|---|
| Training Scale | 33+ million cells [39] | 1 million cells [38] |
| Model Size | 53 million parameters [41] | Information not specified |
| Architecture | 12 transformer blocks, 8 attention heads [41] | Phylogenetically constrained transformer [38] |
| Embedding Dimension | 512 [41] [42] | Information not specified |
| Key Innovation | Large-scale pretraining on diverse cell types [40] | Integration of phylogenetic constraints [38] |
| Cross-Species Accuracy | Information not specified | 92% annotation accuracy [38] |
Core Capabilities and Experimental Applications
Multi-Batch and Multi-Omic Integration
A primary application of scGPT lies in its powerful capacity for multi-batch integration, where it can effectively integrate multiple scRNA-seq datasets while correcting for technical batch effects without compromising biological variance [40] [41]. This capability is crucial for large-scale collaborative studies where data generated across different platforms and laboratories must be harmonized. Similarly, the scGPT framework extends to multi-omic integration, seamlessly combining data from multiple sequencing modalities including scRNA-seq, scATAC-seq, and protein abundance data into a unified analytical framework [41].
The experimental protocol for batch integration typically involves:
- Data Preprocessing: Raw count matrices are processed, and highly variable genes are selected (e.g., top 3000 genes using Seurat_v3) [42]
- Model Loading: Pretrained scGPT model checkpoints are loaded and configured for the specific task
- Embedding Generation: The
embed_datafunction is used to generate latent representations of cells [42] - Downstream Analysis: Standard workflows including neighbor calculation and UMAP projection are applied to the embeddings [42]
Cell Type Annotation and Cross-Species Transfer
Both scGPT and scPlantFormer excel at cell type annotation, enabling accurate labeling of single cells based on their gene expression profiles [41]. scGPT particularly demonstrates zero-shot capabilities, allowing it to annotate cell types without task-specific fine-tuning [38]. This is particularly valuable for identifying rare or previously uncharacterized cell populations in novel datasets.
For cross-species applications, these models address the significant challenge of "species effect"—where cells from the same species exhibit higher transcriptomic similarity among themselves rather than with their cross-species counterparts due to evolutionary divergence [43]. The experimental workflow for cross-species annotation typically involves:
- Orthology Mapping: Establishing gene correspondence between species using resources like ENSEMBL multiple species comparison tools [43]
- Data Concatenation: Creating a combined raw count matrix spanning species [43]
- Integration: Applying foundation models to generate a shared latent space where homologous cell types align regardless of species origin [43] [38]
- Validation: Using metrics such as Alignment Score to quantify the percentage of cross-species neighbors [43]
Perturbation Modeling and Gene Network Inference
Foundation models enable in silico perturbation prediction, allowing researchers to forecast the effects of genetic perturbations on gene expression without conducting expensive and time-consuming experiments [39] [41]. scGPT has been specifically validated on perturbation datasets from published studies, demonstrating accurate prediction of transcriptional responses to genetic interventions [39].
Additionally, these models facilitate gene network inference by constructing gene similarity networks that reveal functional relationships and regulatory interactions [41]. The attention mechanisms within transformer architectures naturally capture gene-gene relationships during pretraining, which can be extracted to infer potential regulatory networks [40] [38].
Table 2: Performance Metrics of Foundation Model Applications
| Application Domain | Reported Performance | Validation Dataset |
|---|---|---|
| Cell Type Annotation | Zero-shot capability demonstrated [38] | Multiple tissues and species [39] |
| Cross-Species Transfer | 92% accuracy for scPlantFormer [38] | Arabidopsis thaliana and related species [38] |
| Perturbation Prediction | Accurate prediction of perturbation effects [39] | Norman, Adamson, and Replogle datasets [39] |
| Multi-Batch Integration | Effective batch correction while preserving biology [40] | PBMC and perirhinal cortex datasets [39] |
| Gene Network Inference | Construction of biologically relevant gene networks [41] | Various single-cell datasets [40] |
Foundation Model Workflow for Single-Cell Analysis
Practical Implementation Guide
Environment Setup and Data Preparation
Implementing scGPT requires specific computational environment configuration. The released version of scGPT requires PyTorch 2.1.2, which may necessitate removing existing PyTorch installations and replacing them with the compatible version [42]. Essential dependencies include scGPT, Scanpy, and NumPy, which can be installed via pip packages [42].
For data preparation, the standard input format is an AnnData object containing raw count matrices. A critical preprocessing step involves selecting highly variable genes (HVG) to reduce dimensionality and computational requirements while preserving biological signal. The standard approach uses Scanpy's highly_variable_genes function with flavor='seuratv3' to select the top 3000 highly variable genes [42]. For CZ CELLxGENE datasets, gene names are typically stored in the 'featurename' column rather than as symbols, which must be specified during embedding generation [42].
Model Inference and Embedding Generation
The core functionality of scGPT involves generating meaningful embeddings from single-cell data using the embed_data function [42]. Key parameters include:
model_dir: Path to the pretrained model checkpointsgene_col: Column name containing gene identifiers ('feature_name' for CELLxGENE data)batch_size: Typically set to 64 for balanced memory usage and speedreturn_new_adata: Boolean indicating whether to return a new AnnData object with embeddings
The resulting embeddings have a dimensionality of 512 (cells × 512) and capture the essential biological state of each cell [42]. These embeddings can then be used for downstream analyses including clustering, visualization, and trajectory inference using standard single-cell analysis workflows.
Downstream Analysis and Visualization
Once embeddings are generated, standard single-cell analysis workflows can be applied:
- Neighbor Calculation:
sc.pp.neighbors(ref_embed_adata, use_rep="X")computes nearest neighbors based on scGPT embeddings [42] - UMAP Projection:
sc.tl.umap(ref_embed_adata)generates two-dimensional visualization - Cluster Annotation: Cell types can be annotated based on marker gene expression visualized on UMAP plots
The scGPT embeddings effectively capture the structure of the data, typically aligning closely with original author annotations while potentially revealing additional biological insights [42]. For cross-species analysis, additional validation steps should be performed to ensure homologous cell types are properly aligned in the integrated space.
Table 3: Essential Research Reagents and Computational Tools
| Resource Name | Type | Function in Analysis | Access Information |
|---|---|---|---|
| CZ CELLxGENE Census | Data Resource | Provides standardized single-cell data for pretraining and analysis [39] [41] | https://cellxgene.cziscience.com/ |
| scGPT Model Checkpoints | Pretrained Model | Contains weights and parameters for generating embeddings [42] | https://github.com/bowang-lab/scGPT |
| Scanpy | Computational Tool | Python-based single-cell analysis toolkit for preprocessing and visualization [42] | https://scanpy.readthedocs.io/ |
| ENSEMBL Orthology | Bioinformatics Resource | Mapping gene orthology relationships for cross-species analysis [43] | https://www.ensembl.org/info/genome/compara/ |
| BioLLM | Benchmarking Framework | Standardized framework for evaluating single-cell foundation models [38] | Research publication [38] |
Integration with Disease Mechanism Research
Connecting Model Capabilities to Disease Biology
The capabilities of single-cell foundation models directly address critical challenges in disease mechanism research. By enabling multimodal integration, these models facilitate the unification of transcriptomic, epigenomic, proteomic, and spatial data to construct comprehensive molecular portraits of disease states [38]. This is particularly valuable for complex diseases like cancer, where the tumor immune microenvironment (TIME) contains diverse proliferating cell populations that collectively drive pathological processes such as tumor growth, immune evasion, and therapy resistance [26].
In practice, researchers have successfully applied these models to identify clinically relevant cellular states. For example, the Scissor algorithm has been used with single-cell data to identify proliferating cell genes associated with prognosis in lung adenocarcinoma (LUAD) [26]. These approaches can delineate the dynamics of proliferating cells in cancer, enhancing prognostic accuracy and highlighting potential targets for personalized therapeutic interventions [26].
Applications in Precision Oncology and Drug Development
For drug development professionals, foundation models offer powerful capabilities for drug response prediction and target identification. By learning universal representations of cellular states, these models can predict how cells will respond to therapeutic perturbations, potentially accelerating drug discovery pipelines [41] [38]. The cross-species capabilities further enable more effective translation between model organisms and human biology, addressing a significant challenge in preclinical drug development.
In cancer research, integrative multi-omics approaches combining foundation models with machine learning have demonstrated superior performance in predicting prognosis and clinical outcomes compared to traditional models [26]. For instance, risk scores derived from single-cell analyses of proliferating cells have shown potential for predicting immunotherapy response and guiding treatment selection between immunotherapeutic, chemotherapeutic, and targeted therapeutic agents [26].
Disease Mechanism Research Application Pipeline
Future Directions and Challenges
Technical Limitations and Model Biases
Despite their transformative potential, single-cell foundation models face several significant challenges. A primary concern is the potential for model biases reflecting limitations in training data. These models may exhibit skewed predictions due to underrepresentation of certain tissues, cell types, or ethnicities in training datasets [41]. Performance may degrade when analyzing cell types, tissues, or species not well represented in the original training data, highlighting the importance of validating model outputs against independent datasets [41].
Additional technical challenges include batch effect propagation during transfer learning, where technical artifacts in pretraining data may inadvertently influence downstream applications [38]. There are also persistent gaps in translating computational insights into clinical applications, requiring further development of robust validation frameworks and standardization of evaluation metrics across studies [38].
Emerging Innovations and Development Opportunities
The field of single-cell foundation models is rapidly evolving with several promising directions for future development. Multimodal integration approaches are advancing to better harmonize transcriptomic, epigenomic, proteomic, and spatial imaging data [38]. Innovations such as PathOmCLIP, which aligns histology images with spatial transcriptomics via contrastive learning, and GIST, which combines histology with multi-omic profiles for 3D tissue modeling, demonstrate the power of cross-modal alignment [38].
Computational ecosystems are also maturing, with platforms like BioLLM providing universal interfaces for benchmarking multiple foundation models, and DISCO and CZ CELLxGENE Discover aggregating over 100 million cells for federated analysis [38]. These infrastructures will be critical for sustaining progress in single-cell omics by addressing challenges of ecosystem fragmentation, inconsistent evaluation metrics, and limited model interoperability [38].
For researchers and drug development professionals, these advancements promise increasingly powerful tools for unraveling disease mechanisms and developing targeted therapeutic interventions. As foundation models continue to evolve, they will likely become indispensable components of the integrative omics toolkit, bridging critical gaps between cellular measurements and actionable biological understanding.
The complexity of biological systems necessitates integrative approaches that can synthesize information from multiple omics layers. Network-based integration provides a powerful framework for mapping high-throughput biological data onto protein-protein interaction (PPI) and gene regulatory networks, enabling researchers to identify functional modules, key regulatory elements, and dysregulated pathways in human diseases. This technical guide examines current methodologies, tools, and analytical frameworks for effective network-based integration, with emphasis on practical implementation for disease mechanism research and therapeutic development. By providing detailed protocols, visualization strategies, and analytical workflows, this whitepaper serves as a comprehensive resource for researchers and drug development professionals seeking to leverage network biology in precision medicine initiatives.
Biological networks provide fundamental organizational principles that govern cellular function, with protein-protein interactions and gene regulatory relationships forming the backbone of molecular systems biology. The mapping of omics data onto these networks has revolutionized our ability to interpret disease-associated genetic variants, transcriptomic changes, and proteomic alterations within a functional context. Network medicine approaches have demonstrated that complex diseases often arise from perturbations in interconnected functional modules rather than isolated molecular defects, highlighting the necessity of system-level analyses [26]. Integrative multi-omics strategies now enable researchers to construct comprehensive network models that capture the hierarchical organization of biological systems, from genetic determinants to phenotypic manifestations.
The analytical power of network-based integration stems from its ability to reduce dimensionality while preserving biological context. When genomic, transcriptomic, proteomic, or metabolomic data are mapped onto predefined network architectures, statistically significant patterns emerge that would remain obscured in conventional single-layer analyses. This approach has proven particularly valuable in oncology, where tumor heterogeneity and complex microenvironment interactions create challenges for traditional reductionist methods [26]. Beyond cancer, network-based integration has illuminated pathological mechanisms in neurodegenerative, metabolic, and autoimmune disorders, often revealing unexpected connections between seemingly distinct disease pathways.
Successful network-based integration begins with selecting appropriate, high-quality network resources. Multiple publicly available databases provide comprehensive, experimentally validated interactions, each with distinct strengths and coverage areas. The table below summarizes essential data sources for network-based studies.
Table 1: Essential Data Sources for Network-Based Integration
| Resource Name | Network Type | Key Features | Statistics | Use Cases |
|---|---|---|---|---|
| STRING [44] | Protein-Protein Interactions | Functional associations, integrated scoring | 59.3 million proteins, >20 billion interactions | Functional enrichment, pathway analysis |
| NetworkAnalyst [45] | Multiple | PPI, gene co-expression, TF-target | Integrates STRING v12.0, IntAct 2024 | Multi-omics visualization, meta-analysis |
| CHEA3 [45] | Gene Regulatory | Transcription factor targets | Curated from ENCODE, ReMap, GTEx | Regulatory network inference |
| IntAct [45] | Protein-Protein Interactions | Experimentally determined | 2024 release (247) | Complex identification, validation |
The STRING database represents a particularly comprehensive resource for PPIs, incorporating both experimentally determined and computationally predicted interactions with a sophisticated scoring system that evaluates evidence confidence [44]. For gene regulatory networks, CHEA3 provides curated transcription factor-target interactions aggregated from multiple authoritative sources including ENCODE and ReMap [45]. Specialized tools like NetworkAnalyst offer pre-integrated networks from multiple sources, along with analytical capabilities for direct omics data mapping and visualization [45].
When selecting network resources, researchers should consider species coverage, tissue specificity, and evidence types. The integration of temporal dynamics through tools like KronoGraph further enhances analytical depth by enabling the visualization of network changes across timepoints or disease progression stages [46].
Methodological Framework for Network-Based Integration
Data Preprocessing and Quality Control
The initial phase of network-based integration requires rigorous data preprocessing to ensure compatibility between omics datasets and network structures. For transcriptomic data, this typically includes normalization to remove technical artifacts, batch effect correction in multi-study designs, and variance stabilization to enhance signal detection. In proteomic data, similar normalization approaches are applied alongside missing value imputation strategies appropriate for mass spectrometry-based measurements. Single-cell RNA sequencing data demands additional processing steps including doublet removal, cell cycle scoring, and harmony analysis to correct batch effects across samples, as demonstrated in recent LUAD studies [26].
Quality assessment should include both technical metrics (sequencing depth, mapping rates, sample clustering) and biological validations (expression of housekeeping genes, cell type markers). The resulting processed data matrices—with genes/proteins as rows and samples/conditions as columns—serve as inputs for subsequent network mapping procedures. For differential expression analyses, statistical frameworks such as DESeq2 for RNA-seq or limma for microarray data generate fold-change values and statistical significances that facilitate prioritization of network elements.
Network Mapping and Visualization Approaches
The core integration process involves mapping processed omics data onto network structures through both topology-based and statistics-driven approaches. Topology-based methods leverage network architecture measures (degree centrality, betweenness, clustering coefficient) to identify highly connected regions enriched for omics signals. Statistics-driven approaches employ enrichment tests to determine whether proteins/genes with significant omics alterations aggregate in specific network neighborhoods.
Effective visualization is critical for interpreting integrated networks. The following Graphviz diagram illustrates a standard workflow for network-based integration of multi-omics data:
Network Integration Workflow
Modern visualization tools like Cytoscape and NAViGaTOR provide sophisticated environments for interactive exploration of integrated networks, offering multiple layout algorithms to optimize network representation [47]. Accessibility considerations should inform visualization choices, including implementation of keyboard navigation, screen reader compatibility, and colorblind-friendly palettes to ensure research tools serve diverse users [46]. For large, dense networks, hierarchical visualization techniques that emphasize modular organization or focus+context approaches that highlight regions of interest while maintaining global context improve interpretability.
Analytical Techniques for Integrated Networks
Topological and Functional Analysis
Once omics data is successfully mapped onto networks, multiple analytical approaches extract biological insights. Topological analysis identifies network properties associated with functional importance, as proteins with high connectivity (hubs) often represent critical regulatory elements. In disease contexts, differential network analysis compares network properties between conditions to identify topological changes indicative of pathological rewiring. The Scissor algorithm represents an advanced approach for linking single-cell phenotypes to bulk transcriptomic data by identifying cells in scRNA-seq datasets whose expression patterns significantly correlate with clinical outcomes [26].
Functional interpretation of integrated networks typically employs enrichment analysis to determine whether specific biological processes, pathways, or molecular functions aggregate in network regions enriched for omics alterations. Gene Ontology terms, KEGG pathways, and Reactome modules provide standardized frameworks for functional annotation. The following protocol outlines a standard analytical workflow for functional network analysis:
Table 2: Protocol for Functional Analysis of Integrated Networks
| Step | Procedure | Parameters | Tools | Output |
|---|---|---|---|---|
| 1. Network Clustering | Identify densely connected modules | Resolution: 0.5-1.5Algorithm: Louvain, Leiden | Cytoscape, NetworkAnalyst | Network modules |
| 2. Module Characterization | Extract genes/proteins from each module | Minimum size: 5 nodesMaximum size: 500 nodes | Custom scripts | Gene lists per module |
| 3. Functional Enrichment | Test modules for process overrepresentation | FDR cutoff: <0.05Min. overlap: 2 genes | clusterProfiler, Enrichr | Significant terms |
| 4. Driver Identification | Apply network centrality measures | Degree, Betweenness, Eigenvalue | CytoHubba, igraph | Key regulators |
| 5. Validation | Compare with independent datasets | Statistical concordance | Fisher's exact test | Validated targets |
In the LUAD study utilizing the Scissor+ proliferating cell risk score (SPRS), researchers applied similar analytical techniques to identify 22 Scissor+ proliferating cell genes with significant prognostic implications, subsequently employing 111 machine learning combinations to develop a predictive model that outperformed 30 previously published models [26]. This demonstrates the power of combining network topology with machine learning for clinical prediction.
Advanced Integrative Approaches
Beyond standard topological and functional analyses, several advanced methods enhance the analytical depth of network-based integration. Multi-layer networks simultaneously model different interaction types (e.g., physical interactions, genetic interactions, metabolic exchanges) within a unified framework, capturing the multi-scale organization of biological systems. Dynamic network analysis extends static network models to incorporate temporal changes, such as those occurring during disease progression or therapeutic intervention, using tools like KronoGraph for timeline visualization [46].
Machine learning approaches increasingly complement conventional network analyses. Network-based feature selection incorporates topological properties as priors in predictive model development, often improving generalizability and biological interpretability. Deep learning architectures that operate directly on graph structures, such as graph neural networks, enable end-to-end learning from integrated network data, potentially identifying complex patterns beyond conventional analytical approaches.
Applications in Disease Mechanisms and Therapeutic Development
Elucidating Disease Mechanisms through Network Pathology
Network-based integration has fundamentally advanced our understanding of disease mechanisms by revealing how molecular alterations collectively disrupt biological systems. In lung adenocarcinoma (LUAD), integrated multi-omics analysis of proliferating cells identified distinct subpopulations with specific functional specializations and communication patterns [26]. The C3_KRT8 proliferating cell subpopulation emerged as a central network node, serving as a major sender of cellular signals through the MIF-CD74+CD44 signaling pathway while demonstrating spatial colocalization with other proliferating subpopulations in tissue contexts [26].
The following Graphviz diagram illustrates the key proliferating cell subpopulations and their communication networks identified in LUAD:
Proliferating Cell Network in LUAD
Such network analyses reveal not only individual pathogenic components but also the system-level rewiring that characterizes complex diseases. The application of NicheNet to LUAD data further predicted that IL1B ligands drive the specific phenotype of Scissor+ proliferating cells, suggesting a potential therapeutic target for this aggressive subtype [26]. These approaches move beyond cataloguing individual alterations to understanding how those alterations disrupt the broader network architecture of cellular systems.
Therapeutic Applications and Drug Development
Network-based integration directly impacts therapeutic development through multiple mechanisms: identification of novel drug targets, prediction of drug efficacy, and elucidation of resistance mechanisms. The SPRS model developed for LUAD successfully stratified patients according to immunotherapy response, with high-SPRS patients showing resistance to immunotherapy but increased sensitivity to specific chemotherapeutic and targeted agents [26]. This demonstrates how network-derived biomarkers can guide treatment selection in precision oncology.
Network approaches also facilitate drug repurposing by revealing unanticipated connections between drug targets and disease modules. By mapping both known drug targets and disease-associated genes onto integrated networks, researchers can identify proximal nodes that might confer therapeutic benefits. Additionally, network pharmacology models how polypharmacological agents simultaneously modulate multiple network nodes, potentially explaining both efficacy and toxicity profiles better than single-target models.
Research Reagent Solutions
Successful implementation of network-based integration requires both computational tools and experimental reagents for validation. The following table outlines essential research reagents and their applications in network-based studies.
Table 3: Essential Research Reagents for Network-Based Studies
| Reagent Category | Specific Examples | Primary Applications | Key Considerations |
|---|---|---|---|
| Antibodies for Validation | Anti-KRT8, Anti-MMP9, Anti-FABP4 | IHC, Western blot validation of network targets | Specificity verification across cell types |
| scRNA-seq Kits | 10x Genomics Chromium, SMART-seq | Single-cell transcriptomics for network inference | Cell viability, capture efficiency |
| Pathway Modulators | IL1B inhibitors, MIF signaling antagonists | Functional validation of predicted interactions | Dose optimization, off-target effects |
| CRISPR Libraries | Whole-genome knockout, focused gene sets | Experimental perturbation of network hubs | Delivery efficiency, coverage depth |
| Spatial Transcriptomics | 10x Visium, Slide-seq | Validation of predicted spatial relationships | Resolution limitations, data integration |
These reagents enable the transition from computational predictions to biological validation, a critical step in translational applications of network-based findings. For example, in the LUAD study, experimental verification of five pivotal genes confirmed their roles in immunotherapy response and established their utility as biomarkers [26]. Similarly, spatial transcriptomics validation of predicted colocalization patterns between C1FABP4, C2MMP9, and C3_KRT8 subpopulations strengthened confidence in the network-based inferences [26].
Implementation Considerations and Best Practices
Technical Implementation and Accessibility
Robust implementation of network-based integration requires attention to both computational efficiency and accessibility. Visualization tools should prioritize clear rendering of network structure and substructures while maintaining fast rendering performance even with large networks containing thousands of nodes and edges [47]. Interoperability with standard data formats (SIF, GraphML, JSON) ensures seamless integration with existing analytical pipelines and databases [45] [47].
Accessibility features should be incorporated throughout tool development, including keyboard navigation support for users with motor impairments, screen reader compatibility for visually impaired researchers, and colorblind-friendly palettes to ensure interpretability across diverse user populations [46]. These considerations align with WCAG and Section 508 standards while improving usability for all researchers. The implementation of ARIA labels appropriately describes complex visualizations to assistive technologies, while maintaining the option to provide text alternatives for users who cannot access the visual representations [46].
Analytical Validation and Reproducibility
Validation of network-based findings requires rigorous statistical frameworks and experimental confirmation. Statistical robustness should be assessed through permutation testing that evaluates whether observed network properties exceed chance expectations. Biological reproducibility necessitates validation in independent cohorts or experimental systems, with consistency across complementary analytical approaches strengthening conclusions.
Reproducibility practices include thorough documentation of software versions, parameter settings, and random seeds. Version-controlled code and containerization (e.g., Docker, Singularity) further enhance reproducibility by capturing complete analytical environments. Public deposition of both raw data and processed networks in standardized formats enables independent verification and extension of published findings.
Network-based integration of multi-omics data represents a paradigm shift in biomedical research, moving beyond reductionist approaches to embrace the inherent complexity of biological systems. By mapping molecular measurements onto protein-protein and gene regulatory networks, researchers can identify dysregulated functional modules, key regulatory nodes, and system-level properties that drive disease pathogenesis. The continued development of analytical methods, visualization tools, and experimental validation approaches will further enhance our ability to extract biological insights from integrated network models, ultimately accelerating therapeutic development and improving patient outcomes across diverse diseases.
Translational medicine is a dynamic discipline that bridges scientific discoveries and clinical practice to deliver effective healthcare interventions, fundamentally aiming to shorten the path from laboratory findings to therapeutic solutions [48]. In this endeavor, multi-omics analysis has become an essential paradigm, integrating data from diverse layers such as genomics, transcriptomics, proteomics, and metabolomics to gain a holistic understanding of the complex molecular networks governing disease [49]. This integration is crucial for bridging the gap between basic research and clinical application, facilitating precise diagnostics and personalized therapies. Cancer's staggering molecular heterogeneity exemplifies this challenge, as biological complexity arises from dynamic interactions across genomic, transcriptomic, epigenomic, proteomic, and metabolomic strata, where alterations at one level propagate cascading effects throughout the cellular hierarchy [50]. The emergence of multi-omics profiling represents an important methodological advance that enables researchers to recover system-level signals that are often missed by single-modality studies [50]. However, this promise is tempered by formidable computational and statistical challenges rooted in intrinsic data heterogeneity, including dimensional disparities, temporal heterogeneity, analytical platform diversity, and missing data [50]. This whitepaper explores how integrative omics approaches are powering drug target discovery, biomarker identification, and personalized treatment strategies within translational medicine.
Multi-Omics Technologies and Data Integration Strategies
Core Omics Technologies and Their Clinical Applications
Integrative omics approaches leverage multiple high-throughput technologies to dissect the biological continuum from genetic blueprint to functional phenotype. The table below summarizes the primary omics layers, their key components, and representative clinical applications in translational research.
Table 1: Core Omics Technologies and Their Clinical Applications in Translational Medicine
| Omics Layer | Key Components Analyzed | Analytical Technologies | Clinical/Translational Applications |
|---|---|---|---|
| Genomics | DNA-level alterations: SNVs, CNVs, structural rearrangements | Whole exome sequencing (WES), whole genome sequencing (WGS) | Tumor mutational burden (TMB) for immunotherapy response [51]; MSK-IMPACT: ~37% tumors harbor actionable alterations [51] |
| Transcriptomics | mRNA isoforms, non-coding RNAs, fusion transcripts | RNA sequencing (RNA-seq), microarrays | Oncotype DX (21-gene) and MammaPrint (70-gene) for breast cancer chemotherapy decisions [51] |
| Proteomics | Protein abundance, post-translational modifications | Mass spectrometry (MS), liquid chromatography-MS (LC-MS) | CPTAC studies identify functional subtypes and druggable vulnerabilities in ovarian/breast cancers [51] |
| Metabolomics | Small-molecule metabolites, carbohydrates, lipids | LC-MS, gas chromatography-MS, NMR spectroscopy | IDH1/2-mutant gliomas: oncometabolite 2-HG as diagnostic/mechanistic biomarker [51]; 10-metabolite plasma signature for gastric cancer detection [51] |
| Epigenomics | DNA methylation, histone modifications | Whole genome bisulfite sequencing (WGBS), ChIP-seq | MGMT promoter methylation predicts temozolomide benefit in glioblastoma [51]; multi-cancer early detection assays (e.g., Galleri test) [51] |
Data Integration Methodologies and Computational Approaches
The integration of these diverse omics layers requires sophisticated computational strategies to overcome significant analytical challenges. Current integration approaches can be broadly categorized into three main paradigms: statistical-based approaches, multivariate methods, and machine learning/artificial intelligence techniques [19]. Among these, statistical approaches (primarily correlation-based methods) show slightly higher prevalence, followed by multivariate approaches and machine learning techniques [19].
Correlation-based networks represent a widely employed application where nodes represent biological entities and edges are constructed based on correlation thresholds. The Weighted Gene Correlation Network Analysis (WGCNA) method identifies clusters of co-expressed, highly correlated genes (modules) that can be linked to clinically relevant traits [19]. The xMWAS platform performs pairwise association analysis combining Partial Least Squares (PLS) components and regression coefficients to generate multi-data integrative network graphs, enabling identification of communities of highly interconnected nodes through multilevel community detection [19].
Machine learning and deep learning approaches have emerged as powerful tools for multi-omics integration, particularly for identifying non-linear patterns across high-dimensional spaces [50]. For example, graph neural networks (GNNs) model protein-protein interaction networks perturbed by somatic mutations, prioritizing druggable hubs in rare cancers, while multi-modal transformers fuse MRI radiomics with transcriptomic data to predict glioma progression [50]. Recent breakthroughs include generative AI for synthesizing in silico "digital twins" – patient-specific avatars simulating treatment response – and foundation models pretrained on millions of omics profiles enabling transfer learning for rare cancers [50].
Driving Drug Target Discovery Through Multi-Omics Integration
AI-Powered Target Prioritization Frameworks
Multi-omics integration has revolutionized drug target discovery by enabling the identification of novel targets and understanding their mechanisms of action. A prominent example is GETgene AI, a framework that combines network-based prioritization, machine learning, and automated literature analysis powered by advanced language models [49]. When applied to pancreatic cancer, GETgene AI successfully prioritized high-priority targets, illustrating how AI-driven approaches can accelerate drug discovery [49]. These frameworks leverage multi-omics data from public repositories such as The Cancer Genome Atlas (TCGA), Pan-Cancer Analysis of Whole Genomes (PCAWG), MSK-IMPACT, and the Clinical Proteomic Tumor Analysis Consortium (CPTAC), which have collectively demonstrated the utility of multi-omics in uncovering cancer biology and clinically actionable biomarkers [51].
Metabolic Pathways as Therapeutic Targets
Integrative omics approaches have been particularly successful in identifying metabolic vulnerabilities in cancers. A classic example comes from gliomas, where integrated analyses identified IDH1/2 mutations leading to production of the oncometabolite 2-hydroxyglutarate (2-HG), which functions as both a diagnostic and mechanistic biomarker [51]. This discovery not only provided a diagnostic tool but also revealed a new therapeutic target, with IDH inhibitors now showing clinical efficacy.
Similarly, comprehensive overviews have highlighted the emerging roles of glucose-6-phosphate dehydrogenase (G6PD), a key metabolic enzyme in the pentose phosphate pathway, across various human cancers [48]. Increased G6PD expression and PPP flux have been associated with key cancer hallmarks such as enhanced proliferation, resistance to cell death, metabolic reprogramming, and metastatic potential [48]. Targeting G6PD has been shown to suppress tumor growth, sensitize cells to chemotherapy, and reduce metastatic capacity, suggesting its therapeutic relevance [48].
Table 2: Experiment Protocol for Multi-Omics Drug Target Discovery
| Protocol Step | Methodology | Key Parameters | Outcome Measures | ||
|---|---|---|---|---|---|
| Sample Collection | Tissue biopsies, blood samples (for liquid biopsies) | Snap-freezing in liquid N₂, PAXgene tubes for RNA | Sample quality metrics (RIN for RNA) | ||
| Multi-Omics Profiling | WES/WGS (genomics), RNA-seq (transcriptomics), LC-MS/MS (proteomics), LC-MS (metabolomics) | Sequencing depth: 100x WGS, 50M reads RNA-seq; MS resolution: 70,000 | Coverage uniformity, number of proteins/metabolites identified | ||
| Data Preprocessing | Quality control, normalization, batch effect correction | Tools: FastQC, DESeq2, ComBat | PCA plots pre/post correction, sample clustering | ||
| Target Identification | Differential expression, pathway enrichment, network analysis | FDR < 0.05, | log₂FC | > 1; pathway p-value < 0.01 | Candidate target list with priority scores |
| Experimental Validation | CRISPR screens, organoid models, patient-derived xenografts | Guides per gene: 4-6; replicates: n=3 | Functional validation scores, phenotype metrics |
Drug Repurposing Through Multi-Omics Signatures
Integrative omics approaches have also accelerated drug repurposing efforts by revealing novel mechanisms of action for existing drugs. For instance, a review highlighted the potential of metformin, a widely used antidiabetic drug, for repurposing in neurodegenerative diseases through its impact on lysosomal-dependent mechanisms [48]. Beyond its established role in glycemic control, metformin influences lysosomal targets and pathways—including endosomal Na+/H+ exchangers, presenilin enhancer 2 (PEN2), AMPK activation via the lysosomal pathway, and transcription factor EB (TFEB)—which are increasingly recognized as critical regulators in neurodegeneration [48].
Biomarker Identification and Validation for Clinical Translation
Integrated Biomarker Panels for Diagnostic and Prognostic Applications
Multi-omics strategies have yielded promising biomarker panels at the single-molecule, multi-molecule, and cross-omics levels, supporting cancer diagnosis, prognosis, and therapeutic decision-making [51]. These approaches have demonstrated particular utility in complex clinical scenarios where single-omics biomarkers prove insufficient. For example, in organ transplantation, Lim et al. conducted a prospective, randomized, controlled, multicenter pilot study to assess the utility of an integrated risk score based on omics-derived biomarkers for predicting acute rejection (AR) in high-immunologic-risk kidney transplant recipients (KTRs) [48]. The study monitored five key biomarkers: blood mRNA (three-gene signature), urinary exosomal miRNA (three-gene signature), urinary mRNA (six-gene signature), and two urinary exosomal proteins (hemopexin and tetraspanin-1) [48]. Although graft function and AR incidence did not significantly differ between groups, the biomarker-guided group underwent significantly fewer graft biopsies (12.5% vs. 47.4%, p = 0.027) and maintained lower tacrolimus levels without compromising safety (p = 0.006) [48].
Multi-Omics Biomarkers for Early Detection and Monitoring
Integrated omics approaches have shown remarkable progress in developing biomarkers for early cancer detection. For difficult early-detection tasks, recent integrated classifiers report AUCs of approximately 0.81–0.87, demonstrating significantly improved accuracy compared to single-omics approaches [50]. Longitudinal liquid biopsies tracking clonal evolution through circulating tumor DNA (ctDNA) and metabolite fluctuations offer real-time windows into adaptive resistance mechanisms, enabling dynamic monitoring of treatment response [50].
The integration of molecular data with imaging modalities represents another critical frontier in biomarker development. For example, researchers have integrated hypoxia-inducible factor (HIF) signatures in glioblastoma with genomics, transcriptomics, and proteomics, finding that the integrated multi-omics model significantly enhanced prognostic accuracy compared to single-omics approaches [49]. Similarly, Li et al. developed a radiomics model for predicting chemoradiotherapy response in advanced non-small cell lung cancer by integrating radiomic features from both the primary lesion and nodal disease with clinical data [49]. This multimodal composite model demonstrated superior predictive performance, emphasizing the value of comprehensive data integration in clinical decision-making [49].
The Scientist's Toolkit: Essential Research Reagents and Platforms
Table 3: Essential Research Reagent Solutions for Multi-Omics Studies
| Category | Specific Tools/Reagents | Function/Application | Key Features |
|---|---|---|---|
| Sequencing Reagents | Illumina NovaSeq kits, PacBio SMRT cells | Whole genome/transcriptome sequencing | High-throughput, long-read capabilities |
| Mass Spectrometry Reagents | TMT/Label-free proteomics kits, Metabolomics standards | Protein/metabolite identification and quantification | High resolution, multiplexing capability |
| Single-Cell Platforms | 10X Genomics Chromium, BD Rhapsody | Single-cell multi-omics profiling | High cellular throughput, multi-modal data |
| Spatial Omics Reagents | Visium Spatial Gene Expression, CODEX reagents | Spatially resolved molecular profiling | Tissue context preservation, multiplexing |
| Bioinformatics Tools | xMWAS, WGCNA, GETgene AI | Data integration and analysis | Multi-omics integration, network analysis |
| Biobanking Supplies | PAXgene tubes, Cryostorage systems | Sample preservation and storage | Biomolecular stability, long-term integrity |
Personalized Treatment Strategies Through Integrative Omics
Predicting Therapeutic Response and Resistance
Multi-omics integration has become indispensable for predicting drug responses and optimizing individualized treatment strategies in precision oncology [51]. A notable example comes from Miao et al., who introduced an innovative drug response prediction model (NMDP) to address challenges in feature extraction and data fusion [49]. Their model utilizes an interpretable semi-supervised weighted SPCA module and integrates convolution methods with Kolmogorov Arnold Networks, demonstrating superior performance in predicting drug sensitivity [49]. Similarly, integrated analyses have revealed mechanisms of resistance to targeted therapies. For instance, while KRAS G12C inhibitors achieve rapid responses in colorectal cancer, resistance universally emerges via parallel RTK-MAPK reactivation or epigenetic remodeling—mechanisms detectable only through integrated proteogenomic and phosphoproteomic profiling [50].
Patient Stratification and "N-of-1" Models
The integration of multi-omics data enables more refined patient stratification beyond conventional histopathological classifications. In breast cancer, ESR1 mutations direct endocrine therapy selection; in NSCLC, EGFR/ALK alterations predict tyrosine kinase inhibitor efficacy; and in DLBCL, cell-of-origin transcriptomic subtyping (GCB vs. ABC) informs chemotherapy response [50]. Immunotherapy has further intensified the need for multi-parameter biomarkers, where PD-L1 immunohistochemistry (IHC), tumor mutational burden (genomics), and T-cell receptor clonality (immunomics) collectively, but imperfectly, predict immune checkpoint blockade efficacy [50].
Emerging trends include federated learning for privacy-preserving collaboration and patient-centric "N-of-1" models, signaling a paradigm shift toward dynamic, personalized cancer management [50]. These approaches leverage multi-omics profiling to create individualized treatment models, moving beyond population-based approaches to truly personalized care.
Cross-Disease Mechanistic Insights for Therapeutic Discovery
Integrative omics approaches have revealed unexpected molecular connections between distinct disease states, opening new avenues for therapeutic discovery. For example, Loganathan and Doss investigated the interconnected molecular mechanisms between breast cancer and diabetes using transcriptomic and exomic analyses across different cohorts [49]. They identified shared pathways related to extracellular matrix organization and immune regulation, highlighting the TNF pathway as a central link connecting chronic inflammation, insulin resistance, and tumor growth [49].
Similarly, research on the gut microbiota-lung axis in lung cancer has synthesized data indicating that gut dysbiosis is associated with worse prognosis and impacts the efficacy of immune checkpoint blockade, suggesting potential adjunctive therapeutic strategies through microbiome modulation [49]. These cross-disease insights demonstrate how integrative omics can reveal previously unrecognized therapeutic opportunities by uncovering shared pathogenic mechanisms across seemingly unrelated conditions.
Integrative omics approaches have fundamentally transformed translational medicine by enabling a comprehensive, systems-level understanding of disease mechanisms. The studies compiled in recent research collections collectively demonstrate the profound impact of multi-omics analysis on translational medicine [49]. By embracing integrative approaches, novel computational methods, and the inclusion of diverse data types such as microbiome profiles and imaging features, these investigations are significantly advancing the field [49]. The insights generated not only enhance our understanding of complex diseases but also pave the way for more precise diagnostics and personalized therapeutic strategies, bringing us closer to the realization of personalized healthcare [49].
Despite rapid progress, significant challenges remain in the widespread clinical implementation of multi-omics approaches. Major hurdles include data heterogeneity, reproducibility issues, and the clinical validation of biomarkers across diverse patient populations [51]. Additionally, operationalizing these tools requires confronting algorithm transparency, batch effect robustness, and ethical equity in data representation [50]. Future advances will likely come from several cutting-edge directions: single-cell multi-omics and spatial multi-omics technologies are expanding the scope of biomarker discovery and deepening our understanding of tumor heterogeneity [51]. Explainable AI (XAI) techniques like SHapley Additive exPlanations (SHAP) are helping interpret "black box" models, clarifying how genomic variants contribute to clinical outcomes such as chemotherapy toxicity risk scores [50]. Federated learning approaches enable privacy-preserving multi-institutional collaboration while addressing data harmonization challenges [50].
As translational research continues to evolve, it will be essential to strengthen interdisciplinary collaboration and ensure that scientific innovations are not only biologically sound but also clinically meaningful and accessible [48]. The integration of multi-omics data represents more than a technological advancement—it constitutes a fundamental shift in how we approach disease understanding and treatment, moving from reactive, population-based approaches to proactive, individualized care powered by deep molecular insights.
Navigating the Data Deluge: Solving Multi-Omics Integration Challenges
Integrative omics approaches, which combine data from genomics, transcriptomics, proteomics, and metabolomics, have revolutionized our ability to understand complex disease mechanisms. However, the power of these multi-faceted analyses is often compromised by a fundamental challenge: technical variations introduced during sample processing, sequencing, and data generation. These unwanted variations, known as batch effects, are systematically introduced when experiments are conducted across different times, laboratories, platforms, or reagent batches, and they are notoriously common in high-throughput data [52]. Left uncorrected, batch effects can obscure true biological signals, reduce statistical power, and potentially lead to misleading conclusions that undermine the reproducibility of scientific findings [52] [53]. In the context of disease mechanism research, where the goal is to identify genuine molecular signatures driving pathology, conquering data heterogeneity through robust normalization, harmonization, and batch effect correction is not merely a preprocessing step but a critical foundation for biologically meaningful discovery.
Understanding Batch Effects and Their Impact on Disease Research
Batch effects arise from multiple sources throughout the experimental workflow. During study design, flawed or confounded designs where samples are not randomized properly can introduce systematic biases. Sample preparation and storage variables, including protocol procedures, reagent lots, and storage conditions, further contribute to technical variations [52]. In multi-center studies aiming to understand disease pathogenesis, these effects are magnified when technical variables become confounded with biological factors of interest.
The impact of batch effects on disease research can be profound. They can lead to increased variability, decreased power to detect real biological signals, and interference with downstream statistical analysis [52]. In one documented case, a change in RNA-extraction solution resulted in a shift in gene-based risk calculations, leading to incorrect classification outcomes for 162 patients, 28 of whom received incorrect or unnecessary chemotherapy regimens [52]. Such examples underscore the critical importance of proper batch effect management for translational research and precision medicine.
The Order-Preserving Challenge in Batch Effect Correction
A particularly nuanced challenge in batch effect correction is the preservation of meaningful biological relationships within the data. The order-preserving feature refers to maintaining the relative rankings or relationships of gene expression levels within each batch after correction [54]. This property ensures that intrinsic patterns of gene expression are not disrupted during the correction process, which is crucial for downstream analyses like differential expression or pathway enrichment studies. While non-procedural methods like ComBat possess this feature, they often struggle with the high sparsity and dropout events characteristic of single-cell RNA-seq data [54]. Procedural methods, including those based on deep learning, have historically overlooked this aspect, potentially resulting in the loss of valuable intra-batch information and misinterpretation of differential expression patterns central to understanding disease mechanisms [54].
Normalization: The First Line of Defense Against Technical Variation
Core Normalization Methods for Omics Data
Normalization addresses cell-specific technical biases such as differences in sequencing depth and RNA capture efficiency, ensuring that expression differences reflect true biological variation rather than technical artifacts [55]. The choice of normalization strategy is highly data-dependent, and no single approach is optimal for all datasets [56].
Table 1: Common Normalization Methods in Omics Data Analysis
| Method | Mechanism | Strengths | Limitations | Common Implementations |
|---|---|---|---|---|
| Log Normalization | Divides counts by total library size, multiplies by a scale factor (e.g., 10,000), and log-transforms. | Simple, easy to implement, effective for datasets with similar RNA content. | Assumes constant RNA content; does not address dropout events. | Default in Seurat (NormalizeData) and Scanpy (pp.normalize_total followed by pp.log1p) [55]. |
| Scran's Pooling-Based Normalization | Uses deconvolution to estimate size factors by pooling cells. | Effective for heterogeneous datasets with diverse cell types; provides variance stabilization. | Computationally intensive for very large datasets. | Scran R package; integrated in Nygen Analytics [55]. |
| SCTransform | Models gene expression using regularized negative binomial regression. | Excellent variance stabilization; simultaneously accounts for technical covariates. | Computationally demanding; relies on negative binomial distribution assumptions. | Seurat's SCTransform function [55]. |
| Centered Log Ratio (CLR) | Log-transforms the ratio of each feature to the geometric mean across all features in a cell. | Designed for compositional data; useful for CITE-seq antibody-derived tags (ADTs). | Requires pseudocount addition for zero counts; rarely used for RNA counts. | Seurat's NormalizeData with normalization.method = "CLR" [55]. |
| Quantile Normalization | Aligns distribution of expression values across cells by sorting and averaging ranks. | Forces identical expression distributions across cells. | Can distort true biological differences; primarily used for microarray data. | Functions in Limma or edgeR packages [55]. |
Evaluating Normalization Performance
Selecting the optimal normalization strategy requires empirical evaluation. A straightforward workflow involves two key performance metrics [56]:
- Visual Assessment with PCA: Principal Components Analysis (PCA) plots of raw and normalized data provide an intuitive visual check. Effective normalization should enhance the separation of biological groups while reducing the clustering of samples by technical batches.
- Quantitative Assessment with Supervised Classification: The performance of supervised classification models (e.g., based on support vector machines or random forests), measured by metrics like area under the receiver operating curve (AUC), should improve after normalization. This indicates enhanced ability to distinguish biological categories.
This iterative workflow allows researchers to test both established and novel normalization strategies, ensuring the chosen method is optimal for their specific dataset and research question [56].
Advanced Batch Effect Correction Strategies for Integrative Omics
Algorithmic Approaches and Their Applications
After normalization, dedicated batch-effect correction algorithms (BECAs) are employed to integrate data across multiple batches. These methods vary in their underlying assumptions and computational strategies.
Table 2: Comparison of Batch Effect Correction Algorithms
| Tool / Method | Category | Key Principle | Best-Suited Scenarios |
|---|---|---|---|
| Harmony | Procedural | Iteratively clusters and corrects data in a low-dimensional (PCA) embedding to align batches. | Large-scale datasets; balanced batch-group scenarios [55] [53]. |
| Seurat Integration | Procedural | Uses Canonical Correlation Analysis (CCA) and Mutual Nearest Neighbors (MNN) to anchor datasets across batches. | Datasets where preserving fine biological heterogeneity is critical [55]. |
| ComBat | Non-Procedural | Uses empirical Bayes framework to adjust for additive and multiplicative batch biases. | Balanced designs; when order-preserving feature is required [54] [53]. |
| Ratio-Based (Ratio-G) | Reference-Based | Scales absolute feature values of study samples relative to those of concurrently profiled reference materials. | Confounded scenarios where batch and biology are inseparable; multi-omics studies [53]. |
| scANVI | Deep Learning | Uses a deep generative model (variational autoencoder) to account for batch effects and cell labels. | Complex, non-linear batch effects; when some cell annotations are available [55]. |
| Order-Preserving Monotonic Network | Procedural | Employs a monotonic deep learning network with weighted MMD loss to ensure intra-genic order is maintained. | When preserving original differential expression patterns and inter-gene correlations is paramount [54]. |
The Power of Ratio-Based Scaling and Reference Materials
In large-scale multiomics studies, particularly those involving longitudinal or multi-center designs, biological factors and batch factors are often completely confounded (e.g., all cases processed in one batch and all controls in another). In such scenarios, conventional BECAs like ComBat or Harmony may fail or even remove biological signals of interest [53].
The ratio-based method (Ratio-G) has been identified as a particularly effective strategy for these challenging confounded scenarios. This approach requires the concurrent profiling of one or more reference materials—such as the Quartet reference materials derived from B-lymphoblastoid cell lines—alongside the study samples in each batch [53]. The expression profile of each study sample is then transformed to a ratio-based value using the data from the reference sample as the denominator. This simple scaling operation effectively calibrates measurements across different batches, laying the foundation for eliminating batch effects at a ratio scale and enabling reliable integration of data from disparate sources [53].
Experimental Protocols for Batch Effect Assessment and Correction
A Workflow for Evaluating Batch Effect Correction
Implementing a robust evaluation protocol is essential for validating the success of any batch effect correction method. The following workflow, adaptable from best practices in the field, provides a structured approach:
- Quality Control and Preprocessing: Begin with standard QC filters (e.g., filtering cells by gene counts and mitochondrial read percentage for scRNA-seq) and apply a suitable normalization method (see Table 1).
- Batch Effect Diagnosis: Visualize the pre-correction data using PCA or UMAP, coloring points by batch and known biological labels (e.g., cell type). Strong clustering by batch indicates significant batch effects.
- Algorithm Application: Apply one or more BECAs from Table 2. For ratio-based methods, ensure reference materials are included in the experimental design from the start.
- Post-Correction Evaluation:
- Visual Inspection: Regenerate PCA/UMAP plots with the corrected data. Successful correction should show improved mixing of batches while maintaining separation of distinct biological groups.
- Quantitative Metrics:
- LISI (Local Inverse Simpson's Index): Measures the diversity of batches (batch LISI) or cell types (cell type LISI) in local neighborhoods. A higher batch LISI indicates better mixing, while a maintained or higher cell type LISI confirms biological signal preservation [55].
- kBET (k-nearest neighbor Batch Effect Test): A statistical test that assesses whether the local proportion of batches around each cell matches the global expectation [55].
- ASW (Average Silhouette Width): Evaluates cluster compactness and separation, which can be calculated for batch (lower is better) and cell type (higher is better) [54].
- Biological Validation: The most critical test is whether corrected data yields biologically meaningful and reproducible results. This includes verifying that known differentially expressed genes are still detected and that inter-gene correlation structures within cell types are preserved [54].
Figure 1: Batch effect correction evaluation workflow.
Protocol for an Order-Preserving Correction Study
To implement and evaluate an order-preserving batch correction method, as described in [54], follow this detailed protocol:
Data Preprocessing and Initialization:
- Input: Obtain raw count matrices from multiple scRNA-seq batches.
- Filtering: Filter genes and cells based on quality thresholds (e.g., remove genes expressed in fewer than 10 cells).
- Initial Clustering: Perform initial cell clustering using a standard algorithm (e.g., Louvain) on the preprocessed data.
Similarity Construction and Loss Calculation:
- Neighbor Identification: For each cluster, identify nearest neighbors (NN) both within and between batches.
- Cluster Similarity: Use the NN information to compute similarity scores between clusters, facilitating intra-batch merging and inter-batch matching of similar cell populations.
- Weighted MMD Loss: Calculate the distribution distance between a reference batch and query batches using a weighted Maximum Mean Discrepancy (MMD) loss. The weighting addresses potential class imbalances between batches.
Model Training for Correction:
- Network Architecture: Employ a monotonic deep learning network. This architecture is key to ensuring the order-preserving property.
- Training: Train the network to minimize the weighted MMD loss. This step aligns the distributions of batches in a way that preserves the relative order of gene expression levels.
- Output: The trained model outputs a corrected gene expression matrix.
Validation of Order-Preserving Feature and Efficacy:
- Spearman Correlation: For each cell type, calculate the Spearman correlation coefficient of non-zero gene expression values before versus after correction. High correlations indicate successful order preservation.
- Inter-Gene Correlation: Assess the preservation of inter-gene correlation structures by identifying significantly correlated gene pairs within cell types before correction and calculating the root mean square error (RMSE) of these correlations after correction.
- Standard Batch Effect Metrics: As in the general workflow, compute LISI and ASW to confirm batch mixing and biological separation.
Successful mitigation of batch effects relies not only on computational tools but also on well-designed experimental reagents and materials.
Table 3: Key Research Reagent Solutions for Batch Effect Management
| Resource | Function | Application Context |
|---|---|---|
| Quartet Reference Materials | Commercially available multiomics reference materials derived from four related cell lines. Provides a stable benchmark for ratio-based batch correction across DNA, RNA, protein, and metabolite levels [53]. | Large-scale multi-center studies; longitudinal omics profiling; method benchmarking. |
| Standardized Protocol Kits | Reagent kits for library preparation, sequencing, and sample processing with lot-controlled consistency. Minimizes introduction of batch effects at the wet-lab stage. | Any multi-batch omics experiment, especially in single-cell sequencing. |
| Cell Line Controls | Well-characterized cell lines (e.g., HEK293, K562) processed concurrently with study samples. Acts as an internal control for technical variation across batches. | Bulk and single-cell transcriptomics/proteomics experiments. |
| Synthetic Spike-in RNAs | Exogenous RNA sequences added to samples in known quantities before library prep. Allows for precise normalization and detection of technical biases. | RNA-seq experiments, particularly for absolute transcript quantification. |
| Pooled Sample Aliquots | An aliquot of a pooled sample from all experimental groups included in every processing batch. Serves as a process control to monitor and correct for inter-batch variation. | Cost-effective alternative to commercial reference materials; cohort studies. |
Figure 2: Strategies for batch effect management.
In the pursuit of understanding complex disease mechanisms through integrative omics, conquering data heterogeneity is not an optional step but a fundamental requirement for scientific rigor and biological insight. A multi-layered strategy—combining prudent experimental design with standardized reagents, careful normalization, and validated batch effect correction—is essential. The emerging best practice involves leveraging reference materials for ratio-based scaling, especially in confounded study designs, while employing evaluation metrics that balance technical mixing with the preservation of biological truth. As omics technologies continue to evolve toward greater scale and resolution, the principles of robust data harmonization will remain the bedrock upon which reproducible, translational disease research is built.
Addressing High Dimensionality and the 'Curse of Dimensionality'
In the field of integrative omics research, high dimensionality refers to datasets where the number of variables (p) vastly exceeds the number of biological samples or observations (n). This scenario creates the statistical phenomenon known as the "curse of dimensionality," where data become sparse in high-dimensional space, making pattern detection notoriously difficult and increasing the risk of identifying spurious correlations [57] [58]. In multi-omics studies, this challenge intensifies as researchers combine wildly diverse datasets—genomics, transcriptomics, proteomics, metabolomics, and clinical records—each with thousands to millions of features per sample [59] [11]. The curse of dimensionality manifests practically when analyzing high-throughput molecular data, where the number of measured features (e.g., genes, proteins, metabolites) dramatically outweighs the number of patient samples, creating fundamental statistical challenges for disease mechanism research [57].
The Nature of the Problem in Multi-Omics Research
Fundamental Statistical Challenges
The curse of dimensionality presents several interconnected problems for integrative omics studies. As dimensionality increases, data points become sparse through the vast feature space, making local neighborhood methods unreliable for density estimation or clustering [58]. Distance metrics also lose meaning in high-dimensional space, as the relative contrast between nearest and farthest neighbors diminishes, complicating similarity assessments crucial for patient stratification and disease subtyping [60]. Furthermore, the exponential growth of possible feature interactions creates a combinatorial explosion that dramatically increases the risk of false discoveries unless proper statistical corrections are applied [57].
Multi-Omics Specific Complications
Integrating multiple omics layers compounds these challenges through data heterogeneity. Each omics type has distinct technical characteristics, measurement scales, noise profiles, and batch effects that must be harmonized before meaningful integration can occur [59]. Missing data presents another significant hurdle, as patients rarely have complete multi-omics profiles, requiring sophisticated imputation methods such as k-nearest neighbors (k-NN) or matrix factorization to estimate missing values without introducing bias [59]. The computational burden of processing petabyte-scale multi-omics datasets demands specialized infrastructure, including cloud computing and distributed processing frameworks, to make analysis computationally feasible [59].
Computational and Statistical Solutions
Dimensionality Reduction Techniques
Dimensionality reduction methods project high-dimensional data into lower-dimensional spaces while preserving essential biological signals, making them fundamental for addressing the curse of dimensionality in omics research [61].
Table 1: Key Dimensionality Reduction Methods for Multi-Omics Data
| Method Category | Representative Algorithms | Key Characteristics | Applications in Omics |
|---|---|---|---|
| Linear Projection | PCA, JIVE, MCIA | Identifies linear combinations that explain maximum variance | Exploratory data analysis, batch effect detection [61] |
| Non-Negative Factorization | NMF, intNMF | Constrains components to non-negative values | Biological process decomposition, sample clustering [60] |
| Manifold Learning | t-SNE, UMAP | Preserves local neighborhood structure | Single-cell data visualization, cell type identification [58] |
| Multi-Table Integration | RGCCA, MCIA, MOFA | Maximizes correlation or covariance between omics tables | Integrative analysis of multiple omics datasets [61] [60] |
Integration Strategies for Multi-Omics Data
The timing of integration significantly influences analytical outcomes in multi-omics studies, with each approach offering distinct advantages and limitations [59] [62].
Table 2: Multi-Omics Integration Strategies
| Integration Type | Timing | Method Examples | Advantages | Limitations |
|---|---|---|---|---|
| Early Integration | Before analysis | Feature concatenation | Captures all cross-omics interactions | High dimensionality, computationally intensive [59] |
| Intermediate Integration | During analysis | MCIA, intNMF, MOFA | Reduces complexity, incorporates biological context | May lose some raw information [59] [60] |
| Late Integration | After individual analysis | Ensemble methods, similarity network fusion | Handles missing data well, computationally efficient | May miss subtle cross-omics interactions [59] [62] |
Machine Learning and AI Approaches
Advanced machine learning methods automatically handle high-dimensional omics data through sophisticated pattern recognition capabilities that traditional statistical methods lack [59] [62].
Autoencoders (AEs) and Variational Autoencoders (VAEs) are unsupervised neural networks that compress high-dimensional omics data into dense, lower-dimensional "latent spaces," making integration computationally feasible while preserving key biological patterns [59].
Graph Convolutional Networks (GCNs) operate on network-structured biological data, representing genes and proteins as nodes and their interactions as edges. GCNs learn from this structure by aggregating information from a node's neighbors, proving effective for clinical outcome prediction [59].
Similarity Network Fusion (SNF) creates patient-similarity networks from each omics layer and iteratively fuses them into a single comprehensive network. This approach strengthens robust similarities while removing weak ones, enabling more accurate disease subtyping [59].
Multi-Omics Factor Analysis (MOFA) is a Bayesian framework that decomposes multiple omics datasets into a set of latent factors that capture the shared and specific sources of variation across different data modalities, effectively handling missing data [60].
Experimental Protocols for Addressing High Dimensionality
Protocol: Benchmarking Joint Dimensionality Reduction Methods
Objective: Systematically evaluate joint dimensionality reduction (jDR) methods for multi-omics cancer data [60].
Input Data Requirements:
- Multiple omics matrices (Xi) of dimension ni × m, where ni is the number of features and m is the number of samples
- Matrices should cover the same samples across omics types
- Pre-processed and normalized data with batch effects corrected
Methodology:
- Data Preprocessing: Normalize each omics dataset using platform-specific methods (e.g., TPM for RNA-seq, intensity normalization for proteomics)
- Method Application: Apply multiple jDR approaches (intNMF, MCIA, MOFA, etc.) to the same preprocessed data
- Performance Assessment:
- Evaluate clustering performance using ground-truth labels when available
- Assess survival prediction accuracy through Cox proportional hazards models
- Test enrichment for known biological pathways using preranked GSEA
- Visualization: Project factors into 2D space for sample stratification assessment
Expected Outcomes: Identification of the optimal jDR method for the specific biological question and data type, with intNMF generally performing well for clustering tasks and MCIA offering robust performance across multiple contexts [60].
Protocol: Automated Projection Pursuit (APP) Clustering
Objective: Implement a projection pursuit approach to overcome the curse of dimensionality in high-dimensional biological data [58].
Rationale: Traditional clustering algorithms operating directly in high-dimensional space suffer from data sparsity. APP instead recursively searches for low-dimensional projections with minimal density between clusters.
Workflow:
- Initialization: Start with the complete dataset as a single cluster
- Projection Search: Explore low-dimensional projections to find those that best separate data into distinct clusters
- Cluster Splitting: Partition data based on identified projections
- Recursive Application: Repeat steps 2-3 on each resulting cluster until no further splits are statistically justified
- Validation: Compare results to experimentally validated cell-type definitions when available
Applications: Effective for flow/mass cytometry, scRNA-seq, multiplex imaging, and TCR repertoire data [58].
Table 3: Essential Resources for High-Dimensional Omics Research
| Resource Category | Specific Tools/Methods | Function | Application Context |
|---|---|---|---|
| Statistical Packages | bootGSEA, xMWAS, WGCNA | Robust gene set enrichment, correlation network analysis | Pathway analysis, network construction [63] [19] |
| Dimension Reduction | prcomp {stats}, dudi.pca {ade4}, nmf {nmf} | Principal component analysis, non-negative matrix factorization | Exploratory data analysis, feature reduction [61] |
| Multi-Omics Integration | MOFA+, MCIA, intNMF, RGCCA | Joint analysis of multiple omics datasets | Disease subtyping, biomarker discovery [60] |
| Clustering Algorithms | Phenograph, FlowSOM, APP | Cell population identification, pattern discovery | Single-cell analysis, cytometry data [58] |
| Visualization Tools | t-SNE, UMAP, ggplot2 {R} | Dimensionality reduction visualization | Data exploration, result presentation [58] |
Effectively addressing the curse of dimensionality is not merely a technical prerequisite but a fundamental aspect of deriving biological insights from integrative omics studies. The solutions outlined—from sophisticated dimensionality reduction techniques to AI-powered integration strategies—provide researchers with a robust toolkit for extracting meaningful patterns from high-dimensional data. As multi-omics technologies continue to evolve, producing ever-larger and more complex datasets, the development and application of these methods will remain crucial for advancing our understanding of disease mechanisms and moving toward personalized medicine approaches. The key to success lies in selecting appropriate integration strategies based on specific research questions and available data types, while maintaining rigorous statistical standards to ensure biological discoveries are robust and reproducible.
Handling Missing Data and Technical Noise in Multi-Modal Datasets
In the field of integrative omics research, which aims to understand complex disease mechanisms through the combined analysis of multiple biological data layers, two formidable analytical barriers consistently emerge: missing data and technical noise. The promise of multi-modal datasets—to provide a comprehensive view of biological systems from genomics and transcriptomics to proteomics and metabolomics—is tempered by these pervasive data quality challenges [59]. Biological systems function through complex interactions between various 'omics, and a more complete understanding of these systems is only possible through an integrated, multi-omic perspective [64].
Missing data represents a fundamental challenge in multi-omics integration because all biomolecules are not measured in all samples [64]. In mass spectrometry-based proteomics, for instance, it is not uncommon to have 20–50% of possible peptide values not quantified [64]. Technical noise, originating from batch effects, platform-specific artifacts, and measurement variability, further complicates analysis by obscuring true biological signals [50] [59]. These data quality issues are particularly problematic in disease mechanism research, where subtle molecular signatures may hold the key to understanding pathogenesis, therapeutic targeting, and personalized treatment strategies [65] [50].
This technical guide addresses these critical challenges by presenting current methodologies, experimental protocols, and analytical frameworks for handling missing data and technical noise in multi-modal omics datasets, with specific application to disease mechanism research.
Understanding Data Challenges in Multi-Modal Omics
Classification and Impact of Missing Data
In multi-omics studies, missing data can arise from various sources including poor tissue quality, insufficient sample volume, measurement system limitations, budget restrictions, or subject dropout [64]. The mechanism behind missing data determines the appropriate handling strategy, and these mechanisms are traditionally classified into three categories:
Table 1: Classification of Missing Data Mechanisms in Multi-Omics Studies
| Mechanism | Definition | Example in Omics | Analytical Approach |
|---|---|---|---|
| Missing Completely at Random (MCAR) | Missingness does not depend on observed or unobserved variables | Sample processing errors; insufficient sequencing depth | Complete-case analysis may introduce minimal bias; imputation feasible |
| Missing at Random (MAR) | Missingness depends on observed variables but not unobserved measurements | Protein missing in mass spectrometry due to low overall protein concentration | Methods incorporating observed predictors; sophisticated imputation |
| Missing Not at Random (MNAR) | Missingness depends on the unobserved value itself | Low-abundance proteins fall below detection limits in mass spectrometry | Specific MNAR methods; pattern-based modeling; caution with standard imputation |
The prevalence and impact of missing data varies significantly across omics layers. In proteomics, an estimated ~20% of genes yield protein products that are not detected by mass spectrometry due to technical limitations [64]. In metabolomics, limited coverage of the known metabolome increases the risk of overlooking crucial metabolomic responses [64]. When integrating multiple omics layers, these challenges compound, as the set of observations with missing data and the proportion of missingness can vary among the different omics datasets [64].
Technical noise in multi-omics datasets arises from multiple sources throughout the experimental workflow. Understanding these sources is essential for developing effective noise reduction strategies:
Table 2: Common Sources of Technical Noise in Multi-Omics Data Generation
| Noise Category | Specific Sources | Impact on Data Quality | Common Correction Methods |
|---|---|---|---|
| Batch Effects | Different technicians, reagent lots, sequencing machines, processing times | Systematic variation obscuring biological signals; spurious correlations | ComBat, limma, SVA, ARSyN |
| Platform-Specific Artifacts | Variation in sensitivity, specificity, dynamic range across platforms | Inconsistent detection of low-abundance molecules; quantification errors | Cross-platform normalization; platform-aware algorithms |
| Sample Processing Variability | Tissue collection delays, extraction efficiency, storage conditions | Degradation profiles; introduction of non-biological variance | Quality metrics; sample randomization; standardized protocols |
| Measurement Noise | Instrument precision limits, stochastic sampling in sequencing | Reduced reproducibility; increased technical variance | Replication; error models; quality filters |
Batch effects are particularly insidious in multi-omics studies, where variations from different technicians, reagents, sequencing machines, or even the time of day a sample was processed can create systematic noise that obscures real biological variation [59]. The emerging field of radiomics, which extracts thousands of quantitative features from medical images, faces similar challenges with platform-specific artifacts and reproducibility issues [50].
Methodological Approaches for Data Quality Management
Handling Missing Data: From Traditional Imputation to AI-Driven Approaches
Traditional approaches to handling missing data in multi-omics studies have included complete-case analysis (removing samples with any missing values) and various imputation techniques. However, complete-case analysis dramatically reduces sample size and statistical power, while imputation methods perform well only when a few values are missing and rely on the presence of partial data and observable patterns within each data type [66] [64].
Advanced computational methods have emerged to address these limitations:
1. Deep Learning Models for Incomplete Multi-Omic Data: TransFuse is an interpretable deep trans-omic fusion neural network that enables the inclusion of subjects with incomplete -omics data during model training, without requiring reconstruction of large missing data chunks [66]. The methodology employs a modular network architecture consisting of separate modules for each omics type (SNPs, gene expression, proteins) that can be pre-trained independently using subjects with missing omics types [66]. This approach demonstrated superior performance in Alzheimer's disease classification, achieving significantly higher accuracy and specificity compared to competing methods while identifying biologically meaningful disease subnetworks [66].
2. Multi-Omic Network Integration with Prior Knowledge: Methods like MoFNet integrate multi-omics data with prior knowledge of functional interactions among proteins, genes, and their upstream regulatory SNPs [66]. This approach uses graph neural networks to model the flow of information from DNA to gene and protein, incorporating biological network information from databases such as Reactome and SNP2TFBS [66]. When applied to Alzheimer's disease cohorts, this method identified a cohesive sub-network including APOE, the top genetic risk factor for Alzheimer's, directly connected to the early growth response protein 1 (EGR1) gene, revealing inverse relationships previously observed in APOE-deficient mice [66].
3. Transfer Learning for Missing Modalities: Recent approaches leverage transfer learning to address the challenge of entirely missing omics types for some samples. By pre-training on samples with complete data, models can learn cross-modal relationships that enable more robust analysis of incomplete datasets [66]. This is particularly valuable in clinical settings where comprehensive multi-omics profiling may be limited by cost or sample availability.
Technical Noise Reduction: Experimental and Computational Strategies
Reducing technical noise requires both careful experimental design and sophisticated computational correction:
Experimental Design Considerations:
- Randomization: Process samples from different experimental groups together to distribute batch effects randomly across groups
- Replication: Include technical replicates to quantify technical variance
- Reference Materials: Use standardized reference materials across batches and platforms
- Quality Control Metrics: Implement rigorous QC protocols with clear thresholds for data inclusion
Computational Correction Methods:
- Batch Effect Correction: Algorithms like ComBat use empirical Bayes frameworks to adjust for batch effects while preserving biological signals [59]
- Normalization Strategies: Platform-specific normalization (e.g., TPM for RNA-seq, FPKM for alternative protocols) enables cross-sample comparison [59]
- Quality-Based Filtering: Remove features with excessive missingness or low reproducibility across replicates
- Surrogate Variable Analysis (SVA): Identify and adjust for unknown sources of technical variation
The following workflow diagram illustrates a comprehensive approach to handling missing data and technical noise in multi-omics studies:
Diagram 1: Comprehensive workflow for handling missing data and technical noise in multi-omics studies
Experimental Protocols and Implementation Frameworks
Protocol for Evaluating Missing Data Mechanisms
Before selecting appropriate methods for handling missing data, researchers must first evaluate the mechanisms behind missingness in their datasets:
Step 1: Quantify Missing Data Patterns
- Calculate missingness percentages for each omics layer and each sample
- Visualize missing data patterns using heatmaps or specialized packages (e.g., VIM, naniar in R)
- Identify whether missingness is randomly distributed or shows systematic patterns
Step 2: Assess Mechanisms of Missingness
- For potential MAR: Test associations between missingness patterns and observed variables (e.g., sample quality metrics, concentration measures)
- For potential MNAR: Evaluate whether missingness correlates with detection limits or abundance levels
- Use statistical tests such as Little's MCAR test when appropriate
Step 3: Select and Implement Handling Strategies
- For MCAR/MAR: Implement appropriate imputation methods (e.g., k-NN, matrix factorization, missForest)
- For MNAR: Use methods specifically designed for non-random missingness (e.g., left-censored imputation, pattern-based models)
- Consider specialized machine learning architectures that accommodate missing data without imputation
Protocol for Batch Effect Detection and Correction
Batch Effect Detection:
- Principal Component Analysis (PCA): Visualize samples colored by batch to identify batch-driven clustering
- Surrogate Variable Analysis (SVA): Identify unknown sources of variation that may represent batch effects
- Distance-Based Methods: Calculate between-batch versus within-batch distances using metrics like PCA-based or PLS-based distances
- Statistical Testing: Use ANOVA-based approaches to quantify variance explained by batch versus biological factors
Batch Effect Correction:
- ComBat and Related Methods: Implement empirical Bayes frameworks that adjust for batch effects while preserving biological signals
- Remove Unwanted Variation (RUV): Use control genes/samples to estimate and remove technical noise
- Harmonization Algorithms: Apply cross-platform normalization methods when integrating data from different technologies
- Validation: Always verify that correction methods preserve biological signals while reducing technical variance
Advanced AI-Driven Integration Strategies
Artificial intelligence approaches have revolutionized how researchers handle missing data and technical noise in multi-omics integration. These methods can be categorized by their integration strategy:
Table 3: AI-Driven Integration Strategies for Multi-Omics Data with Missing Values
| Integration Strategy | Technical Approach | Handling of Missing Data | Best-Suited Applications |
|---|---|---|---|
| Early Integration | Concatenates raw or pre-processed features before analysis | Requires complete cases or comprehensive imputation | Capturing complex cross-omics interactions; large sample sizes |
| Intermediate Integration | Transforms each omics type then combines representations | Modular architectures allow partial data usage; transfer learning | Network-based analysis; functional interpretation |
| Late Integration | Builds separate models then combines predictions | Naturally handles missing modalities through ensemble methods | Clinical prediction; heterogeneous sample collections |
| Hybrid Fusion | Combines elements of early and late integration | Flexible handling through model architecture | Complex multi-modal learning; translational applications |
Implementation of Advanced Neural Architectures
Graph Neural Networks (GNNs) for Multi-Omic Integration: GNNs model biological networks where nodes represent biomolecules and edges represent known interactions [50]. This approach naturally handles some missing data by leveraging the network structure—even if some nodes have missing measurements, the network topology provides contextual information. In practice, GNNs have been used to model protein-protein interaction networks perturbed by somatic mutations, prioritizing druggable hubs in rare cancers [50].
Multi-Modal Transformers: Transformer architectures with cross-modal attention mechanisms can learn to weight the importance of different modalities and features dynamically [67]. These models can be adapted to handle missing modalities through masking strategies and have been applied to fuse MRI radiomics with transcriptomic data to predict glioma progression, revealing imaging correlates of hypoxia-related gene expression [50].
Autoencoders for Dimensionality Reduction and Integration: Variational autoencoders (VAEs) and their multi-modal extensions learn compressed representations of each omics type in a shared latent space [59]. These methods can handle missing data by training on available modalities and inferring representations for missing ones. They have demonstrated particular utility in clustering patients into molecular subtypes based on integrated multi-omics profiles [59].
The Scientist's Toolkit: Essential Research Reagents and Computational Solutions
Table 4: Essential Research Reagents and Computational Tools for Multi-Omics Data Quality Management
| Category | Specific Tools/Reagents | Function | Application Context |
|---|---|---|---|
| Quality Control Reagents | Standard Reference Materials (NIST), Process Controls, Internal Standards | Quantify technical variation; normalize across batches | All omics platforms; essential for cross-study integration |
| Bioinformatics Platforms | Galaxy, DNAnexus, Lifebit | Provide scalable infrastructure for data processing and integration | Managing petabyte-scale datasets; collaborative analysis |
| Batch Correction Algorithms | ComBat, limma, ARSyN, SVA | Remove technical noise while preserving biological signals | Studies with multiple batches or integrated datasets |
| Imputation Methods | k-NN, missForest, MICE, BPCA | Estimate missing values based on observed patterns | MCAR/MAR missingness; pre-processing for methods requiring complete data |
| Specialized ML Libraries | PyTorch, TensorFlow with custom architectures | Implement modular neural networks for incomplete data | Advanced AI-driven integration; handling MNAR missingness |
| Multi-Omics Integration Tools | MOGONET, TransFuse, MOFA+ | Specialized frameworks for integrative analysis | Disease subtyping; biomarker discovery; network analysis |
The integration of multi-modal omics data represents a powerful approach to unraveling complex disease mechanisms, but its potential is fully realized only when researchers adequately address the challenges of missing data and technical noise. Through sophisticated computational methods, including modular neural architectures that accommodate missing data without imputation and advanced batch correction techniques that preserve biological signals, the field is moving toward more robust and reproducible integrative analysis.
As multi-omics technologies continue to evolve and find applications in diverse areas from oncology [65] [50] to neurodegenerative diseases [66], and as datasets grow in scale and complexity, the methods outlined in this technical guide will become increasingly essential for extracting meaningful biological insights from imperfect data. By implementing these strategies, researchers can enhance the reliability of their findings and accelerate progress toward comprehensive understanding of disease mechanisms and the development of targeted therapeutic interventions.
The complexity of human diseases necessitates a holistic approach to understand their underlying mechanisms. Multi-omics technologies—encompassing genomics, transcriptomics, proteomics, and metabolomics—provide unprecedented insights into the molecular underpinnings of pathological processes. However, analyzing each omics layer in isolation presents only a fragmented view, insufficient to illuminate the complex pathological networks at play [31]. Integrative omics approaches address this limitation by harmonizing multiple layers of biological data to uncover relationships not detectable through single-omics analyses [68]. These methodologies are proving indispensable for elucidating intricate interactions between genetic and epigenetic alterations, organelle dysfunction, and dysregulated signaling pathways, ultimately bridging the gap between high-throughput data and mechanistic pathology [31].
The power of multi-omics integration is particularly evident in complex disease areas. In chronic kidney disease (CKD), for example, integrating tissue transcriptomic, urine and plasma proteomic, and targeted urine metabolomic profiling has identified specific pathways like complement and coagulation cascades and JAK/STAT signaling as central to disease progression [69]. Similarly, in mitochondrial diseases, integrated analysis of transcriptomes and metabolomes has revealed major remodeling of the anabolic folate-driven one-carbon cycle, pointing to potential therapy targets [25]. With the expansion of high-dimension data in disease research, these integration strategies are becoming invaluable for identifying and prioritizing disease mechanisms [69].
The selection of an appropriate integration method is paramount, as algorithms differ extensively in their approach, objectives, and outputs [68]. This guide provides an in-depth technical comparison of three prominent multi-omics integration tools—MOFA, DIABLO, and Similarity Network Fusion (SNF)—to equip researchers with the knowledge to select and implement the optimal method for their specific disease research applications.
Core Integration Methods: Theoretical Foundations and Mechanisms
MOFA (Multi-Omics Factor Analysis)
Theoretical Foundation: MOFA is an unsupervised factorization-based method formulated within a Bayesian probabilistic framework [68]. It operates as a generalization of Factor Analysis to multiple omics datasets, inferring a set of latent factors that capture principal sources of variation across data types [68]. The model decomposes each datatype-specific matrix into a shared factor matrix (representing the latent factors across all samples) and a set of weight matrices (one for each omics modality), plus a residual noise term [68].
Mathematical Model and Algorithm: MOFA decomposes the input data matrices using the following relationship:
$$ Y^{(m)} = Z W^{(m)T} + \epsilon^{(m)} $$
Where ( Y^{(m)} ) represents the data matrix for modality ( m ), ( Z ) denotes the latent factor matrix shared across all modalities, ( W^{(m)} ) represents the weight matrix for modality ( m ), and ( \epsilon^{(m)} ) represents residual noise [68]. The model assigns prior distributions to the latent factors, weights, and noise terms, ensuring that only relevant features and factors are emphasized during training. MOFA is trained to find the optimal set of latent factors and weights that best explain the observed multi-omics data, quantifying how much variance each factor explains in each omics modality [68].
Key Characteristics:
- Unsupervised approach: Does not require phenotype labels
- Bayesian framework: Incorporates sparsity constraints automatically
- Variance quantification: Estimates variance explained by each factor per modality
- Factor interpretation: Factors may be shared across all data types or specific to single modalities
DIABLO (Data Integration Analysis for Biomarker discovery using Latent cOmponents)
Theoretical Foundation: DIABLO is a supervised integration method that uses known phenotype labels to achieve integration and feature selection [68]. The framework extends sparse generalized canonical correlation analysis (sGCCA) to a supervised setting by substituting one view with a vector of outcome [70]. DIABLO seeks shared variations across data types while simultaneously discriminating phenotypic groups [70].
Mathematical Model and Algorithm: DIABLO builds linear combinations that maximize the sum of pairwise covariance across modalities while maintaining discrimination between classes. For each component ( h ), it solves the following optimization function:
$$ \max{ah^{(1)},...,ah^{(M)}} \sum{m,k}^{M} c{mk}g(\text{cov}(X^{(m)}ah^{(m)}, X^{(k)}a_h^{(k)})) $$
Where ( X^{(m)} ) is the depleted matrix after iteration ( h-1 ), ( ah^{(m)} ) is the loading vector in view ( m ), and ( c{mk} ) is an element of the design matrix specifying whether views ( m ) and ( k ) are connected [70]. A penalization is applied on the coefficients of the linear combinations to select variables that are most correlated within and between modalities [70]. In a predictive perspective, the number of components and variables to select is determined by minimizing the cross-validation error [70].
Key Characteristics:
- Supervised approach: Requires known phenotype labels
- Feature selection: Identifies subsets of informative features using penalization techniques
- Classification capability: Can classify new samples based on similarity in latent space
- Multi-block integration: Designed specifically for multi-omics data integration
SNF (Similarity Network Fusion)
Theoretical Foundation: Similarity Network Fusion is an unsupervised network-based method that fuses multiple views (data types) to construct an overall integrated matrix [68]. Rather than merging raw measurements directly, SNF constructs a sample-similarity network for each omics dataset, where nodes represent samples and edges encode the similarity between samples, typically computed using Euclidean or similar distance kernels [68].
Mathematical Model and Algorithm: The SNF algorithm involves three key steps:
- Similarity Network Construction: For each data type ( m ), construct a sample similarity matrix ( W^{(m)} ) where each element ( w(i,j) ) represents the similarity between samples ( i ) and ( j ).
- Neighbor Network Construction: For each network, compute a sparse kernel matrix ( P^{(m)} ) that normalizes the similarities, and a global kernel matrix ( S^{(m)} ) that captures more distant relationships.
- Network Fusion: Iteratively update each network using the formula:
$$ P^{(m)} = S^{(m)} \times \left(\frac{\sum_{k\neq m} P^{(k)}}{M-1}\right) \times (S^{(m)})^T $$
This process is repeated until convergence, resulting in a fused network that captures complementary information from all omics layers [68].
Key Characteristics:
- Network-based approach: Represents data as similarity networks
- Non-linear integration: Uses non-linear processes to fuse networks
- Sample-centric: Focuses on sample relationships rather than variable relationships
- Unsupervised: Does not require phenotype labels
Comparative Analysis of Methodologies
Method Classification and Key Characteristics
Table 1: Method Classification and Primary Characteristics
| Feature | MOFA | DIABLO | SNF |
|---|---|---|---|
| Integration Type | Unsupervised | Supervised | Unsupervised |
| Core Methodology | Bayesian matrix factorization | Sparse generalized CCA | Similarity network fusion |
| Feature Selection | No built-in selection | Sparse loadings for feature selection | No built-in selection |
| Biological Prior Integration | No | Yes (through design matrix) | No |
| Output | Latent factors + weights | Latent components + loadings | Fused similarity network |
| Primary Application | Exploratory analysis | Biomarker discovery & classification | Patient stratification |
Performance Benchmarks and Comparative Studies
Recent benchmarks provide crucial insights into the relative performance of these methods. A comprehensive 2024 comparison of integrative classification methods evaluated these approaches on both simulated and real-world datasets covering diverse medical applications including infectious diseases, oncology, and vaccines [70]. The study found that integrative approaches generally performed better or equally well compared to non-integrative counterparts [70].
In supervised classification tasks, DIABLO demonstrated particularly strong performance, outperforming other methods across the majority of simulation scenarios [70]. The method's ability to leverage phenotype information while identifying shared variations across data types contributed to its robust classification accuracy.
In real-world disease applications, complementary use of different integration methods has proven valuable. A CKD study employed both MOFA and DIABLO on the same dataset, with each method contributing unique insights [69]. MOFA, as an unsupervised approach, identified key disease-associated mechanisms without prior phenotypic constraints, while DIABLO's supervised approach uncovered multi-omic patterns specifically associated with disease outcomes [69]. Both methods converged on shared pathways, including complement and coagulation cascades and JAK/STAT signaling, while also identifying method-specific insights [69].
Table 2: Performance Comparison Across Methodologies
| Aspect | MOFA | DIABLO | SNF |
|---|---|---|---|
| Sample Size Flexibility | Good for moderate sample sizes [69] | Good for moderate sample sizes [69] | Best for larger sample sizes |
| Handling High Dimensionality | Excellent (Bayesian sparsity) | Excellent (sparse loadings) | Moderate (network construction) |
| Classification Accuracy | N/A (unsupervised) | High in benchmarks [70] | Moderate |
| Interpretability | Factors interpretable via weights | Components interpretable via loadings | Network structure interpretation |
| Missing Data Handling | Good (probabilistic framework) | Moderate | Poor |
Experimental Protocols and Implementation Guidelines
Standardized Workflow for Multi-Omics Integration
Implementing a robust multi-omics integration analysis requires careful attention to experimental design, data preprocessing, and method-specific parameterization. The following workflow outlines a standardized approach applicable across methodologies:
1. Experimental Design Considerations:
- Sample Matching: Ensure matched multi-omics profiles are collected from the same set of samples to enable "vertical integration" and maintain biological context [68].
- Cohort Characteristics: Carefully document clinical characteristics, disease etiology, and relevant clinical parameters, as these significantly impact molecular profiles [69].
- Sample Size Planning: While multi-omics methods can work with moderate sample sizes (e.g., n=37 in the CKD study [69]), power considerations should guide cohort sizing.
2. Data Preprocessing and Normalization:
- Dimensionality Balancing: Address orders-of-magnitude differences in feature numbers across platforms. For example, in the CKD study, the top 20% most variable genes were retained to normalize dimensionality across data types [69].
- Batch Effect Correction: Implement appropriate ComBat or similar algorithms to remove technical artifacts.
- Platform-Specific Normalization: Apply tailored normalization for each data type (e.g., TPM for RNA-seq, quantile normalization for proteomics).
3. Method-Specific Implementation:
MOFA+ Implementation (Current R/Python Implementation):
DIABLO Implementation via mixOmics:
SNF Implementation:
Validation and Interpretation Framework
Robustness Assessment:
- Stability Testing: Implement bootstrapping or subsampling approaches to evaluate feature selection stability.
- Cross-Validation: Use k-fold cross-validation appropriate to sample size, with stratification for class-imbalanced datasets.
- External Validation: Validate findings in independent cohorts when available, as demonstrated in the CKD study with a validation cohort of n=94 [69].
Biological Interpretation:
- Pathway Enrichment Analysis: Apply overrepresentation analysis or GSEA on selected features.
- Network Propagation: For SNF results, implement network propagation algorithms to identify enriched modules.
- Multi-Omics Visualization: Utilize specialized visualization techniques to display integrated results.
Visualization and Data Flow
Figure 1: Multi-Omics Integration Workflow and Data Flow. The diagram illustrates the flow of multi-omics data through the three integration methods (MOFA, DIABLO, SNF) and their resulting outputs and applications. DIABLO incorporates phenotype information (red) as a supervised method, while MOFA and SNF are unsupervised. All methods ultimately contribute to biological insights including biomarker discovery, patient stratification, and pathway identification.
Table 3: Essential Computational Tools for Multi-Omics Integration
| Tool/Resource | Function | Implementation | Key Features |
|---|---|---|---|
| MOFA2 | Unsupervised factor analysis | R/Python package | Bayesian framework, variance decomposition, missing data handling |
| mixOmics | DIABLO implementation | R package | Supervised integration, feature selection, classification |
| SNFtool | Similarity network fusion | R package | Network construction, multi-view clustering, patient stratification |
| Omics Playground | Integrated analysis platform | Web-based GUI | Code-free interface, multiple methods, interactive visualization |
| Multi-Omics Factor Analysis | Variance exploration | R package | Factor interpretation, data exploration, visualization |
| C-PROBE Cohort Data | Validation datasets | Biological samples | Multi-omics profiles with longitudinal outcomes [69] |
Table 4: Biological Databases for Multi-Omics Interpretation
| Database | Application | Content | Integration Utility |
|---|---|---|---|
| TCGA (The Cancer Genome Atlas) | Cancer multi-omics | RNA-Seq, DNA-Seq, miRNA-Seq, methylation | Reference datasets for method validation [68] |
| GWAS Catalog | Genomic associations | SNP-phenotype associations | Prioritizing genomic features in integration [11] |
| KEGG/Reactome | Pathway analysis | Curated biological pathways | Interpreting integrated multi-omics features [69] |
| Human Protein Atlas | Protein expression | Tissue-specific protein localization | Contextualizing proteomic findings |
The integration of multi-omics data represents a paradigm shift in disease mechanism research, moving beyond single-layer analyses to capture the complex interactions between molecular layers. MOFA, DIABLO, and SNF offer complementary approaches to this challenge, each with distinct strengths and applications. MOFA excels in unsupervised exploration of shared variation across modalities, DIABLO provides powerful supervised integration for biomarker discovery and classification, and SNF offers unique capabilities in patient stratification through network-based integration.
Future directions in multi-omics integration are rapidly evolving toward higher resolution technologies. Single-cell multi-omics and spatial multi-omics provide unprecedented detail about intracellular and intercellular molecular interactions that control development, physiology, and pathology [11]. These technologies successfully resolve spatially organized cellular networks, as demonstrated in human colorectal cancer [11]. Additionally, machine learning and deep learning approaches are increasingly being applied to multi-omics data integration, offering powerful non-linear modeling capabilities [11].
As these technologies and methods continue to advance, they will further enhance our ability to unravel the complex mechanisms underlying human diseases, ultimately accelerating the development of targeted therapies and precision medicine approaches. The complementary use of multiple integration strategies, as demonstrated in recent CKD research [69], provides a robust framework for extracting meaningful biological insights from complex multi-omics datasets.
Best Practices for Computational Scalability and Reproducible Workflows
Integrative omics research, which combines genomics, transcriptomics, proteomics, metabolomics, and other molecular data layers, has emerged as a powerful approach for unraveling the complex mechanisms underlying human disease pathogenesis. The ability to integrate multiple omics technologies provides a more comprehensive picture of human phenotypes and disease than any single technology can achieve alone [71]. However, this multi-dimensional approach generates unprecedented computational challenges that demand robust solutions for scalable data processing and reproducible workflow management.
The clinical variability of diseases—from mitochondrial disorders with their tissue-specific manifestations to the heterogeneous presentation of COVID-19—underscores the biological complexity that researchers must decipher [25] [72]. High-throughput technologies based on next-generation sequencing and mass spectrometry have advanced considerably, allowing molecular physiology studies of whole-tissue and organismal homeostasis at exceptional depth [25]. Yet, as research scales to population-level datasets like the UK Biobank, which encompasses over 500,000 participants, the computational infrastructure must evolve accordingly [72].
This technical guide outlines best practices for building computationally scalable and reproducible workflows specifically tailored to integrative omics research, enabling scientists to accelerate discoveries in disease mechanisms while maintaining rigorous standards for verification and validation.
Foundational Principles for Reproducible Research
Versioned Workflows for Consistent Tracking
Versioning constitutes the cornerstone of reproducible research. It ensures researchers can trace back to the exact code, hyperparameters, datasets, and configurations used for a particular execution, making debugging, collaboration, and compliance more straightforward [73]. Each workflow execution should be automatically versioned with a unique ID, capturing snapshots of workflows, data, and models whenever executed [73].
Implementation Strategy: Adopt platforms that automatically version workflows, data, and models by capturing a snapshot of your workflow each time it executes. This ensures the lineage of data and changes are preserved throughout the research lifecycle [73]. Extend versioning further by explicitly using artifacts that track dependencies between data, code, and results.
Containerized Execution for Environment Consistency
Containers enable execution of tasks and workflows with the same versions of libraries, operating systems, and packages across all environments, from local development machines to high-performance computing clusters and cloud environments [73]. This approach eliminates the "it worked on my machine" problem that frequently plagues computational research.
Implementation Strategy: Use declarative infrastructure to set containers and resources at the task level, allowing for a consistent runtime environment for each task. Implement features that let you define, manage, and version runtime environments for workflows by specifying base images, dependencies, and configurations directly in code [73]. This ensures that when the image is called from a container, the system checks whether it exists and builds it securely if not yet available.
Parameterization for Flexible Experimentation
Parameterization enables adjustment of workflows without altering underlying code, allowing researchers to test different models and log versioned results in real-time, which is critical for systematic experimentation [73]. This approach maintains reproducibility while permitting scientific exploration.
Implementation Strategy: Implement launch forms that parameterize workflows, enabling re-running workflows and tasks with new parameters while maintaining execution history. Support custom launch plans to start workflows while passing inputs as parameters, and ensure workflows can be relaunched from UI, API, or terminal interfaces [73].
Defined Data Types for Validation
Clearly defined data types help check for compatibility and correctness in data flow, reducing runtime errors and serving as documentation when reusing or sharing tasks [73]. Strong typing is particularly valuable in multi-omics research where data from various technologies (genomics, proteomics, metabolomics) must integrate seamlessly.
Implementation Strategy: Enforce strongly typed inputs and outputs for each task and workflow, requiring that tasks explicitly specify types of inputs and outputs. Use type hinting annotations in task functions to enable automatic validation [73].
Architecting Scalable Data Stacks for Omics Research
Data Ingestion and Storage Foundations
Robust data ingestion and storage systems are critical for enabling data-centric omics initiatives, providing infrastructure to manage diverse data types—structured, unstructured, and multimodal—at enterprise scale [74].
Implementation Strategy:
- Deploy platforms such as Apache Kafka for high-throughput, real-time data ingestion
- Utilize cloud-native storage solutions including Amazon S3 for unparalleled scalability, flexibility, and performance
- Select platforms with advanced data orchestration capabilities to ensure reliable, automated data flows across the ecosystem [74]
Data Processing and Transformation
Transforming raw omics data into refined, actionable assets is a cornerstone of effective analysis. Solutions like Apache Spark and Databricks excel at processing and transforming large-scale datasets, enabling researchers to clean, enrich, and structure data for meaningful insights [74].
Implementation Strategy: Invest in high-quality data processing pipelines to maximize analytical accuracy and efficiency. Precise, well-structured data transformation minimizes downstream rework and enhances the reliability of analytical outcomes, forming a foundational component of scalable, enterprise-grade solutions [74].
Workflow Orchestration Strategies
Effective workflow orchestration is essential for a scalable data stack, ensuring seamless coordination of tasks across the analysis lifecycle, from data preparation to model training and interpretation [74].
Implementation Strategy: Implement tools such as Apache Airflow and Kubeflow that provide robust frameworks for synchronizing complex processes, minimizing errors, and optimizing resource utilization. Design workflows that integrate disparate systems to enhance data accessibility [74]. Streamline management of complex pipelines to enable cross-functional teams to collaborate more effectively, ensuring smooth data flow across various development stages while reducing operational complexity.
Comparative Analysis of Scalable Data Stack Components
Table 1: Data Stack Components for Scalable Omics Research
| Component | Representative Tools | Key Function | Implementation Consideration |
|---|---|---|---|
| Data Ingestion | Apache Kafka | High-throughput, real-time data ingestion | Ensure compatibility with diverse omics data formats |
| Data Storage | Amazon S3, Snowflake | Scalable storage for structured/unstructured data | Implement data partitioning strategies for query optimization |
| Data Processing | Apache Spark, Databricks | Large-scale dataset transformation | Leverage in-memory computation for iterative algorithms |
| Workflow Orchestration | Apache Airflow, Kubeflow | Coordination of complex analytical pipelines | Design for fault tolerance and graceful error recovery |
| Container Management | Docker, Kubernetes | Environment consistency across compute resources | Implement resource quotas and scaling policies |
Workflow vs. Agents: Architectural Considerations
A critical decision in designing scalable omics analysis systems is choosing between structured workflows and autonomous agents—each with distinct characteristics, advantages, and trade-offs [75].
Workflows: The Reliable Foundation
Workflows are orchestrated pipelines with clear control flow, where you define the steps—use a tool, retrieve context, call the model, handle the output [75]. They follow explicit logic like a recipe, making them predictable, testable, and cost-predictable.
Characteristics:
- Predictable execution: Input A always leads to Process B, then Result C
- Explicit error handling: "If this breaks, do that specific thing"
- Transparent debugging: Ability to trace through code to find problems
- Resource optimization: Precise understanding of computational costs [75]
Agents: Dynamic but Complex
Agents are autonomous systems where the large language model (LLM) decides what to do next, which tools to use, and when it's "done" [75]. They operate through recursive decision-making loops that enable dynamic tool selection and adaptive reasoning.
Characteristics:
- Dynamic tool selection: Context-aware decisions about which analytical tools to employ
- Adaptive reasoning: Learning from mistakes within the same analytical process
- Self-correction: Ability to try different approaches when initial attempts fail
- Complex state management: Tracking multi-step analytical processes [75]
Decision Framework for Omics Research
Selecting between workflows and agents depends on the specific requirements of the omics research question:
Choose workflows when:
- Analyzing well-established omics data with standardized processing steps
- Computational budget is constrained and predictable costs are required
- Regulatory compliance demands fully traceable analytical pathways
- Research processes require rigorous validation and debugging
Choose agents when:
- Exploring novel data integration patterns without predefined pathways
- Hypothesis generation requires creative connections across disparate data types
- Resource availability permits iterative, potentially expensive exploration
- Research questions benefit from adaptive reasoning about next analytical steps [75]
Diagram 1: Workflow vs. Agent Decision Framework (Max Width: 760px)
Implementing Reproducible Multi-Omics Analysis: A COVID-19 Case Study
A comprehensive multi-omics study of COVID-19 demonstrates the implementation of reproducible workflows at scale, providing valuable insights into best practices for integrative analysis [72].
Experimental Design and Workflow Architecture
The study employed data from the UK Biobank (UKB), incorporating COVID-19 phenotypic data alongside genome, imputed transcriptome, metabolome, and exposome data [72]. The analytical approach progressed through well-defined stages:
- Data Acquisition and Curation: Accessing UK Biobank data for 408,183 participants of British white ancestry to minimize genetic heterogeneity
- Quality Control Procedures: Implementing rigorous QC at SNP and individual levels, resulting in 7,701,772 SNPs and 107,857 individuals for analysis
- Phenotypic Classification: Defining COVID-19 cases according to WHO ordinal scale: controls (coded 0), moderate cases (coded 1), and severe cases (coded 2) [72]
Diagram 2: COVID-19 Multi-Omics Workflow Architecture (Max Width: 760px)
Quantitative Findings on Omics Contributions
The COVID-19 multi-omics analysis yielded precise measurements of how different biological data layers contribute to understanding disease susceptibility, providing a template for evaluating omics technologies in disease research [72].
Table 2: Variance Explained by Omics Layers in COVID-19 Susceptibility
| Omics Layer | Variance Explained (Single-Omics) | Variance Explained (Multi-Omics with Exposome) | Key Findings |
|---|---|---|---|
| Transcriptome | 3-4% | Minimal change | Derived from coronary artery tissue; relatively independent of exposome |
| Exposome | 3-4% | 3-4% | Captured significant variation independently |
| Genome | 2-2.5% | Diminished to negligible | Exposome mediated ~60% of genome's effects |
| Metabolome | 2-2.5% | Diminished to negligible | Exposome mediated ~60% of metabolome's effects |
Implementation of the CORE-REML Model
The study employed a novel linear mixed model known as CORE-REML, which can handle multiple variance-covariance structures and explicitly estimates the covariance between random effects [72]. This approach enabled quantification of both additive and non-additive variance components for each omics layer, capturing interaction effects between different biological data types.
Advanced Tools and Platforms for Omics Workflows
Advanced Workflow Platforms
Emerging platforms are transforming how researchers build and execute analytical workflows:
Playbook Workflow Builder: A web-based platform that enables scientists to design custom workflows using pre-built analytical components through an intuitive, interactive interface or AI-powered chatbot [76]. The system automatically generates detailed documentation, including interactive figures, clear figure legends, and step-by-step method descriptions, ensuring the entire workflow is well-organized and easy to reproduce [76].
Union AI Platform: Provides tools and enforces best practices for building reproducible workflows as an integrated part of ML and data pipeline lifecycle, featuring automatic versioning of workflows, data, and models [73].
Specialized Omics Integration Tools
NF-Core/Nextflow: Framework for workflow standardization in bioinformatics, enabling execution of high-performance workflows at the level of individual researchers [77]. Particularly valuable for RNA-seq analysis pipelines and other common omics workflows.
Shakudo OS: An operating system for data stacks that unifies compute, storage, and orchestration layers, deployable in both cloud and on-premise environments [74]. Offers enterprises flexibility to scale AI workflows securely and efficiently without vendor lock-in or excessive complexity.
The Researcher's Toolkit for Integrative Omics
Table 3: Essential Research Reagent Solutions for Integrative Omics
| Tool/Category | Representative Examples | Function in Workflow | Implementation Considerations |
|---|---|---|---|
| Workflow Orchestration | Apache Airflow, Kubeflow, Nextflow | Coordinate complex multi-step analytical processes | Ensure compatibility with HPC and cloud environments |
| Data Integration Platforms | Playbook Workflow Builder, Union | Simplify construction of reproducible analytical pipelines | Evaluate learning curve for domain scientists |
| Genomic Analysis | UK Biobank, GWAS catalogs | Provide genetic variation data for association studies | Address population stratification in analyses |
| Transcriptomic Resources | GTEx, RNA-seq pipelines | Offer gene expression data across tissues | Consider tissue specificity in disease mechanisms |
| Metabolomic Profiling | Mass spectrometry platforms | Capture small molecule abundance data | Account for technical variability in measurements |
| Exposome Characterization | Socio-demographic, behavioral data | Incorporate environmental factor assessment | Develop standardized exposure metrics |
Computational scalability and reproducible workflows are not merely technical concerns but fundamental requirements for advancing integrative omics research into human disease mechanisms. By implementing versioned workflows, containerized execution, parameterized experimentation, and strongly typed data interfaces, research teams can accelerate discovery while maintaining rigorous standards for verification and validation.
The architectural decision between structured workflows and autonomous agents depends on the specific research context—with workflows providing predictable, debuggable pathways for established analytical processes, and agents offering dynamic exploration capabilities for novel research questions. As platforms like Playbook Workflow Builder and Union continue to evolve, they promise to make sophisticated multi-omics analysis more accessible to domain scientists while maintaining the computational rigor required for reproducible research.
Future directions will likely see increased integration of AI-assisted workflow construction, enhanced interoperability between specialized omics platforms, and more sophisticated approaches for quantifying and leveraging interactions between different omics layers. By adopting these best practices today, researchers position themselves to capitalize on these advancements while producing findings that stand the test of scientific scrutiny.
From Bench to Bedside: Validating Integrative Models in Disease Research and Therapy
Lung adenocarcinoma (LUAD) remains a major cause of cancer-related mortality worldwide, characterized by high heterogeneity and poor prognosis. The advent of multi-omics technologies has revolutionized our understanding of LUAD biology by integrating genomic, epigenomic, transcriptomic, and proteomic data. This case study examines how integrative multi-omics profiling is advancing molecular classification, prognostic modeling, and personalized treatment strategies for LUAD, framed within the broader context of using integrative omics to understand disease mechanisms. These approaches address critical clinical challenges in LUAD management, including prognostic heterogeneity and variable treatment responses, by providing a more comprehensive view of the molecular intricacies driving tumor progression and therapeutic resistance [78] [23] [79].
Molecular Landscape of LUAD through Multi-Omics Analysis
Multi-Omics Dimensions in LUAD
Table 1: Multi-Omics Components and Their Applications in LUAD Research
| Omics Component | Description | Key Findings in LUAD | Clinical Applications |
|---|---|---|---|
| Genomics | Study of DNA sequences, mutations, and structural variations | TP53 mutations (≈50% of cases), EGFR/ALK/KRAS driver mutations, HER2 amplifications | Targeted therapy selection, risk assessment, pharmacogenomics |
| Epigenomics | Heritable changes in gene expression without DNA sequence alteration | Global hypomethylation in recurrent tumors, CpG island methylation, histone modifications | Epigenetic therapy, prognostic stratification, biomarker discovery |
| Transcriptomics | Analysis of RNA expression patterns | Differential expression of circadian rhythm, anoikis, and phase separation genes | Molecular subtyping, immunotherapy response prediction |
| Proteomics | Study of protein structure, function, and interactions | Protein signaling pathways, post-translational modifications | Drug target identification, functional studies of cellular processes |
| Metabolomics | Comprehensive analysis of metabolites | Metabolic reprogramming in tumor cells | Disease diagnosis, nutritional studies, drug metabolism analysis |
Multi-omics approaches have revealed that LUAD exhibits significant molecular heterogeneity across different dimensions. Genomic studies have identified recurrent mutations in key driver genes including TP53, EGFR, ALK, and KRAS, while epigenomic analyses have demonstrated the crucial role of DNA methylation patterns and histone modifications in tumor progression [23] [79]. Transcriptomic profiling has further refined molecular subtypes with distinct clinical outcomes, highlighting the value of integrated approaches for comprehensive tumor characterization.
Molecular Subtyping of LUAD
Integrative multi-omics analyses have identified distinct molecular subtypes of LUAD with significant prognostic implications:
Epigenetic-based subtypes: A 2025 study integrating multi-omics data from 432 TCGA patients identified two distinct molecular subtypes (CS1 and CS2) with significant differences in epigenetic modification patterns, immune microenvironment, and clinical outcomes (P = 0.005) [78] [80].
Poorly differentiated LUAD subtypes: Research focusing on early-stage poorly differentiated LUAD revealed three integrative molecular subtypes (C1, C2, and C3), with the C1 subtype showing the worst prognosis (p = 0.024) despite similar mutation frequencies across subtypes [79].
Proliferating cell-based subtypes: Single-cell RNA sequencing analysis identified six proliferating cell subpopulations, with clusters C2MMP9 and C3KRT8 enriched in Scissor+ groups associated with unfavorable prognosis [26].
Prognostic Modeling Approaches in LUAD
Feature Selection and Model Construction Methodologies
Table 2: Prognostic Models in LUAD and Their Performance Characteristics
| Model Type | Key Genes/Biomarkers | Algorithm Used | Validation AUC | Clinical Implications |
|---|---|---|---|---|
| Epigenetic-based | Epigenetic regulator genes | Random Survival Forest (RSF) | 0.625-0.694 (time-dependent) | Predicts immunotherapy response and drug sensitivity |
| Anoikis-related | LDHA, PLK1, TRAF2, ITGB4, SLCO1B3, TIMP1, ZEB2 | LASSO + Random Forest | 1-year: 0.787-0.8052-year: 0.681-0.7693-year: 0.695-0.735 | Predicts metastatic potential and TME remodeling |
| Circadian Rhythm | CDK1, HLA-DMA | Multivariate Cox Regression | >0.6 (1/3/5-year survival) | Guides chronotherapy and assesses immunotherapy efficacy |
| Disulfidptosis-related | 8-lncRNA signature (ATXN1-AS1, AC018645.3, etc.) | LASSO + Cox Regression | Independent prognostic factor | Novel cell death mechanism targeting |
| Neuroendocrine Differentiation | Neural network-based clinical factors | Neural Network Algorithm | 0.852-0.864 (6-month OS)0.835-0.883 (6-month CSS) | Addresses aggressive variant with poor prognosis |
The construction of robust prognostic models typically involves multiple computational biology approaches. Feature selection commonly employs univariate Cox regression analysis to identify survival-associated genes, followed by dimension reduction techniques such as Least Absolute Shrinkage and Selection Operator (LASSO) regression to prevent overfitting. Random Forest algorithms are frequently utilized to evaluate variable importance, with final model construction using multivariate Cox regression analysis [81] [82] [83].
Model validation represents a critical step, typically employing internal validation through bootstrapping or cross-validation within the training dataset (often TCGA-LUAD), followed by external validation using independent cohorts from GEO databases (such as GSE31210, GSE30219, or GSE72094). Time-dependent receiver operating characteristic (ROC) analysis and Kaplan-Meier survival curves are standard for evaluating predictive performance [84] [82] [83].
Emerging Prognostic Signatures
Recent studies have identified several novel prognostic signatures in LUAD:
Liquid-liquid phase separation-related genes: A 2025 study identified 7 prognostic genes through differential expression analysis and constructed a risk model that accurately predicted survival outcomes and showed significant differences in immune status and drug sensitivity between risk groups [81].
Scissor+ proliferating cell risk score: Utilizing 111 machine learning algorithms, researchers developed a proliferating cell risk score that demonstrated superior performance in predicting prognosis and clinical outcomes compared to 30 previously published models [26].
Disulfidptosis-related lncRNAs: A novel prognostic model based on 8 disulfidptosis-related long non-coding RNAs was constructed, providing insights into targeting this newly discovered cell death mechanism for therapeutic intervention [85].
Experimental Protocols for Multi-Omics Profiling
Integrated Multi-Omics Clustering Analysis
Figure 1: Workflow for Integrated Multi-Omics Clustering Analysis in LUAD
The MOVICS algorithm enables integrated multi-omics clustering through a multi-step approach. For feature selection, researchers first filter epigenetics-related genes and perform survival analysis (Cox regression, p < 0.05) on mRNA expression data. For other molecular features, the following criteria are applied: top 1500 MAD-filtered lncRNAs followed by survival filtering (p < 0.05); top 50% MAD-filtered miRNAs with survival significance (p < 0.05); top 1500 MAD-filtered methylation sites with survival significance (p < 0.05); and mutation features present in >5% of samples [80].
The optimal cluster number is determined by testing k = 2-8 using multiple clustering methods. Integration is performed using Gaussian models for expression and methylation data, and binomial model for mutation data. Clustering robustness is assessed using silhouette analysis and consensus clustering with Euclidean distance and average linkage. Data standardization employs centerFlag and scaleFlag parameters for expression and methylation features, with methylation values converted to M-values for enhanced signal detection [80].
Single-Cell RNA Sequencing Analysis
Figure 2: Single-Cell RNA Sequencing Analysis Workflow for LUAD
Single-cell RNA sequencing analysis begins with comprehensive quality control and the meticulous exclusion of doublets. To mitigate potential batch effects among samples, harmony analysis is employed, followed by principal component analysis (PCA) and uniform manifold approximation and projection (UMAP) for dimension reduction and clustering [26].
Unsupervised clustering identifies distinct cell clusters, which are annotated into various cell types based on characteristic expression profiles of canonical marker genes. For proliferating cell analysis, researchers meticulously sort proliferating cells and identify subpopulations based on unique surface markers and subset-specific markers. Developmental trajectories are inferred using the SCTOUR algorithm, while cellular communication networks are analyzed using the CellChat tool to identify key signaling pathways [26].
The Scissor algorithm is applied to identify cell subgroups closely associated with distinct disease phenotypes within scRNA data. Functional enrichment analysis identifies upregulated pathways within specific subgroups, while NicheNet analysis predicts ligands that may drive specific cellular phenotypes [26].
The Scientist's Toolkit: Essential Research Reagents and Solutions
Table 3: Key Research Reagent Solutions for Multi-Omics Profiling in LUAD
| Category | Specific Solution | Function/Application | Example Use in LUAD Research |
|---|---|---|---|
| Nucleic Acid Extraction | AllPrep DNA/RNA Mini Kit (Qiagen) | Simultaneous DNA/RNA extraction from FFPE/frozen tissues | Whole-exome and transcriptome sequencing from same specimen [79] |
| Library Preparation | KAPA Hyper Prep Kit (Illumina platforms) | Library construction for sequencing | Preparation of sequencing libraries for whole-exome sequencing [79] |
| Target Enrichment | Twist Human Core Exome kit | Exome capture for targeted sequencing | Whole-exome sequencing of LUAD tumors and normal tissues [79] |
| Single-Cell Analysis | 10x Genomics Chromium System | Single-cell partitioning and barcoding | Single-cell RNA sequencing of LUAD tumor microenvironment [26] |
| Epigenetic Analysis | Illumina Infinium MethylationEPIC Kit | Genome-wide DNA methylation profiling | Methylation analysis in poorly differentiated LUAD subtypes [79] |
| Spatial Transcriptomics | 10x Genomics Visium Spatial Gene Expression | Tissue context preservation for transcriptomics | Spatial colocalization of proliferating cell subtypes [26] |
| Computational Tools | MOVICS R package | Multi-omics clustering and visualization | Integrated clustering of genomic, epigenomic, transcriptomic data [80] |
| Validation Reagents | SweScript First Strand cDNA synthesis kit | cDNA synthesis for qRT-PCR validation | Experimental validation of prognostic gene expression [81] |
Clinical Implications and Therapeutic Applications
Predictive Biomarkers for Treatment Response
Multi-omics profiling has identified significant associations between molecular subtypes and treatment responses:
Immunotherapy: Epigenetic-based classification reveals that low-risk patients exhibit enhanced immune cell infiltration, particularly CD8+ T cells and M1 macrophages, and show better responses to immune checkpoint inhibitors [78] [80]. The Scissor+ proliferating cell risk score also demonstrates value in predicting immunotherapy resistance, with high SPRS patients showing decreased benefit from immune checkpoint blockade [26].
Chemotherapy and Targeted Therapy: Drug sensitivity analysis reveals subtype-specific therapeutic vulnerabilities, with low-risk epigenetic subtype patients showing higher sensitivity to conventional chemotherapy and targeted therapy [78]. High SPRS patients similarly show increased sensitivity to chemotherapeutic and targeted therapeutic agents [26].
Surgical Interventions: For LUAD with neuroendocrine differentiation, surgery (HR=0.51; 95% CI: 0.31-0.82; P=0.006) and chemotherapy (HR=0.33; 95% CI: 0.21-0.50; P<0.001) are associated with improved overall survival, highlighting the importance of appropriate patient stratification for specific treatment modalities [84].
Integration into Clinical Decision-Making
The translation of multi-omics profiling into clinical practice involves several key applications:
Risk Stratification: Molecular subtypes identified through integrated omics approaches provide refined prognostic stratification beyond conventional histopathological grading, particularly for early-stage poorly differentiated LUAD where only approximately 30% of patients experience postoperative recurrence [79].
Treatment Selection: The ability of prognostic models to predict drug sensitivity and immunotherapy response offers practical guidance for personalized treatment selection, potentially improving outcomes through precision medicine approaches [78] [26].
Postoperative Monitoring: Molecular classification enables more precise management and postoperative monitoring strategies for high-risk patients who may benefit from more intensive surveillance or adjuvant therapy [79].
Integrative multi-omics profiling represents a transformative approach for understanding LUAD heterogeneity and improving patient outcomes. By combining molecular data across multiple dimensions, researchers have identified robust molecular classifications with significant prognostic implications and predictive value for treatment response. The continuing evolution of multi-omics technologies, particularly single-cell sequencing and spatial transcriptomics, promises to further refine our understanding of LUAD biology and enhance personalized treatment approaches. As these methodologies become more standardized and accessible, their integration into routine clinical practice has the potential to revolutionize LUAD management through truly precision oncology approaches.
Alzheimer's disease (AD) is a progressive neurodegenerative disorder and a leading cause of dementia, posing a significant global health challenge as life expectancy rises [86] [87]. As a complex disease with heterogeneous genetic and molecular underpinnings, late-onset AD (LOAD) has proven particularly challenging to characterize in terms of genetic risk [86]. Much of the genetic contribution to LOAD remains unexplained, complicating efforts to develop accurate predictive models [87].
Traditional approaches relying primarily on polygenic scores (PGS) that aggregate common genetic variants from genome-wide association studies (GWAS) have historically underperformed in predicting AD risk [86]. The limitations of PGS models are well-documented, with even the best-performing models achieving only moderate predictive accuracy that diminishes significantly when the influential APOE ε4 allele is excluded [86]. This highlights the critical need for approaches that incorporate complementary biological information beyond common genetic variants alone.
Integrative multi-omics approaches present a promising path forward by simultaneously analyzing data from multiple molecular layers—including genomics, transcriptomics, and proteomics—to capture the full complexity of AD pathophysiology [88] [89]. This case study examines how the integration of these molecular data types can enhance both our understanding of AD mechanisms and our ability to predict disease risk, framed within the broader context of integrative omics for understanding disease mechanisms.
Background and Rationale
The Complexity of Alzheimer's Disease
AD is characterized by the accumulation of amyloid-beta plaques, tau tangles, and progressive neuronal loss, with risk influenced by a combination of genetic, molecular, and environmental factors [86] [87]. The APOE ε4 allele remains the strongest known genetic risk factor, accounting for approximately one-quarter of the heritable contributions to liability, with total AD heritability estimated between 58% and 75% [86]. Emerging evidence indicates that AD-associated genetic variants converge on key biological pathways including cholesterol and lipid metabolism, neuroinflammation, and synaptic function [86].
Limitations of Current Approaches
Polygenic scores capture little of the complexity of AD's heterogeneous underpinnings [86]. The failure of current treatments can be attributed to their focus on symptomatic relief rather than addressing underlying causes, typically administered at late disease stages when significant brain damage has already occurred [87]. This underscores the need for early detection and intervention strategies that can slow disease progression during pre-symptomatic stages.
The Promise of Multi-Omics Integration
Multi-omics technologies enable comprehensive assessment of entire pools of biological molecules, providing complementary insights across molecular layers [88] [89]. While single-omics studies generate lists of disease-associated differences, analysis of only one data type is limited to correlations, mostly reflecting reactive processes rather than causative ones [88]. Integration of different omics data types can elucidate potential causative changes leading to disease, revealing therapeutic targets that can be validated through further molecular studies [88].
Methodology
Study Population and Quality Control
The integrative multi-omics analysis was conducted on 15,480 individuals from the Alzheimer's Disease Sequencing Project (ADSP) R4 release, comprising one of the most comprehensive AD datasets currently available [86] [90]. The ADSP R4 dataset includes whole-genome sequencing (WGS) data from a globally diverse population spanning 40 global cohorts, incorporating data from nearly all previous large-scale AD studies [86].
Quality Control Measures: The initial dataset of 36,361 individuals underwent rigorous filtering based on defined criteria to enable focused analysis of LOAD [86]. Cohorts with a mean age of cases greater than or equal to 70 years were selected, thereby excluding early-onset cohorts. Additional filters ensured balanced sex distribution, removed cohorts with very low case-control counts, and excluded samples with mixed phenotypes such as other dementias [86]. Principal component analysis (PCA) was performed to assess genetic similarity to labeled reference populations [86].
Genome-Wide Association Study (GWAS)
Protocol: GWAS was conducted using PLINK v2.0 after performing comprehensive quality control on the ADSP dataset [86]. Variant names were standardized, and variants failing laboratory-based QC filters were removed along with intentionally duplicated samples [86].
Filtering Parameters:
- Minor allele count (MAC) threshold: < 20
- Variant call rate threshold: 99%
- Sample call rate threshold: 95%
- Minor allele frequency (MAF) threshold: 0.01 (for sensitivity analysis)
Statistical Analysis: The additive model in PLINK v2.0 was used for GWAS, with adjustments for age at diagnosis for cases or age at date of data release for controls, sex, and the first five principal components to account for population stratification [86]. Significant loci were identified at a genome-wide significant p-value threshold of p < 5E-08 [86].
Transcriptome-Wide Association Study (TWAS)
Protocol: TWAS was conducted using PrediXcan and multivariate adaptive shrinkage (MASHR) expression quantitative trait loci (eQTL) models from the Genotype-Tissue Expression (GTEx) Project v8, available in PredictDB [86]. This approach studies tissue-specific gene-expression changes associated with AD by leveraging genetically regulated components of gene expression.
Proteome-Wide Association Study (PWAS)
Protocol: PWAS was performed to identify protein-level associations with AD risk, analyzing genetically regulated components of protein expression to complement the genetic and transcriptomic findings [86] [90].
Integrative Risk Models (IRMs)
Model Development: IRMs were developed using genetically regulated components of gene and protein expression along with clinical covariates [86] [90]. Two primary machine learning approaches were evaluated:
- Elastic-net logistic regression
- Random forest classifiers
Model Evaluation: Performance was assessed using multiple metrics including area under the receiver operating characteristic (AUROC), area under the precision-recall curve (AUPRC), F1-score, and balanced accuracy [86] [90]. These IRMs were compared against baseline PGS and covariate-only models to determine significant improvements in predictive accuracy.
Pathway Enrichment Analysis
Following the identification of significant associations from GWAS, TWAS, and PWAS, pathway enrichment analysis was conducted to identify biological pathways overrepresented among the significant genes and proteins [86] [90]. This analysis provides insights into the collective biological processes disrupted in AD.
Results and Findings
Multi-Omics Associations with Alzheimer's Disease
The integrated multi-omics analysis identified numerous significant associations across genomic, transcriptomic, and proteomic layers:
Table 1: Significant Associations Identified through Multi-Omics Analysis
| Omics Layer | Number of Significant Associations | Key Findings |
|---|---|---|
| Genomics (GWAS) | 104 genomic associations | Included known and novel loci, with APOE region showing strongest signals |
| Transcriptomics (TWAS) | 319 transcriptomic associations | Identified tissue-specific gene expression changes in hippocampal and brain tissues |
| Proteomics (PWAS) | 17 proteomic associations | Included proteins such as TOMM40 and APOC1, validated through mediation testing of pQTL effects |
The TWAS identified 54 hippocampal genes linked to AD risk, with fine-mapping prioritizing 24 candidates (e.g., PICALM, BIN1) whose effects are mediated through tissue-specific expression [86]. Proteome-wide analyses revealed 43 AD-associated proteins, including TOMM40 and APOC1, with 63% concordance validated through mediation testing of pQTL effects [86].
Pathway Enrichment Findings
Enrichment analyses of the TWAS and PWAS results revealed significant overrepresentation in key biological pathways not fully captured by GWAS results alone [86] [90]. These included:
- Cholesterol metabolism pathways - Consistent with the known role of lipid metabolism in AD pathogenesis
- Immune signaling pathways - Highlighting the importance of neuroinflammation in AD
- Myeloid differentiation pathways - Emphasizing the role of microglial function in AD
- DNA repair pathways - Suggesting novel mechanisms in AD progression
Predictive Performance of Integrative Risk Models
The developed IRMs demonstrated significantly improved predictive performance compared to traditional approaches:
Table 2: Performance Comparison of Risk Prediction Models
| Model Type | AUROC | AUPRC | Key Features |
|---|---|---|---|
| PGS Baseline | 0.55-0.75 (range from literature) | Not reported | PRS-CS with genome-wide SNPs and APOE |
| Random Forest IRM | 0.703 | 0.622 | Transcriptomic and covariate features |
| Elastic-net IRM | Not specified | Not specified | Transcriptomic and proteomic features |
The best-performing IRM, random forest with transcriptomic and covariate features, achieved an AUROC of 0.703 and AUPRC of 0.622, significantly outperforming PGS and baseline covariate models [86] [90]. This demonstrates the value of integrating multi-omics data with advanced machine learning approaches for AD risk prediction.
External Validation with Machine Learning Approaches
Complementary research applying machine learning to genome-wide data from 41,686 individuals in the largest European AD consortium further validated the utility of advanced computational approaches [91]. Gradient boosting machines achieved an AUC of 0.692, not significantly different from PRS (AUC: 0.689), but identified novel loci including variants mapping to ARHGAP25, LY6H, COG7, SOD1, and ZNF597 that replicated in external datasets [91].
Visualizing the Multi-Omics Workflow
The following diagram illustrates the integrated multi-omics approach for Alzheimer's disease risk prediction:
Diagram 1: Integrated Multi-Omics Workflow for Alzheimer's Disease Risk Prediction. This diagram illustrates the comprehensive approach combining multiple data types and analytical methods to improve AD risk prediction.
Key Signaling Pathways Identified
The multi-omics analysis revealed several key signaling pathways significantly associated with Alzheimer's disease risk:
Diagram 2: Key Signaling Pathways in Alzheimer's Disease Identified through Multi-Omics Analysis. This diagram shows the biological pathways and key molecular players associated with AD risk.
The Scientist's Toolkit: Essential Research Reagents
Multi-omics research requires specialized reagents and tools to generate and analyze data across molecular layers:
Table 3: Essential Research Reagents for Multi-Omics Studies
| Reagent/Tool Category | Specific Examples | Application in Multi-Omics |
|---|---|---|
| Nucleic Acid Extraction Kits | DNA/RNA purification kits | Isolate high-quality genetic material for genomic and transcriptomic analyses |
| PCR and qPCR Reagents | DNA polymerases, dNTPs, primers, master mixes | Amplify and quantify specific genetic regions for validation studies |
| Reverse Transcriptase Kits | cDNA synthesis kits | Convert RNA to cDNA for transcriptomic analyses |
| Next-Generation Sequencing Kits | Library preparation kits, sequencing reagents | Enable whole-genome, exome, and transcriptome sequencing |
| Protein Analysis Reagents | Mass spectrometry kits, antibodies for Western blot/ELISA | Quantify protein expression and post-translational modifications |
| Epigenetic Analysis Tools | Methylation-sensitive enzymes, chromatin immunoprecipitation kits | Characterize DNA modifications and chromatin states |
| Bioinformatics Software | PLINK, PrediXcan, pathway analysis tools | Process, integrate, and interpret multi-omics datasets |
Molecular biology techniques form the foundation of multi-omics research, with PCR, qPCR, and reverse transcription PCR being particularly crucial for genomics, epigenomics, and transcriptomics applications [92]. Next-generation sequencing technologies have become increasingly accessible and affordable, driving the widespread adoption of multi-omics approaches [92].
Discussion
Interpretation of Findings
This case study demonstrates that integrating multi-omics data significantly enhances both our understanding of AD biology and our ability to predict disease risk. The identification of 104 genomic, 319 transcriptomic, and 17 proteomic associations provides a comprehensive view of the molecular landscape of AD, revealing novel insights beyond what any single omics layer could uncover [86] [90].
The pathway enrichment findings highlight the importance of cholesterol metabolism, immune signaling, and myeloid differentiation pathways in AD pathogenesis, offering new avenues for therapeutic development [86] [90]. These findings align with emerging recognition of neuroinflammation and microglial activation as important contributors to amyloid-beta and tau pathology [87].
Advantages of Multi-Omics Integration
The significantly improved predictive performance of the integrative risk models (AUROC: 0.703) compared to traditional PGS approaches demonstrates the value of combining multiple molecular data types with advanced machine learning methods [86] [90]. This integration captures complementary biological information that reflects different aspects of disease pathophysiology, enabling more accurate risk stratification.
Random forest models particularly excelled at handling the high-dimensional, multi-modal data, effectively capturing non-linear relationships and interaction effects that may be missed by traditional linear models [86] [91]. This advantage highlights the importance of selecting appropriate computational methods for multi-omics data integration.
Implications for Precision Medicine
The findings from this case study contribute to the growing foundation for precision medicine approaches in Alzheimer's disease [87]. By identifying distinct molecular subtypes and their associated pathways, multi-omics profiling can enable targeted interventions for specific patient subgroups based on their individual molecular signatures.
The improved risk prediction models could potentially enable earlier identification of high-risk individuals during pre-symptomatic stages when interventions may be most effective [87]. This aligns with estimates that delaying AD onset by five years could reduce its occurrence by almost half [87].
This case study demonstrates that integrative multi-omics approaches significantly advance both biological understanding and risk prediction for Alzheimer's disease. By combining genomic, transcriptomic, and proteomic data within a unified analytical framework, researchers can identify novel molecular associations, elucidate key biological pathways, and develop more accurate predictive models than possible with single-omics approaches alone.
The random forest integrative risk model achieving an AUROC of 0.703 represents a substantial improvement over traditional polygenic score approaches, highlighting the value of incorporating functional omics data and advanced machine learning methods. The identification of enriched pathways in cholesterol metabolism, immune signaling, and myeloid differentiation provides new insights into AD pathogenesis and potential therapeutic targets.
As multi-omics technologies continue to become more accessible and computational methods more sophisticated, integrated approaches will play an increasingly important role in unraveling the complexity of Alzheimer's disease and other neurodegenerative disorders. These advances will ultimately contribute to the development of precision medicine strategies for early detection, prevention, and treatment of Alzheimer's disease, potentially reducing the substantial personal, societal, and economic burdens associated with this devastating condition.
The advent of high-throughput technologies has generated unprecedented volumes of biological data across multiple molecular layers, necessitating advanced computational approaches for integration and analysis. Multi-omics integration represents a paradigm shift from traditional single-omics approaches by simultaneously analyzing data from genomics, transcriptomics, epigenomics, proteomics, and metabolomics to provide a holistic view of biological systems and disease mechanisms [93] [23]. This comprehensive strategy enables researchers to uncover complex interactions and emergent properties that cannot be detected when analyzing omics layers in isolation, particularly in complex diseases such as cancer, metabolic disorders, and neurodegenerative conditions [94] [95].
The fundamental premise underlying multi-omics integration is that biological systems function through dynamic interactions across multiple molecular layers, with information flowing from DNA to RNA to proteins and metabolites [14]. While single-omics approaches have successfully identified numerous disease-associated molecular markers, they provide limited insights into the complex regulatory networks and mechanistic pathways that drive disease progression and treatment response [96] [97]. Multi-omics integration addresses this limitation by capturing the interplay between different biological layers, thereby enabling more accurate disease subtyping, biomarker discovery, and therapeutic target identification [26] [23].
The transition from single-omics to multi-omics analysis presents significant computational and methodological challenges, including data heterogeneity, batch effects, high dimensionality, and the need for specialized algorithms capable of integrating diverse data types [14] [96]. This technical guide provides a comprehensive comparison of model performance between multi-omics integration approaches and traditional single-omics methods, with a specific focus on experimental protocols, performance metrics, and practical implementation guidelines for disease mechanism research.
Methodological Frameworks for Multi-Omics Integration
Categories of Integration Approaches
Multi-omics integration methods can be broadly categorized into three distinct frameworks based on their underlying computational principles and integration strategies. Statistical-based approaches utilize mathematical frameworks to identify latent factors that explain variation across multiple omics datasets. The Multi-Omics Factor Analysis (MOFA+) algorithm represents a prominent example in this category, employing factor analysis to reduce dimensionality and capture shared variation across omics modalities [96]. This unsupervised method identifies latent factors that explain the covariance between different data types, enabling the discovery of integrated molecular patterns associated with disease phenotypes.
Deep learning-based approaches leverage neural network architectures to model complex non-linear relationships across omics layers. Methods such as Multi-Omics Graph Convolutional Networks (MoGCN) utilize autoencoders for dimensionality reduction and graph convolutional networks to model biological interactions [96]. These approaches excel at capturing high-order interactions but often face challenges in model interpretability. Other deep learning architectures including Convolutional Neural Networks (CNNs), Recurrent Neural Networks (RNNs), Deep Belief Networks (DBNs), and Autoencoders have been adapted for multi-omics integration, each with distinctive strengths in pattern recognition, sequential data processing, and data reconstruction [97].
Hybrid frameworks combine elements from multiple computational paradigms to balance predictive power with interpretability. The scMKL (Multiple Kernel Learning) method exemplifies this approach by integrating kernel methods with group Lasso regularization for single-cell multi-omics analysis [98]. This framework constructs separate kernels for different omics modalities and biological pathways, then combines them using a weighted approach that reflects their relative importance for the classification task. This design preserves biological interpretability while maintaining competitive predictive performance [98].
Experimental Design Considerations
Robust experimental design is crucial for meaningful multi-omics comparisons. The Quartet Project has established reference materials and frameworks for standardized multi-omics quality control, using immortalized cell lines from a family quartet (parents and monozygotic twin daughters) to provide built-in ground truth based on genetic relationships and central dogma principles [14]. This approach enables systematic evaluation of technical variability and integration performance across different platforms and laboratories.
Ratio-based profiling represents an important innovation in multi-omics experimental design, scaling absolute feature values of study samples relative to a concurrently measured common reference sample. This approach significantly improves reproducibility and comparability across batches, labs, and platforms compared to traditional absolute quantification methods [14]. The implementation of reference materials and ratio-based quantification addresses fundamental challenges in multi-omics data integration and enables more reliable cross-study comparisons.
Performance Comparison: Multi-Omics vs. Single-Omics Approaches
Quantitative Performance Metrics
Table 1: Comparative Performance of Multi-Omics vs. Single-Omics in Cancer Subtyping
| Analysis Type | Dataset | Method | Accuracy Metric | Performance Value | Key Advantages |
|---|---|---|---|---|---|
| Breast Cancer Subtyping | TCGA (960 samples) | MOFA+ (Multi) | F1 Score | 0.75 | Identified 121 relevant pathways |
| Breast Cancer Subtyping | TCGA (960 samples) | MOGCN (Multi) | F1 Score | <0.75 | Identified 100 relevant pathways |
| Breast Cancer Subtyping | TCGA (960 samples) | Single-omics | F1 Score | 0.65-0.70 | Limited pathway identification |
| Lung Adenocarcinoma | TCGA-LUAD | scMKL (Multi) | AUROC | 0.89-0.94 | Superior to single-omics |
| Lung Adenocarcinoma | TCGA-LUAD | RNA-only | AUROC | 0.82-0.87 | Lower discriminative power |
| Prostate Cancer | Multiple patients | scMKL (ATAC) | AUROC | 0.85-0.91 | Revealed subtype-specific mechanisms |
| Small Lymphatic Lymphoma | Patient samples | scMKL (Multi) | AUROC | 0.90-0.95 | Identified key regulatory pathways |
Multi-omics integration consistently demonstrates superior performance compared to single-omics approaches across multiple cancer types and analytical tasks. In breast cancer subtyping, the statistical-based MOFA+ approach achieved an F1 score of 0.75, significantly outperforming single-omics methods while identifying 121 biologically relevant pathways compared to 100 pathways identified by the deep learning-based MOGCN approach [96]. This performance advantage extends beyond mere classification accuracy to encompass biological insight generation, with multi-omics integration providing more comprehensive views of disease mechanisms.
The scMKL framework demonstrated exceptional performance across multiple cancer types, achieving AUROC values between 0.89-0.94 in lung adenocarcinoma classification using multi-omics data, compared to 0.82-0.87 using transcriptomics alone [98]. Similarly, in prostate cancer stratification, scMKL achieved AUROC values of 0.85-0.91 using only ATAC-seq data, successfully differentiating low-grade from high-grade tumors and revealing subtype-specific signaling mechanisms that were not detectable using single-omics approaches [98].
Biological Insight Generation
Table 2: Pathway and Network Analysis Capabilities
| Analysis Type | Method | Pathways Identified | Key Pathways Discovered | Functional Validation |
|---|---|---|---|---|
| Breast Cancer Subtyping | MOFA+ | 121 | Fc gamma R-mediated phagocytosis, SNARE pathway | In silico analysis |
| Breast Cancer Subtyping | MOGCN | 100 | Immune response pathways | In silico analysis |
| Colorectal Cancer | Multi-omics integration | 15+ | Omega-3 fatty acid metabolism, CD4+ T cell regulation | In vitro and in vivo validation |
| Lung Adenocarcinoma | scMKL | 20+ | Estrogen response, Epithelial-Mesenchymal Transition | Cross-dataset validation |
| Prostate Cancer | scMKL | 10+ | Androgen signaling, Cell proliferation networks | Spatial transcriptomics confirmation |
Beyond quantitative performance metrics, multi-omics integration significantly enhances biological insight generation compared to single-omics approaches. In colorectal cancer research, integrated analysis of genomic, epigenomic, transcriptomic, and metabolomic data revealed novel connections between omega-3 fatty acid metabolism, DNA methylation patterns, and CD4+ T cell regulation in cancer risk [95]. This multi-omics approach identified SLC6A19 as a potential inhibitory target, with functional validation demonstrating that SLC6A19 overexpression suppressed CRC cell proliferation, migration, and invasion in vitro and reduced tumor growth in xenograft models [95].
Network-based multi-omics analyses have successfully elucidated complex disease mechanisms that remain opaque in single-omics studies. In lung adenocarcinoma, integrated analysis of single-cell RNA sequencing and ATAC-seq data identified the MIF-CD74+CD44 signaling pathway as a key mediator of cellular communication between proliferating cell subpopulations, with spatial transcriptomics confirming the colocalization of these cell types within the tumor microenvironment [26]. These insights provide a more comprehensive understanding of tumor heterogeneity and potential therapeutic vulnerabilities.
Experimental Protocols for Multi-Omics Integration
Data Generation and Preprocessing
Sample Preparation and Quality Control: The foundation of robust multi-omics analysis begins with standardized sample preparation across all omics layers. The Quartet Project protocol recommends using reference materials from matched samples to control for technical variability [14]. For tissue samples, simultaneous extraction of DNA, RNA, protein, and metabolites ensures molecular compatibility. Quality assessment should include RNA integrity number (RIN) >8.0 for transcriptomics, DNA fragment size distribution for genomics, and protein concentration measurements for proteomics.
Data Processing Pipeline: Raw data processing requires specialized tools for each omics modality. For genomics and transcriptomics, adapter trimming, quality filtering, and alignment to reference genomes represent essential steps. For epigenomics data from ATAC-seq or methylation arrays, appropriate normalization and peak calling algorithms must be implemented. Proteomics and metabolomics data from mass spectrometry require peak detection, alignment, and compound identification. Critical preprocessing steps include:
- Batch Effect Correction: Implement ComBat (for transcriptomics and microbiomics) or Harman (for methylation data) to remove technical artifacts [96]
- Feature Filtering: Remove features with zero expression in >50% of samples, followed by variance-based filtering
- Normalization: Apply omics-specific normalization methods (e.g., TPM for RNA-seq, quantile normalization for methylation arrays)
Implementation Protocols for Integration Methods
MOFA+ Implementation Protocol:
- Data Input: Prepare three omics matrices (transcriptomics, epigenomics, microbiomics) with matched samples
- Model Training: Run MOFA+ with 400,000 iterations and convergence threshold of 0.001
- Factor Selection: Retain latent factors explaining >5% variance in at least one data type
- Feature Selection: Extract top 100 features per omics layer based on absolute loadings from the latent factor with highest shared variance [96]
MOGCN Implementation Protocol:
- Autoencoder Processing: Train separate encoder-decoder pathways for each omics type with hidden layers of 100 neurons
- Feature Importance Calculation: Compute importance scores by multiplying absolute encoder weights by feature standard deviation
- Feature Selection: Select top 100 features per omics layer based on importance scores [96]
- Graph Construction: Build biological interaction networks using prior knowledge databases
scMKL Implementation Protocol:
- Kernel Construction: Build separate kernels for RNA (using Hallmark gene sets) and ATAC (using transcription factor binding sites)
- Model Training: Implement 80/20 train-test split with 100 repetitions and cross-validation for regularization parameter λ
- Pathway Weight Calculation: Compute interpretable weights for each feature group using group Lasso formulation [98]
- Validation: Perform transfer learning across independent datasets to assess generalizability
Visualization of Multi-Omics Integration Workflows
Comparative Analysis Workflow
Multi-Omics Data Flow Architecture
Research Reagent Solutions for Multi-Omics Studies
Table 3: Essential Research Reagents and Resources
| Reagent/Resource | Type | Application | Key Features | Reference |
|---|---|---|---|---|
| Quartet Reference Materials | Reference Standards | Multi-omics QC | Matched DNA, RNA, protein, metabolites from family quartet | [14] |
| 10x Multiome Kit | Commercial Kit | Single-cell Multi-omics | Simultaneous RNA + ATAC profiling from single cells | [98] |
| TCGA Pan-Cancer Atlas | Data Resource | Cancer Multi-omics | Standardized datasets across 33 cancer types | [96] |
| JASPAR Database | Bioinformatics Resource | TF Binding Sites | Curated transcription factor binding profiles | [98] |
| MSigDB Hallmark Sets | Bioinformatics Resource | Pathway Analysis | 50 well-defined biological states and processes | [98] |
| DISCO Database | Data Resource | Single-cell Omics | >100 million cells for federated analysis | [94] |
| Cistrome DB | Bioinformatics Resource | Epigenomics | Chromatin accessibility profiles across cell types | [98] |
Discussion and Future Perspectives
The comprehensive performance comparison between multi-omics integration approaches and traditional single-omics methods demonstrates clear advantages in predictive accuracy, biological insight generation, and clinical applicability. The consistent superiority of multi-omics approaches across diverse disease contexts highlights their transformative potential in biomedical research and precision medicine. However, important challenges remain in standardization, interpretation, and implementation that warrant consideration.
Technical and Computational Considerations: Despite their superior performance, multi-omics integration methods face significant computational challenges, particularly in processing high-dimensional datasets and managing batch effects across platforms [14] [96]. The development of ratio-based profiling using common reference materials represents an important innovation addressing these challenges, enabling more reproducible and comparable results across laboratories and platforms [14]. Future methodological developments should focus on scalable algorithms that can efficiently process the increasing volume of multi-omics data while maintaining biological interpretability.
Biological Validation and Clinical Translation: The ultimate validation of multi-omics findings requires functional confirmation through experimental assays. The colorectal cancer study exemplifying this approach employed a comprehensive validation pipeline including CCK-8 assays for proliferation, wound healing and Transwell assays for migration and invasion, and in vivo xenograft models for tumor growth assessment [95]. Such rigorous validation is essential for translating computational findings into clinically actionable insights. Future research should prioritize integrated workflows that combine computational prediction with experimental validation to ensure biological relevance and clinical applicability.
Emerging Trends and Methodological Innovations: The field of multi-omics integration is rapidly evolving, with several emerging trends poised to address current limitations. Foundation models pretrained on large-scale single-cell datasets, such as scGPT and scPlantFormer, demonstrate exceptional capabilities in cross-species cell annotation and in silico perturbation modeling [94]. Multimodal integration approaches that align histology images with spatial transcriptomics data are enhancing our ability to map molecular features to tissue morphology [94]. Additionally, the development of federated computational platforms enables decentralized analysis of multi-omics data while addressing privacy concerns and facilitating global collaboration [94].
In conclusion, multi-omics integration approaches consistently outperform traditional single-omics methods across multiple performance metrics and biological applications. The continued refinement of computational methods, standardization of experimental protocols, and validation of biological insights will further establish multi-omics integration as an indispensable approach for understanding complex disease mechanisms and advancing precision medicine.
In the landscape of modern drug discovery, integrative omics has emerged as a powerful approach for understanding complex disease mechanisms by synthesizing data across genomic, transcriptomic, proteomic, and metabolomic layers [99]. This multi-omics framework enables the identification of novel therapeutic targets and biomarkers by capturing the complex molecular interactions driving disease phenotypes [6]. However, the proliferation of computational predictions generated through machine learning and network-based analysis necessitates rigorous experimental validation to translate these hypotheses into therapeutic realities [100]. This guide details the methodologies and frameworks for bridging computational predictions with functional assays, ensuring that insights derived from integrative omics achieve biological and clinical relevance.
The transition from in silico prediction to validated biological function represents a critical bottleneck in the research pipeline. While computational approaches can rapidly identify potential targets from vast omics datasets, their true value is only realized through empirical confirmation in biological systems [100]. This validation bridge is particularly essential in integrative omics, where the complexity of multi-layer data interactions demands careful experimental design to decipher causal relationships from correlative patterns [6].
Computational Foundations: From Data Integration to Predictable Hypotheses
Multi-Omics Data Integration Strategies
The initial phase of the discovery pipeline involves the systematic integration of diverse molecular data types. Network-based integration methods have shown particular promise for synthesizing multi-omics datasets by leveraging the inherent connectivity of biological systems [6]. These approaches can be categorized into four primary computational frameworks:
- Network Propagation/Diffusion: Utilizes known interaction networks to prioritize genes or proteins based on their proximity to established disease-associated molecules.
- Similarity-Based Approaches: Integrates omics data by measuring molecular similarities across different data layers.
- Graph Neural Networks: Applies deep learning to graph-structured data, capturing complex non-linear relationships within and between omics layers.
- Network Inference Models: Reconstructs regulatory networks from high-dimensional omics data to identify key drivers of disease phenotypes [6].
The resulting integrated analysis enables researchers to move beyond correlative associations toward mechanistic hypotheses about disease drivers and potential therapeutic targets [99].
Hypothesis Generation for Experimental Validation
The output of these integrative computational analyses typically generates several classes of testable hypotheses suitable for experimental validation:
- Candidate Biomarker Verification: Molecules identified as significantly associated with disease states across multiple omics layers.
- Pathway Validation: Putative disease-relevant pathways showing coordinated alterations at genomic, transcriptomic, and/or proteomic levels.
- Drug Target Confirmation: Molecular targets with network properties suggesting critical roles in disease pathogenesis and potential druggability.
- Drug Repurposing Candidates: Existing compounds predicted to act on newly identified disease-relevant targets or pathways [6].
The Validation Bridge: Functional Assay Methodologies
The following section details core experimental methodologies for validating computational predictions derived from integrative omics analyses.
Cell-Based Functional Assays
Cell-based assays provide a critical platform for initial functional validation in a biologically relevant context.
Gene Expression Manipulation and Transcriptomic Validation
Protocol: CRISPR-Cas9 Mediated Gene Knockout for Target Validation
- sgRNA Design: Design sequence-specific guide RNAs (sgRNAs) targeting computationally identified genes using established tools (e.g., CRISPick, CHOPCHOP).
- Vector Construction: Clone validated sgRNAs into Cas9-expression plasmids (e.g., lentiCRISPR v2).
- Cell Transduction: Transduce relevant cell models (primary cells or cell lines) with lentiviral particles containing the sgRNA-Cas9 construct.
- Selection and Expansion: Select transduced cells with appropriate antibiotics (e.g., puromycin, 2-5 μg/mL) for 5-7 days.
- Validation of Knockout:
- Genomic DNA Extraction: Harvest cell pellets and extract genomic DNA using commercial kits.
- T7 Endonuclease I Assay: PCR-amplify target region, heteroduplex formation, and T7EI digestion to detect indel mutations.
- Western Blot Analysis: Confirm protein-level knockdown.
- Phenotypic Assessment: Evaluate functional consequences using assays relevant to the disease context (e.g., proliferation, apoptosis, migration) [16].
Protein Function and Interaction Assays
Protocol: Co-Immunoprecipitation (Co-IP) for Protein Complex Validation
- Cell Lysis: Lyse cells in appropriate non-denaturing lysis buffer (e.g., RIPA buffer with protease inhibitors).
- Antibody Incubation: Incubate cell lysate with antibody targeting the predicted protein of interest (2-5 μg antibody per 500 μg total protein, 2 hours to overnight at 4°C).
- Bead Capture: Add protein A/G agarose beads and incubate for 2-4 hours at 4°C with gentle agitation.
- Washing: Pellet beads and wash 3-5 times with lysis buffer.
- Elution: Elute bound complexes with 2X Laemmli buffer by heating at 95°C for 5-10 minutes.
- Analysis:
- Western Blotting: Resolve eluates by SDS-PAGE, transfer to membrane, and probe for predicted interacting partners.
- Mass Spectrometry: For unbiased identification of novel interacting partners, subject eluates to liquid chromatography-mass spectrometry (LC-MS) [16].
High-Content Screening and Phenotypic Assays
Advanced assay technologies provide more physiologically relevant models that enhance translational potential [100].
Protocol: High-Content Screening for Phenotypic Validation
- Cell Model Selection: Utilize disease-relevant cell models, including primary cells, patient-derived organoids, or 3D culture systems.
- Compound Treatment: Treat cells with predicted therapeutic compounds across a concentration range (typically 8-12 points, 10 nM-100 μM).
- Staining and Fixation: At assay endpoint, fix cells and stain with fluorescent dyes targeting relevant cellular features:
- Nuclei: Hoechst 33342 (1-5 μg/mL)
- Cytoskeleton: Phalloidin conjugates (100-200 nM)
- Viability markers: Propidium iodide (1-5 μg/mL) or Annexin V conjugates
- Automated Imaging: Acquire images using high-content imaging systems (e.g., ImageXpress, Operetta) across multiple fields and channels.
- Image Analysis: Quantify phenotypic features using automated algorithms (e.g., CellProfiler, IN Carta) to measure parameters such as cell count, morphology, and marker intensity [100].
Multi-Omics Validation in Clinical Specimens
For direct translation, validation should incorporate clinical samples when possible.
Protocol: Integrated Multi-Omics Analysis of Clinical Samples
This protocol, adapted from a recent colorectal cancer study, demonstrates how to validate computational predictions across multiple molecular layers [101].
Sample Preparation:
- Obtain matched tumor and normal adjacent tissues from clinically characterized cohorts.
- Snap-freeze tissues in liquid nitrogen and store at -80°C.
- Divide samples for parallel multi-omics analyses.
Multi-Omics Data Generation:
- Whole Exome Sequencing (WES):
- Library preparation using SureSelect Human All Exon V8 kit.
- Sequence on Illumina HiSeq 2500 (minimum 100x coverage).
- Align to reference genome (GRCh38) using Burrows-Wheeler Aligner.
- Variant calling with VarScan (minimum 3x coverage, 8% allele frequency).
- RNA Sequencing:
- Library preparation with SureSelectXT RNA Direct Library Kit.
- Sequence on Illumina HiSeq 2500.
- Alignment and quantification with HISAT2 and StringTie.
- Differential expression analysis with edgeR (FDR < 0.05, |log2FC| > 2).
- DNA Methylation Analysis:
- Library preparation with SureSelectXT Methyl-Seq Kit.
- Bisulfite conversion, amplification, and capture.
- Sequencing on Illumina HiSeq 2500.
- Differential methylation analysis with DMRichR.
- Microbiome Profiling:
- 16S rRNA sequencing targeting V3-V4 hypervariable region.
- Analyze with QIIME2 platform using SILVA database.
- Calculate α-diversity and β-diversity metrics [101].
- Whole Exome Sequencing (WES):
Integrative Bioinformatics:
- Perform cross-omics correlation analysis to identify consistent patterns.
- Conduct pathway enrichment analysis on convergent findings.
- Validate computational predictions against empirical multi-omics data.
Experimental Workflows and Signaling Pathways
The following diagrams visualize key experimental workflows and signaling relationships described in this guide, created using Graphviz DOT language with specified color palette and contrast requirements.
Multi-Omics Validation Workflow
Drug Target Validation Pathway
Research Reagent Solutions
The following table details essential research reagents and their applications in experimental validation protocols.
| Reagent/Category | Specific Examples | Function in Validation |
|---|---|---|
| Genome Editing Tools | CRISPR-Cas9 systems (lentiCRISPR v2), sgRNAs | Targeted gene knockout for functional validation of computationally identified targets [16]. |
| Antibodies for Protein Analysis | Target-specific primary antibodies, Protein A/G beads | Detection and immunoprecipitation of proteins of interest for confirming expression and interactions [16]. |
| Cell Culture Models | Primary cells, patient-derived organoids, 3D culture systems | Physiologically relevant models for phenotypic screening and functional validation [100]. |
| Sequencing Kits | SureSelect kits (WES, RNA, Methyl-Seq), Illumina library prep kits | Generation of multi-omics data (genomics, transcriptomics, epigenomics) from clinical samples [101]. |
| Microbiome Analysis | 16S rRNA sequencing kits (V3-V4 region), QIIME2 platform | Profiling microbial communities and identifying metagenomic biomarkers in disease contexts [101]. |
| High-Content Screening Reagents | Fluorescent dyes (Hoechst, Phalloidin, viability markers), assay kits | Multiparameter phenotypic analysis for compound screening and mechanistic studies [100]. |
| Proteomics Supplies | Liquid chromatography-mass spectrometry (LC-MS) systems, SILAC kits | Identification and quantification of proteins and post-translational modifications [16]. |
Case Studies: Successful Integration of Prediction and Validation
Baricitinib Repurposing for COVID-19
BenevolentAI's machine learning algorithm identified baricitinib, a JAK inhibitor, as a potential COVID-19 treatment by integrating multi-omics data on viral entry mechanisms and host immune responses. This computational prediction was subsequently validated through functional assays demonstrating the compound's ability to reduce viral infectivity in cell models and ultimately in clinical trials, leading to emergency use authorization [100].
Halicin Antibiotic Discovery
A deep learning model trained on molecular structures with known antibacterial properties identified halicin as a potential broad-spectrum antibiotic. Experimental validation confirmed its efficacy against multidrug-resistant pathogens in both in vitro and in vivo models, demonstrating the power of combining AI-driven prediction with rigorous functional assessment [100].
Multi-Omics Validation in Colorectal Cancer
A recent multi-omics study of colorectal cancer patients integrated somatic mutation, transcriptomic, DNA methylation, and microbiome data to identify mechanisms of lymph node metastasis. The study validated S100A8 as a significantly upregulated proinflammatory gene in metastatic cases and identified specific microbial biomarkers associated with disease progression, demonstrating the clinical translation of integrated omics analysis [101].
The synergy between computational predictions derived from integrative omics and functional validation through rigorous experimentation represents the cornerstone of modern mechanistic disease research and therapeutic development. As multi-omics technologies continue to evolve, generating increasingly complex and high-dimensional datasets, the imperative for robust, well-designed experimental validation frameworks only grows stronger. By systematically applying the principles and protocols outlined in this guide—spanning cellular assays, multi-omics profiling in clinical samples, and advanced phenotypic screening—researchers can effectively bridge the gap between computational hypothesis and biological insight, ultimately accelerating the development of novel therapeutics for complex diseases.
Artificial intelligence (AI) and machine learning (ML) are fundamentally reshaping the framework of clinical research and therapeutic development. Moving from speculative potential to working technologies, AI is now demonstrating quantifiable improvements in efficiency, accuracy, and personalization across the clinical spectrum [102]. This technical guide details how integrative omics, combined with sophisticated AI methodologies, is driving advances in patient stratification, drug response prediction, and clinical trial design, thereby enabling a more precise and mechanistic understanding of human disease [26].
Quantitative Impact of AI in Clinical Research
The integration of AI into clinical development is yielding substantial, measurable benefits. The following tables summarize key performance data across the clinical trial lifecycle and specific AI applications in clinical pharmacology.
Table 1: Impact of AI on the Clinical Trial Lifecycle
| Trial Lifecycle Stage | AI Application | Quantified Impact |
|---|---|---|
| Patient Recruitment | AI-powered recruitment tools | Improved enrollment rates by 65% [103] |
| Trial Outcomes | Predictive analytics models | Achieved 85% accuracy in forecasting trial outcomes [103] |
| Trial Efficiency | End-to-end AI integration | Accelerated trial timelines by 30–50%; reduced costs by up to 40% [103] |
| Safety Monitoring | Digital biomarkers for adverse event detection | Enabled continuous monitoring with 90% sensitivity [103] |
Table 2: AI Applications in Clinical Pharmacology and Translational Science (Selected Examples) [102]
| AI Application | Objective | Key Highlights |
|---|---|---|
| Predicting Cisplatin-Induced Acute Kidney Injury | Predict AKI risk using EMR data | Interpretable ML improved clinical trust for EMR-based toxicity screening [102] |
| MoLPre: Metastasis Prediction in Lung Cancer | Develop an ML model for metastasis prediction | Model showed high accuracy using imaging and clinical features for early cancer progression prediction [102] |
| Agents for Change: AI Workflows | Discuss agentic AI workflows in pharmacology | Envisions AI agents automating modeling and simulation (M&S) pipelines [102] |
| Augmented Intelligence in Precision Medicine | Integrate AI/QSP in precision medicine decisions | Case studies demonstrated effectiveness in personalized treatment planning and dose tailoring [102] |
Experimental Protocols for Integrative Omics and AI
The following section outlines detailed methodologies for key experiments that leverage multi-omics data and machine learning to derive clinical insights.
Protocol: Constructing a Proliferating Cell Risk Score for Prognosis
This protocol is based on an integrative analysis of lung adenocarcinoma (LUAD) which combined single-cell and bulk omics data to construct a prognostic signature [26].
1. Single-Cell Data Acquisition and Pre-processing:
- Input: Collect single-cell RNA sequencing (scRNA-seq) data from a cohort of human tissue samples (e.g., 93 samples including healthy lung, COPD, IPF, and LUAD) [26].
- Quality Control: Perform rigorous quality control and remove doublets.
- Batch Correction: Apply a batch effect correction algorithm, such as Harmony, to mitigate technical variation across samples [26].
- Cell Clustering and Annotation: Use unsupervised clustering on corrected data, followed by dimensionality reduction (PCA, UMAP). Annotate cell clusters into specific types (T cells, macrophages, proliferating cells, etc.) using canonical marker genes [26].
2. Identification of Clinically Relevant Proliferating Cells:
- Phenotype Linkage: Apply the Scissor algorithm to the scRNA-seq data to identify cell subpopulations (e.g., proliferating cell subtypes C2MMP9 and C3KRT8) significantly associated with patient clinical phenotypes (e.g., poor survival) [26].
- Gene Extraction: Extract the set of "Scissor+ proliferating cell genes" (e.g., 663 genes) that define the phenotype-associated subpopulations [26].
3. Machine Learning Model Development and Validation:
- Algorithm Integration: Develop an integrative machine learning program incorporating 111 algorithms to construct a robust risk score (e.g., Scissor+ Proliferating Cell Risk Score, SPRS) from the Scissor+ gene set [26].
- Performance Benchmarking: Benchmark the newly developed model (SPRS) against existing models (e.g., 30 previously published models) to demonstrate superior performance in predicting prognosis and clinical outcomes [26].
- Experimental Validation: Verify the expression and role of pivotal genes identified in the model using experimental techniques. Use NicheNet analysis to predict upstream ligand-receptor interactions (e.g., IL1B ligands) that may drive the aggressive cell phenotype [26].
4. Clinical Application and Therapeutic Assessment:
- Stratification: Categorize patients into high- and low-risk groups based on the SPRS.
- Correlation with TIME: Analyze differential biological functions and immune cell infiltration patterns in the tumor immune microenvironment (TIME) between the risk groups.
- Treatment Sensitivity Prediction: Evaluate the correlation between the SPRS and response to immunotherapy, chemotherapy, and targeted therapeutic agents [26].
Protocol: Explainable AI for Oncology Drug Resistance Mechanisms
This protocol outlines a methodology for applying explainable AI to multi-omic data to deconstruct mechanisms of drug resistance [104].
1. Multi-Omic Data Integration:
- Data Layers: Collect genomic, transcriptomic, and proteomic data from a diverse panel of cancer cell lines treated with a targeted therapy (e.g., Axitinib, a VEGF inhibitor) [104].
- Drug Response Data: Gather empirical data on the drug's responsiveness across the cell lines.
2. Predictive Model Training and Interpretation:
- Model Training: Train a machine learning model to predict drug response based on the integrated multi-omic features.
- Explainability Analysis: Apply Local Interpretable Model-agnostic Explanations (LIME) to the trained model. For each prediction, LIME creates a local, interpretable model to identify the specific molecular features (e.g., genes, proteins, pathways) that were most influential [104].
3. Resistance Profile Delineation:
- Pattern Identification: Analyze the LIME outputs across responsive and resistant cell lines to identify distinct resistance profiles.
- Pathway Analysis: Conduct functional enrichment analysis on the top features identified by LIME. In the case of Axitinib, this revealed two key resistance profiles:
- Hematological Cancers: Resistance correlated with metabolic rewiring in purine and amino-acid pathways.
- Solid Tumors: Resistance was tied to hypoxia-driven remodeling, immune-evasion signatures, and chronic stress-response pathways [104].
Workflow and Pathway Visualizations
The following diagrams, generated with Graphviz, illustrate the core logical relationships and experimental workflows described in this guide.
AI-Driven Clinical Impact Workflow
Integrative Multi-Omics Analysis Protocol
Signaling in Proliferating Cell Subpopulations
The Scientist's Toolkit: Essential Research Reagents and Solutions
The following table catalogues key computational tools, algorithms, and datasets essential for conducting research in integrative omics and AI-driven clinical science.
Table 3: Key Research Reagents and Computational Solutions
| Tool / Solution | Type | Primary Function |
|---|---|---|
| Scissor Algorithm | Algorithm | Links cells in scRNA-seq data to external clinical phenotypes (e.g., survival) to identify clinically relevant subpopulations [26]. |
| Harmony | Algorithm | Integrates multiple single-cell datasets to remove technical batch effects, enabling joint analysis [26]. |
| LIME (Local Interpretable Model-agnostic Explanations) | Explainable AI Framework | Explains predictions of any complex machine learning model by highlighting the most influential input features for a specific instance [104]. |
| CellChat | Software Tool | Infers and analyzes intercellular communication networks from single-cell transcriptomics data [26]. |
| SCTOUR | Algorithm | Constructs developmental trajectories and pseudotemporal ordering of cells from single-cell data [26]. |
| NicheNet | Algorithm | Predicts ligand-receptor interactions between cell types and models how these interactions influence gene expression in target cells [26]. |
| TCGA-LUAD (The Cancer Genome Atlas) | Dataset | A publicly available cohort containing genomic, transcriptomic, and clinical data for lung adenocarcinoma patients, used for model training and validation [26]. |
| MIMIC (Medical Information Mart for Intensive Care) | Dataset | A large, single-center database comprising de-identified health data associated with ICU patients, used for developing clinical predictive models [104]. |
Conclusion
Integrative omics represents a paradigm shift in biomedical research, moving beyond descriptive cataloging to provide mechanistic, systems-level understanding of disease. By effectively combining diverse molecular data, this approach has proven powerful in uncovering novel disease subtypes, identifying robust biomarkers, and revealing actionable therapeutic targets, as evidenced by successes in oncology and neurodegenerative disease. The future of the field hinges on overcoming persistent challenges in data standardization, model interpretability, and the seamless translation of computational findings into clinical applications. The continued evolution of AI-driven foundation models and federated computational ecosystems will be crucial. Ultimately, the systematic application of integrative omics promises to deepen our fundamental knowledge of biology and firmly establish a new era of data-driven, personalized precision medicine.
References
- 1. Single-cell sequencing to multi-omics - Biomarker Research [https://biomarkerres.biomedcentral.com/articles/10.1186/s40364-024-00643-4]
- 2. Advances in single-cell omics and multiomics for high- ... [https://www.nature.com/articles/s12276-024-01186-2]
- 3. Challenges in the Integration of Omics and Non-Omics Data [https://pmc.ncbi.nlm.nih.gov/articles/PMC6471713/]
- 4. Integrative Methods and Practical Challenges for Single-cell ... [https://pmc.ncbi.nlm.nih.gov/articles/PMC7442857/]
- 5. Advancing drug discovery through multiomics [https://www.ddw-online.com/advancing-drug-discovery-through-multiomics-37448-202510/]
- 6. Network-based multi-omics integrative analysis methods in ... [https://biodatamining.biomedcentral.com/articles/10.1186/s13040-025-00442-z]
- 7. The Future of Drug Discovery: Integrating Phenotypic Data ... [https://ardigen.com/the-future-of-drug-discovery-integrating-phenotypic-data-with-omics-and-ai/]
- 8. Multi-omics single-cell data integration and regulatory ... [https://www.nature.com/articles/s41587-022-01284-4]
- 9. 'Omics' Sciences: Genomics, Proteomics, and Metabolomics [https://www.isaaa.org/resources/publications/pocketk/15/default.asp]
- 10. Genome, transcriptome and proteome: the rise of omics data ... [https://pmc.ncbi.nlm.nih.gov/articles/PMC6018996/]
- 11. Applications of multi‐omics analysis in human diseases - PMC [https://pmc.ncbi.nlm.nih.gov/articles/PMC10390758/]
- 12. A guide to multi-omics data collection and integration for ... [https://pmc.ncbi.nlm.nih.gov/articles/PMC9747357/]
- 13. Advances and Trends in Omics Technology Development - PMC [https://pmc.ncbi.nlm.nih.gov/articles/PMC9289742/]
- 14. Multi-omics data integration using ratio-based quantitative ... [https://www.nature.com/articles/s41587-023-01934-1]
- 15. Multi-Omics for Health and Disease (MOHD) [https://www.genome.gov/research-funding/Funded-Programs-Projects/Multi-Omics-for-Health-and-Disease]
- 16. Integrative omics – An arsenal for drug discovery - PMC [https://pmc.ncbi.nlm.nih.gov/articles/PMC9012413/]
- 17. Strategies for Comprehensive Multi-Omics Integrative Data ... [https://pmc.ncbi.nlm.nih.gov/articles/PMC11592251/]
- 18. Multi-omics Data Integration, Interpretation, and Its Application [https://pmc.ncbi.nlm.nih.gov/articles/PMC7003173/]
- 19. Algorithms and tools for data-driven omics integration to ... [https://translational-medicine.biomedcentral.com/articles/10.1186/s12967-025-06446-x]
- 20. A Guide to Multi-omics Integration Strategies [https://frontlinegenomics.com/a-guide-to-multi-omics-integration-strategies/]
- 21. A Unique Color-Coded Visualization System with Multimodal ... [https://pmc.ncbi.nlm.nih.gov/articles/PMC10204620/]
- 22. Ten simple rules to colorize biological data visualization - PMC [https://pmc.ncbi.nlm.nih.gov/articles/PMC7561171/]
- 23. Navigating Cancer Complexity: Integrative Multi-Omics ... [https://pmc.ncbi.nlm.nih.gov/articles/PMC12553891/]
- 24. Organelles – understanding noise and heterogeneity in cell ... [https://pmc.ncbi.nlm.nih.gov/articles/PMC5358330/]
- 25. Integrative omics approaches provide biological and clinical ... [https://pmc.ncbi.nlm.nih.gov/articles/PMC6934214/]
- 26. Integrative multi-omics and machine learning reveal critical ... [https://www.nature.com/articles/s41698-025-01027-z]
- 27. Adaptive multi-omics integration framework for breast ... [https://www.nature.com/articles/s41598-025-22202-z]
- 28. Computational strategies for single-cell multi-omics ... [https://pmc.ncbi.nlm.nih.gov/articles/PMC8114078/]
- 29. Integration strategies of multi-omics data for machine ... [https://www.sciencedirect.com/science/article/pii/S2001037021002683]
- 30. Vitessce: integrative visualization of multimodal and ... [https://www.nature.com/articles/s41592-024-02436-x]
- 31. Integrative Omics for Insights into Human Disease ... [https://www.frontiersin.org/research-topics/71658/integrative-omics-for-insights-into-human-disease-mechanisms-and-therapeutic-potentialsundefined]
- 32. AI trends in 2025: Graph Neural Networks [https://assemblyai.com/blog/ai-trends-graph-neural-networks]
- 33. An end-to-end attention-based approach for learning on ... [https://www.nature.com/articles/s41467-025-60252-z]
- 34. Transformer graph variational autoencoder for generative ... [https://www.sciencedirect.com/science/article/pii/S0006349525000359]
- 35. Transformative Role of Artificial Intelligence in Drug ... [https://pmc.ncbi.nlm.nih.gov/articles/PMC12406033/]
- 36. AI and machine learning: Revolutionising drug discovery ... [https://www.roche.com/stories/ai-revolutionising-drug-discovery-and-transforming-patient-care]
- 37. Artificial Intelligence for Drug Development [https://www.fda.gov/about-fda/center-drug-evaluation-and-research-cder/artificial-intelligence-drug-development]
- 38. Transformative advances in single-cell omics - PubMed Central [https://pmc.ncbi.nlm.nih.gov/articles/PMC12560279/]
- 39. scGPT: toward building a foundation model for single-cell ... [https://www.nature.com/articles/s41592-024-02201-0]
- 40. Introduction — scGPT 0.2.1 documentation [https://scgpt.readthedocs.io/en/latest/introduction.html]
- 41. scGPT | v1.0 - Virtual Cells Platform - Chan Zuckerberg Initiative [https://virtualcellmodels.cziscience.com/model/scgpt]
- 42. scGPT Quickstart [https://virtualcellmodels.cziscience.com/quickstart/scgpt-quickstart]
- 43. Benchmarking strategies for cross-species integration of ... [https://www.nature.com/articles/s41467-023-41855-w]
- 44. STRING: functional protein association networks [https://string-db.org/]
- 45. NetworkAnalyst [https://www.networkanalyst.ca/]
- 46. How to build accessible graph visualization tools [https://cambridge-intelligence.com/build-accessible-data-visualization-apps-with-keylines/]
- 47. Visualization of protein interaction networks: problems and ... [https://bmcbioinformatics.biomedcentral.com/articles/10.1186/1471-2105-14-S1-S1]
- 48. Advances in Molecular and Translational Medicine [https://pmc.ncbi.nlm.nih.gov/articles/PMC12524422/]
- 49. Editorial: The Application of Multi-omics Analysis in ... [https://www.frontiersin.org/journals/medicine/articles/10.3389/fmed.2025.1744814/full]
- 50. AI-driven multi-omics integration in precision oncology [https://pmc.ncbi.nlm.nih.gov/articles/PMC12634751/]
- 51. Multi-omics strategies for biomarker discovery and ... [https://link.springer.com/article/10.1186/s43556-025-00340-0]
- 52. Assessing and mitigating batch effects in large-scale omics ... [https://genomebiology.biomedcentral.com/articles/10.1186/s13059-024-03401-9]
- 53. Correcting batch effects in large-scale multiomics studies ... [https://pmc.ncbi.nlm.nih.gov/articles/PMC10483871/]
- 54. An order-preserving batch-effect correction method based ... [https://pmc.ncbi.nlm.nih.gov/articles/PMC12207412/]
- 55. Batch effect correction and normalization of scRNA-Seq data [https://www.nygen.io/resources/blog/batch-effect-normalization-techniques-scrna-seq]
- 56. Workflow for Evaluating Normalization Tools for Omics ... [https://pmc.ncbi.nlm.nih.gov/articles/PMC10919320/]
- 57. Statistical analysis of high-dimensional biomedical data [https://bmcmedicine.biomedcentral.com/articles/10.1186/s12916-023-02858-y]
- 58. Lifting the curse from high-dimensional data: automated ... [https://pmc.ncbi.nlm.nih.gov/articles/PMC12121483/]
- 59. Integrating Multi-Omics for Precision Medicine: 2025 Guide [https://lifebit.ai/blog/integrating-multi-modal-genomic-and-multi-omics-data-for-precision-medicine/]
- 60. Benchmarking joint multi-omics dimensionality reduction ... [https://www.nature.com/articles/s41467-020-20430-7]
- 61. Dimension reduction techniques for the integrative analysis of ... [https://pmc.ncbi.nlm.nih.gov/articles/PMC4945831/]
- 62. Machine learning and multi-omics integration [https://translational-medicine.biomedcentral.com/articles/10.1186/s12967-025-06425-2]
- 63. Editorial: Multi-omics approaches in the study of human ... [https://www.frontiersin.org/journals/bioinformatics/articles/10.3389/fbinf.2024.1546680/full]
- 64. Missing data in multi-omics integration: Recent advances ... [https://www.frontiersin.org/journals/artificial-intelligence/articles/10.3389/frai.2023.1098308/full]
- 65. Multimodal Integration in Health Care - PubMed Central - NIH [https://pmc.ncbi.nlm.nih.gov/articles/PMC12370271/]
- 66. Deep fusion of incomplete multi-omic data for molecular ... [https://pmc.ncbi.nlm.nih.gov/articles/PMC12361453/]
- 67. What are the key techniques in multimodal AI data ... [https://milvus.io/ai-quick-reference/what-are-the-key-techniques-in-multimodal-ai-data-integration]
- 68. Multi-Omics: Challenges and Solutions [https://bigomics.ch/blog/key-challenges-in-multi-omics-data-integration/]
- 69. Leveraging complementary multi-omics data integration ... [https://pmc.ncbi.nlm.nih.gov/articles/PMC11949029/]
- 70. Comparative analysis of integrative classification methods ... [https://pmc.ncbi.nlm.nih.gov/articles/PMC11234228/]
- 71. Integrative omics for health and disease - PMC [https://pmc.ncbi.nlm.nih.gov/articles/PMC5990367/]
- 72. Integrative multi-omics analysis to gain new insights into ... [https://www.nature.com/articles/s41598-024-79904-z]
- 73. Reproducible Workflows for Compound AI: Reliable and ... [https://www.union.ai/blog-post/reproducible-workflows-for-compound-ai-reliable-and-scalable-ai-development]
- 74. How to Build a Scalable Data Stack for AI Innovation in 2025 [https://www.shakudo.io/blog/how-to-build-a-scalable-data-stack-for-ai-innovation]
- 75. A Developer's Guide to Building Scalable AI: Workflows vs ... [https://towardsdatascience.com/a-developers-guide-to-building-scalable-ai-workflows-vs-agents/]
- 76. Powerful New Software Platform Could Reshape ... [https://www.mountsinai.org/about/newsroom/2025/powerful-new-software-platform-could-reshape-biomedical-research-by-making-data-analysis-more-accessible]
- 77. Introduction to Workflows in the Cloud 2025 [https://mdibl.org/course/workflows-in-the-cloud-2025/]
- 78. Integration of multi-omics profiling reveals an epigenetic ... [https://pubmed.ncbi.nlm.nih.gov/40046740/]
- 79. Multi‑omics analysis identifies different molecular subtypes ... [https://molecular-cancer.biomedcentral.com/articles/10.1186/s12943-025-02333-7]
- 80. Integration of multi-omics profiling reveals an epigenetic ... [https://www.frontiersin.org/journals/pharmacology/articles/10.3389/fphar.2025.1540477/full]
- 81. Identification of prognostic genes associated with phase ... [https://www.nature.com/articles/s41598-025-17884-4]
- 82. Construction and validation of an anoikis-related prognostic ... [https://journals.plos.org/plosone/article?id=10.1371/journal.pone.0335788]
- 83. A prognostic model of lung adenocarcinoma constructed ... [https://www.frontiersin.org/journals/oncology/articles/10.3389/fonc.2025.1464578/full]
- 84. Unveiling prognostic factors and predictive modeling in ... [https://pubmed.ncbi.nlm.nih.gov/40950704/]
- 85. Construction of a prognostic model for lung adenocarcinoma ... [https://tcr.amegroups.org/article/view/102081/html]
- 86. Integrative multi‐omics approaches identify molecular ... [https://pmc.ncbi.nlm.nih.gov/articles/PMC12614089/]
- 87. The Future of Precision Medicine in the Cure of Alzheimer's ... [https://pmc.ncbi.nlm.nih.gov/articles/PMC9953731/]
- 88. Multi-omics approaches to disease | Genome Biology | Full Text [https://genomebiology.biomedcentral.com/articles/10.1186/s13059-017-1215-1]
- 89. Multi-omics approaches in the study of human disease ... [https://pmc.ncbi.nlm.nih.gov/articles/PMC11747011/]
- 90. Integrative multi-omics approaches identify molecular ... [https://www.medrxiv.org/content/10.1101/2025.05.31.25328688v1]
- 91. Machine learning in Alzheimer's disease genetics [https://www.nature.com/articles/s41467-025-61650-z]
- 92. Supporting Multi-omics Approaches [https://www.thermofisher.com/us/en/home/brands/thermo-scientific/molecular-biology/molecular-biology-learning-center/molecular-biology-resource-library/spotlight-articles/supporting-multi-omics-approaches.html]
- 93. Integrative Multi-Omics Approaches for Identifying and ... [https://pmc.ncbi.nlm.nih.gov/articles/PMC11855028/]
- 94. Transformative advances in single-cell omics: a ... [https://translational-medicine.biomedcentral.com/articles/10.1186/s12967-025-07091-0]
- 95. Integrative multi-omics identification and functional validation ... [https://pmc.ncbi.nlm.nih.gov/articles/PMC12450685/]
- 96. of statistical and deep Comparative -based... analysis learning [https://translational-medicine.biomedcentral.com/articles/10.1186/s12967-025-06662-5]
- 97. Data Omics for Cancer Diagnosis and... | SpringerLink Analysis [https://link.springer.com/chapter/10.1007/978-981-96-7679-8_21]
- 98. Interpretable and integrative analysis of single-cell ... [https://www.nature.com/articles/s42003-025-08533-7]
- 99. Integrative omics redefining allergy mechanisms and ... [https://www.sciencedirect.com/science/article/pii/S1323893025000917]
- 100. From Patterns to Pills: How Informatics Is Shaping Medicinal ... [https://pmc.ncbi.nlm.nih.gov/articles/PMC12114992/]
- 101. Integrative multi-omics deciphers the potential mechanism ... [https://www.nature.com/articles/s41598-025-22350-2]
- 102. Artificial Intelligence in Clinical and Translational Science [https://pmc.ncbi.nlm.nih.gov/articles/PMC12580936/]
- 103. Artificial intelligence in clinical trials: A comprehensive ... [https://www.sciencedirect.com/science/article/pii/S1386505625003582]
- 104. SophI.A Summit 2025: AI for Clinical Impact [https://emag.medicalexpo.com/sophi-a-summit-2025-translating-ai-innovation-into-clinically-meaningful-impact/]