Optimizing Protein Purity for Crystallography: A Comprehensive Guide from Construct to Crystal
This article provides a detailed roadmap for researchers and drug development professionals to optimize protein purity for successful crystallization and high-resolution structure determination.
Optimizing Protein Purity for Crystallography: A Comprehensive Guide from Construct to Crystal
Abstract
This article provides a detailed roadmap for researchers and drug development professionals to optimize protein purity for successful crystallization and high-resolution structure determination. Covering the full pipeline, it explores foundational principles of protein crystallography, methodological advances in construct design and purification, systematic troubleshooting for challenging proteins, and validation techniques to assess sample quality. By integrating current trends and data, the guide offers practical strategies to overcome the major bottleneck in structural biology, enabling reliable production of diffraction-quality crystals for biomedical and clinical research.
The Critical Link Between Protein Purity and Successful Crystallization
Why Protein Crystallization Remains a Major Bottleneck in Structural Biology
For researchers in structural biology and drug development, determining the three-dimensional structure of proteins is fundamental. Despite being the source of nearly 85% of the structures in the Protein Data Bank, protein crystallization remains a significant and often formidable bottleneck [1]. This process is the critical gateway to powerful techniques like X-ray crystallography, but it is plagued by low success rates, long timeframes, and a high degree of irreproducibility. This technical support center is designed to help you troubleshoot common issues, with all guidance framed within the overarching thesis that optimizing protein purity and sample preparation is the most crucial factor for successful crystallization.
FAQs: Addressing Common Crystallization Challenges
FAQ 1: Why is my protein sample not crystallizing, even with commercial screening kits?
Commercial screens are a great starting point, but their success is entirely dependent on the quality of the protein sample. The most common reason for failure is inadequate sample purity or homogeneity. Your protein should ideally be >95% pure, as impurities such as misfolded populations, proteolytic fragments, or chemical modifications (e.g., deamidation of Asn/Gln or cysteine oxidation) can disrupt the ordered crystal lattice [1]. Furthermore, your protein must be monodisperse—meaning it exists as a single, uniform species in solution. Assess this using dynamic light scattering (DLS) or size-exclusion chromatography (SEC). Finally, the protein must be stable for days or weeks, as crystal nucleation and growth are not instantaneous [1].
FAQ 2: What is the single most important factor to control before starting crystallization trials?
The consensus in the field is that protein purity and homogeneity are paramount [2] [3] [1]. A sample that is not biochemically consistent will have a very low probability of forming a regular crystal lattice. Impurities and conformational heterogeneity act as defects that prevent the long-range order required for diffraction-quality crystals.
FAQ 3: How can I improve the solubility and stability of my protein during concentration?
Concentration is a critical step where proteins often "oil out" or precipitate. To maintain solubility:
- Adjust pH: Move the buffer pH further away from the protein's theoretical pI to increase its surface charge and interaction with solvent [4].
- Use additives: Incorporate small, polar molecules like glycerol (keep below 5% v/v in crystallization drops), sucrose, or methylpentanediol [4] [1].
- Include ligands: If your protein binds a metal ion, substrate, or inhibitor, adding these can stabilize a particular conformation and improve solubility [4].
- Check salt concentration: Ensure your buffer contains at least 10-25 mM NaCl to prevent the protein from sticking to concentrator membranes [4].
FAQ 4: My protein crystallizes, but the crystals do not diffract well. What could be wrong?
Poor diffraction is often a sign of internal disorder within the crystal. This can be caused by:
- Flexible regions: Intrinsically disordered loops or domains on the protein's surface can prevent tight crystal packing [1].
- Micro-heterogeneity: Invisible impurities or a mixture of conformational states within the crystal lattice.
- Inadequate optimization: The initial crystallization condition might yield micro-crystals or crystals with high mosaicity. Fine-tuning the pH, precipitant concentration, temperature, and additives is necessary [5].
Troubleshooting Guide: From Problem to Solution
Table 1: Common Crystallization Problems and Evidence-Based Solutions
| Problem Symptom | Potential Root Cause | Recommended Solution |
|---|---|---|
| Clear drop with no precipitate or crystals | Protein concentration too low; solution undersaturated. | Concentrate protein further; use a Crystool Pre-Screen kit to test suitability [4]. |
| Amorphous/precipitate | Supersaturation too high; protein denaturation at air-water interface; sample instability. | Reduce protein or precipitant concentration; include additives like MPD; use oils in batch methods to minimize interfaces [5] [3]. |
| Oily droplets or phase separation | Protein preferring protein-protein interactions over solvent interactions. | Change buffer pH; add solubilizing agents like glycerol or mild detergents [4]. |
| Micro-crystals | Excess nucleation sites; nucleation rate exceeds growth rate. | Use seeding strategies; slightly reduce supersaturation; employ heterogeneous nucleants like functionalized surfaces [5]. |
| Crystals form but are small, thin, or clustered | Stochastic and uncontrolled nucleation. | Introduce controlled nucleation methods using functionalized surfaces or nanoparticles to expand the nucleation zone to lower supersaturation levels [5]. |
The Scientist's Toolkit: Essential Research Reagents
Table 2: Key Reagent Solutions for Crystallization Experiments
| Item | Function in Crystallization | Key Considerations |
|---|---|---|
| Precipitants (e.g., PEGs, Ammonium Sulfate) | Induce supersaturation by excluding water (PEGs) or salting-out (salts) [1]. | PEGs create macromolecular crowding; ammonium sulfate is a common first screen. |
| Buffers | Maintain pH stability, crucial as proteins often crystallize near their pI [1]. | Keep concentration low (<25 mM); avoid phosphates which can form insoluble salts. |
| Reducing Agents (DTT, BME, TCEP) | Prevent cysteine oxidation, maintaining sample homogeneity [1]. | Consider half-life: TCEP is most stable, especially at high pH [1]. |
| Additives (e.g., MPD, Ligands, Metals) | Stabilize specific protein conformations, mediate crystal contacts, or improve order [3] [1]. | MPD affects the hydration shell; ligands and metals can lock flexible domains. |
| Heterogeneous Nucleants | Provide surfaces to lower the energy barrier for nucleation, improving control and reproducibility [5]. | Include functionalized surfaces or nanoparticles in screening. |
Experimental Protocols for Success
Protocol 1: Assessing Sample Quality for Crystallization
A rigorous pre-crystallization quality control check is non-negotiable.
- Purity Analysis: Run the final purified sample on an SDS-PAGE gel, followed by sensitive staining (e.g., Coomassie). The gel should show a single dominant band at the expected molecular weight [2].
- Homogeneity Analysis:
- Size-Exclusion Chromatography (SEC): The protein should elute as a single, symmetric peak.
- Dynamic Light Scattering (DLS): The sample should be monodisperse. A polydispersity value below 20-25% is a good indicator of a homogeneous solution suitable for crystallization trials [1].
- Stability Assessment: Use differential scanning fluorimetry (DSF) to identify buffer conditions, pH, and ligands that maximize the protein's thermal stability.
Protocol 2: Hanging Drop Vapor Diffusion (The Most Popular Method)
This method is ideal for initial screening as it dynamically changes supersaturation [4].
- Prepare the Reservoir: Add 500-1000 µL of the crystallization cocktail (precipitant solution) to the well of a sealed plate.
- Mix the Drop: On a siliconized glass coverslip, mix 1 µL of your purified protein sample with 1 µL of the reservoir solution.
- Seal the Chamber: Invert the coverslip and carefully place it over the reservoir, sealing it to create a closed system.
- Incubate and Monitor: Place the tray in a vibration-free, temperature-controlled incubator. Monitor the drop regularly under a microscope for crystal growth.
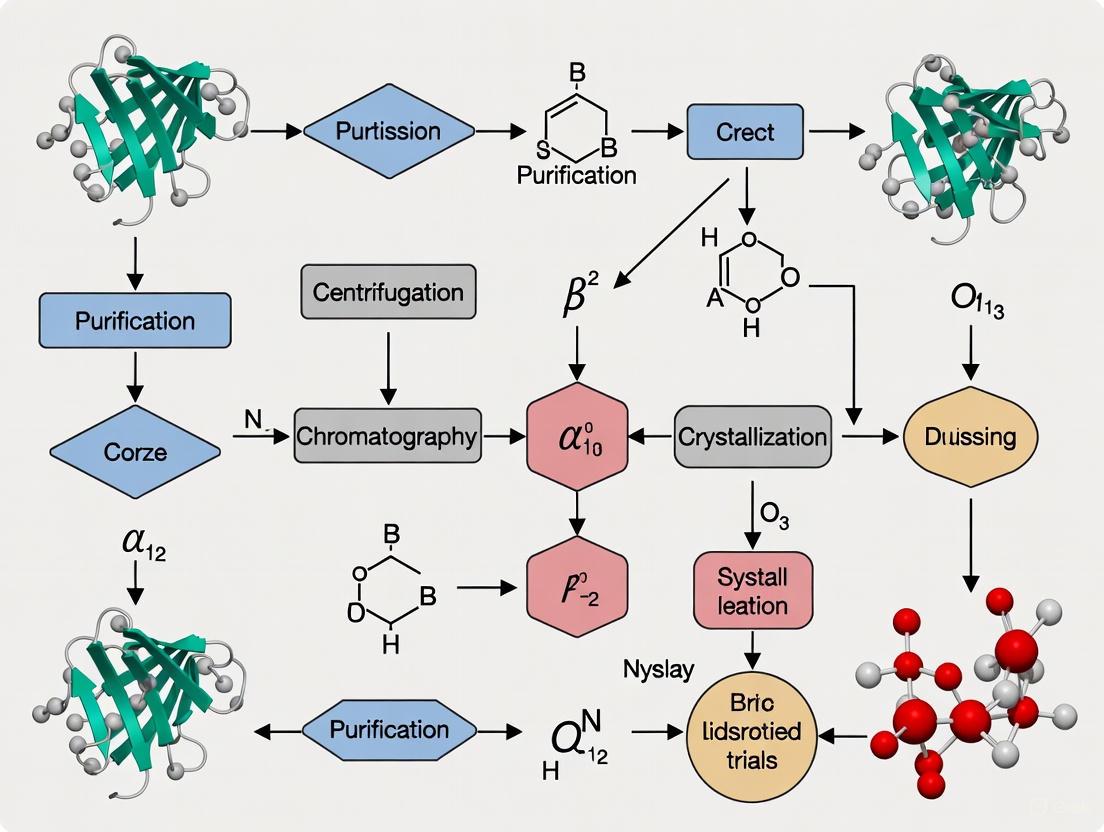
The following workflow diagram illustrates the key stages of the crystallization optimization process, from initial preparation to final structure determination.
Protocol 3: Using Solubility Additives
If your protein precipitates during concentration or in crystallization drops, follow this additive test.
- Prepare Stock Solutions: Make concentrated stocks of potential solubilizing agents (e.g., 50% glycerol, 1 M glycine betaine, 20% MPD, 10% beta-octyl glucoside).
- Test on a Small Scale: Take a small aliquot of your precipitated or "oiled" protein. On a microscope slide or coverslip, add a tiny amount of the precipitate and mix with a small drop of the additive.
- Observe: Watch under a microscope to see if the precipitate dissolves. If it does, that additive can be incorporated into your protein stock buffer or the crystallization drop to maintain solubility [4].
The following diagram outlines the decision-making process for addressing the most common crystallization problem: the absence of crystals.
Frequently Asked Questions (FAQs)
FAQ 1: Why are my protein crystals so soft and easily damaged compared to small molecule crystals? Protein crystals are mechanically fragile because they are stabilized by a very small number of weak intermolecular contacts relative to their molecular mass. While a conventional small molecule forms many strong bonds with its neighbors in a crystal, protein crystals are primarily held together by sparse, weak interactions like salt bridges, hydrogen bonds, and hydrophobic interactions. Furthermore, the high solvent content (typically around 50%, but can range from 25% to 90%) creates a crystal that is, in many ways, more akin to an ordered gel, making it soft and prone to disintegration upon dehydration [3].
FAQ 2: How does high solvent content affect X-ray diffraction data collection? The high solvent content means that protein crystals have inherently weak lattice forces. This often results in weaker optical properties and poor X-ray diffraction intensity compared to crystals of small molecules. The extensive interstitial solvent channels allow for free diffusion of solvent and other small molecules, but the disorder associated with this solvent can contribute to higher B-factors (atomic displacement parameters) and limit the resolution obtainable in diffraction experiments [3] [6].
FAQ 3: What are the primary biochemical factors that influence crystal quality? The key factors are:
- Purity: A high level of purity (typically >95%) is essential. Impurities such as misfolded populations, oligomerization, or chemical modifications (e.g., cysteine oxidation, deamidation) can disrupt the ordered crystal lattice and lead to poor diffraction [1].
- Homogeneity & Solubility: The sample must be monodisperse and not prone to aggregation. Techniques like dynamic light scattering (DLS) and size-exclusion chromatography (SEC) are used to assess homogeneity. A highly soluble sample in a simple buffer is ideal for crystallization [1].
- Stability: The protein must remain stable for extended periods (days to months) as crystals nucleate and grow. Buffer components, salts, and stabilizing additives (e.g., ligands, reductants) are often necessary to maintain stability [1].
FAQ 4: My crystals form but do not diffract well. What could be the cause? Poor diffraction can be caused by several factors rooted in the unique nature of protein crystals:
- Internal Disorder or Flexibility: Flexible regions in the protein can cause conformational heterogeneity, leading to a disordered crystal lattice [1].
- Crystal Packing and "Rocking Motion": The protein molecules within the crystal lattice can undergo a slight overall "rocking" motion. The amplitude of this motion varies between crystal forms and is directly correlated with the resolution obtainable in X-ray experiments [6].
- Lattice Defects: Imperfections in the crystal lattice, which can arise from growth conditions or sample heterogeneity, can disrupt the periodic order needed for high-resolution diffraction [7].
Troubleshooting Guides
Problem 1: Consistent Crystal Cracking or Disintegration
| Symptom | Potential Root Cause | Recommended Solution |
|---|---|---|
| Crystals crack when handled or cryo-cooled. | Mechanical stress from weak lattice forces and high solvent content. | Optimize cryoprotection by gradually transferring crystals to a mother liquor containing cryoprotectants like glycerol, MPD, or high-molecular-weight PEGs [1]. |
| Crystals disintegrate upon harvesting. | Dehydration due to exposure to air. | Ensure crystals remain in their mother liquor or a stabilizing solution during manipulation. Use loops or capillaries that keep the crystal bathed in liquid [3]. |
Problem 2: Crystals Form but Diffract Poorly (Low Resolution/Weak Intensity)
| Symptom | Potential Root Cause | Recommended Solution |
|---|---|---|
| Diffraction patterns are weak or streaky. | High mosaicity or static disorder within the crystal lattice. | Improve crystal quality by post-crystallization treatments, such as annealing, or use seeding techniques to promote more ordered growth [8]. |
| Diffraction spots are sparse. | Small crystal size or intrinsic molecular motion. | Increase protein concentration in crystallization trials or optimize conditions to grow larger crystals. Consider if the protein has flexible regions that could be truncated [1] [9]. |
| Poor scaling statistics between datasets. | Systematic errors from radiation damage, absorption, or sample heterogeneity. | Use modern scaling software that employs advanced algorithms, including those based on machine learning/variational inference, to better correct for systematic errors [7]. |
Problem 3: Failure in Auto-indexing During Data Processing
| Symptom | Potential Root Cause | Recommended Solution |
|---|---|---|
| "Utter failure" or "misprediction" of the reflection lattice. | Incorrect experimental parameters or crystal-related issues. | Verify critical experimental parameters: X-ray beam position, crystal-to-detector distance, and detector rotation values. Ensure the oscillation range is appropriate (e.g., 1.0° for proteins) [10]. |
| "Kind-of-failed" indexing with high distortion. | Crystal twinning or multiple lattices. | Adjust auto-indexing parameters such as resolution limits to exclude reflections from ice rings or satellite crystals. For twinned crystals, expert intervention or growing new crystals may be necessary [10]. |
Experimental Protocols for Optimization
Protocol 1: Assessing and Optimizing Protein Sample Quality for Crystallization
Objective: To ensure the protein sample is pure, stable, monodisperse, and at a high concentration suitable for crystallization trials [1] [9].
Materials:
- Purified protein sample
- Analytical SEC column, DLS instrument, or mass photometer
- Buffers and reagents for stability assays (e.g., differential scanning fluorimetry)
Methodology:
- Purity Analysis: Verify protein purity (>95%) using SDS-PAGE and mass spectrometry to check for modifications [1].
- Stability Assessment: Use differential scanning fluorimetry or circular dichroism to identify buffer conditions, pH, and ligands that maximize protein thermal stability [1].
- Homogeneity and Solubility Check:
- Perform analytical size-exclusion chromatography. A symmetric, single peak indicates monodispersity.
- Use dynamic light scattering to check for aggregation. A monomodal size distribution with a low polydispersity index is ideal.
- Concentration: Concentrate the protein to the typical range of 5-20 mg/mL using an appropriate concentrator. Centrifuge the sample at high speed just before setting up crystallization trials to remove any aggregates.
Protocol 2: High-Throughput Crystallization Screening Using Vapor Diffusion
Objective: To efficiently identify initial crystallization conditions using minimal protein [8] [11].
Materials:
- Purified, concentrated protein
- Commercial sparse-matrix crystallization screening kits
- Crystallization plates (sitting or hanging drop)
- Liquid handling robot (optional, for automation) [11]
Methodology:
- Plate Setup: For each condition in the screen, mix a small volume of protein solution (e.g., 100 nL) with an equal volume of reservoir (precipitant) solution on a sitting drop bridge or cover slip [8] [11].
- Sealing: Carefully seal the plate, ensuring the reservoir solution is in contact with the drop to allow for vapor diffusion equilibration.
- Incubation: Incubate the plates at a constant temperature (e.g., 20°C or 4°C). Avoid vibration.
- Imaging and Monitoring: Use an automated imaging system to regularly monitor the drops for crystal formation over days to weeks. Advanced imagers can use UV, SONICC, or multi-fluorescent imaging to distinguish protein crystals from salt [11].
Key Research Reagent Solutions
| Reagent / Material | Function in Crystallization | Key Considerations |
|---|---|---|
| Polyethylene Glycol (PEG) | A common precipitant that induces macromolecular crowding, reducing protein solubility and promoting crystal contacts [1]. | Available in a range of molecular weights. Higher molecular weight PEGs act primarily through volume exclusion. |
| Ammonium Sulfate | A salt that causes "salting-out," competing with the protein for water molecules and driving the protein out of solution [1]. | The optimal concentration is protein-dependent. A common component of dedicated screening kits. |
| 2-methyl-2,4-pentanediol (MPD) | A precipitant and additive that binds to hydrophobic protein regions and affects the overall hydration shell [1]. | Also commonly used as a cryoprotectant. |
| Tris(2-carboxyethyl)phosphine (TCEP) | A reducing agent that prevents cysteine oxidation and disulfide bond formation, maintaining protein stability [1]. | Preferred over DTT for long crystallization times due to its longer solution half-life across a wide pH range. |
| Lipid Cubic Phase (LCP) | A matrix for crystallizing membrane proteins, providing a membrane-like environment [11]. | Essential for obtaining high-quality crystals of integral membrane proteins. |
| Affinity Tags (e.g., His-tag) | Aids in purification and can sometimes improve solubility or act as a crystallization chaperone [1] [9]. | May need to be cleaved off if it interferes with crystal packing. |
Workflow and Relationship Visualizations
Protein Crystallization and Optimization Workflow
Relationship Between Crystal Properties and Diffraction Quality
The Direct Correlation Between Sample Homogeneity and Crystal Diffraction Quality
Technical FAQs: Unpacking the Homogeneity-Diffraction Relationship
FAQ 1: Why does my protein sample need to be highly pure and homogeneous to form high-quality crystals?
Protein crystallization is a process of forming a highly ordered, three-dimensional lattice. Sample homogeneity is critical because any impurities or heterogeneous populations of your protein (e.g., misfolded forms, aggregates, or contaminating proteins) can disrupt the regular molecular packing required for a perfect crystal. Even minor impurities can act as nucleation sites for disordered aggregation or incorporate into the growing crystal, creating defects that scatter X-rays and severely limit diffraction resolution [1] [12]. A purity level of at least 95% is typically recommended as a starting point for crystallization trials [13].
FAQ 2: What are the practical consequences of using a non-homogeneous sample?
Using a non-homogeneous sample significantly increases the risk of crystallization failure or can lead to misleading results.
- Crystallizing a Contaminant: There are documented cases where a contaminating protein, present in a partially purified sample, crystallizes instead of the target protein. One study reported crystallizing E. coli inorganic pyrophosphatase from a non-homogeneous sample intended for a shrimp thioredoxin. The contaminant protein was identified only after arduous structural analysis, wasting significant time and resources [12].
- Poor Diffraction Quality: Even if the target protein crystallizes, samples with conformational heterogeneity or aggregates often yield crystals with high disorder. This manifests as weak, diffuse diffraction patterns with limited resolution, often preventing complete structure determination [1] [14]. Techniques like diffraction rastering can sometimes salvage data from heterogeneous crystals by identifying the best-diffracting regions, but this is a corrective measure, not a substitute for a quality sample [14].
FAQ 3: Which biochemical parameters are most critical to monitor for ensuring sample homogeneity?
Several key parameters must be controlled and assessed prior to crystallization trials [13] [1]:
- Purity: Assessed by SDS-PAGE, aiming for >95% homogeneity.
- Conformational Homogeneity: The protein should exist in a single, uniform conformational state. This is distinct from purity and is assessed by Size-Exclusion Chromatography (SEC) and Dynamic Light Scattering (DLS), which confirm a monodisperse population in solution [15] [1].
- Structural Integrity: Techniques like Circular Dichroism (CD) spectroscopy can confirm the protein's secondary structure is intact and folded correctly [13].
- Oligomeric State: The protein should be in a consistent oligomeric state (monomer, dimer, etc.), which can be analyzed by SEC coupled with multi-angle light scattering (SEC-MALS) [1].
FAQ 4: How can I improve the homogeneity of a challenging protein sample?
If your sample lacks homogeneity, consider these strategies:
- Construct Design: Use predictive tools like AlphaFold3 to identify and remove flexible regions that cause conformational heterogeneity. Affinity tags can sometimes improve solubility and act as crystallization chaperones [1].
- Optimize Purification: Incorporate an additional polishing step, such as ion-exchange chromatography, following initial affinity purification to remove impurities and misfolded species.
- Add Stabilizing Agents: Include ligands, substrates, or coenzymes in your buffer to stabilize a specific conformational state. The choice of reducing agent is also critical; TCEP is often preferred over DTT or BME for its longer half-life across a wide pH range, preventing cysteine oxidation that leads to heterogeneity [1].
- Advanced Crystallization Methods: Techniques like microseed matrix screening (MMS) can guide a heterogeneous sample toward a homogeneous nucleation pathway, improving crystal order [15].
Troubleshooting Guide: From Problem to Solution
Table 1: Common Homogeneity Issues and Corrective Actions
| Observed Problem | Potential Cause | Solution & Preventive Measures |
|---|---|---|
| Microcrystals or Precipitate | Protein aggregation or heterogeneous oligomeric state. | Analyze by DLS and SEC. Increase purity; add stabilizing additives or ligands; optimize buffer conditions (pH, salt) [1] [16]. |
| Crystals Do Not Diffract | Internal crystal disorder due to conformational heterogeneity or impurities. | Improve sample homogeneity. Use diffraction rastering to find best-diffracting region [14]. Try additive screens or post-crystallization soaking [16]. |
| Crystallizing a Contaminant | Inadequate purity; contaminant is more crystallization-prone. | Repurify sample to >95% homogeneity. Ensure target protein is the dominant species (>80%) in the sample [12]. |
| Crystal Twinning or Poor Morphology | Sample heterogeneity or non-optimal crystallization conditions. | Improve sample homogeneity. Systematically optimize crystallization conditions (pH, precipitant concentration, temperature) around the initial hit [16]. |
The Scientist's Toolkit: Essential Reagents & Methods
Table 2: Key Research Reagent Solutions for Homogeneity and Crystallization
| Reagent / Method | Function in Ensuring Homogeneity & Crystallization |
|---|---|
| Size-Exclusion Chromatography (SEC) | Polishing step to separate monomers from aggregates and ensure a homogenous oligomeric state [13] [1]. |
| Dynamic Light Scattering (DLS) | Rapidly assesses sample monodispersity and identifies aggregation prior to crystallization trials [13] [15]. |
| Affinity Tags (e.g., His-tag) | Enables initial protein purification. The tag's position (N- or C-terminal) can influence solubility and should be optimized [17]. |
| TCEP (Tris(2-carboxyethyl)phosphine) | A stable reducing agent that prevents disulfide bond formation and oxidation, maintaining structural homogeneity over long crystallization times [1]. |
| Microseed Matrix Screening (MMS) | An optimization technique that uses crushed microcrystals to provide uniform nucleation sites, promoting growth of larger, more ordered crystals [15]. |
| PEG (Polyethylene Glycol) | A common precipitant that induces macromolecular crowding, reducing protein solubility and driving crystal formation through entropic effects [1] [16]. |
Experimental Workflow & Protocol
The following diagram and protocol outline a robust strategy for progressing from a purified protein to a high-diffracting crystal, emphasizing steps that enhance sample homogeneity.
Detailed Protocol for Optimization via Microseed Matrix Screening (MMS)
MMS is a powerful method to improve crystal quality from an initial hit by controlling nucleation [15].
Objective: To reproduce and optimize crystal growth using microseeds from initial crystals, leading to larger and more diffraction-quality crystals.
Materials:
- Purified, homogeneous target protein (>95% purity, monodisperse by DLS).
- Initial crystallization condition that produced small crystals or microcrystals.
- Seed Beads (Hampton Research).
- Crystallization plates (e.g., 96-well sitting-drop plates).
Method:
- Seed Stock Preparation:
- Harvest the initial small crystals from the drop using a micro-tool or by crushing a crystal-containing capillary.
- Transfer them to a microtube containing a small volume (e.g., 50 µL) of a stabilizing solution (typically the crystallant solution from the initial condition).
- Add Seed Beads and vortex the mixture thoroughly to crush the crystals into micro-fragments. This creates your "seed stock."
- Prepare a dilution series (e.g., 1:10, 1:100, 1:1000) of the seed stock in the stabilizing solution.
Microseed Matrix Screening:
- Set up a new crystallization plate with drops that systematically vary the chemical parameters of your initial condition (e.g., precipitant concentration, pH).
- Using an automated liquid handler or manually, add a tiny volume (e.g., 0.1-0.5 µL) of a diluted seed stock to each new crystallization drop before setting up the experiment.
- Incubate the plate and monitor crystal growth. The presence of microseeds promotes nucleation in a controlled manner, often at lower levels of supersaturation than required for spontaneous nucleation, which favors orderly growth over precipitation.
Analysis:
- Identify the conditions that yield single, well-formed crystals.
- Use these optimized conditions to reproduce crystal growth for X-ray diffraction experiments.
Advanced Concepts: Pushing the Boundaries of Quality
For proteins that remain recalcitrant to forming high-quality crystals on Earth, microgravity environments offer a unique avenue for improvement. In microgravity, convection currents are minimized, and crystal growth is dominated by diffusion. This quiescent environment can lead to the formation of crystals with superior internal order, larger size, and fewer defects, directly resulting in enhanced diffraction quality [18]. Commercial efforts are now leveraging this principle for proteins of high therapeutic value, such as monoclonal antibodies, not only for structure determination but also to develop improved pharmaceutical formulations with better stability and delivery properties [18].
Frequently Asked Questions (FAQs)
FAQ 1: Why is protein purity so critical for crystallization, and what level is required? Achieving high purity is a prerequisite for successful crystallization because impurities disrupt the uniform molecular packing required to form a well-ordered crystal lattice. Sources of heterogeneity include protein isoforms, flexible regions, misfolded populations, and chemical modifications like cysteine oxidation or deamidation [1]. It is recommended that your sample has a purity level exceeding 95% before embarking on crystallization trials [1].
FAQ 2: Does a thermodynamically stable protein guarantee successful crystallization? Not necessarily. While extremely low stability (unfolded proteins) is detrimental, and very high stability may be slightly beneficial, overall thermodynamic stability is not a major determinant of crystallization propensity across the typical range for folded proteins [19]. The key factor appears to be the prevalence of well-ordered, low-entropy surface epitopes capable of forming specific crystal contacts, rather than global stability [19].
FAQ 3: My protein is pure but doesn't crystallize. What surface properties should I investigate? Proteins with surface regions of high conformational entropy (often from flexible loops or side-chains of residues like Lys, Glu, and Gln) can inhibit crystallization. A proven strategy is surface entropy reduction (SER), where such surface residues are mutated to smaller residues like alanine to reduce the entropic penalty of forming crystal contacts [19]. Tools like AlphaFold3 can guide construct design by identifying and helping to eliminate floppy regions [1].
FAQ 4: How do I choose a reducing agent for my crystallization buffer? The choice of reductant should consider the experimental timescale and buffer pH, as their stability in solution varies significantly. The table below compares common reducing agents.
Table: Solution Half-Lives of Common Biochemical Reducing Agents
| Chemical Reductant | Solution Half-Life (pH 6.5) | Solution Half-Life (pH 8.5) |
|---|---|---|
| Dithiothreitol (DTT) | 40 hours | 1.5 hours |
| β-Mercaptoethanol (BME) | 100 hours | 4.0 hours |
| Tris(2-carboxyethyl)phosphine (TCEP) | >500 hours (across pH 1.5–11.1 in non-phosphate buffers) | >500 hours (across pH 1.5–11.1 in non-phosphate buffers) |
Source: [1]
FAQ 5: How can solution additives like urea help in crystallization? Traditionally known as a denaturant, urea at sub-denaturing concentrations can modulate protein-protein interactions and promote crystallization. It increases protein solubility and, when combined with salts that decrease solubility (like NaCl), allows for independent fine-tuning of the crystallization environment. Urea can enable crystallization at lower supersaturation levels and may enhance both nucleation and growth rates at a fixed chemical potential difference [20].
Troubleshooting Guides
Problem: Consistent Amorphous Precipitation Instead of Crystals
This is often a sign of sample heterogeneity or non-ideal solution conditions.
- Assessment 1: Check Oligomeric State and Monodispersity.
- Method: Use Size-Exclusion Chromatography coupled with Multi-Angle Light Scattering (SEC-MALS) or Dynamic Light Scattering (DLS).
- Expected Outcome: A single, monodisperse peak. Proteins that form specific, homogeneous oligomers (e.g., dimers) crystallize more readily than monomers. Conversely, polydisperse samples or aggregates are a major bottleneck [1] [19].
- Assessment 2: Evaluate Surface Charge and Conformational Heterogeneity.
- Method: Use calibrated limited proteolysis followed by mass spectrometry or SDS-PAGE.
- Expected Outcome: A large, protected fragment indicates a well-folded core with limited disordered loops. The size of the dominant protected fragment has been shown to positively correlate with crystallization success [19].
Problem: Crystals Form but Diffract Poorly
Poor diffraction can result from internal disorder within the crystal, often caused by flexibility or impurities.
- Assessment 1: Analyze Surface Entropy.
- Method: Inspect your protein sequence for clusters of high-entropy residues (Lys, Glu, Gln). Use SER-predicting servers and design point mutations (e.g., to Ala) to create more ordered surface patches [19].
- Assessment 2: Investigate Crystal Packing.
- Method: If a low-resolution structure is available, analyze the crystal contacts. Alternatively, use construct design to remove flexible N/C-terminal or loops, guided by structure prediction tools like AlphaFold3 [1].
The Scientist's Toolkit: Key Research Reagent Solutions
Table: Essential Materials for Pre-crystallization Assessment
| Item | Function | Key Considerations |
|---|---|---|
| SEC-MALS System | Determines absolute molecular weight and quantifies oligomeric state homogeneity. | The gold standard for confirming sample monodispersity prior to crystallization trials. |
| Differential Scanning Fluorimetry (DSF) | Identifies optimal buffer conditions, pH, and ligands by measuring thermal stability. | A high-throughput method to find conditions that maximize protein stability. |
| Size-Exclusion Chromatography (SEC) | Assesses sample purity and oligomeric state under native conditions. | A standard workhorse for quality control; look for a symmetric elution peak. |
| TCEP Reductant | Maintains cysteine residues in a reduced state. | Superior to DTT for long-term crystallization experiments due to its pH-independent stability [1]. |
| Surface Entropy Reduction (SER) Kits | Provide primers and protocols for mutating high-entropy surface residues. | A rational mutagenesis approach to improve crystallization propensity. |
Experimental Protocol: Workflow for Pre-crystallization Assessment
The following diagram outlines a logical workflow for systematically assessing a protein sample prior to crystallization trials.
Title: Pre-crystallization Assessment Workflow
Detailed Methodological Steps:
Purity Analysis:
- Protocol: Perform SDS-PAGE under both reducing and non-reducing conditions to check for homogeneity and disulfide-linked aggregates. For higher resolution, use Liquid Chromatography-Mass Spectrometry (LC-MS) to verify the molecular weight and detect chemical modifications like deamidation [1].
Stability Profiling:
- Differential Scanning Fluorimetry (DSF) Protocol:
- Prepare a master mix containing the protein and a fluorescent dye (e.g., SYPRO Orange).
- Dispense into a 96-well plate containing different buffers, salts, or ligands.
- Use a real-time PCR instrument to ramp the temperature from 25°C to 95°C while monitoring fluorescence.
- Plot the data to determine the melting temperature (Tm). The condition with the highest Tm indicates the greatest stability [1].
- Circular Dichroism (CD) Spectroscopy Protocol:
- Dialyze the protein into a volatile buffer or use a buffer with low UV absorbance.
- Collect far-UV spectra (e.g., 190-250 nm) to confirm proper secondary structure.
- For chemical denaturation, collect CD signals at a fixed wavelength (e.g., 222 nm) while titrating in a denaturant like guanidinium HCl to determine unfolding thermodynamics [19].
- Differential Scanning Fluorimetry (DSF) Protocol:
Oligomeric State Analysis:
- SEC-MALS Protocol:
- Equilibrate the SEC column with your chosen crystallization buffer.
- Inject the protein sample and simultaneously monitor the UV, light scattering, and refractive index signals.
- The MALS detector allows for the direct calculation of the absolute molecular weight of the eluting species, independent of elution volume, providing a definitive assessment of monodispersity [1] [19].
- SEC-MALS Protocol:
Sequence and Surface Analysis:
Strategic Approaches to Protein Production and Purification for Crystallography
Troubleshooting Guides and FAQs
FAQ: Addressing Common Challenges in Construct Design
Q1: How do I decide between using a large fusion tag like MBP versus a small peptide tag like NEXT?
The choice depends on a balance between the solubility enhancement needed and the potential interference with your protein's function or crystallization. Large tags like Maltose-Binding Protein (MBP, ~40 kDa) are powerful for preventing aggregation and enhancing soluble expression but can impose a significant metabolic burden and may need to be removed for functional studies or crystallization. Smaller tags like the NEXT tag (5.5 kDa) or SynIDPs (<20 kDa) are less likely to interfere with the native structure and activity of the passenger protein, often eliminating the need for tag removal [21] [22]. For proteins where maintaining activity without cleavage is a priority, smaller, intrinsically disordered tags are preferable.
Q2: My protein is still insoluble after adding a fusion tag. What are my next steps?
Insolubility despite fusion tags suggests the need for a combined strategy. Consider the following:
- Co-express Molecular Chaperones: Co-expression of chaperone systems like GroEL-GroES or DnaK-DnaJ-GrpE can assist in the proper folding of the target protein by providing a supportive environment [23].
- Screen Chemical Chaperones: Add low molecular weight compounds like glycerol, arginine, or cyclodextrins to the culture medium. These act as thermodynamic stabilizers, reducing aggregation of folding intermediates [23].
- Re-evaluate Your Construct: The problem may lie in intrinsic protein properties. Use bioinformatics tools to predict and truncate disordered regions or consider surface entropy reduction (SER) mutations to improve crystallizability [24] [25].
Q3: What are the best practices for removing affinity tags to avoid crystallization artifacts?
Improper tag removal is a common source of contamination. To minimize this:
- Use High-Specificity Proteases: Enzymes like TEV protease have high specificity, reducing the chance of cleaving within your target protein.
- Remove the Protease Post-Cleavage: After cleavage, use a second affinity step to capture the protease (if it is tagged) and any uncleaved fusion protein, leaving your target protein pure in the flow-through [26].
- Confirm Complete Removal: Always verify tag removal and check for residual protease contamination via SDS-PAGE or mass spectrometry before proceeding to crystallization trials [26].
Q4: How can computational tools be integrated into the construct design process?
AI and bioinformatics are now central to rational design:
- Disorder Prediction: Tools like DISOPRED and IUPred can identify flexible regions at the termini or in internal loops that are prime targets for truncation to enhance protein stability and crystallization success [25].
- Surface Entropy Reduction Prediction: Algorithms can help identify surface-exposed loops with high-entropy residues (e.g., Lys, Glu) that can be mutated to smaller residues (e.g., Ala, Thr) to promote crystal contact formation [24].
- Structure Prediction: Tools like AlphaFold2 can generate reliable structural models for your target or homologs. These models are invaluable for guiding domain boundaries for truncation, identifying potential fusion tag attachment sites, and even serving as search models for molecular replacement in crystallography [24].
Troubleshooting Guide: From Insoluble Protein to Diffraction-Quality Crystals
Problem: Low Soluble Expression of Recombinant Protein
- Potential Cause 1: Aggregation-prone hydrophobic regions or unstructured termini.
- Solution: Design N- or C-terminal truncations. Use limited proteolysis combined with mass spectrometry to identify stable, structured domains [25].
- Potential Cause 2: Overwhelmed cellular folding machinery.
- Potential Cause 3: Insufficient chaperone support.
- Solution: Co-express molecular chaperones. The GroEL-GroES system is particularly effective for a wide range of proteins [23].
Problem: Protein Crystallizes but Diffracts Poorly
- Potential Cause 1: Conformational heterogeneity due to flexible regions.
- Solution: Implement Surface Entropy Reduction (SER). Mutate clusters of high-entropy residues (Lys, Glu, Gln) on the protein surface to alanine or other small residues to facilitate tighter crystal packing [24].
- Potential Cause 2: Lattice strain from impurities or micro-heterogeneity.
- Potential Cause 3: The crystals themselves are of poor morphological quality (e.g., needles, plates).
- Solution: Perform post-crystallization optimization. Use additive screens or fine-tune the concentration of precipitants and pH. Techniques like micro-seeding can also be used to improve crystal size and quality [27].
Problem: Solved Structure Reveals the Wrong Protein
- Potential Cause: Crystallization of a persistent contaminant.
- Solution: Identify common contaminants. Proteins from the expression host (e.g., E. coli YodA) or exogenous proteins like lysozyme or TEV protease are frequent culprits [26].
- Solution: If a structure cannot be solved, use computational tools like Fitmunk to identify the sequence from electron density or perform a molecular replacement search using a database of common contaminants [26].
Quantitative Data for Informed Decision-Making
Table 1: Comparison of Common and Novel Fusion Tags
| Tag Name | Size (kDa) | Key Mechanism | Key Advantages | Considerations |
|---|---|---|---|---|
| MBP [21] | 40.4 | Acts as a solubility enhancer; possible folding catalyst | Very high success rate for soluble expression | Large size can affect passenger protein activity; often needs removal |
| GST [21] | 25.7 | Dimerization can aid solubility | Easy purification via glutathione resin | Dimerization may be undesirable; can be insoluble itself |
| SUMO [22] | ~12 | Acts as a chaperone; highly soluble | Enhances expression and solubility; recognized by highly specific protease | Less effective than MBP for some difficult proteins |
| NEXT [21] | 5.5 | Intrinsically disordered "entropic bristle" | Small size; high efficacy; minimal effect on activity | Novel tag, less established track record |
| SynIDPs [22] | <20 | De novo designed disordered proteins; high solvation | No known biological function to interfere with host; promotes soluble folding | Designed tags, require specialized gene synthesis |
Table 2: Strategies for Solubility Enhancement and Their Applications
| Strategy | Typical Application | Key Parameters | Expected Outcome |
|---|---|---|---|
| Molecular Chaperone Co-expression [23] | Proteins that misfold due to lack of host folding machinery | Co-express systems like GroEL-GroES or DnaK-DnaJ-GrpE | Increased yield of natively folded, soluble protein |
| Chemical Chaperones [23] | Stabilizing folding intermediates during expression | Glycerol (0.2-1 M), L-Arg (0.2-0.5 M), Cyclodextrins | Reduced aggregation and increased soluble yield |
| Codon Optimization [23] [25] | Poor expression in heterologous hosts (e.g., E. coli) | Match codon usage to the expression host | Improved translation efficiency and higher protein yields |
| Promoter Engineering [23] | Fine-tuning expression levels to avoid aggregation | Use inducible promoters (e.g., T7, pBAD) to control rate of synthesis | Balanced expression to match host folding capacity |
Experimental Protocols
Protocol 1: Surface Entropy Reduction (SER) Mutagenesis
- Identify Target Residues: Using a crystal structure or a high-confidence AlphaFold2 model, identify clusters of two or three surface-exposed, high-entropy residues (Lys, Glu, Gln). These often form flexible "patches" [24] [25].
- Design Mutations: Design primers to mutate these residues to alanine, serine, or threonine. Single, double, or triple mutant combinations should be designed.
- Generate Mutants: Use site-directed mutagenesis to create the mutant constructs.
- Express and Test: Express the SER mutants in parallel with the wild-type construct. Assess for improved crystallization propensity (e.g., in sparse matrix screens) and monitor for any detrimental effects on protein stability or function using thermal shift assays or activity assays.
Protocol 2: Seeding to Improve Crystal Quality
This protocol is used when initial crystals are too small, numerous, or show poor morphology (e.g., needles, sea urchins) [27].
- Harvest Microcrystals: Transfer crystals from a nucleation-heavy drop to a microcentrifuge tube.
- Prepare Seed Stock: Add a small volume of reservoir solution and crush the crystals using a seed bead or a plastic rod to create a heterogeneous seed stock.
- Prepare Serial Dilutions: Dilute the seed stock in reservoir solution across several orders of magnitude (e.g., 1:10, 1:100, 1:1000).
- Seed New Drops: In a new crystallization tray, set up drops with a slightly lower supersaturation than the initial condition. Introduce a small amount of the diluted seed stock to each drop.
- Monitor Growth: The seeds should provide nucleation sites, leading to fewer, larger, and better-ordered crystals.
Workflow Visualization
Diagram 1: A rational workflow for protein construct design and troubleshooting, integrating computational and experimental steps.
Diagram 2: A troubleshooting pathway for identifying and solving protein crystallization contaminants.
The Scientist's Toolkit: Research Reagent Solutions
Table 3: Essential Reagents and Resources for Protein Construct Design
| Reagent / Resource | Function | Example Use Case |
|---|---|---|
| TEV Protease [26] | Highly specific protease for removing fusion tags. | Cleaving His- or MBP-tags from the target protein after purification to prepare for crystallization. |
| pET Expression Vectors [23] | A family of high-expression plasmids for use in E. coli. | The most common system for recombinant protein production in prokaryotes, offering strong, inducible expression. |
| Chaperone Plasmids [23] | Plasmids for co-expressing molecular chaperones like GroEL/GroES. | Co-transformed with target protein plasmid to assist in the folding of complex or aggregation-prone proteins. |
| Ni-NTA Resin [25] | Immobilized metal affinity chromatography resin for purifying polyhistidine-tagged proteins. | The primary capture step for His-tagged recombinant proteins, offering rapid purification. |
| Size Exclusion Chromatography (SEC) Columns [25] | For polishing purified protein based on hydrodynamic radius. | Final purification step to remove aggregates and ensure a monodisperse, homogeneous sample for crystallization. |
| Dynamic Light Scattering (DLS) [24] [25] | Instrument to measure particle size distribution and polydispersity. | Assessing the monodispersity and aggregation state of a purified protein sample prior to crystallization trials. |
FAQs on Expression System Selection
What is the most important factor when choosing an expression system for a protein intended for crystallization?
For protein crystallization, the solubility and monodispersity of the purified protein are often the most critical factors. While yield is important for producing enough material, a highly soluble and monodisperse protein sample is essential for successful crystal formation and growth. The choice of system must balance the need for sufficient protein quantity with the paramount requirement for high-quality, homogenous protein. Eukaryotic proteins with complex folding or essential post-translational modifications (PTMs) often achieve better solubility in insect or mammalian systems, whereas many prokaryotic proteins can be successfully produced in E. coli [28].
My protein is insoluble in E. coli. What are my primary options to resolve this?
When facing insolubility in E. coli, you can pursue several strategies before switching to a more complex expression system:
- Modify Expression Conditions: Lower the induction temperature (e.g., to 18-25°C), reduce the inducer (IPTG) concentration, or use different growth media [29].
- Use Solubility-Enhancing Fusion Tags: Fuse your protein to a highly soluble tag, such as Maltose-Binding Protein (MBP), Thioredoxin (Trx), SUMO, or NusA [30] [31]. These tags act as molecular chaperones to improve proper folding and solubility.
- Try a Different E. coli Strain: For toxic proteins, use strains with tighter regulatory control, such as BL21(DE3)pLysS or BL21-AI, to minimize basal expression before induction [29].
- Switch to a Eukaryotic System: If the protein is complex and requires specific PTMs, directly switching to an insect or mammalian cell system may provide the correct environment for native folding and solubility [28].
How do I choose between a peptide tag (like His-tag) and a protein tag (like MBP)?
The choice depends on your primary goal:
- Peptide Tags (e.g., His₆, Strep-tag II): These are small and primarily used for affinity purification. They are less likely to interfere with the structure and function of the target protein but offer limited solubility enhancement [30].
- Protein Tags (e.g., MBP, GST, SUMO): These are larger and are highly effective at enhancing solubility and sometimes yield. They can also be used for purification. However, their size may sometimes influence the activity or structure of the target protein and typically need to be removed for crystallization [30] [31].
For challenging proteins, a dual-tag system (e.g., His₆-MBP) is often employed, leveraging MBP for solubility and the His-tag for purification, followed by sequential tag removal [32].
Why is my protein yield low even after successful expression?
Low yields can result from several issues:
- Protein Degradation: Use protease inhibitor cocktails in lysis buffers and work quickly on ice or at 4°C [29].
- Codon Bias: The gene of interest may contain codons that are rare in E. coli, causing the ribosome to stall. Use codon-optimized gene synthesis or co-express genes for rare tRNAs [29] [9].
- Plasmid Instability: This is common with ampicillin resistance; using carbenicillin or a different antibiotic marker can help [29].
- Protein Toxicity: If the protein is toxic to the host cells, use a tightly regulated expression system and ensure cultures are not over-grown before induction [29].
Troubleshooting Guides
Guide 1: Troubleshooting Low Solubility in Bacterial Expression
Problem: The target protein is primarily found in the insoluble fraction (inclusion bodies) after cell lysis.
| Possible Cause | Diagnostic Steps | Recommended Solutions |
|---|---|---|
| Rapid protein folding in bacterial cytoplasm | Check solubility in lysate vs. supernatant via SDS-PAGE. | Reduce induction temperature to 18-25°C [29]. Use solubility-enhancing tags (MBP, Trx, NusA) [30] [31]. |
| Lack of essential PTMs or co-factors | Perform bioinformatic analysis for known PTMs (e.g., disulfide bonds, glycosylation). | Switch to eukaryotic system (insect or mammalian cells) [28]. Use E. coli strains for disulfide bonds (e.g., Origami). |
| Aggregation due to hydrophobic surfaces | Analyze protein sequence for large hydrophobic regions. | Add compatible solubilizing agents (e.g., glycerol, low detergents) [33]. Test co-expression with molecular chaperones [30]. |
| Protein toxicity / basal expression | Check growth curve; toxic proteins cause slow growth. | Use tighter regulation (BL21-AI, pLysS strains) [29]. Add glucose to repress basal expression [29]. |
Experimental Protocol: High-Throughput Solubility Screening This protocol allows for rapid testing of multiple constructs and conditions in a 96-well format [9].
- Clone Generation: Obtain codon-optimized genes cloned into an appropriate expression vector (e.g., pMCSG53 for His-tag fusions) from a commercial synthetic service.
- Transformation: Transform the cloning reaction into expression-grade E. coli cells directly in a 96-well plate.
- Expression Trial:
- Inoculate 200 µL of LB medium per well with antibiotics.
- Grow at 37°C until OD600 ~0.6.
- Induce with 200 µM IPTG.
- Express overnight at 25°C.
- Solubility Analysis:
- Harvest cells by centrifugation.
- Lyse cells chemically (e.g., with lysozyme) or by freeze-thaw.
- Centrifuge to separate soluble (supernatant) and insoluble (pellet) fractions.
- Analyze fractions by SDS-PAGE to determine solubility of the target protein.
Guide 2: Troubleshooting Low Yield Across All Systems
Problem: The protein expresses but the final purified yield is unacceptably low.
| Possible Cause | Diagnostic Steps | Recommended Solutions |
|---|---|---|
| Proteolytic degradation | Observe smearing or multiple lower bands on SDS-PAGE. | Add protease inhibitors (e.g., PMSF) to all buffers [29]. Shorten purification time and work at 4°C. Use a protease-deficient host strain. |
| Inefficient translation (codon bias) | Check gene sequence for rare codons for the host. | Use codon-optimized gene synthesis [9]. Use strains co-expressing rare tRNAs (e.g., Rosetta). |
| Instability of antibiotic selection | Observe loss of plasmid over culture time. | Replace ampicillin with carbenicillin [29]. Use a different antibiotic marker. |
| Poor purification efficiency | Measure protein concentration after each purification step. | Optimize binding/wash conditions for affinity tags. Switch or optimize the affinity tag (e.g., His vs GST). |
| Protein is toxic to host cells | Observe very low cell density at harvest. | Use a tightly regulated system (e.g., pBAD with arabinose) [29]. Induce at lower cell density and for a shorter duration. |
Guide 3: Troubleshooting Inefficient Tag Removal
Problem: The affinity or solubility tag is not completely cleaved by the protease, hindering subsequent purification and crystallization.
| Possible Cause | Diagnostic Steps | Recommended Solutions |
|---|---|---|
| Insufficient protease activity or amount | Run a time-course cleavage assay and analyze by SDS-PAGE. | Increase protease-to-substrate ratio. Extend cleavage incubation time. Check protease activity with a control substrate. |
| Inaccessible protease site | The cleavage site may be sterically hidden. | Introduce a flexible linker between the tag and the target protein [30]. Test a different protease (e.g., switch from TEV to 3C protease or vice versa) [32]. |
| Suboptimal cleavage conditions | Proteases have specific buffer requirements (pH, salt, temperature). | Dialyze into the optimal buffer for the specific protease. Add reducing agents if required for protease stability. |
Experimental Protocol: Dual Protease Affinity Purification This protocol uses sequential cleavage to first identify soluble target protein and then achieve high-purity tag-free protein [32].
- Construct Design: Express the target protein as an N-terminal fusion with MBP, followed by a rhinovirus 3C protease site, a His₆ tag, and then the target protein.
- Cell Lysis and Cleavage 1:
- Lyse the cells and centrifuge to get a clear lysate.
- Incubate the lysate with 3C protease. This cleaves off the MBP tag.
- Centrifuge again. If the target protein is only soluble with the MBP tag, it will precipitate at this stage, saving time on non-viable constructs.
- First IMAC:
- If the His₆-tagged target protein remains soluble, load the supernatant onto an IMAC column.
- Wash and elute to purify the His₆-tagged protein.
- Cleavage 2:
- Incubate the eluted protein with His₆-tagged TEV protease. This cleaves off the N-terminal His₆ tag.
- Second IMAC:
- Pass the cleavage reaction over a second IMAC column.
- The His₆-tagged contaminants (the cleaved tag and the TEV protease) bind to the resin, while the pure, tag-free target protein flows through in the column effluent.
Research Reagent Solutions
Essential reagents and materials for recombinant protein expression and purification workflows.
| Reagent / Material | Function / Application |
|---|---|
| pMCSG53 Vector | A destination vector for ligation-independent cloning (LIC), featuring an N-terminal, cleavable hexa-histidine tag for affinity purification [9]. |
| MBP (Maltose-Binding Protein) Tag | A large (~42.5 kDa) protein tag that acts as a potent solubility enhancer; can also be used for affinity purification on amylose resin [32] [30]. |
| His₆ Tag | A small peptide tag that allows for purification via Immobilized Metal Affinity Chromatography (IMAC) using nickel or cobalt resins [32] [9]. |
| TEV (Tobacco Etch Virus) Protease | A highly specific protease used to remove affinity tags; it recognizes a seven-amino-acid sequence (Glu-Asn-Leu-Tyr-Phe-Gln-Gly) and cleaves between Gln and Gly [32]. |
| 3C Protease (Rhinovirus) | A protease used for tag removal that recognizes the sequence Leu-Glu-Val-Leu-Phe-Gln-Gly-Pro and cleaves between Gln and Gly [32]. |
| SUMO Tag | An 11 kDa tag that enhances solubility and folding. It allows for precise and efficient cleavage by the specific SUMO protease [30]. |
| BL21(DE3) E. coli Strain | A common bacterial host for protein expression from T7-promoter based vectors. Derivatives like pLysS and AI allow for tighter control of basal expression [29]. |
Experimental Workflows for Protein Production
The following diagram illustrates a high-throughput pipeline for screening soluble protein expression.
The following diagram outlines the dual-protease purification strategy for obtaining pure, tag-free protein.
Troubleshooting Guides
Affinity Chromatography Troubleshooting
Q1: My target protein is eluting as a very broad, low peak. What could be the cause and how can I fix it?
This issue often relates to suboptimal elution conditions or non-specific binding.
- Potential Cause 1: Inefficient elution. The current elution buffer may not effectively displace the target protein from the ligand.
- Solution: Modify your elution conditions. If using competitive elution, increase the concentration of the competing molecule in the elution buffer. Alternatively, try a different elution buffer system altogether [34].
- Potential Cause 2: Denaturation or aggregation. The target protein may have denatured and aggregated on the column.
- Solution: Ensure that your binding and wash buffers contain appropriate stabilizing agents and are at a suitable pH. Incorporating a step to remove aggregates before loading onto the column is also recommended [34].
- Experimental Protocol: For difficult elution, try a stop-flow technique: stop the flow for several minutes during elution to allow time for the target protein to dissociate, then resume flow to collect the protein in pulses [34].
Q2: I notice my protein is leaking through and eluting while I am still applying the binding buffer. Why is this happening?
This indicates that binding to the affinity resin is insufficient.
- Potential Cause: The binding conditions are not optimal for the protein-ligand interaction.
- Solution: Find better binding conditions. This may involve adjusting the pH, ionic strength, or composition of the binding buffer. You can also apply the sample in multiple aliquots, stopping the flow for a few minutes between each application to increase contact time with the resin [34].
Size Exclusion Chromatography (SEC) Troubleshooting
Q3: How do I select the most appropriate SEC column for my protein?
The choice of column is critical for achieving an effective size-based separation and depends on the molecular weight of your target protein and its potential aggregates [35].
- Decision Factor 1: Pore Size. The average pore size of the particles determines the range of molecular sizes that can be separated.
- Experimental Protocol: Experimentally determine the calibration curve for your column by injecting a mixture of standard proteins of known molecular weight. This provides a practical understanding of the column's separation range [35].
- Decision Factor 2: Particle Size and Column Length. Modern SEC columns use smaller particles (<3 µm) packed in shorter columns (e.g., 150 mm). Smaller particles provide higher efficiency, which can be used to either improve resolution or decrease analysis time [35].
Q4: My protein recovery from SEC is low. What are the common reasons?
While not explicitly detailed in the search results, a fundamental principle of SEC is minimizing non-size-based interactions.
- Potential Cause: Non-specific interactions between your protein and the stationary phase chemistry.
- Solution: Carefully choose the mobile phase composition to suppress these interactions. The mobile phase should ensure high protein solubility and contain components that minimize attractive forces with the stationary phase [35]. Using the wrong pore size can also lead to co-elution of your target with other molecules, giving the appearance of low recovery [35].
Frequently Asked Questions (FAQs)
Q: Why is high protein purity critical for crystallization research? A: High-quality, pure protein samples are essential for growing well-ordered crystals suitable for X-ray crystallography. Impurities can disrupt the uniform packing of protein molecules into a crystal lattice, preventing crystallization or leading to crystals that do not diffract well [36] [37].
Q: What are the latest technological trends impacting protein purification for structural biology? A: The field is increasingly adopting automation and miniaturization. Microfluidic screening platforms dramatically reduce sample volume needs and can screen thousands of crystallization conditions in minutes. Furthermore, the integration of AI and advanced software is accelerating sample screening and data analysis, improving the success rate of structural determinations [36].
Key Data Tables
Table 1: SEC Column Selection Guide Based on Protein Size
| Target Protein Type | Typical Molecular Weight Range | Recommended Average Pore Size |
|---|---|---|
| Small Therapeutic Proteins | 15 – 80 kDa | 150 – 200 Å |
| Monoclonal Antibodies (mAbs) | ~150 kDa | 200 – 300 Å |
| Very Large / PEGylated Proteins | > 200 kDa | 500 – 1000 Å |
Source: Adapted from [35]
Table 2: Impact of Key Drivers on the Protein Crystallization Market
| Market Driver | Example / Impact | Timeline |
|---|---|---|
| Rising investment in biopharma R&D | Drives demand for high-throughput crystallography; e.g., Thermo Fisher spent USD 1.3 billion on R&D in 2023. | Medium Term (2-4 years) |
| Growing adoption of protein therapeutics | Regulatory filings for biologics require atomic-level structural data. | Long Term (≥ 4 years) |
| Miniaturized microfluidic platforms | Reduces sample needs by an order of magnitude and speeds up screening. | Short Term (≤ 2 years) |
Source: Summarized from [36]
Workflow Diagram
The Scientist's Toolkit: Research Reagent Solutions
Table 3: Essential Materials for Multi-Step Protein Purification
| Item | Function in Purification |
|---|---|
| Affinity Resins (e.g., Ni-NTA, Protein A/G) | Selectively captures a target protein from a complex mixture based on a specific tag or biological interaction. |
| Ion Exchange Resins (e.g., Cation/Anion Exchangers) | Separates proteins based on their net surface charge, effective for polishing and removing impurities. |
| Size Exclusion Chromatography (SEC) Columns | Separates proteins based on hydrodynamic size, ideal for final polishing, buffer exchange, and removing aggregates. |
| Microfluidic Crystallization Chips | Miniaturized platforms for high-throughput screening of crystallization conditions using nanoliter volumes of protein. |
| Crystallization Reagents & Kits | Pre-mixed solutions of precipitants, buffers, and salts used to establish conditions for protein crystal growth. |
| Neutralization Buffer (e.g., 1M Tris-HCl, pH 9.0) | Used to quickly neutralize low-pH elution fractions from affinity chromatography to preserve protein activity [34]. |
Obtaining high-quality crystals for structural biology is critically dependent on the purity and stability of the protein sample. This technical support center provides troubleshooting guidance for key biophysical techniques used in quality control: SDS-PAGE, Dynamic Light Scattering (DLS), Size Exclusion Chromatography (SEC), and Thermal Shift Assays (TSAs). These methods collectively assess protein purity, monodispersity, and stability—essential prerequisites for successful crystallization trials. The following FAQs address specific experimental challenges researchers encounter when preparing proteins for crystallography.
SDS-PAGE Troubleshooting Guide
Sodium dodecyl sulfate-polyacrylamide gel electrophoresis (SDS-PAGE) is a fundamental technique for assessing protein purity, molecular weight, and integrity prior to crystallization screens.
FAQ: Why are my protein bands smeared or poorly resolved on SDS-PAGE?
Smeared bands compromise the assessment of sample purity and can indicate issues that will hinder crystallization.
| Cause | Explanation | Troubleshooting Solution |
|---|---|---|
| High Voltage | Excessive heat generation causes band distortion and smiling effects [38]. | Run gel at 10-15 V/cm; use lower voltage for longer time; employ cooling systems [38]. |
| Improper Sample Preparation | Incomplete protein denaturation leads to abnormal migration [39]. | Boil samples 5 minutes at 98°C with adequate SDS and reducing agents (DTT) [39]. |
| Incorrect Gel Percentage | Poor sieving of proteins due to inappropriate polyacrylamide matrix [39]. | Use lower % gels for high molecular weight proteins; higher % for low molecular weight proteins [39]. |
| Protein Overload | Well overloading causes aggregation and poor band resolution [40]. | Load recommended 10-20 µg protein per well; validate optimal amount for each protein [39] [40]. |
| Old or Improper Buffers | Incorrect ion concentration/pH disrupts current flow and protein migration [38] [39]. | Prepare fresh running buffer with correct salt concentration before each run [39]. |
FAQ: My samples are leaking out of wells or showing unusual migration patterns. What's wrong?
Unusual migration can prevent accurate purity assessment and molecular weight validation.
- Sample Leakage from Wells: Ensure loading buffer contains sufficient glycerol (for density) and avoid overloading wells beyond 3/4 capacity. Rinse wells with running buffer before loading to remove air bubbles [40].
- Vertical Streaking: Often caused by protein precipitation. Add solubilizing agents (urea for hydrophobic proteins), ensure adequate SDS concentration, and remove cell debris through centrifugation [40] [41].
- "Smiling" Bands (Curved Bands): Caused by excessive heat during electrophoresis. Run gel at lower voltage, in a cold room, or with ice packs in the apparatus [38].
- Edge Effect (Distorted Peripheral Lanes): Avoid empty wells at gel periphery. Load protein ladder or control samples in outside wells to ensure even current distribution [38].
FAQ: Why are no bands or faint bands visible after staining?
This prevents meaningful assessment of protein integrity and purity.
- Insufficient Protein Loaded: Concentrate protein samples or increase loading volume; confirm protein concentration before loading [41].
- Protein Degradation: Add fresh protease inhibitors during sample preparation and work quickly on ice to minimize proteolysis [41].
- Running Gel Too Long: Proteins may have run off the gel. Stop electrophoresis when dye front reaches bottom of gel; optimize run time for target protein size [38].
- Staining Issues: Use fresh staining solutions; ensure proper staining and destaining times; check for SDS interference with dye binding [41].
SDS-PAGE Experimental Protocol
Workflow Overview
Detailed Methodology
Sample Preparation
Gel Preparation
- Resolving Gel: Prepare appropriate acrylamide concentration (e.g., 8-15%) based on target protein size. Add ammonium persulfate (APS) and TEMED last to initiate polymerization. Pour between glass plates and overlay with water or isopropanol for a level surface [41].
- Stacking Gel: Once resolving gel polymerizes, prepare stacking gel (typically 4-5% acrylamide). Pour over resolving gel and immediately insert comb without introducing air bubbles [41].
Electrophoresis
Staining and Visualization
Dynamic Light Scattering (DLS) Troubleshooting
DLS measures the hydrodynamic radius of proteins in solution and assesses monodispersity, a critical factor for crystallization.
FAQ: Why is my DLS data showing high polydispersity or multiple peaks?
This indicates sample heterogeneity or aggregation, which severely compromises crystallization.
- Protein Aggregation: Filter samples through 0.1-0.22 μm filters before analysis; centrifuge at high speed to remove aggregates; consider adding stabilizing additives to buffer [42].
- Dust or Contaminants: Use ultrapure, filtered buffers; ensure cuvettes are meticulously cleaned [42].
- Incorrect Protein Concentration: Overly concentrated samples cause intermolecular interference. Dilute sample to appropriate concentration (typically 0.5-1 mg/mL for most proteins) [42].
- Unstable Buffer Conditions: Ensure pH and ionic strength are optimal for protein stability; avoid buffer conditions near protein's isoelectric point [42].
Size Exclusion Chromatography (SEC) Troubleshooting
SEC separates proteins by their hydrodynamic volume and is a critical polishing step to remove aggregates and contaminants before crystallization.
FAQ: Why are my SEC peaks broad, asymmetric, or showing abnormal retention?
Abnormal SEC profiles indicate issues with protein conformation or column performance.
- Protein Aggregation or Interaction with Column: Use SEC columns with appropriate pore size (Superdex 75 for small proteins, Superdex 200 for larger complexes); add low concentration of arginine or mild detergents to mobile phase to reduce interactions [42].
- Column Overload: Reduce sample injection volume or protein concentration [42].
- Buffer Incompatibility: Ensure SEC buffer matches sample buffer composition to prevent precipitation; include necessary additives or salts [42].
- Poor Column Performance: Store columns properly in preservatives; clean and sanitize regularly according to manufacturer instructions [42].
SEC Experimental Protocol
Workflow Overview
Detailed Methodology
Column Preparation
Sample Preparation and Injection
- Concentrate protein sample to required concentration (typically 1-5 mg/mL depending on protein and column size) [42].
- Centrifuge sample at high speed (14,000 × g) or filter through 0.22 μm filter to remove aggregates [42].
- Inject appropriate volume (typically 0.5-2% of column volume) using sample loop or autoinjector [42].
Chromatography and Fraction Collection
Analysis
Thermal Shift Assay Troubleshooting
TSAs measure protein thermal stability and the effects of ligands or buffer conditions, helping identify stabilizing conditions for crystallization.
FAQ: Why are my thermal melt curves irregular or lacking clear transitions?
This prevents accurate determination of protein stability and optimal crystallization conditions.
- Poor Fluorescence Signal: Ensure dye concentration is optimal; check protein-dye compatibility; use high purity SYPRO Orange or similar dyes [43].
- Protein Aggregation During Heating: Include additives to prevent aggregation; optimize protein concentration; try different buffer conditions [43].
- Compound Interference: Some buffer components or test compounds may interfere with fluorescence. Include appropriate controls and test compound-only samples [43].
- Low Protein Stability: Protein may be inherently unstable. Consider buffer optimization, adding stabilizing ligands, or construct re-engineering [43] [42].
Integrated Quality Control Workflow for Protein Crystallization
Successful protein crystallization requires a multi-faceted quality control approach. The following workflow illustrates how these techniques integrate to assess sample quality:
Research Reagent Solutions for Protein Quality Control
The following reagents are essential for implementing these quality control techniques in protein crystallization pipelines:
| Reagent | Function | Application Notes |
|---|---|---|
| Acrylamide/Bis-acrylamide | Forms crosslinked gel matrix for protein separation | Use fresh solutions; concentration determines separation range (8-15% common) [41] |
| SDS (Sodium Dodecyl Sulfate) | Denatures proteins and confers uniform negative charge | Critical for proper migration; ensure adequate concentration in sample buffer [39] |
| DTT/β-mercaptoethanol | Reducing agents break disulfide bonds | Prevents protein aggregation; essential for complete denaturation [39] [41] |
| TEMED/Ammonium Persulfate | Catalyzes acrylamide polymerization | TEMED concentration affects polymerization rate; prepare fresh APS [41] |
| SYPRO Orange Dye | Binds hydrophobic patches of denaturing proteins | Used in thermal shift assays; concentration affects signal intensity [43] |
| SEC Matrices | Size-based separation media (e.g., Sephadex, Superdex) | Choose appropriate pore size for target protein; maintain properly [42] |
| Coomassie Staining Solution | Visualizes proteins in polyacrylamide gels | Prepare fresh or use commercial formulations; destain adequately for clarity [41] |
Implementing these troubleshooting guidelines for SDS-PAGE, DLS, SEC, and Thermal Shift Assays will significantly improve protein sample quality assessment. Systematic quality control at each stage of protein preparation directly enhances crystallization success rates by ensuring samples have the requisite purity, monodispersity, and stability for forming well-ordered crystal lattices.
Frequently Asked Questions (FAQs)
FAQ 1: How does codon optimization directly impact my protein yield and quality for crystallization? Codon optimization directly enhances protein yield and quality by matching the codon usage of your gene to the preferences of your expression host. This increases the speed and accuracy of translation, leading to higher levels of properly folded protein, which is a prerequisite for crystallization. Poor codon usage can cause ribosomal stalling, translation errors, and protein misfolding, all of which introduce heterogeneity that prevents the formation of a well-ordered crystal lattice [44]. The effectiveness of optimization can be measured by the Codon Adaptation Index (CAI); a CAI closer to 1.0 indicates a higher probability of successful expression [44].
FAQ 2: My protein expresses well but remains insoluble. Can codon optimization help? While the primary cause of insolubility often lies with the protein itself, codon optimization can be an indirect solution. Very rapid translation caused by a mismatch in codon usage can lead to misfolding and aggregation. By optimizing codons, you facilitate a slower, more controlled translation rate that allows the protein to fold correctly, thereby improving solubility. Furthermore, optimization tools can reduce high GC content and repetitive sequences in the DNA, which also contribute to synthesis and expression problems [44].
FAQ 3: Why is my purified heme protein inactive and unsuitable for crystallization, even though it appears pure? This is a classic symptom of incomplete or incorrect co-factor incorporation. Without the proper heme co-factor, the protein is not in its native, stable conformation. This conformational heterogeneity prevents the uniform molecular packing required for crystallization. Simply expressing the apoprotein in a standard lab strain like E. coli BL21 does not guarantee proper heme incorporation, as these strains may not efficiently take up or process heme [45].
FAQ 4: What are the first steps to troubleshoot failed crystallization after seemingly successful purification? Your first steps should be to rigorously reassess sample quality. Key checks include:
- Purity: Verify >95% purity via SDS-PAGE [1].
- Homogeneity: Use Dynamic Light Scattering (DLS) or Size Exclusion Chromatography (SEC) to confirm the sample is monodisperse (non-aggregated) [46] [1].
- Stability: Perform a thermal shift assay to ensure the protein is stable across a range of conditions [46].
- Identity: Confirm you have crystallized the target protein and not a common contaminant (e.g., E. coli YodA) by checking lattice parameters against known contaminants [26].
Troubleshooting Guides
Problem 1: Low Protein Yield in Heterologous Expression
Potential Cause: Suboptimal codon usage in the gene sequence for the chosen expression host.
Solution: Perform Codon Optimization. Codon optimization is a computational process that substitutes rare codons in your gene sequence with the host organism's preferred codons for the same amino acid, without changing the resulting protein sequence [44] [47].
Step-by-Step Protocol:
- Obtain Sequence: Have your target protein's amino acid sequence or DNA sequence ready.
- Select a Tool: Use an online codon optimization tool (e.g., VectorBuilder [44] or IDT [47]).
- Input Parameters:
- Input Sequence: Paste your DNA or protein sequence.
- Target Organism: Select your expression host (e.g., E. coli, insect cells).
- Additional Options: Optimize for GC content (aim for ~60%) and avoid specific restriction enzyme sites if needed [44].
- Analyze Output: The tool will generate an optimized DNA sequence. Key metrics to check are a high Codon Adaptation Index (CAI > 0.8) and an appropriate GC content [44].
- Gene Synthesis: The optimized sequence is typically used for de novo gene synthesis to ensure the best expression results.
Supported Input/Output Formats for Codon Optimization Tools [44] [47]
| Feature | Specification |
|---|---|
| Input Formats | GenBank, FASTA, or raw DNA/RNA/Protein sequence. |
| DNA Input Requirement | Must begin with a start codon (ATG) and be a multiple of 3 in length. |
| Key Output Metrics | Optimized DNA sequence, Codon Adaptation Index (CAI), GC content. |
| Additional Features | Avoidance of restriction sites, reduction of repetitive sequences and secondary structures. |
Problem 2: Improper Co-factor Incorporation in Heme Proteins
Potential Cause: The expression host cannot efficiently synthesize or uptake heme, leading to apoprotein production.
Solution: Use a specialized expression system that ensures high heme uptake and incorporation, such as Escherichia coli Nissle 1917 (EcN) [45].
Step-by-Step Protocol:
- Clone Gene: Clone your target heme protein gene into an appropriate expression vector.
- Transform Host: Transform the vector into the EcN expression host.
- Culture and Induce:
- Grow the culture in standard LB medium to the desired cell density.
- Add heme (e.g., hemin chloride) directly to the growth medium. A typical concentration is 5-10 µM, but this should be optimized.
- Induce protein expression with the appropriate inducer (e.g., IPTG).
- Purify Protein: Harvest cells and purify the protein using standard techniques (e.g., affinity chromatography). The incorporated heme will often cause a color change in the cell pellet and purified protein, providing an initial visual confirmation.
- Validate Incorporation: Use UV-Vis spectroscopy to confirm proper co-factor incorporation. A correctly incorporated heme will show a characteristic Soret band (~400 nm) and corresponding alpha/beta bands [45].
Comparison of Heme Incorporation Methods
| Method | Principle | Advantages | Limitations |
|---|---|---|---|
| EcN Expression [45] | Utilizes a bacterial strain with a natural heme uptake receptor (ChuA). | High yield and quantitative incorporation; most native coordination; straightforward. | Limited to prokaryotic expression; requires heme supplementation. |
| In vitro Reconstitution | Heme is added to purified apoprotein after purification. | Controlled conditions; can be used with any expression system. | Can be inefficient; may require extensive optimization of buffer conditions. |
| HPEX System | Engineers heme uptake capability into standard lab strains. | Can be applied to various strains. | Requires genetic modification of the host. |
The Scientist's Toolkit: Research Reagent Solutions
Table 1: Key Reagents for Advanced Protein Production
| Reagent / Material | Function in Experiment | Technical Specification & Use Note |
|---|---|---|
| Codon Optimization Tool | Optimizes gene sequence for high-yield expression in a target host organism. | Input: DNA/AA sequence. Output: Optimized DNA with high CAI and ideal GC content. [44] [47] |
| E. coli Nissle 1917 (EcN) | Specialized expression host for high-efficiency incorporation of heme co-factors. | Use with heme supplementation in growth medium. Confers native-like heme coordination. [45] |
| TEV Protease | Precisely cleaves affinity tags (e.g., His-tag) from the purified target protein. | High specificity cleavage site (Glu-Asn-Leu-Tyr-Phe-Gln↓Gly). Critical for removing tags that hinder crystallization. [46] |
| Size Exclusion Chromatography (SEC) Resin | Final polishing step to remove protein aggregates and ensure monodispersity. | Resins like Superdex 75 (for small proteins) or Superdex 200 (for larger complexes) are standard. [46] |
| Dynamic Light Scattering (DLS) Instrument | Assesses sample homogeneity and monodispersity by measuring hydrodynamic radius. | A monodisperse peak is a strong indicator of a sample suitable for crystallization trials. [46] [1] |
| Thermal Shift Assay Dye | Measures protein thermal stability to identify optimal buffer conditions and ligands. | Dyes like SYPRO Orange bind hydrophobic regions exposed upon unfolding. Used to screen buffers/additives. [46] |
Experimental Workflows and Pathway Diagrams
Workflow 1: Integrated Path to Crystallization-Grade Protein
The following diagram outlines the logical relationship and decision points in the integrated workflow for producing a high-quality protein sample, incorporating codon optimization and co-factor handling.
Workflow 2: Codon Optimization and Validation Process
This diagram details the specific steps and outputs involved in the codon optimization and subsequent validation process.
Solving Common Challenges in Protein Sample Preparation and Crystallization
Addressing Aggregation, Degradation, and Low Yield During Purification
Troubleshooting Guides
Encountering challenges during protein purification is common. The guides below address frequent issues to help you optimize purity for crystallization research.
No or Low Protein Yield in Eluate
| Problem Cause | Recommended Solution |
|---|---|
| Low Expression | Confirm protein expression via induction check or western blot with anti-tag antibodies [48]. |
| Protein Aggregation | Adjust buffer conditions (e.g., add mild detergents) for higher stability; purify at room temperature if protein is not temperature-sensitive [49] [48]. |
| Inefficient Elution | Prepare fresh elution buffer. For His-tagged proteins, try an imidazole step gradient or reduce pH for denaturing elution [49] [48]. |
| Tag Inaccessibility | Ensure the affinity tag is translated and accessible. For His-tags, try denaturing conditions to expose the tag if it is hidden by folding [49] [48]. |
Protein Aggregation and Solubility
| Problem Cause | Recommended Solution |
|---|---|
| Non-Optimal Buffer | Include solubilizing agents like 0.1% Triton X-100, Tween-20, or (for denaturing conditions) up to 0.2% Sarkosyl [49]. |
| Protein Interactions | Use sub-denaturing concentrations of additives like urea to modulate protein-protein interactions and improve crystallization behavior at lower supersaturation [20]. |
| Stringent Purification | Increase stringency with higher NaCl (up to 2M) or imidazole concentrations to remove impurities, followed by dialysis to remove salt [49]. |
Protein Degradation and Instability
| Problem Cause | Recommended Solution |
|---|---|
| Protease Activity | Perform all purification steps at 4°C and include a cocktail of protease inhibitors during cell lysis [49] [48]. |
| Sample Handling | Avoid repeated freeze-thaw cycles. Grind samples in liquid nitrogen and store at -80°C [48]. |
| Degradation During Lysis | For plant proteins, the inherent complexity of tissues and secondary metabolites can compromise stability; use cost-effective, rapid one-step purification to minimize processing time [50]. |
High Background and Impurities
| Problem Cause | Recommended Solution |
|---|---|
| Insufficient Washing | Add extra wash steps or optimize wash buffer composition (e.g., include 0.1% NP-40 to reduce non-specific binding) [49] [48]. |
| Co-eluting Contaminants | Increase purification stringency with NaCl or imidazole. Perform a second round of purification for higher purity [49]. |
| Resin Contamination | If resin freezes and forms clumps, it may be non-functional. Strip and recharge Ni2+ columns with NiSO4 if discolored [49]. |
Frequently Asked Questions (FAQs)
What are the first steps to take when I cannot detect my protein in the elution fraction?
First, verify that your protein is being expressed by checking induction or using a tag-specific antibody [48]. If expressed, ensure the protein is soluble and has not aggregated in the column by adjusting buffer conditions. Finally, confirm your elution buffer is freshly prepared and of the correct composition and pH [49] [48].
How can I prevent my protein from degrading during purification?
The key is to work quickly and keep everything cold. Perform all steps at 4°C and always use protease inhibitors in your lysis buffer. Handle samples gently on ice and flash-freeze aliquots for storage at -80°C to avoid degradation from repeated freeze-thaw cycles [49] [48].
How can I improve the solubility of my protein during extraction?
Incorporate mild, non-ionic detergents like NP-40 or Triton X-100 into your binding or lysis buffer [49]. For some proteins, purifying at room temperature can help, but this should only be attempted if the protein is known to be stable at higher temperatures [49]. Modulating solution additives like urea can also help tune protein interactions to favor a soluble state [20].
How can I reduce background contamination and obtain a purer product?
- Optimize wash buffers: Add a low concentration of imidazole (e.g., 10-20 mM) to His-tag purifications during the wash step to displace weakly bound impurities [49].
- Increase stringency: Incorporate a higher concentration of salt (e.g., 250-500 mM NaCl) in your wash buffers [49].
- Re-purify: For critical applications, dialyze the eluted protein and subject it to a second round of purification [49].
Experimental Workflow for Protein Isolation
The following workflow outlines a general pathway for protein purification, from sample preparation to analysis, integrating key troubleshooting checkpoints () to ensure success.
Research Reagent Solutions
This table lists key reagents and materials essential for successful protein purification experiments.
| Reagent/Material | Function | Application Note |
|---|---|---|
| Protease Inhibitors | Prevents proteolytic degradation of the target protein. | Essential in lysis buffer; use throughout purification at 4°C [49] [48]. |
| Imidazole | Competes with His-tagged proteins for resin binding. | Low concentrations (10-20 mM) in wash buffer reduce impurities; high concentrations (250-500 mM) for elution [49]. |
| Triton X-100 / Tween-20 | Non-ionic detergents that help solubilize proteins. | Add at 0.1% to binding or wash buffers to improve solubility and reduce non-specific binding [49]. |
| Urea | A denaturant that modulates protein-protein interactions. | At sub-denaturing concentrations, it can increase solubility and enable crystallization at lower supersaturation [20]. |
| TCEP (Tris(2-carboxyethyl)phosphine) | A reducing agent that breaks disulfide bonds. | Used to keep peptides/proteins reduced for immobilization; more stable than DTT [49]. |
| GFP-Trap | An affinity resin for purifying GFP-fusion proteins. | A cost-effective, homemade option can decrease purification costs up to 60-fold for plant proteins [50]. |
Purification Strategy Diagram
The diagram below contrasts a standard purification approach with an optimized strategy that incorporates specific troubleshooting actions to enhance yield and purity.
Within the context of optimizing protein purity for crystallization research, the systematic refinement of biochemical and physical crystallization parameters is a critical subsequent step. The successful growth of diffraction-quality crystals is profoundly dependent on initial sample quality; a protein must be highly pure (>95%), homogeneous, and stable [51]. This foundation enables the precise manipulation of crystallization conditions—specifically pH, precipitants, and additives—to guide a protein from a soluble state to a well-ordered crystal. This guide details troubleshooting protocols and FAQs to address the specific, common challenges researchers encounter during this optimization process, providing a structured pathway for obtaining high-quality crystals for structural analysis.
Biochemical Foundations for Crystallization
Key Reagents and Their Functions
The following table details essential reagents used in crystallization experiments to modulate sample stability and the crystallization environment.
Table 1: Research Reagent Solutions for Crystallization
| Reagent Category | Specific Examples | Primary Function in Crystallization |
|---|---|---|
| Chemical Reductants | DTT, TCEP, β-Mercaptoethanol | Prevents cysteine oxidation, maintaining protein stability and homogeneity [51]. |
| Precipitants | Ammonium Sulfate, PEGs (various weights), 2-methyl-2,4-pentanediol (MPD) | Reduces protein solubility through salting-out (salts) or macromolecular crowding (polymers) [51]. |
| Buffers | HEPES, Tris, Sodium Acetate, Sodium Phosphate (use with caution) | Maintains pH at a level where the protein is stable, typically near its pI [51] [52]. |
| Additives | Co-factors, substrates, ligands, small molecules, Fab fragments | Enhances stability, orders flexible regions, and mediates crystal contacts [51]. |
| Detergents / Lipids | Various detergents, lipids for Lipid Cubic Phase (LCP) | Solubilizes and stabilizes membrane proteins for crystallization [51] [11]. |
Optimizing Protein Sample Quality
A sample suitable for crystallization is monodisperse, non-aggregated, and highly concentrated. The following workflow outlines the key steps and decision points in preparing a protein sample for crystallization trials.
Figure 1. Protein Sample Preparation Workflow. A systematic workflow for preparing a protein sample for crystallization experiments, from initial assessment to final testing.
Detailed Methodology for Sample Assessment:
- Purity and Stability Analysis: Confirm protein purity of >95% using techniques like SDS-PAGE. Evaluate structural stability using Differential Scanning Fluorimetry (DSF) or Circular Dichroism to identify optimal buffer composition, pH, and stabilizing ligands [51] [52].
- Homogeneity and Monodispersity Check: Use Dynamic Light Scattering (DLS) or Size-Exclusion Chromatography coupled with Multi-Angle Light Scattering (SEC-MALS) to ensure the sample is monodisperse and not prone to aggregation. An ideal sample will show a single, sharp peak [51].
- Concentration and Pre-crystallization Test: Concentrate the protein to a typical range of 5-25 mg/mL using a centrifugal filter [52]. Conduct a sparse-matrix screening test with a handful of crystallization conditions to gauge if the protein concentration is appropriate for larger-scale screening [51].
Systematic Optimization of Physical Parameters
The Crystallization Phase Diagram
Understanding the phase diagram is fundamental to rationally optimizing crystallization conditions. The diagram illustrates the relationship between protein concentration, precipitant concentration, and the resulting states of the solution.
Figure 2. Crystallization Phase Diagram. A conceptual diagram showing the different zones of protein solubility as a function of precipitant concentration, guiding experimental strategy.
Quantitative Data for Optimization
Table 2: Optimization Parameters for Crystallization Conditions
| Parameter | Optimal Range / Common Choices | Rationale & Impact |
|---|---|---|
| pH | 1-2 pH units from protein pI [51] | Impacts ionization of surface residues, affecting electrostatic interactions critical for crystal packing [51]. |
| Salt Concentration | Buffers: < 25 mM; Salts (e.g., NaCl): < 200 mM [51] | Low concentrations enhance stability; high concentrations induce salting-out. Phosphate buffers should be avoided due to insoluble salt formation [51]. |
| Precipitant Synergy | Combinations (e.g., Salt + Organic Solvent) [53] | Mechanistically distinct precipitants can synergize, enhancing crystallization success and enabling novel crystal forms [53]. |
| Reductant Half-Life | Varies with pH (see Table 3) [51] | Critical for maintaining sample stability over long crystallization times (days to months). TCEP is more stable across a wide pH range [51]. |
Table 3: Reductant Selection Guide Based on Solution Half-Life
| Chemical Reductant | Solution Half-Life at pH 6.5 | Solution Half-Life at pH 8.5 |
|---|---|---|
| DTT | 40 hours | 1.5 hours |
| β-Mercaptoethanol (BME) | 100 hours | 4.0 hours |
| TCEP | >500 hours (in non-phosphate buffers, across a wide pH range) [51] |
Troubleshooting Guides & FAQs
Frequently Asked Questions
Q1: My protein is pure according to SDS-PAGE, but I only get precipitate in crystallization trials. What should I check? A1: Purity by SDS-PAGE is necessary but not sufficient. You should investigate:
- Sample Homogeneity: Use DLS or SEC-MALS to check for monodispersity. Aggregates or multiple oligomeric states will lead to precipitate [51].
- Protein Stability: Ensure your buffer contains appropriate stabilizing agents, such as ligands or substrates, and a long-lived reductant like TCEP if your protein has cysteines [51].
- Protein Concentration: Your sample may be overly concentrated, forcing it directly into the precipitation zone of the phase diagram. Dilute the sample and re-test [51].
Q2: How can I distinguish protein crystals from salt crystals? A2: This is a common challenge. Manual inspection can be misleading. Advanced imaging techniques are highly recommended:
- UV-TPEF: Protein crystals contain aromatic amino acids (tryptophan, tyrosine) that fluoresce under UV light, while salt crystals do not [11] [54].
- SONICC: This technique combines Second Harmonic Generation (SHG) and UV-TPEF. SHG is highly specific for non-centrosymmetric protein crystals and can detect microcrystals even in turbid conditions, while UV-TPEF confirms the presence of protein [11] [54].
- Simple Dye Test: Using a dye like IZIT, which specifically stains protein crystals, can provide a quick, though destructive, confirmation [52].
Q3: I have microcrystals, but they don't grow larger. How can I optimize this? A3: Microcrystals often form in the nucleation zone. To promote growth:
- Microseeding: Transfer tiny seed crystals into a fresh, pre-equilibrated drop in the metastable zone. This bypasses the nucleation step and directs energy toward growth [52].
- Optimize Precipitant Concentration: Fine-tune the precipitant concentration downward to shift the condition from the nucleation zone to the metastable zone, favoring growth over new nucleation [51].
- Use Additives: Screen small molecules, ligands, or divalent ions that might stabilize the protein and improve crystal contacts [51].
Q4: What are the key differences between co-crystallization and crystal soaking for ligand binding studies? A4:
Table 4: Co-crystallization vs. Ligand Soaking
| Aspect | Co-crystallization | Ligand Soaking |
|---|---|---|
| Process | Protein is incubated with ligand prior to crystallization [52]. | Ligand is introduced into a pre-formed apo crystal [52]. |
| Accuracy | More accurate for determining correct ligand-binding position [52]. | Crystal packing may occlude the binding site or induce artifacts. |
| Resource Intensity | Time-consuming and costly, often requiring re-optimization for each ligand [52]. | Simpler and faster, as well-diffracting apo crystals already exist. |
| Risk | N/A | Risk of crystal cracking or dissolution if ligand induces conformational changes [52]. |
Advanced Experimental Protocols
Co-crystallization and Microseeding Protocol
This protocol accelerates co-crystal formation and reduces sample consumption [52].
- Protein-Ligand Incubation: Mix the purified protein with a 10- to 1000-fold molar excess of the ligand (relative to its Kd) and incubate on ice for 1-2 hours to ensure complex formation [52].
- Seed Stock Preparation: Using apo-protein crystals, prepare a seed stock by crushing crystals in a stabilizing solution (e.g., reservoir solution with a slightly higher precipitant concentration) using seed beads or a crystal crusher. Perform serial dilution to find the optimal seeding concentration [52].
- Seeded Crystallization Setup: Using the vapor diffusion method, set up crystallization drops. Introduce a small volume of the diluted microseed stock into the protein-ligand solution before mixing with the reservoir solution. The seeds provide nucleation sites to jump-start crystal growth in the metastable zone [52].
High-Throughput Screening with Automation
For laboratories with access to automation equipment, the process can be significantly streamlined.
- Screen Building: Use an instrument like the Formulator to rapidly and precisely dispense custom or commercial crystallization screens into 96- or 1536-well plates [11] [54].
- Drop Setting: Employ a crystallization robot (e.g., NT8 Drop Setter) to set up hanging or sitting drops with high accuracy and minimal volume (nL range), conserving precious protein [11].
- Automated Imaging and Analysis: Place plates in an automated imager (e.g., Rock Imager series) with UV, MFI, or SONICC capabilities for scheduled, hands-off imaging. Integrated AI-based autoscoring models (e.g., MARCO, Sherlock) can then analyze the thousands of resulting images to identify promising hits [11] [54].
FAQs: Addressing Common Experimental Challenges
1. What is the main advantage of using microfluidic seeding over traditional vapor diffusion methods?
Microfluidic seeding directly separates and controls the two key stages of protein crystallization—nucleation and growth—which often have different optimal conditions [55]. In traditional vapor diffusion, supersaturation increases over time, which can prevent the growth of single, high-quality crystals if a "supersaturation gap" exists. Microfluidic platforms address this by performing nucleation at high supersaturation and then precisely transferring the formed seeds into a separate low-supersaturation environment for orderly growth [55]. This method also uses extremely small sample volumes (nanoliter-scale) and allows for precise time control over the nucleation process [55].
2. My protein only forms microcrystalline clusters or precipitate in standard trials. What seeding strategy can help?
This is a classic symptom of a supersaturation gap, and a multi-step seeding strategy can provide a solution [55]. The following protocol has proven successful for recalcitrant proteins like the SARS nucleocapsid protein:
- Step 1: Formulate a highly supersaturated "nucleation condition" plug to generate microcrystalline clusters.
- Step 2: Stop the flow and incubate for several days to allow these clusters to grow.
- Step 3: Re-establish flow to disperse the microcrystals throughout the plug, effectively creating a seed stock.
- Step 4: Inject a tiny volume (less than 1 nL) of this seed stock into many separate plugs containing a low-supersaturation "growth condition." This approach can successfully bridge the supersaturation gap to produce single crystals [55].
3. How can I control the number of crystals that form in each trial?
In microfluidic seeding, the number of crystals is directly influenced by the nucleation time. Research using the model protein thaumatin has demonstrated that longer nucleation times lead to the formation of more seeds. When these seeds are then introduced to the growth stage, they result in a higher number of crystals [55]. By varying the flow rates and channel length in the nucleation stage of the microfluidic device, you can control the nucleation time with sub-second precision, thereby controlling the final crystal count [55].
4. What should I check first if my protein consistently fails to crystallize?
The first factor to investigate is sample purity and homogeneity [56]. Impurities or protein aggregates can severely disrupt the formation of a regular crystal lattice.
- Solution: Ensure your protein sample has a high purity level (>95%) and is monodisperse. Employ multi-step chromatography and use dynamic light scattering (DLS) to check for aggregation before proceeding to crystallization trials [56].
Troubleshooting Guides
Guide 1: Overcoming the Supersaturation Gap
| Problem Observed | Root Cause | Solution Strategies | Key References |
|---|---|---|---|
| Only microcrystalline clusters or precipitate form at high supersaturation; no crystals form at low supersaturation. | A "supersaturation gap" exists: conditions for nucleation and growth do not overlap. [55] | - Use time-controlled microfluidic seeding to separate nucleation and growth stages. [55] - Employ cross-seeding using microcrystals from similar proteins or protein-ligand complexes. [55] - Utilize functionalized nanoparticles to lower the nucleation energy barrier. [57] | [55] |
Guide 2: Optimizing Crystal Quality and Size
| Problem Observed | Root Cause | Solution Strategies | Key References |
|---|---|---|---|
| Crystals are too small, clustered, or show poor diffraction quality. | Uncontrolled nucleation leads to too many crystals; growth conditions are sub-optimal. [55] [56] | - Perform post-crystallization treatments like controlled dehydration to improve lattice order. [56] - Use Microseed Matrix Screening (MMS) to optimize growth conditions around pre-formed seeds. [56] - Soak crystals in solutions with cryoprotectants or stabilizing ligands. [56] | [55] [56] |
Experimental Protocol: Time-Controlled Microfluidic Seeding
This protocol details the method for separating nucleation and growth using a plug-based microfluidic system, as successfully used to solve the de novo structure of Oligoendopeptidase F [55].
Objective
To grow single, diffraction-quality protein crystals by independently controlling the nucleation and growth stages in nL-volume droplets.
Materials and Equipment
- Protein Sample: Purified and concentrated (>95% purity, monodisperse).
- Precipitant Solutions: Solutions for high-supersaturation (nucleation) and low-supersaturation (growth).
- Microfluidic Device: Fabricated via soft lithography, featuring flow channels for generating aqueous plugs and a mechanism for merging plugs from nucleation and growth stages [55].
- Fluorocarbon Carrier Fluid: To surround and transport the aqueous plugs.
- Glass Microcapillaries: For incubating and observing plugs [55].
- Syringe Pumps: For precise control of flow rates.
Procedure
Formulate Solutions: Prepare two distinct solutions:
- Nucleation Condition: A highly concentrated mixture of protein and precipitants designed to induce rapid formation of seed crystals (which may be microscopic or even liquid) [55].
- Growth Condition: A lower-concentration mixture of protein and precipitants conducive to the slow, ordered growth of a single crystal [55].
Generate Seed Plugs: Flow the nucleation condition solution into the microfluidic device to form a stream of nL-volume plugs, surrounded by the carrier fluid [55].
Control Nucleation Time: Allow nucleation to proceed for a controlled duration (e.g., 3-15 seconds for thaumatin) by adjusting the flow rate and the length of the nucleation-stage channel [55].
Merge with Growth Plugs: Precisely merge each seed-containing plug from the nucleation stage with a new, larger plug formed from the growth condition solution within the microfluidic device [55].
Incubate and Observe: Flow the merged plugs into a glass microcapillary. Store the capillary under stable conditions and monitor plug contents for crystal growth over hours to days [55].
The table below summarizes key quantitative findings from microfluidic seeding studies.
Table 1: Quantitative Outcomes of Microfluidic Seeding Strategies
| Protein / System | Nucleation Time | Volume per Plug | Key Outcome | Reference |
|---|---|---|---|---|
| Thaumatin | 3 - 15 seconds | 20 - 100 nL | Single crystals grew; number of crystals correlated with nucleation time. [55] | [55] |
| Oligoendopeptidase F | Several days (seed growth) | ~1 nL seed in 20-100 nL growth plug | Dozens of single crystals obtained; structure solved at 3.1 Å. [55] | [55] |
| Lysozyme with functionalized nanoparticles | N/A | N/A | Up to 7-fold decrease in induction time; 3-fold increase in nucleation rate. [57] | [57] |
| CdSe Quantum Dots (Cluster seed method) | N/A | 240 µL (nucleation), 80 µL (growth) | Enabled synthesis at significantly lower temperatures (100-120°C). [58] | [58] |
Workflow Visualization
The following diagram illustrates the logical workflow and key components of the microfluidic seeding process.
Microfluidic Seeding Workflow
The Scientist's Toolkit: Research Reagent Solutions
Table 2: Essential Materials for Advanced Nucleation Control Experiments
| Item | Function in Experiment |
|---|---|
| Fluorocarbon Carrier Fluid | Immiscible fluid that surrounds aqueous plugs, preventing cross-contamination and enabling transport through microchannels. [55] |
| Organometallic Cluster Seeds (e.g., (NMe4)4[Cd10Se4(SPh)16]) | Acts as a nucleation catalyst, enabling crystal synthesis at lower temperatures by reducing the energy required for nucleation. [58] |
| Bioconjugate-functionalized Nanoparticles | Surfaces that promote heterogeneous nucleation, significantly decreasing induction time and increasing nucleation rates. [57] |
| Lipid Cubic Phase (LCP) | A membrane-mimetic environment used to stabilize membrane proteins and facilitate their crystallization. [56] |
| Selenium-substituted Methionine (Se-Met) | Used for experimental phasing in X-ray crystallography via single-wavelength anomalous diffraction (SAD). [56] |
Leveraging Automation and High-Throughput Screening for Condition Optimization
Frequently Asked Questions (FAQs)
FAQ 1: What are the primary causes of workflow failure in automated protein purification? Workflow failures most commonly stem from issues outside the workflow itself if it was previously functional. These include an unhealthy orchestrator (the computer running the automation), expired or incorrect credentials for connected systems or instruments, and errors in the trigger configuration that monitors for new events [59]. Problems with data quality, such as inconsistent formats between systems, can also cause workflows to fail [60].
FAQ 2: My liquid handler is failing during pipetting steps. What should I check? First, verify the health of the automation system's orchestrator [59]. Next, check for common liquid handling issues: ensure all labware is correctly seated and calibrated, confirm that tips are properly seated and not blocked, and check that liquid levels in source containers are sufficient to avoid aspirating air. Review the protocol to ensure that volumes are within the pipette's operational range.
FAQ 3: I am not getting any protein yield after affinity purification. What are the likely causes? Low yield can result from several factors:
- Expression Check: Verify that the protein was expressed at the expected level by analyzing cell lysate via SDS-PAGE.
- Binding Efficiency: Ensure the binding buffer pH and ionic strength are compatible with your affinity tag (e.g., His-tag requires a neutral pH and low imidazole concentration).
- Resin/Ligand Issues: Check if the affinity resin (e.g., Ni-NTA, Strep-TactinXT) is functional and not saturated or degraded. For magnetic beads, ensure they are fully resuspended and not lost during washing [61] [62].
- Elution Conditions: Confirm that the elution buffer is correct (e.g., high imidazole for His-tag, biotin for Strep-tag) and that the contact time during elution is sufficient.
FAQ 4: My purified protein is impure, which hinders crystallization. How can I improve purity? Consider these steps to enhance purity:
- Optimize Wash Stringency: Increase the salt concentration or add low levels of imidazole (e.g., 10-20 mM) to the wash buffer to remove weakly bound contaminants without eluting your target protein.
- Implement a Multi-Tag Strategy: Use a second affinity tag (e.g., a Twin-Strep-tag followed by a His-tag) for tandem purification, which significantly increases specificity and purity [62].
- Include a Protease Cleavage Step: Fuse your target protein to an affinity tag via a protease cleavage site (e.g., SUMO/Smt3). After the initial capture and wash, the tag can be cleaved off, separating the pure target protein from the tagged impurities still bound to the resin [63].
FAQ 5: What are the key considerations when scaling down purification to a 96-well format? Miniaturization presents specific challenges. Key considerations include ensuring adequate culture aeration in deep-well plates, avoiding cross-contamination between wells, managing evaporation in small volumes, and achieving a final protein concentration high enough for downstream assays. Using a protease cleavage step for elution, instead of imidazole, can help avoid the need for a buffer exchange step, which is challenging at small volumes [63].
Troubleshooting Guides
Guide 1: Troubleshooting Automated Workflow Failures
This guide addresses general failures in automated execution platforms.
| Problem | Possible Cause | Solution |
|---|---|---|
| Workflow not triggering [59] | Misconfigured trigger (e.g., monitoring wrong data source). Unhealthy orchestrator. | Verify trigger configuration. Check orchestrator health status in settings. |
| Intermittent workflow failure [59] | Unstable network connection. Timeout errors from a slow-responding service. | Check network connectivity and orchestrator health. Increase timeout thresholds for specific steps if possible. |
| Step failure due to permissions [59] | Incorrect credentials or expired API keys. | Run a connection test for all plugins and connections used. Update credentials. |
| "Input is incorrect" error [59] | Previous step is returning unexpected or malformed data. | Examine the input and log tabs of the failed step. Check the output of the preceding step for data inconsistencies. |
| Workflow creates more errors/work [60] | Automating a fundamentally broken or inefficient manual process. | Audit and optimize the manual process before automating it. Challenge the necessity of every step. |
Debugging Protocol:
- Check Job History: Locate the failed job in the platform's "Jobs" or "Run history" section [59] [64].
- Identify Failed Step: In the job details, find the last step that failed.
- Examine Inputs: In the failed step's "Input" tab, verify the data is what you and the tool expect. Incorrect input usually points to an issue with a previous step [59].
- Review Logs: The "Logs" tab contains diagnostic error messages from the underlying service, which are crucial for identifying the root cause (e.g., "permission denied," "timeout," "invalid format") [59].
Guide 2: Troubleshooting High-Throughput Protein Purification
This guide focuses on issues specific to automated, small-scale protein purification.
| Problem | Possible Cause | Solution |
|---|---|---|
| Low or no yield across all wells | Failed protein expression. Inefficient cell lysis. | Check expression levels via SDS-PAGE of lysates. Optimize lysis conditions (e.g., lysozyme concentration, incubation time). |
| Inconsistent yield between replicates | Inconsistent cell culture growth. Poor pipetting accuracy during resin handling. | Ensure even culture aeration and growth. Check liquid handler calibration for pipetting and mixing steps. |
| Low binding to affinity resin | Incorrect binding buffer pH/conditions. Affinity tag not accessible. | Confirm binding buffer compatibility with the tag. Test different construct designs (e.g., tag at N- or C-terminus). |
| High impurity levels | Insufficient washing. Non-specific binding. | Increase number or volume of wash steps. Add mild detergent or competitive agent to wash buffer. |
| Clogging of tips/columns | Particulate matter in lysate. | Centrifuge or filter lysate before loading onto resin. |
Debugging Protocol:
- Analyze the Lysate: Run an SDS-PAGE gel of the initial cell lysate to confirm the target protein is present and expressed at the expected molecular weight.
- Check the Flow-Through: Analyze the flow-through from the binding step. If your target protein is present here, the issue is with binding efficiency.
- Inspect the Eluate: Analyze the final elution fraction. If impurities are present, the issue lies with the wash steps or the specificity of the affinity resin.
- Verify Robot Operations: Visually inspect the run to ensure proper tip attachment, liquid aspiration/dispensing, and mixing. Review the protocol for any logical errors in liquid handling.
Guide 3: Troubleshooting Protein Crystallization Failure Post-Purification
Crystallization failure can often be traced back to the quality of the purified protein sample.
| Problem | Possible Cause | Solution |
|---|---|---|
| No crystals formed | Protein impurity or heterogeneity. Protein degradation. | Improve purification (see FAQ 4). Add protease inhibitors during purification. Check sample monodispersity via DLS. |
| Amorphous precipitate only | Protein concentration too high. Overly harsh crystallization conditions. | Screen a wider range of protein concentrations. Use finer screening grids around promising conditions. |
| Micro-crystals (showers) | Very rapid nucleation. | Optimize kinetics using seeding or reduce nucleation rate with additives like ionic liquids [65]. |
| Poorly diffracting crystals | Crystal disorder or internal defects. | Optimize crystal growth by slower vapor diffusion or try different cryoprotectants. |
Debugging Protocol:
- Assess Protein Purity and Stability: Use analytical size-exclusion chromatography (SEC) and dynamic light scattering (DLS) to confirm the protein is >95% pure, monodisperse, and stable in the crystallization buffer.
- Verify Protein Concentration: Ensure the protein concentration is accurate and within an optimal range for crystallization trials.
- Review Crystallization Screen: Ensure a broad, diverse set of conditions is being screened, and that the screen plates are properly set up and stored.
- Check for Contamination: Rule out microbial contamination in the protein stock or crystallization drops.
Quantitative Data for Automated Purification
Table 1: Comparison of High-Throughput Protein Purification Methods [61] [62]
| Method | Typical Scale / Format | Key Equipment | Key Advantages | Considerations |
|---|---|---|---|---|
| Magnetic Beads | 96-well plate | Liquid handler, magnetic separator | Gentle handling, easy separation, minimal bead loss | Binding capacity can be limited |
| PhyTip Columns | 5-20 µL resin in a pipette tip | Specific liquid handling system (e.g., Hamilton STAR) | High efficiency via repeated flow, mix media in same rack | Requires compatible liquid handler |
| Gravity Columns | 200 µL resin in 96-column array | Customized robotic platform (e.g., Tecan EVO) | Scalable from manual methods, larger bed volumes | Requires custom adapter on robot deck |
| Batch-Binding | 24-deep well plate with filter | Liquid handler with vacuum manifold | Simple protocol, good for difficult proteins | Can be less efficient than column methods |
Table 2: Market Trends in Protein Crystallization (as of 2024-2025) [66] [36]
| Trend | Impact on CAGR (Forecast) | Key Driver |
|---|---|---|
| AI Integration | Not quantified (Significant) | Boosting first-attempt crystallization success via predictive algorithms |
| Automation & Microfluidics | 11.73% (Microfluidic segment) | Dramatically reduces sample volume and screening time |
| Rising Biopharma R&D | +1.8% (Overall market) | Demand for atomic-level structural data for drug candidates |
| Growth of CROs | 10.24% (CRO segment) | Outsourcing by pharmaceutical and biotechnology companies |
Experimental Protocols
Protocol 1: Low-Cost, Robot-Assisted High-Throughput Protein Purification
This protocol is adapted for a low-cost liquid handler (e.g., Opentrons OT-2) and a 96-well format [63].
Key Research Reagent Solutions:
- Affinity Resin: Ni-charged magnetic beads for His-tagged protein purification.
- Lysis Buffer: 50 mM Tris-HCl, pH 8.0, 300 mM NaCl, 10 mM Imidazole, 1 mg/mL Lysozyme, and protease inhibitors.
- Wash Buffer: 50 mM Tris-HCl, pH 8.0, 300 mM NaCl, 20-25 mM Imidazole.
- Elution Buffer: 50 mM Tris-HCl, pH 8.0, 300 mM NaCl, 250-500 mM Imidazole. Alternatively, for scarless elution, use a protease cleavage buffer with SUMO protease.
Detailed Methodology:
- Transformation & Expression:
- Transform competent E. coli directly in a 96-well plate using a commercial kit (e.g., Zymo Mix & Go!) and grow for ~40 hours at 30°C in autoinduction media to saturation.
- Inoculate 2 mL of expression media in a 24-deep-well plate from the starter culture. Incubate with shaking for 24-48 hours at appropriate temperature.
- Cell Harvest and Lysis:
- Centrifuge the deep-well plate to pellet cells. Discard the supernatant.
- Resuspend cell pellets in Lysis Buffer using the liquid handler.
- Incubate the plate with shaking for 30-60 minutes to complete lysis.
- Clarification:
- Centrifuge the lysate plate at high speed to pellet cell debris.
- The liquid handler transfers the clarified supernatant to a new deep-well plate.
- Affinity Purification (Magnetic Beads):
- Equilibration: Transfer magnetic beads to the plate and wash with Lysis Buffer.
- Binding: Incubate the clarified lysate with the equilibrated beads for 30-45 minutes with mixing.
- Washing: Apply a magnet to separate beads from supernatant. Remove supernatant and perform 3-4 wash steps with Wash Buffer.
- Elution: Elute the target protein by either: a) Chemical Elution: Adding Elution Buffer and incubating with mixing for 15 minutes. b) Protease Cleavage: Adding protease in a suitable buffer and incubating overnight at 4°C.
- Separation and Storage:
- Apply the magnet and transfer the eluate (containing the purified protein) to a final storage plate.
- The purified protein can be used directly for crystallization trials or buffer exchanged if necessary.
Protocol 2: Automated Screening of Crystallization Conditions
Key Research Reagent Solutions:
- Crystallization Screen Kits: Commercial sparse-matrix screens (e.g., from Hampton Research, Molecular Dimensions).
- Precipitant Solutions: Stock solutions of common precipitants like PEGs, salts, and organic solvents.
- Protein Buffer: A low-salt, non-detergent buffer compatible with a wide range of crystallization conditions.
Detailed Methodology:
- Sample Preparation: Concentrate the purified protein to 5-20 mg/mL and centrifuge to remove any aggregates immediately before setting up trials.
- Liquid Handler Setup: Program the liquid handler to dispense nanoliter-scale volumes (e.g., 100 nL protein + 100 nL precipitant solution) using crystallography-optimized liquid handling instruments (e.g., SPT Labtech's mosquito crystal).
- Plate Setup: Use 96-well sitting-drop or hanging-drop vapor diffusion plates.
- Dispensing:
- The robot dispenses different precipitant solutions from the screen kit into the reservoir of each well.
- It then dispenses a drop of the protein solution and a drop of the precipitant solution onto the crystallization plate, mixing them.
- Incubation and Monitoring: Seal the plates and incubate at a constant temperature. Monitor the drops automatically using an imaging system at regular intervals to track crystal growth.
Workflow and Troubleshooting Diagrams
Automated Workflow Troubleshooting Path
Automated High-Throughput Purification
Troubleshooting Guides and FAQs
Why is my membrane protein precipitating or forming aggregates during purification?
Answer: Precipitation and aggregation are common issues caused by the exposure of hydrophobic regions once the protein is removed from its native lipid bilayer environment [67]. This is a fundamental challenge in membrane protein research.
Solutions:
- Optimize Detergent Use: Ensure the detergent is above its critical micelle concentration (CMC) and is appropriate for your protein. Lauryl Maltose Neopentyl Glycol (LMNG) is often favored for creating smaller, more uniform micelles and enhancing protein stability [68].
- Utilize Lipid Mimetics: Consider transferring your protein into a more native-like environment, such as:
- Lipid Nanosheets: These mimic the lipid bilayer, preventing aggregation and helping to maintain the protein's native conformation [67].
- Nanodiscs: These are nanoscale phospholipid bilayers stabilized by a membrane scaffold protein (MSP), which can enhance stability and functionality [68].
- Amphipols or SMALPs: Amphipathic polymers like Styrene Maleic Acid (SMA) can form lipid-containing nanodiscs spontaneously, often retaining native lipids that are crucial for stability [68].
- Employ Stabilizing Agents: Include additives like glycerol (typically below 5% v/v) in your buffers, or use stabilizing agents and fusion partners that can lock the protein into a stable conformation [1] [67].
What can I do if my membrane protein fails to crystallize or yields poor-quality crystals?
Answer: Crystallization failure often stems from protein flexibility, heterogeneity, or the presence of detergent micelles that interfere with ordered crystal lattice formation [68] [1].
Solutions:
- Improve Sample Homogeneity: A purity of >95% is typically required. Use techniques like Size Exclusion Chromatography (SEC) and Dynamic Light Scattering (DLS) to ensure your sample is monodisperse and free of aggregates [1] [69].
- Engineer a More Stable Protein Construct:
- Remove Flexible Regions: Use bioinformatics tools (e.g., AlphaFold3) or limited proteolysis to identify and truncate disordered loops and termini [1] [69].
- Introduce Stabilizing Mutations: Surface entropy reduction (SER) mutations or thermostabilizing mutations can reduce flexibility and promote crystal contacts [69].
- Explore Alternative Crystallization Methods:
- LCP Crystallization: The lipidic cubic phase method provides a more native lipid environment for crystallization.
- Co-crystallization with Ligands or Antibodies: Adding a substrate, inhibitor, or antibody fragment can stabilize a specific conformational state, making the protein more amenable to crystallization [1] [69].
How does detergent choice impact my Cryo-EM or crystallography results?
Answer: The intrinsic properties of the detergent directly affect protein stability, particle homogeneity, and the quality of the data you can collect. Suboptimal detergents can lead to denaturation, preferred orientation in Cryo-EM grids, or poor ice quality [68].
Solutions:
- Select "Mild" Detergents: For initial solubilization, non-ionic detergents like n-Dodecyl-β-D-maltose (DDM) and β-octyl-glucoside (BOG) are standard choices known for their ability to maintain protein stability [68].
- Consider Advanced Detergents for Structural Studies: For high-resolution work, newer detergents often offer superior properties:
- Evaluate Micelle Size: For smaller membrane proteins, a detergent like n-dodecyl-β-melibioside (β-DDMB), which forms smaller micelles than DDM, might be beneficial [68].
Essential Research Reagent Solutions
The table below details key reagents used in the purification and stabilization of membrane proteins for structural studies.
Table: Key Reagents for Membrane Protein Research
| Reagent Category | Specific Examples | Function and Application |
|---|---|---|
| Detergents | DDM, LMNG, GDN, Digitonin [68] | Solubilize membrane proteins from the lipid bilayer and maintain solubility in aqueous solutions by forming protective micelles. |
| Lipid Mimetics | Nanodiscs (MSP-based), SMALPs, Amphipols, Lipid Nanosheets [68] [67] | Provide a stable, bilayer-like environment that helps maintain the native structure and function of the membrane protein. |
| Stabilizing Agents & Fusion Tags | Maltose-Binding Protein (MBP), His-tag, TCEP, Glycerol [1] [69] | Enhance protein solubility, improve stability during purification, prevent aggregation, and assist in crystallization. |
| Polymer Additives | Polyethylene Glycols (PEGs) [1] | Promote crystallization by inducing macromolecular crowding and reducing protein solubility, driving the system toward supersaturation. |
Experimental Protocol: Optimizing Membrane Protein Constructs for Crystallization
A rational construct design is a critical first step to increase the likelihood of successful crystallization [69].
Step 1: Identify and Remove Flexible Regions
- Method: Use bioinformatics tools like DISOPRED, IUPred, or AlphaFold3 to predict intrinsically disordered regions and flexible loops in your protein sequence [1] [69].
- Protocol: Perform limited proteolysis on the full-length protein. Incubate the protein with a low concentration of a non-specific protease (e.g., trypsin or subtilisin) at 4°C for a short time. Quench the reaction and analyze the fragments by SDS-PAGE and mass spectrometry to identify stable proteolytic cores [69].
Step 2: Engineer Stabilizing Mutations
- Surface Entropy Reduction (SER):
- Method: Identify surface-exposed clusters of flexible, high-entropy residues (e.g., Lys, Glu, Gln). Design mutants where these are replaced with smaller, more ordered residues (e.g., Ala, Ser, Thr) to facilitate crystal contact formation [69].
- Thermostabilizing Mutations:
- Method: For proteins like GPCRs, introduce point mutations that increase the protein's thermal stability, often locking it into a specific conformational state. This can be guided by structural data or alanine-scanning mutagenesis [69].
Step 3: Utilize Fusion Tags and Cleavage Sites
- Method: Clone the target gene with an N- or C-terminal fusion tag (e.g., His-tag for purification, MBP or SUMO for solubility) [69].
- Protocol: Include a specific protease recognition site (e.g., for TEV protease) between the fusion tag and the target protein. After affinity purification, incubate the protein with the protease to remove the tag. A final purification step (e.g., SEC) is required to separate the cleaved protein from the tag and protease [69].
Experimental Workflow: From Membrane to Structure
The following diagram outlines the key decision points in selecting a strategy for membrane protein structural analysis.
Diagram: Strategy Selection for Membrane Protein Structural Analysis
Quantitative Data for Experimental Planning
Table: Properties of Common Detergents in Structural Biology
| Detergent | Type | Key Characteristics | Common Applications |
|---|---|---|---|
| DDM | Non-ionic Maltoside | Mild, widely used standard, good for initial solubilization and purification [68]. | General purification, initial Cryo-EM screening. |
| LMNG | Maltose-Neopentyl Glycol (MNG) | Low CMC, small/uniform micelles, enhances stability, improves Cryo-EM image quality [68]. | High-resolution Cryo-EM, stabilizing proteins for crystallography. |
| GDN / Digitonin | Glycosidic | Considered mild, often used for particularly sensitive complexes like ion channels [68]. | Cryo-EM of delicate complexes. |
| SDS | Ionic | Harsh, denatures most proteins; generally avoided for functional studies [68]. | Denaturing gel electrophoresis (not for structural studies). |
Table: Solution Half-Lives of Common Biochemical Reducing Agents
| Chemical Reductant | Solution Half-life (pH 6.5) | Solution Half-life (pH 8.5) |
|---|---|---|
| Dithiothreitol (DTT) | 40 hours | 1.5 hours |
| β-Mercaptoethanol (BME) | 100 hours | 4.0 hours |
| Tris(2-carboxyethyl)phosphine (TCEP) | >500 hours (pH 1.5–11.1, in non-phosphate buffers) [1] | >500 hours (pH 1.5–11.1, in non-phosphate buffers) [1] |
Assessing Crystallization Success and Sample Quality Through Validation Metrics
Protein Quality Assessment: Key Metrics and Benchmarks
Before initiating crystallization trials, it is essential to quantitatively assess your protein sample against a set of well-defined quality control benchmarks. The following metrics are critical indicators of crystallization-readiness. [51]
Quantitative Quality Control Standards
Table 1: Key Quantitative Benchmarks for Crystallization-Ready Protein
| Metric Category | Target for Crystallization | Recommended Assessment Method |
|---|---|---|
| Purity | >95% Homogeneity [51] | SDS-PAGE, Mass Spectrometry [70] |
| Sample Homogeneity | Monodisperse population (low polydispersity index) [51] | Dynamic Light Scattering (DLS), SEC-MALS [51] |
| Structural Integrity & Stability | Retained secondary structure; High melting temperature (Tm) | Circular Dichroism (CD), Thermal Shift Assay (DSF) [70] |
| Solubility | High solubility in simple buffer; No aggregation at target concentration [51] | DLS, Size-Exclusion Chromatography (SEC) [51] |
Biochemical Composition and Buffer Considerations
The chemical environment of your protein sample must be carefully controlled to maintain stability throughout the often lengthy crystallization process. [51]
Table 2: Optimal Biochemical and Buffer Conditions for Crystallization
| Buffer Component | Recommended Specification | Rationale & Notes |
|---|---|---|
| Buffer Concentration | ∼25 mM or below [51] | Minimizes interference with crystallization cocktails |
| Salt Concentration | <200 mM (e.g., Sodium Chloride) [51] | Reduces chance of premature salting-out |
| Glycerol Content | <5% (v/v) in final crystallization drop [51] | Higher concentrations can impede crystal nucleation |
| Chemical Reductants | TCEP preferred for long-term stability [51] | See Table 3 for half-life comparison |
| Avoid | Phosphate buffers [51] | Prone to forming insoluble salts |
Table 3: Comparing Common Reducing Agents
| Chemical Reductant | Solution Half-Life (pH 6.5) | Solution Half-Life (pH 8.5) |
|---|---|---|
| Dithiothreitol (DTT) | 40 hours | 1.5 hours |
| β-Mercaptoethanol (BME) | 100 hours | 4.0 hours |
| Tris(2-carboxyethyl)phosphine hydrochloride (TCEP) | >500 hours (across pH 1.5–11.1 in non-phosphate buffers) [51] | >500 hours (across pH 1.5–11.1 in non-phosphate buffers) [51] |
Troubleshooting Guide: FAQs on Common Crystallization Issues
FAQ: My protein is pure by SDS-PAGE, but no crystals form. What is the likely cause?
SDS-PAGE confirms purity but not conformational homogeneity. The issue likely lies in sample heterogeneity or instability. [51]
- Potential Cause 1: Flexible Regions or Impurities. Flexible termini, disordered regions, or minor populations of misfolded protein or isoforms can prevent orderly lattice formation. [51]
- Solution: Improve construct design. Use bioinformatics tools (e.g., DISOPRED, IUPred) or experimental methods like limited proteolysis to identify and remove flexible regions. AlphaFold3 is an excellent resource to guide construct design by eliminating floppy regions. [51] [70] Introduce surface entropy reduction (SER) mutations to create more stable surface patches conducive to crystal contacts. [70]
- Potential Cause 2: Inadequate Sample Stability. Crystals can take days to months to nucleate. If the protein denatures or aggregates over time, nucleation cannot occur. [51]
- Solution: Perform rigorous stability assessment using Differential Scanning Fluorimetry (DSF) or Circular Dichroism (CD). Identify and include necessary ligands, cofactors, or stabilizing metals in the buffer. Use TCEP as a long-lasting reductant for cysteine-containing proteins. [51]
FAQ: Crystals form, but they are small, clustered, or do not diffract well. How can I improve crystal quality?
This often points to issues with the crystallization process itself or final sample quality.
- Potential Cause: Rapid Nucleation. Too many nucleation sites lead to many small, intergrown crystals instead of large, single ones. [71]
- Solution: Optimize the crystallization process. If crystallization occurs too quickly, consider reducing your protein concentration slightly or using a less saturated precipitant condition. Seeding techniques can also be used to control nucleation. [71] Ensure your protein concentration is appropriate; an overly concentrated sample yields only precipitation, while an under-concentrated one will not nucleate. [51]
- Potential Cause: Sample Degradation or Impurity. Even minor impurities or heterogeneity can disrupt the long-range order of the crystal lattice, leading to poor diffraction. [51]
- Solution: Re-assess homogeneity immediately before crystallization using DLS or SEC. A monodisperse peak is essential. Ensure your protein is stable over the timeframe of crystal growth. [51]
FAQ: How can I optimize the crystallization screening process to increase the chance of success?
Finding crystallization conditions remains a primary bottleneck, and success is strongly correlated with the number of conditions tested. [51]
- Strategy: Employ Sparse-Matrix Screening. Start with a broad, sparse-matrix screen to sample a diverse chemical space of precipitants, buffers, and additives. [51] Commercially available screens from companies like Hampton Research or Molecular Dimensions are designed for this purpose. [36]
- Strategy: Leverage Bioinformatics and Automation. Mine the Protein Data Bank (PDB) for crystallization conditions used for homologous proteins to inform your initial screening. [51] Utilize liquid handling robots (e.g., Opentrons) to set up high-throughput, reproducible crystallization trials, reducing manual labor and variability. [72] The integration of AI and automation is a key trend for optimizing crystallization condition prediction. [66] [36] [73]
Diagram 1: Crystallization-Readiness Workflow
Experimental Protocols for Key Quality Control assays
Protocol: Thermal Shift Assay (Differential Scanning Fluorimetry)
Purpose: To rapidly assess protein stability and identify optimal buffer conditions, ligands, or pH by measuring the protein's melting temperature (Tm). [70]
Materials:
- Real-Time PCR instrument
- Fluorescent dye (e.g., SYPRO Orange)
- Protein sample in various buffer conditions
- Multi-well PCR plate
Method:
- Prepare a master mix containing your protein and the fluorescent dye.
- Dispense the master mix into the PCR plate wells.
- Add different buffer components, ligands, or additives to individual wells.
- Run a temperature gradient (e.g., from 25°C to 95°C) in the PCR instrument while monitoring fluorescence.
- The dye binds to hydrophobic regions of the protein as it unfolds, causing a fluorescence increase.
- Analyze the data to determine the Tm for each condition. The condition with the highest Tm is the most stabilizing.
Protocol: Dynamic Light Scattering (DLS)
Purpose: To evaluate sample homogeneity, monodispersity, and detect aggregation in solution. [51] [70]
Materials:
- Dynamic Light Scattering instrument
- Clean, dust-free cuvettes
- Clarified protein sample
Method:
- Filter and centrifuge your protein sample to remove any dust or large aggregates.
- Load the sample into a clean DLS cuvette.
- Place the cuvette in the instrument and set the measurement temperature.
- The instrument analyzes fluctuations in scattered light to determine the hydrodynamic radius of particles in solution.
- Interpret results: A single, sharp peak indicates a monodisperse sample ideal for crystallization. Multiple peaks or a broad peak suggests heterogeneity or aggregation.
The Scientist's Toolkit: Essential Research Reagent Solutions
Table 4: Key Reagents and Kits for Protein Crystallization Research
| Reagent / Kit Type | Primary Function | Example Suppliers |
|---|---|---|
| Crystallization Screening Kits | Broad, sparse-matrix screens to identify initial crystallization conditions. | Hampton Research, Molecular Dimensions, Jena Bioscience [66] [36] |
| Affinity Purification Resins | Initial capture and purification of tagged recombinant proteins (e.g., His-tag, GST-tag). | Thermo Fisher Scientific, GE Healthcare, Qiagen [36] [70] |
| Proteases for Tag Cleavage | Removal of affinity tags (e.g., His-tag, MBP) that may interfere with crystallization. | Thermo Fisher Scientific (TEV, Thrombin) [70] |
| Chemical Reductants | Maintain cysteine residues in reduced state; prevent disulfide-mediated aggregation. | TCEP, DTT (Thermo Fisher Scientific, Hampton Research) [51] |
| Crystallography Plates & Consumables | Platforms for setting up vapor-diffusion experiments (sitting-drop, hanging-drop). | Greiner Bio-One, Hampton Research, Corning [66] [74] |
| Cryoprotectants | Protect crystals from ice damage during cryo-cooling prior to X-ray data collection. | Hampton Research, Molecular Dimensions [66] |
Comparative Analysis of Crystal Morphology and Diffraction Characteristics
Troubleshooting Guides
Guide 1: Troubleshooting Poor Crystal Growth
Problem: Protein fails to form crystals or only forms precipitate or microcrystals.
| Observed Outcome | Potential Cause | Recommended Solution |
|---|---|---|
| No crystals, only clear drop | Undersaturated protein solution [75] | Increase protein or precipitant concentration. |
| Protein concentration too low [75] | Concentrate protein sample; aim for typical range of 5-20 mg/mL [75]. | |
| Amorphous precipitate | Supersaturation reached too rapidly [2] | Reduce precipitant concentration; use gentler precipitans. |
| Protein impurity or heterogeneity [76] [77] | Re-optimize purification for >95% purity; use multi-step chromatography (Affinity, IEX, SEC) [76]. | |
| Only microcrystals | Excessive nucleation sites [2] | Use seeding techniques (e.g., Microseed Matrix Screening) [77]. |
| Inhomogeneous protein sample [77] | Improve sample homogeneity via size-exclusion chromatography (SEC) or dynamic light scattering (DLS) analysis [76] [75]. |
Experimental Protocol: Optimizing Purity and Homogeneity
- Purification: Employ a multi-step purification strategy. Start with affinity chromatography (e.g., IMAC for His-tagged proteins), followed by ion-exchange chromatography (IEX), and final polishing with size-exclusion chromatography (SEC) to remove aggregates and ensure monodispersity [76].
- Assessment: Analyze the purified protein using SDS-PAGE for purity and dynamic light scattering (DLS) to confirm a monodisperse population with minimal aggregation [76] [75].
- Concentration: Concentrate the protein to 5-20 mg/mL in a stabilizing buffer, avoiding high concentrations of additives like glycerol (keep below 5% v/v) or imidazole, which can be removed via dialysis or SEC [17] [75].
Guide 2: Troubleshooting Poor Diffraction Quality
Problem: Crystals grow but diffract poorly or not at all.
| Observed Outcome | Potential Cause | Recommended Solution |
|---|---|---|
| Weak or no diffraction | High solvent content or disorder [2] [78] | Optimize cryoprotection; use smaller loops; try crystal dehydration [77]. |
| Intrinsic crystal disorder | Improve crystal quality by post-crystallization treatments (e.g., controlled dehydration) [77]. | |
| Low resolution limit | Poor internal order [78] | Screen for additives or co-crystallize with ligands to stabilize conformation [17] [77]. |
| High mosaic spread [79] | Optimize freezing protocol; adjust data processing parameters (mosaicity) in software like DENZO [79]. | |
| Radiation damage | High-energy X-ray exposure [77] | Use cryo-cooling; minimize exposure time; use a larger crystal. |
Experimental Protocol: Crystal Dehydration for Improved Resolution
- Transfer: Carefully harvest the crystal from the original drop into a new drop with a slightly higher precipitant concentration (e.g., increase PEG concentration by 2-5%).
- Equilibrate: Allow the crystal to equilibrate in this new drop for several hours to several days, gradually reducing the solvent content within the crystal lattice.
- Test: Continuously test the diffraction quality of treated crystals. This process can contract the crystal lattice, improving order and diffraction resolution [77].
Guide 3: Troubleshooting Data Processing and Phasing
Problem: Diffraction data is collected but the structure cannot be solved.
| Observed Issue | Potential Cause | Recommended Solution |
|---|---|---|
| Cannot auto-index data | Incorrect detector parameters [79] | Verify beam center, distance, and wavelength in processing software (e.g., DENZO, XDS). |
| Poor crystal quality | Collect a better-diffracting crystal. | |
| Cannot find initial phases | No suitable homologous model | Use experimental phasing: incorporate heavy atoms (e.g., Se-Met SAD/MAD) [78] [77]. |
| Phase problem: Lost phase information [78] [77] | Employ molecular replacement with an AlphaFold2-predicted model [77]. | |
| High R-factor after refinement | Over-fitting of the model [78] | Use cross-validation (R-free); refine with geometric restraints. |
| Model errors or poor map quality | Check for misplaced side chains; conduct iterative building and refinement. |
Experimental Protocol: Molecular Replacement Using a Predicted Model
- Model Generation: Input your protein sequence into a structure prediction server like AlphaFold2 to generate a 3D structural model.
- Data Preparation: Process your diffraction data to obtain a structure factor file (.mtz).
- Molecular Replacement: Use the predicted model as a search model in a molecular replacement program (e.g., Phaser) to obtain initial phases.
- Refinement and Validation: Iteratively refine the model against the diffraction data using refinement software, while monitoring the R-free value to avoid over-fitting [77].
Frequently Asked Questions (FAQs)
FAQ 1: What are the critical protein sample requirements for successful crystallization? Your protein sample must be of high purity (>95%), homogenous, and monodisperse [76] [75]. It should be in a stable, soluble state, with conformational heterogeneity minimized. Buffer components should be compatible with crystallization, ideally with salts below 200 mM and buffers below ~25 mM concentration, avoiding phosphates [75].
FAQ 2: How can I improve the solubility and stability of my protein for crystallization?
- Construct Design: Truncate flexible regions predicted by bioinformatics tools or identified via limited proteolysis. Consider surface entropy reduction (SER) mutations [76].
- Fusion Tags: Use solubility-enhancing tags like MBP or GST, ensuring they are cleavable before crystallization trials [76] [75].
- Buffer Optimization: Use thermal shift assays to identify optimal pH, buffer, and salt conditions. Include stabilizing ligands or cofactors and use reducing agents like TCEP for long-term stability [76] [75].
FAQ 3: What does "resolution" mean in the context of my diffraction data? Resolution is a measure of the detail visible in the electron density map [78]. Higher-resolution structures (with smaller resolution numbers, e.g., 1.0 Å) are highly ordered, allowing you to see individual atoms. Lower-resolution structures (e.g., 3.0 Å) show only the basic contours of the protein chain, making atomic placement less certain [78].
FAQ 4: What are the R-value and R-free, and what are their acceptable ranges? The R-value measures how well the atomic model fits the experimental diffraction data. The R-free is calculated with a small portion of data excluded from refinement, making it a less biased quality metric [78]. A typical R-value for a well-refined structure is about 0.20, with the R-free value typically a little higher (e.g., ~0.26). A large gap between R-value and R-free suggests over-fitting [78].
FAQ 5: My crystals are too small for standard X-ray diffraction. What are my options? Microcrystal electron diffraction (MicroED) is a powerful technique for determining high-resolution structures from nanocrystals [77]. Alternatively, you can use Microseed Matrix Screening (MMS) to use your microcrystals as seeds to grow larger crystals [77].
Experimental Workflows
Crystal Optimization Workflow
Diffraction Data Processing
Research Reagent Solutions
| Reagent Category | Specific Example | Function in Crystallization |
|---|---|---|
| Precipitants | Polyethylene Glycol (PEG), Ammonium Sulfate | Reduces protein solubility by volume exclusion or salting-out, driving solution toward supersaturation [75]. |
| Buffers | HEPES, Tris, MES | Controls pH of the crystallization condition, critical for protein stability and intermolecular contacts [75]. |
| Salts | Sodium Chloride, Calcium Acetate, Ammonium Sulfate | Modulates electrostatic interactions on protein surface; can promote crystal contacts via salting-out [17] [75]. |
| Additives | 2-methyl-2,4-pentanediol (MPD), Glycerol | Binds hydrophobic patches, affects hydration shell, and can stabilize protein conformation [75]. |
| Reducing Agents | TCEP, DTT | Maintains cysteine residues in reduced state, preventing disulfide bond scrambling and oxidation [75]. |
| Detergents | DDM, LDAO | Solubilizes membrane proteins by mimicking the lipid bilayer, essential for their crystallization [77]. |
Modern structural biology relies heavily on automated beamlines at synchrotron facilities to determine macromolecular structures. The advent of fourth-generation synchrotron facilities, like MAX IV with its multi-bend achromat (MBA) technology, has revolutionized protein crystallography by providing extremely bright, stable X-ray beams that enable faster data collection and higher throughput experiments [80]. These beamlines, such as BioMAX and MicroMAX, are designed for high-throughput macromolecular diffraction and serial crystallography, respectively [80]. The integration of automation extends from sample handling and data collection to processing and analysis, generating vast amounts of data that require sophisticated software tools and pipelines for effective interpretation. Understanding how to leverage this large-scale data is crucial for researchers, scientists, and drug development professionals aiming to optimize their experimental outcomes, particularly in the critical area of protein purity for crystallization research.
Key Software for Data Processing and Analysis
Automated beamlines employ a suite of software packages to control experiments, process data, and facilitate structure solution. The table below summarizes the essential software tools available at various beamlines.
Table 1: Key Crystallographic Software for Automated Beamline Analysis
| Software | Primary Function | Beamline Examples | Use Case |
|---|---|---|---|
| Blu-Ice/DCS [81] | Beamline control and automation | SSRL (SMB) | Graphical user interface for controlling all aspects of data collection |
| autoPROC [82] | Automated data processing | GM/CA @ APS | Automatic data processing and analysis integrated into the beamline workflow |
| DIALS [81] [82] | Data integration and reduction | GM/CA @ APS, SSRL (SMB) | Flexible processing of data from various detectors and experimental setups |
| XDS [81] [82] | Data integration | GM/CA @ APS, SSRL (SMB) | Fast and reliable integration of diffraction images |
| CCP4 [81] [82] | Suite for structure solution | GM/CA @ APS, SSRL (SMB) | Comprehensive suite for molecular replacement, phasing, and refinement |
| Phenix [81] [82] | Automated structure solution | GM/CA @ APS, SSRL (SMB) | Automated structure determination, phasing, and refinement |
| Coot [81] [82] | Model building and visualization | GM/CA @ APS, SSRL (SMB) | Manual model building, refinement, and validation |
| XChemExplorer (XCE) [83] | Management of fragment screening data | Diamond Light Source | Manages large-scale processing and analysis for fragment screening campaigns |
| PanDDA [83] | Identification of weak ligand density | Diamond Light Source | Statistical analysis to find weak electron density in multiple datasets |
These software packages are often seamlessly integrated into the beamline's operating system. For instance, at the GM/CA beamlines at APS, environment modules are used to manage different software suites and avoid conflicts [82]. Similarly, the SSRL Structural Molecular Biology (SMB) facility maintains and supports most major crystallographic software packages, making them available through a processing cluster [81].
Frequently Asked Questions (FAQs) and Troubleshooting
FAQ 1: Our protein crystallizes, but we cannot solve the structure by molecular replacement, despite having a good homolog. What could be wrong?
This is a classic symptom of a protein purity artifact. The crystal might not be of your target protein but of a contaminant.
- Diagnosis and Solution:
- Lattice Parameter Check: Compare the unit cell parameters of your crystal against known structures in the Protein Data Bank (PDB). A match with a common contaminant can immediately identify the problem [26].
- Sequence Identification from Density: If a partial model can be built, use computational tools like
Fitmunkto assign probable residue identities to the sidechains. The resulting sequence can be used for a BLAST search to identify the protein [26]. - Molecular Replacement with Contaminant Templates: Perform molecular replacement using a list of common contaminants as search models. Typical contaminants include:
FAQ 2: The beamline's automated processing pipeline failed for our dataset. What are the first steps we should take?
Automated processing can fail due to issues with crystal quality, instrumentation, or user input.
- Troubleshooting Steps:
- Inspect the Images: Use a diffraction image viewer (e.g.,
ADXV,albula) to visually check the raw data. Look for ice rings, weak diffraction, split spots (indicating twinning), or other anomalies that the software might have misinterpreted [82]. - Check the Processing Logs: Automated pipelines like
autoPROCand those inBlu-Ice/DCSgenerate detailed logs. Scrutinize these logs for warnings or errors during indexing or integration [81] [82]. - Reprocess Manually: Use the beamline's available software (e.g.,
XDS,DIALS,imosflm) to attempt manual processing. Starting with a subset of images can help optimize parameters [82]. ForXDS, you can generate a newXDS.INPfile using the command:generate_XDS.INP "hdf_master_file_full_path"[82].
- Inspect the Images: Use a diffraction image viewer (e.g.,
FAQ 3: We are collecting data on hundreds of crystals for a fragment screening campaign. How can we manage and analyze this large-scale data effectively?
High-throughput campaigns require specialized data management and analysis platforms.
- Recommended Workflow:
- Data Management: Use XChemExplorer (XCE) to manage the entire data flow. It orchestrates processing for large numbers of datasets and provides an interface for the subsequent analysis steps [83].
- Hit Identification: Employ the PanDDA (Pan-Dataset Density Analysis) method. PanDDA analyzes all your datasets together to create a statistical background model, which allows it to identify very weak, partial-occupancy ligand density that would be obscured in a standard analysis of a single dataset [83].
- Data Collaboration and Progression: Utilize web-based platforms like Fragalysis. This cloud-based tool allows for the visualization and analysis of screening hits, and provides computational tools to help prioritize compounds for further testing based on the structural data [83].
FAQ 4: Our crystals are small or difficult to harvest, leading to data collection challenges. What are our options?
Serial crystallography and automated harvesting technologies are designed to address this exact problem.
- Solutions:
- Serial Crystallography: For microcrystals that form slurries, use the serial crystallography capabilities of beamlines like MicroMAX. This approach involves collecting diffraction patterns from thousands of microcrystals sequentially as they are delivered to the beam, often at room temperature, and merging the data [80] [84]. Processing is typically done with software like
CrystFEL[82]. - Automated Crystal Harvesting: For membrane proteins crystallized in meso, new approaches based on
CrystalDirecttechnology enable automated crystal harvesting. This eliminates difficult manual sample recovery, increases throughput, and minimizes sample loss, making high-throughput ligand screening with membrane proteins feasible [84].
- Serial Crystallography: For microcrystals that form slurries, use the serial crystallography capabilities of beamlines like MicroMAX. This approach involves collecting diffraction patterns from thousands of microcrystals sequentially as they are delivered to the beam, often at room temperature, and merging the data [80] [84]. Processing is typically done with software like
Essential Research Reagent Solutions
Successful crystallization and analysis depend on the quality and suitability of the reagents used throughout the protein production and crystallization pipeline.
Table 2: Key Research Reagents for Protein Crystallization
| Reagent / Material | Function | Considerations for Optimization |
|---|---|---|
| Chromatography Resins (IMAC) [26] | Purification of recombinant His-tagged proteins. | Can co-purify endogenous metal-binding host proteins (e.g., YodA). Follow with a size-exclusion chromatography (SEC) step. |
| Proteases (e.g., TEV, Thrombin) [26] | Cleavage of affinity tags from the target protein. | A potential source of contamination. Use high-purity grades and minimize amount; remove post-cleavage. |
| Lysozyme [26] | Disruption of bacterial cell walls during lysis. | A common crystallographic contaminant. Ensure it is thoroughly removed during purification. |
| Precipitants (e.g., PEGs, Salts) [2] [4] | Drives protein supersaturation and crystal formation. | Systematically screen a wide range of types and concentrations. Purity is critical to avoid inhibition of crystallization. |
| Additives (e.g., Glycerol, Ligands) [4] | Enhances protein stability and solubility. | Can dissolve protein "oils" and prevent precipitation. Adding known substrates/inhibitors can stabilize a specific conformation. |
| Detergents (e.g., beta-Octyl Glucoside) [4] | Solubilizes membrane proteins and prevents aggregation. | Essential for membrane protein work. Can also be used as a mild solubilizing agent for difficult soluble proteins. |
Workflow Diagrams for Problem-Solving
Contaminant Identification Pathway
The following diagram outlines a logical workflow for identifying protein contaminants when structure solution fails, based on the methodologies proven effective in real-world scenarios [26].
Automated Data Analysis Pipeline
This diagram visualizes the integrated software pipeline for managing and analyzing large-scale data from fragment screening campaigns at facilities like Diamond Light Source [83].
FAQs: Microgravity Crystallization
What are the primary advantages of growing crystals in microgravity? The microgravity environment aboard platforms like the International Space Station (ISS) provides distinct advantages by minimizing two key gravitational effects: convection (buoyancy-driven fluid flow) and sedimentation (the settling of crystals) [18] [85]. This quiescent environment allows crystal growth to be dominated by diffusion alone, which often results in larger, more structurally ordered crystals with fewer defects and imperfections compared to those grown on Earth [18] [86]. These improvements can lead to sharper X-ray diffraction data, enabling a more detailed structural analysis of proteins and other molecules [87] [86].
My crystals often form with defects or irregular shapes on Earth. Can microgravity help? Yes. Experiments have consistently demonstrated that microgravity-grown crystals exhibit superior morphology. For instance, lysozyme crystals grown in microgravity had sharp edges, flat, polished-looking surfaces, and were consistently sized, whereas Earth-grown crystals from the same experiment showed rough faces and irregular shapes [18]. Similarly, crystals of the monoclonal antibody Pembrolizumab (Keytruda) were larger and more uniform when grown in space [18] [86].
Is microgravity crystallization only beneficial for protein structure determination? While improving structure determination has been a traditional goal, the focus is expanding. A significant new application is optimizing the "form" of pharmaceutical products for improved drug formulations. The research on Pembrolizumab showed that crystalline suspensions produced in microgravity were less viscous and sedimented more uniformly, which can directly inform the development of next-generation drug formulations with potentially better patient adherence [18].
What are the main challenges of conducting crystallization experiments in microgravity? Key challenges include the need for robust, sometimes automated hardware, potential sample degradation during transportation, and the limited ability to handle samples or inspect crystal growth in real time without the proper equipment [18] [87]. Furthermore, the forces experienced during re-entry can sometimes damage delicate crystals, making on-orbit analytical capabilities highly desirable [18] [87].
Troubleshooting Guides
Issue 1: Inconsistent Results Between Ground and Microgravity Experiments
| Potential Cause | Diagnostic Steps | Solution |
|---|---|---|
| Undetected convection on Earth | Compare crystal size distribution and internal order (mosaicity) between ground and flight samples. | Implement microgravity findings on Earth using techniques like rotational mixing to reduce sedimentation [18]. |
| Sample degradation during launch/return | Review temperature logs from the transport module. Check for signs of precipitation or protein denaturation pre- and post-flight. | Stabilize samples with appropriate buffers and use temperature-controlled transportation boxes [87]. |
| Hardware operational differences | Use video data from on-orbit cameras to verify that fluid mixing and experiment initiation occurred as planned. | Perform extensive ground testing with flight-equivalent hardware to ensure protocol reliability [88]. |
Issue 2: Poor Crystal Quality or Yield in Microgravity
| Potential Cause | Diagnostic Steps | Solution |
|---|---|---|
| Suboptimal supersaturation levels | Analyze on-orbit imaging to observe if crystallization occurs too rapidly (many small crystals) or too slowly (no crystals). | Conduct thorough pre-flight screening on Earth using automated systems like the CrystalSCAN to define the metastable zone [89] [90]. |
| Uncontrolled nucleation | Inspect returned samples for a high number of small, imperfect crystals versus a few larger ones. | Employ seeding methods in the flight hardware to guide and control the nucleation process [91]. |
| Lack of real-time process insight | Experiments are run as a "black box" with analysis only after return to Earth. | Utilize advanced hardware with in-situ observation capabilities, such as the PIL-BOX DM or bioassembler "Organ.Aut", which have built-in microscopes and cameras [18] [87]. |
Experimental Protocols & Data
Quantitative Benefits of Microgravity Crystallization
The following table summarizes documented improvements from microgravity crystallization experiments, demonstrating the tangible impact on research and development.
| Protein/Molecule | Key Improvement in Microgravity | Experimental Method | Data Source |
|---|---|---|---|
| Lysozyme | Improved crystal habit; sharp edges, flat surfaces, no cracks or defects. | PIL-BOX Dynamic Microscopy on ISS [18]. | Redwire (2025) [18] |
| Pembrolizumab (Keytruda) | Larger, more uniform crystals; less viscous crystalline suspension. | Simple, cost-effective hardware on ISS [18]. | Merck & Co. (2025) [18] |
| Hen Egg White Lysozyme (HEWL) | Structure determined at ~1.09 Å resolution (True-atomic level). | Bioassembler "Organ.Aut" counter-diffusion crystallization [87]. | npj Microgravity (2025) [87] |
| Pf GST (Malaria protein) | Higher resolution diffraction, lower mosaicity, reduced impurities (p<0.01). | Not specified in summary. | npj Microgravity (2022) [86] |
| Small Molecules (ROY, Glycine) | Formation of different polymorphs and crystal habits. | PIL-BOX SMALS using solvent/anti-svent method on ISS [88]. | Crystals (2025) [88] |
Detailed Protocol: Counter-Diffusion Crystallization in a Bioassembler
This protocol, adapted from a 2025 study, details the steps for using the "Organ.Aut" bioassembler to achieve high-resolution protein crystallization in microgravity [87].
Objective: To grow high-quality protein crystals of Hen Egg White Lysozyme (HEWL) on the International Space Station (ISS) using a magnetic bioassembler for structural analysis at true-atomic resolution.
Materials:
- Bioassembler "Organ.Aut": A magnetic bioprinting system repurposed for crystallization, equipped with autonomic video cameras [87].
- Rechargeable Cuvettes: Specialized containers with one main volume and two supporting volumes, activated by pistons [87].
- Hen Egg White Lysozyme (HEWL): Model protein.
- Precipitant Solution: Sodium chloride and other chemicals to induce crystallization.
- Agarose: Used to create a plug separating solutions and to stabilize the protein solution.
- Gd³⁺-HPDO3A: A paramagnetic component for the bioassembler's magnetic field.
Method:
- Cuvette Preparation (Earth):
- Fill the main volume of the cuvette with the protein solution, stabilized with 0.5% agarose.
- Fill one supporting volume with the precipitant solution.
- Use an agarose plug to separate the precipitant from the protein solution within the sealed cuvette, preventing premature mixing during transport.
- Transport and Integration (ISS):
- Transport the prepared cuvettes to the ISS via a resupply spacecraft.
- Integrate the cuvettes into the pre-delivered "Organ.Aut" bioassembler in the Russian Orbital Segment of the ISS.
- Experiment Initiation and Monitoring (ISS):
- Activate the cuvettes, allowing the precipitant to diffuse into the main chamber through the agarose plug.
- Monitor the crystallization process in real-time using the bioassembler's integrated cameras.
- Allow crystals to grow for a predetermined period (e.g., 10 days) at a stable temperature (e.g., 18-19°C).
- Sample Return and Analysis (Earth):
- Return the cuvettes to Earth via spacecraft.
- Harvest the crystals and perform X-ray diffraction analysis at a synchrotron facility to determine the protein structure.
Workflow Diagram: Microgravity Crystallization Pathway
The diagram below outlines the logical workflow for planning and executing a successful microgravity crystallization experiment.
Microgravity crystallization workflow from planning to application
The Scientist's Toolkit: Key Research Reagent Solutions
The following table lists essential materials and hardware used in advanced crystallization environments, as featured in recent studies.
| Item | Function & Application | Example Use Case |
|---|---|---|
| PIL-BOX Systems | A suite of cassette-based hardware for autonomous crystallization on the ISS. Includes Fluidics Cassette (FC), Dynamic Microscopy (DM), and Small Molecule (SMALS) versions [18] [88]. | Used for growing lysozyme and small organic molecules (ROY, glycine) with real-time observation [18] [88]. |
| Bioassembler "Organ.Aut" | A magnetic bioprinting system repurposed for protein counter-diffusion crystallization in space, enabling real-time observation [87]. | Grew HEWL crystals diffracting to ~1.09 Å resolution on the ISS [87]. |
| CrystalSCAN / Crystal16 | Bench-top, automated parallel crystallizers for determining solubility curves and screening crystallization conditions on Earth [89] [90]. | Accelerates pre-flight optimization by defining metastable zone width and ideal supersaturation levels [89] [90]. |
| Agarose Plugs/Matrix | Used to separate solutions during transport and to stabilize crystal position by preventing movement caused by re-entry forces [87]. | Employed in the "Organ.Aut" bioassembler to separate protein and precipitant, initiating crystallization only on-orbit [87]. |
| Paramagnetic Agents (e.g., Gd³⁺-HPDO3A) | A component for magnetic bioassemblers that enables self-assembly of diamagnetic objects at the center of the cuvette under an inhomogeneous magnetic field [87]. | Integral part of the original "Organ.Aut" system's magnetic field setup [87]. |
Correlating Purification Strategies with Final Structure Resolution
Why is my protein purity critical for high-resolution structure determination, and what level is sufficient?
Achieving high protein purity is the first and most critical step in obtaining crystals that diffract to high resolution. Impurities act as nucleation points for disordered aggregation, leading to microcrystals or amorphous precipitate that cannot yield a high-resolution data set. Contaminants can incorporate into the crystal lattice, creating defects that disrupt the periodic order necessary for coherent X-ray diffraction [1] [92].
For successful crystallization, your protein sample should have a purity of at least 95%, as assessed by SDS-PAGE with Coomassie-blue staining [13]. However, for the best chance of growing large, well-ordered crystals, many experts recommend aiming for a purity exceeding 99% [92]. Sources of heterogeneity that can sabotage crystallization include the presence of oligomeric forms, isoforms, misfolded populations, and variable post-translational modifications [1].
Assessment Protocols:
- SDS-PAGE: Confirm purity and check for proteolytic degradation or contaminating proteins.
- Mass Spectrometry: Verify protein identity and detect heterogeneous modifications like deamidation or oxidation that are invisible on gels [93].
How do different purification strategies directly impact the resolution of my final structure?
The choice of purification strategy directly influences sample homogeneity, which is a primary determinant of crystalline order. A multi-step purification protocol is essential to remove not only different proteins but also various undesirable states of your target protein [93].
The table below summarizes how key purification techniques contribute to achieving a crystallography-grade sample.
| Purification Technique | Primary Role in Crystallization | Key Outcome for Resolution | Optimization Tips |
|---|---|---|---|
| Affinity Chromatography (e.g., His-tag, GST-tag) | High-specificity initial capture; can improve solubility [93]. | Provides the foundational purity for downstream steps. | Use enzymatic cleavage (e.g., TEV protease) to remove tags that might interfere with crystal contacts [93]. |
| Ion Exchange Chromatography (IEX) | Polishing step to remove charge variants and contaminants [93]. | Improves homogeneity by ensuring a uniform protein surface charge, facilitating ordered packing. | Optimize buffer pH relative to the protein's pI for maximum resolution of variants. |
| Size Exclusion Chromatography (SEC) | Final polishing to remove aggregates and oligomers [93]. | Critical for monodispersity. Removes species that cause lattice disorder, directly enabling higher resolution [1]. | Use high-quality resins (e.g., Superdex); the elution profile is a key indicator of crystallization potential. |
Experimental Protocol: Multi-Step Purification
- Lysis and Clarification: Perform in the presence of protease inhibitors and at 4°C to prevent degradation [93].
- Affinity Capture: Use IMAC for His-tagged proteins or other relevant resin. Wash with a buffer containing a low concentration of imidazole (e.g., 20-50 mM) to reduce non-specific binding [93].
- Tag Cleavage: Incubate with the appropriate protease (e.g., TEV) while dialyzing into a compatible buffer overnight at 4°C.
- Polishing Chromatography: Pass the cleaved protein sequentially through IEX and SEC. SEC is the most important step for assessing monodispersity prior to crystallization [1] [93].
- Concentration: Concentrate the peak SEC fraction using a centrifugal concentrator to the desired concentration (typically 5-20 mg/mL) for crystallization trials [94].
What specific qualities should I assess after purification to predict crystallization success?
Beyond purity, several biophysical properties of your purified protein sample are strong predictors of its likelihood to form well-diffracting crystals. You should characterize these qualities immediately before setting up crystallization trials [13].
Key Quality Metrics Table
| Quality Metric | Target for Crystallization | Recommended Assessment Method | Interpretation of Results |
|---|---|---|---|
| Homogeneity & Monodispersity | Single, uniform peak in SEC; polydispersity <20% in DLS [1]. | Dynamic Light Scattering (DLS) & Size Exclusion Chromatography (SEC) [1] [13]. | A monodisperse DLS profile and a symmetric SEC peak indicate a homogeneous sample suitable for crystallization. |
| Structural Integrity | Properly folded with expected secondary structure. | Circular Dichroism (CD) Spectroscopy [13]. | A CD spectrum typical of alpha-helical/beta-sheet content confirms the protein is natively folded. |
| Stability & Activity | Stable over days to weeks; retains biological activity. | Thermal Shift Assay (DSF) & Bioactivity Assay [93] [13]. | A high melting temperature (Tm) in DSF suggests stability. A functional assay confirms the protein is active and correctly folded. |
| Sample Composition | Free of degraded fragments and heterogeneous modifications. | Mass Spectrometry (MS) [93]. | MS confirms the sample is intact and compositionally uniform, identifying hidden heterogeneity. |
How can I troubleshoot failed crystallization experiments by re-evaluating my purified sample?
When initial crystallization screens yield only precipitate or no hits, the problem often originates with the sample, not the crystallization conditions.
Troubleshooting Guide
| Observation | Potential Purification-Related Cause | Troubleshooting Strategy |
|---|---|---|
| Amorphous precipitate or "showers" of microcrystals | Sample aggregation or heterogeneity [1]. | • Re-analyze by SEC and DLS. • Include a final SEC polishing step right before crystallization. • Reduce glycerol concentration to below 5% (v/v) in the protein stock [1]. |
| Crystals form but do not diffract or diffract poorly | Internal disorder due to flexible regions, chemical heterogeneity (e.g., oxidation), or poor packing [1]. | • Check for cysteine oxidation; use a more stable reductant like TCEP (half-life >500 hours) instead of DTT [1]. • Consider surface entropy reduction (SER) mutagenesis to engineer better crystal contacts [93]. |
| No hits in any screening condition | Protein is unstable, degraded, or improperly folded. | • Perform a Thermal Shift Assay to find stabilizing buffer conditions or ligands [93]. • Re-assess bioactivity. • Re-design protein construct to remove flexible termini or domains using bioinformatics tools (e.g., DISOPRED, AlphaFold3) [1] [93]. |
Purification to Crystallization Workflow
Troubleshooting Poor Crystallization Outcomes
The Scientist's Toolkit: Research Reagent Solutions
| Item | Function in Purification/Crystallization |
|---|---|
| His-tag & IMAC Resins | Affinity purification tag for rapid capture and initial purification [93]. |
| TEV Protease | Highly specific protease for cleaving affinity tags post-purification to avoid interference with crystallization [93]. |
| Size Exclusion Resins (e.g., Superdex) | Final polishing step to separate monodisperse protein from aggregates and oligomers [93]. |
| Tris(2-carboxyethyl)phosphine (TCEP) | Stable reducing agent to prevent cysteine oxidation and disulfide shuffling during prolonged crystallization [1]. |
| Polyethylene Glycol (PEG) | Common precipitating agent that induces macromolecular crowding, promoting crystal nucleation and growth [1] [92]. |
| Hanging/Sitting Drop Plates | Vapor diffusion plates for setting up nanoliter to microliter scale crystallization trials [94] [92]. |
| Dynamic Light Scattering (DLS) | Instrument to assess sample monodispersity and detect aggregation prior to crystallization trials [1] [93]. |
Conclusion
Optimizing protein purity is not merely a preliminary step but the fundamental determinant of success in protein crystallography. As structural biology advances toward more challenging targets like membrane proteins and large complexes, the integration of rational construct design, rigorous purification, and systematic optimization becomes increasingly critical. The future of the field points toward more automated, integrated pipelines and innovative approaches such as microgravity crystallization, all underpinned by the non-negotiable requirement for high-purity, monodisperse protein samples. By mastering these principles, researchers can significantly accelerate structural determination, thereby driving innovations in drug discovery and our understanding of fundamental biological processes.
References
- 1. Preparing for successful protein crystallization experiments [https://pmc.ncbi.nlm.nih.gov/articles/PMC12210191/]
- 2. Protein Crystallography Common Problems, Tips, and Advice [https://www.news-medical.net/life-sciences/Protein-Crystallography-Common-Problems-Tips-and-Advice.aspx]
- 3. Introduction to protein crystallization - PMC - PubMed Central [https://pmc.ncbi.nlm.nih.gov/articles/PMC3943105/]
- 4. What Every Crystallographer Should Know About A Protein ... [https://people.mbi.ucla.edu/sawaya/m230d/Crystallization/tipsandtricks.html]
- 5. advances and challenges in controlling protein nucleation [https://pubs.rsc.org/en/content/articlehtml/2025/ce/d5ce00767d]
- 6. Observing the overall rocking motion of a protein in a crystal [https://www.nature.com/articles/ncomms9361]
- 7. Correcting systematic errors in diffraction data with modern ... [https://pmc.ncbi.nlm.nih.gov/articles/PMC10478637/]
- 8. x Ray crystallography - PMC - PubMed Central - NIH [https://pmc.ncbi.nlm.nih.gov/articles/PMC1186895/]
- 9. High‐Throughput Pipeline for Protein Expression and ... [https://pmc.ncbi.nlm.nih.gov/articles/PMC12306927/]
- 10. Appendix - Trouble Shooting When refinement goes wrong [https://hkl-xray.com/sites/default/files/HKL2000manual-2020/18-AppendixTroubleshooting.htm]
- 11. Guide to Automated Protein Crystallization [https://formulatrix.com/life-science-automation-blog/automated-protein-crystallization-formulatrix/]
- 12. First attempts to crystallize a non-homogeneous sample of ... [https://www.sciencedirect.com/science/article/pii/S2405580816301984]
- 13. 4 Qualities to Evaluate Prior to Beginning Protein ... [https://www.genscript.com/protein_analysis.html]
- 14. Advances in Diffraction Rastering Technology for Protein ... [https://www.helixbiostructures.com/white-paper/advances-in-diffraction-rastering-technology-for-protein-crystals]
- 15. Combining crystallogenesis methods to produce diffraction ... [https://pmc.ncbi.nlm.nih.gov/articles/PMC6213980/]
- 16. Optimization of crystallization conditions for biological ... [https://pmc.ncbi.nlm.nih.gov/articles/PMC4231845/]
- 17. Key Factors for Successful Protein Purification and ... [https://www.biolscigroup.us/articles/GJBBS-4-110.php]
- 18. Protein Crystallization in Microgravity: Commercialization ... [https://link.springer.com/article/10.1007/s40778-025-00248-z]
- 19. Understanding the physical properties controlling protein ... [https://pmc.ncbi.nlm.nih.gov/articles/PMC2746436/]
- 20. tuning solubility, nucleation, and growth by urea and salt [https://pubs.rsc.org/en/content/articlehtml/2025/cp/d5cp01614b]
- 21. An Intrinsically Disordered Peptide Tag that Confers ... [https://pmc.ncbi.nlm.nih.gov/articles/PMC9004385/]
- 22. Synthetic intrinsically disordered protein fusion tags that ... [https://www.nature.com/articles/s41467-024-47519-7]
- 23. Optimizing protein folding in prokaryotes: Strategies to ... [https://www.sciencedirect.com/science/article/abs/pii/S0960852425012337]
- 24. Common Problems in Protein X-ray Crystallography and ... [https://www.creative-biostructure.com/resource-common-problems-protein-xray-crystallography.htm?srsltid=AfmBOoptUiACRSGaXVZJlDwypmBGtMCjyxq1cSQowFm9hQUKIdaalguP]
- 25. Optimizing Protein Production and Purification for ... [https://www.creative-biostructure.com/resource-optimizing-protein-production-purification-crystallography.htm?srsltid=AfmBOoqrwFxytl_LwISYw739jEKeB2LVyGX8IGKHybxNFFB_goqtkHni]
- 26. Protein purification and crystallization artifacts: The tale ... [https://pmc.ncbi.nlm.nih.gov/articles/PMC4815408/]
- 27. Crystals with problems - Terese Bergfors [https://xray.teresebergfors.com/crystals-with-problems/]
- 28. Overcoming Solubility Challenges in Recombinant Protein ... [https://www.proteos.com/optimal-expression-system-part-3-overcoming-solubility-challenges-in-recombinant-protein-expression]
- 29. Bacteria Expression Support—Troubleshooting [https://www.thermofisher.com/fr/en/home/technical-resources/technical-reference-library/protein-expression-support-center/bacterial-expression-support/bacterial-expression-support-troubleshooting.html]
- 30. Beyond Purification: Evolving Roles of Fusion Tags in ... [https://www.mdpi.com/1467-3045/47/9/768]
- 31. Increasing Protein Yields: Solubility Tagging [https://www.leniobio.com/increasing-protein-yields-solubility-tagging/]
- 32. A dual protease approach for expression and affinity ... [https://pmc.ncbi.nlm.nih.gov/articles/PMC4877217/]
- 33. Troubleshooting Guide for Common Protein Solubility Issues [https://synapse.patsnap.com/article/troubleshooting-guide-for-common-protein-solubility-issues]
- 34. Affinity Chromatography Troubleshooting [https://www.merckmillipore.com/ER/en/technical-documents/technical-article/protein-biology/protein-purification/affinity-chromatography-troubleshooting]
- 35. Contemporary Separations of Proteins by Size-Exclusion ... [https://www.chromatographyonline.com/view/tips-tricks-and-troubleshooting-separations-biomolecules-part-ii-contemporary-separations-proteins-s]
- 36. Protein Crystallization Market Size, Growth, Trends & ... [https://www.mordorintelligence.com/industry-reports/protein-crystallization-market]
- 37. Exploring the potential of a bioassembler for protein ... [https://pmc.ncbi.nlm.nih.gov/articles/PMC12167385/]
- 38. Troubleshooting SDS-PAGE Gel Running Issues [https://www.goldbio.com/blogs/articles/troubleshooting-sds-page-gel-running-issues?srsltid=AfmBOooTdnN3A8mvb0QZsDI1t33rQZbj2ZpIHkqIhgXzw_M2IaLyb9_E]
- 39. 6 Best Tips for Troubleshooting Poor Band Separation on ... [https://azurebiosystems.com/blog/6-tips-for-troubleshooting-poor-band-separation-on-sds-page-gels/]
- 40. Troubleshooting SDS-PAGE Sample Preparation Issues [https://www.goldbio.com/blogs/articles/troubleshooting-sds-page-sample-preparation-issues?srsltid=AfmBOoqXzslxB7UQdh0WXFIskk9jKwewMJHJS_K5f17jOMaVS_FMBK8g]
- 41. SDS-PAGE Protocol & Troubleshooting - Creative Biolabs [https://www.creativebiolabs.net/sds-page.htm]
- 42. Optimizing Protein Production and Purification for ... [https://www.creative-biostructure.com/resource-optimizing-protein-production-purification-crystallography.htm?srsltid=AfmBOor28PaZokFqGh6RgE7LRyix-BUy2x_hMHLDRX8unmVs4GwjkIOz]
- 43. Thermal shift assays in drug discovery [https://pubmed.ncbi.nlm.nih.gov/40617461/]
- 44. Codon Optimization Tool [https://en.vectorbuilder.com/tool/codon-optimization.html]
- 45. Improved Method for the Incorporation of Heme Cofactors ... [https://pubmed.ncbi.nlm.nih.gov/29658696/]
- 46. Optimizing Protein Production and Purification for ... [https://www.creative-biostructure.com/resource-optimizing-protein-production-purification-crystallography.htm?srsltid=AfmBOopfoC9sFXZN-pnDpk-oxys3P6iWvLoe-7R4ygQt1jhlu1tBIOai]
- 47. Codon Optimization Tool | IDT [https://www.idtdna.com/pages/tools/codon-optimization-tool]
- 48. Protein Purification Protocol & Troubleshooting Guide | Complete Workflow - Creative Biolabs [https://www.creativebiolabs.net/protein-purification.htm]
- 49. Protein Purification Support—Troubleshooting | Thermo Fisher Scientific - US [https://www.thermofisher.com/us/en/home/technical-resources/technical-reference-library/protein-purification-isolation-support-center/protein-purification-support/protein-purification-support-troubleshooting.html]
- 50. Catch & Release—rapid cost‐effective protein purification ... [https://pmc.ncbi.nlm.nih.gov/articles/PMC12611452/]
- 51. Preparing for successful protein crystallization experiments [https://journals.iucr.org/f/issues/2025/07/00/oq5003/]
- 52. crystallization of protein‐ligand complexes – co‐ ... [https://pmc.ncbi.nlm.nih.gov/articles/PMC11961386/]
- 53. Enhancing Protein Crystallization through Precipitant ... [https://www.sciencedirect.com/science/article/pii/S0969212603001850]
- 54. High-Throughput Crystallization Screening Center at HWI [https://formulatrix.com/life-science-automation-blog/high-throughput-crystallization-screening-center-at-hwi/]
- 55. Time-Controlled Microfluidic Seeding in nL-Volume Droplets ... [https://pmc.ncbi.nlm.nih.gov/articles/PMC1766323/]
- 56. Common Problems in Protein X-ray Crystallography and ... [https://www.creative-biostructure.com/resource-common-problems-protein-xray-crystallography.htm?srsltid=AfmBOoqoXG7NR_3F8sW34R6R4pjA3prFQL7J87ZqjId_48kYN7OOL8hS]
- 57. Small scale, big results: The advantages of microfabricated ... [https://www.ufluidix.com/blog/small-scale-big-results-the-advantages-of-microfabricated-devices-for-protein-crystallization/]
- 58. Nucleation control of quantum dot synthesis in a ... [https://www.frontiersin.org/journals/nanotechnology/articles/10.3389/fnano.2022.1096267/full]
- 59. Troubleshoot a Workflow | Automation Documentation [https://docs.rapid7.com/insightconnect/troubleshoot-a-workflow/]
- 60. 7 Common Workflow Automation Mistakes and How to Fix ... [https://www.autonoly.com/blog/689425c15e45ab09470d4531/my-automation-failed-7-common-workflow-automation-mistakes-and-how-to-fix-them]
- 61. Technologies for Automated High-Throughput Protein ... [https://www.biotage.com/blog/technologies-for-automated-high-throughput-protein-isolation]
- 62. High-throughput purification [https://www.iba-lifesciences.com/applications/protein-purification/high-throughput-purification/]
- 63. Enabling high-throughput enzyme discovery and ... [https://www.nature.com/articles/s41598-024-64938-0]
- 64. Troubleshooting Workflows [https://guides.noloco.io/workflows/workflows/troubleshooting-workflows]
- 65. Advances in ionic liquid-mediated protein crystallization [https://pubs.rsc.org/en/content/articlelanding/2025/ce/d5ce00230c]
- 66. Protein Crystallization Market Report 2025: Projected $2.8 [https://www.globenewswire.com/news-release/2025/06/24/3104062/28124/en/Protein-Crystallization-Market-Report-2025-Projected-2-8-Billion-Growth-by-2029.html]
- 67. Membrane Protein Research: Challenges & New Solutions [https://www.creative-proteomics.com/subcell/overcoming-challenges-in-membrane-protein-research-new-strategies-and-technologies.htm]
- 68. Coming Clean and Avoiding Bubble Trouble–Using ... [https://www.mdpi.com/2218-273X/15/9/1315]
- 69. Optimizing Protein Production and Purification for ... [https://www.creative-biostructure.com/resource-optimizing-protein-production-purification-crystallography.htm?srsltid=AfmBOooqkO07H38_WeSPhcIP47fOl6wM7YXYzRNtxg5g4BRU1S6RPVMz]
- 70. Optimizing Protein Production and Purification for ... [https://www.creative-biostructure.com/resource-optimizing-protein-production-purification-crystallography.htm?srsltid=AfmBOorxtdO-ccI6gCrgTvgqbqQZZoHdkg2wEkd5Su6Tbtakzzqx6Nqo]
- 71. 3.6F: Troubleshooting [https://chem.libretexts.org/Bookshelves/Organic_Chemistry/Organic_Chemistry_Lab_Techniques_(Nichols)/03%3A_Crystallization/3.06%3A_Step-by-Step_Procedures/3.6F%3A_Troubleshooting]
- 72. Automation of protein crystallization scaleup via Opentrons ... [https://www.sciencedirect.com/science/article/pii/S2472630325000263]
- 73. Global Protein Crystallization and Crystallography Market [https://www.databridgemarketresearch.com/reports/global-protein-crystallization-crystallography-market?srsltid=AfmBOorFchvjMe6ro6m00mwlXhoIWJr15852SW0ce8v1XQSwIFC7DD6l]
- 74. Protein Crystallization Market Report 2025: Projected $2.8 ... [https://uk.finance.yahoo.com/news/protein-crystallization-market-report-2025-101900993.html]
- 75. (IUCr) Preparing for successful protein crystallization experiments [https://journals.iucr.org/f/issues/2025/07/00/oq5003/index.html]
- 76. Optimizing Protein Production and Purification for Crystallography - Creative Biostructure [https://www.creative-biostructure.com/resource-optimizing-protein-production-purification-crystallography.htm]
- 77. Common Problems in Protein X-ray Crystallography and ... [https://www.creative-biostructure.com/resource-common-problems-protein-xray-crystallography.htm?srsltid=AfmBOoo5XXMWQ1bTb-W9_KZPFZ_snIjt-wZIrz4ZEw2x_RGzPioqY_q7]
- 78. Learn: Guide to Understanding PDB Data: Crystallographic Data [https://pdb101.rcsb.org/learn/guide-to-understanding-pdb-data/crystallographic-data]
- 79. X-ray Data Processing [https://mol-xray.princeton.edu/xray0/Guides/XrayDataProcessing.html]
- 80. Status and perspective of protein crystallography at the first ... [https://pmc.ncbi.nlm.nih.gov/articles/PMC12067333/]
- 81. Beamline facilities: Software [https://smb.slac.stanford.edu/facilities/software/]
- 82. GM/CA @ APS > Crystallographic Software [https://www.gmca.aps.anl.gov/computing/software_crystallography.html]
- 83. Data Analysis and Collaboration Tools [https://www.diamond.ac.uk/Instruments/Mx/Fragment-Screening/Data-Analysis-and-Collaboration-Tools.html]
- 84. An automated platform for structural analysis of membrane ... [https://www.sciencedirect.com/science/article/pii/S2667237521001612]
- 85. Microgravity protein crystallization [https://www.nature.com/articles/npjmgrav201510]
- 86. Enhancing structural biology with microgravity-grown ... [https://www.news-medical.net/health/Enhancing-structural-biology-with-microgravity-grown-protein-crystals.aspx]
- 87. Exploring the potential of a bioassembler for protein ... [https://www.nature.com/articles/s41526-025-00477-w]
- 88. Crystallization of Small Molecules in Microgravity Using ... [https://www.mdpi.com/2073-4352/15/6/527]
- 89. Key Considerations for Crystallization Studies [https://helgroup.com/applications/key-considerations-for-crystallization-studies/?srsltid=AfmBOopFniIBygNK8hRVdpNo0DsDuXj4mxFejVOutvJL6xr6AgL6fAHI]
- 90. Crystallization platform | Crystal16 [https://www.crystallizationsystems.com/products/crystal16/]
- 91. Crystallization of APIs: Methods and Challenges [https://www.bocsci.com/resources/crystallization-of-apis-methods-and-challenges.html?srsltid=AfmBOopz-CQSbpGWkYFFwX-T3ARcoPuLWAuLQ-l1-gzWEiwzYiTpkucP]
- 92. Protein Crystallization: Hanging & Sitting Drops [https://www.proteinstructures.com/protein-crystallization-basics/]
- 93. Optimizing Protein Production and Purification for ... [https://www.creative-biostructure.com/resource-optimizing-protein-production-purification-crystallography.htm?srsltid=AfmBOopTJ0nrDrHZ_Fphb933fFwAhU122p7dtGDRVDhGZXrg6goA_1iH]
- 94. Protein XRD Protocols - Crystallization of Proteins [https://sites.google.com/colgate.edu/xrd-protocols/home/crystallization-of-proteins]