Protein X-Ray Crystallography: From Principles to Drug Discovery Applications
This article provides a comprehensive guide to X-ray crystallography for protein structure determination, tailored for researchers and drug development professionals.
Protein X-Ray Crystallography: From Principles to Drug Discovery Applications
Abstract
This article provides a comprehensive guide to X-ray crystallography for protein structure determination, tailored for researchers and drug development professionals. It covers the foundational principles of the technique, detailed methodological workflows from protein production to structure refinement, common troubleshooting and optimization strategies for challenging projects, and a comparative analysis with other structural biology methods. The content also explores the transformative impact of artificial intelligence on the field and the critical role of structural data in validating drug-target interactions and advancing structure-based drug design.
The Principles and Power of Protein X-Ray Crystallography
The Critical Importance of Atomic Resolution
In structural biology, atomic resolution refers to the level of detail at which individual atoms and the chemical bonds between them can be distinguished in a three-dimensional molecular structure. This typically requires a resolution of approximately 1.2 to 1.5 Ångströms (Å) or better, where 1 Å equals 0.1 nanometers [1]. At this resolution, the electron density map becomes sufficiently detailed to unambiguously determine the positions of most non-hydrogen atoms.
The ability to visualize biological macromolecules at this fundamental level is not merely a technical achievement; it is a prerequisite for understanding the precise mechanisms of biological processes. Atomic-level details reveal how proteins catalyze specific biochemical reactions, how they interact with DNA, RNA, lipids, and other proteins, and how small-molecule drugs or mutations can modulate their function. For researchers and drug development professionals, this information is indispensable for rational drug design, enabling the structure-based optimization of inhibitors and therapeutics with high specificity and efficacy [2] [3]. Landmark discoveries, such as the mechanism of the SARS-CoV-2 main protease and the subsequent design of antiviral drugs like nirmatrelvir, were made possible by atomic-resolution structures [3].
The following table summarizes how the interpretability of a protein structure changes with improving resolution:
Table: Structural Interpretability at Various Resolution Levels
| Resolution (Å) | Classification | Structural Features Resolvable |
|---|---|---|
| > 4.0 | Low Resolution | Overall molecular shape and envelope; secondary structure elements like alpha-helices may appear as rods. |
| 3.5 - 2.8 | Medium Resolution | The protein backbone can be traced; some large side chains (e.g., tryptophan, tyrosine) may be distinguishable. |
| 2.8 - 2.0 | High Resolution | Most amino acid side chains can be identified and modeled; water molecules can be placed. |
| 1.5 - 0.9 | Atomic Resolution | Clear visualization of individual atoms and chemical bonds; alternative side-chain conformations become visible. |
Achieving Atomic Resolution with X-ray Crystallography
X-ray crystallography is a foundational technique for determining protein structures at atomic resolution. The method relies on a purified protein sample forming a highly ordered crystal lattice. When an X-ray beam is directed at this crystal, it diffracts, producing a pattern of spots. The intensities and angles of these spots are used to calculate an electron density map, into which an atomic model is built [2] [1].
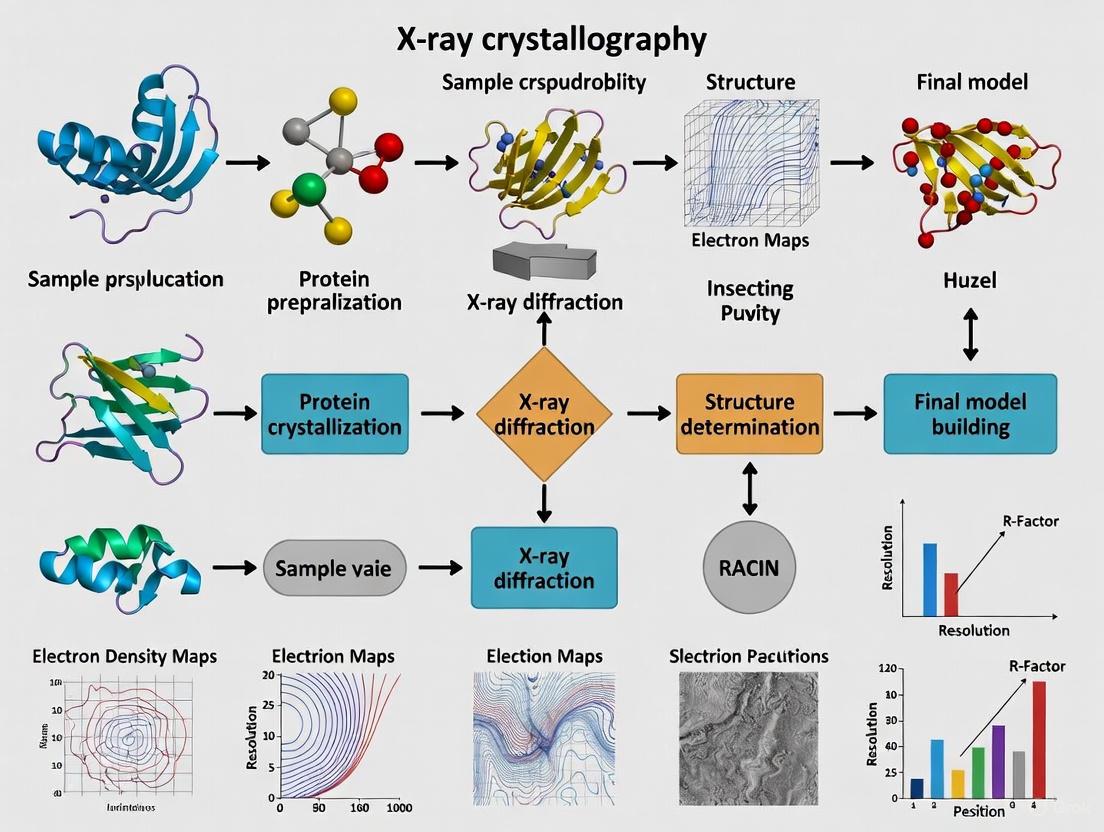
The entire process, from protein to published structure, involves several critical stages, summarized in the workflow below:
The Experimental Workflow: From Protein to Crystal
a) Protein Production and Purification The process begins with the production of a large quantity of highly pure, homogeneous protein. For crystallography, this typically involves expressing the protein in a system like E. coli and purifying it using techniques such as affinity chromatography to a purity often exceeding 95% [4]. The protein must then be concentrated to a level suitable for crystallization, often in the range of 5 to 20 mg/mL [2].
b) Crystallization Crystallization is frequently the rate-limiting step in X-ray crystallography. The goal is to slowly bring the protein out of a supersaturated solution in a controlled manner, allowing molecules to arrange into a periodic lattice instead of an amorphous precipitate [2]. The most common method is vapor diffusion:
- Hanging/Sitting Drop: A small drop (e.g., 1 µL) containing a mixture of purified protein and precipitant solution is suspended and sealed over a larger reservoir of precipitant solution [2] [5].
- Equilibration: Water vapor diffuses from the drop to the reservoir, slowly increasing the concentration of both protein and precipitant in the drop. This gradual change encourages the formation of ordered crystals rather than precipitate [4].
Crystallization is a trial-and-error process, screening variables like precipitant type and concentration, buffer pH, temperature, and additives using commercially available sparse matrix screens [2]. A crystal suitable for data collection typically needs to be at least 0.1 mm in its smallest dimension [2].
Data Collection, Phasing, and Model Building
a) Data Collection and Resolution For high-resolution studies, crystals are flash-frozen in a stream of liquid nitrogen (at ~100 K) to mitigate radiation damage [2]. X-ray diffraction data are collected at synchrotron facilities, which provide intense, focused X-ray beams that enable rapid data acquisition—sometimes in less than a minute [1]. The crystal is rotated in the X-ray beam, and a detector records the resulting diffraction pattern.
The quality of the crystal dictates the resolution of the diffraction data, which is the smallest distance between lattice planes that the crystal can diffract. According to Bragg's Law (nλ = 2d sinθ), a smaller measurable d (higher resolution) requires measuring diffraction at larger angles (θ) [1] [6]. The spot pattern reveals the crystal's symmetry and unit cell dimensions, while the spot intensities are used to compute the electron density [2].
b) Solving the Phase Problem A major challenge in crystallography is that the detector records the intensity of each diffracted wave but not its phase (a relative time shift). Both are required to calculate an electron density map. This is known as the "phase problem" [5]. Several methods can be used to obtain initial phases:
- Molecular Replacement: If a structurally similar model exists, its phases can be used as a starting point.
- Anomalous Scattering: Incorporating atoms like selenium (in Selenomethionine) or heavy metals (e.g., mercury, gold) into the crystal allows experimental phasing [5].
c) Model Building and Refinement An initial atomic model is built into the experimental electron density map using the known protein sequence. This model is then iteratively refined against the diffraction data to improve its fit to the electron density while ensuring it conforms to realistic chemical geometry [2] [1]. The quality of the model is assessed by the R-factor and the free R-factor (R~free~), which measure the agreement between the model and the experimental data [5].
The Scientist's Toolkit: Essential Reagents and Materials
Successful protein crystallography relies on a suite of specialized reagents and materials. The following table details key components used throughout the workflow.
Table: Essential Research Reagent Solutions for Protein X-ray Crystallography
| Reagent/Material | Function and Role in the Experiment |
|---|---|
| Crystallization Screens | Sparse matrix solutions (e.g., from Hampton Research, Qiagen) systematically varying precipitants (e.g., PEGs, salts), buffers, and pH to identify initial crystallization conditions [2]. |
| Precipitants | Polymers like Polyethylene Glycol (PEG) or salts (Ammonium Sulfate) that exclude protein from solution, driving it toward a supersaturated state conducive to nucleation and crystal growth [2]. |
| Cryoprotectants | Chemicals (e.g., glycerol, ethylene glycol) added to the crystal mother liquor before flash-cooling in liquid N₂ to prevent the formation of destructive ice crystals [2]. |
| Heavy Atom Compounds | Salts containing atoms with high electron density (e.g., Mercury, Gold, Platinum) used for experimental phasing via isomorphous replacement or anomalous scattering (MIR/SAD) [5]. |
| Synchrotron Beam Time | Access to a synchrotron radiation facility (e.g., MAX IV, APS) is a critical resource, providing high-intensity X-rays necessary for collecting high-resolution data efficiently [1]. |
Beyond Crystallography: The Evolving Landscape
While X-ray crystallography remains a gold standard, the field of structural biology is being transformed by complementary techniques. Cryo-Electron Microscopy (cryo-EM) now allows for the determination of high-resolution structures without the need for crystals, which is particularly advantageous for large complexes, membrane proteins (e.g., GPCRs), and flexible assemblies [3] [7]. Concurrently, artificial intelligence (AI) tools like AlphaFold2 can predict protein structures from amino acid sequences with remarkable accuracy, providing powerful models that can be validated and refined with experimental data [3].
These technologies are not replacing crystallography but are integrating with it, creating a powerful, multi-faceted approach to visualizing the machinery of life at atomic detail. This convergence continues to push the boundaries of our understanding, directly fueling advances in biomedical research and therapeutic development.
X-ray crystallography stands as one of the most transformative scientific methodologies ever developed, creating a bridge between the abstract mathematical description of crystals and the physical reality of atomic arrangements. This technique, which began with a fundamental physics experiment, has revolutionized our understanding of matter, from simple mineral structures to the complex machinery of biological macromolecules. For protein research specifically, X-ray crystallography has provided the foundational framework for a mechanistic understanding of life processes at the molecular level, enabling advances in biochemistry, molecular biology, and drug development. This review traces the critical historical milestones in the development of X-ray crystallography, detailing its technical evolution and its indispensable role in modern structural biology.
The Foundational Discoveries (1912-1915)
The genesis of X-ray crystallography resides in a pivotal experiment conducted in 1912. At the time, the nature of X-rays—discovered by Wilhelm Röntgen in 1895—was still debated, with physicists uncertain whether they were particles or waves [8] [9]. Max von Laue, a physicist in Berlin, postulated that if X-rays were waves with short wavelengths, and if crystals consisted of atoms arranged in a regular, periodic lattice with spacing on a similar scale, then a crystal should act as a three-dimensional diffraction grating for X-rays [10] [9].
Laue's Experiment and the Birth of a Field
Laue's idea was tested experimentally by his associates, Walter Friedrich and Paul Knipping. On April 12, 1912, they directed a beam of X-rays through a crystal of copper sulfate and recorded the result on a photographic plate [10]. The developed plate did not show a single spot but a pattern of many well-defined spots arranged in a pattern of intersecting circles, a phenomenon termed "Laue diffraction" [8]. This provided simultaneous proof of two fundamental hypotheses: first, that X-rays were electromagnetic waves, and second, that crystals possessed a regular, internal arrangement of atoms [9]. Laue was awarded the Nobel Prize in Physics in 1914 for this discovery, which Einstein called "one of the most beautiful in physics" [10].
Bragg's Law and the First Crystal Structures
While Laue's work demonstrated the phenomenon, it was the father-son team of William Henry Bragg and William Lawrence Bragg who developed the methodology for structural determination. In 1912-1913, the younger Bragg, Lawrence, formulated the famous equation now known as Bragg's Law: nλ = 2d sinθ [11] [8]. This law connects the wavelength of the X-rays (λ), the angle of incidence (θ), and the interplanar spacing in the crystal (d), providing a simple but powerful relationship to interpret diffraction patterns [9].
The Braggs quickly applied this law to solve the first crystal structures. In 1914, they determined the structures of sodium chloride (table salt) and diamond [8]. The sodium chloride structure was revelatory; it showed that the crystal was not composed of discrete molecules but was a continuous ionic lattice of sodium and chloride ions, proving the existence of ionic compounds [8]. The diamond structure confirmed the tetrahedral arrangement of carbon-carbon bonds [8]. For their work, the Braggs shared the 1915 Nobel Prize in Physics, making Lawrence Bragg, at 25, the youngest Nobel laureate in physics [8].
Table 1: Foundational Milestones in X-ray Crystallography (1912-1915)
| Year | Scientist(s) | Key Achievement | Scientific Impact |
|---|---|---|---|
| 1912 | Max von Laue, Walter Friedrich, Paul Knipping | Observed X-ray diffraction by a crystal (CuSO₄) | Proved wave nature of X-rays and periodic structure of crystals. |
| 1912-1913 | William Lawrence Bragg | Formulated Bragg's Law (nλ = 2d sinθ) | Provided the mathematical foundation for interpreting diffraction data. |
| 1914 | W.H. Bragg & W.L. Bragg | Solved the structures of NaCl and diamond | Revealed the nature of ionic bonding and the tetrahedral carbon bond. |
| 1915 | W.H. Bragg & W.L. Bragg | Awarded the Nobel Prize in Physics | Established crystallography as a definitive method for determining atomic structure. |
Core Principles of X-Ray Crystallography
The power of X-ray crystallography lies in its ability to determine the three-dimensional arrangement of atoms within a crystal. The following section outlines the core physical principles and the experimental workflow, especially as applied to biological macromolecules like proteins.
The Physical Basis: Diffraction and Bragg's Law
When a beam of X-rays strikes a crystal, the electrons of the atoms scatter the X-rays. In a crystal, where atoms are arranged in a periodic lattice, these scattered waves can interfere with each other. Constructive interference occurs when the path difference between waves scattered from parallel planes of atoms is equal to an integer multiple of the X-ray wavelength, reinforcing the signal and producing a "reflection" detectable as a spot on the detector. This condition is precisely described by Bragg's Law [9]. The intensity and angle of each reflection are measured, but a critical piece of information—the phase of the diffracted wave—is lost in the experiment. This is known as the "phase problem," and solving it is a central challenge in crystallography [8].
The Experimental Workflow for Protein Structure Determination
Determining a protein structure involves a multi-step process that requires careful sample preparation and sophisticated computational analysis. The standard workflow is summarized in the diagram below.
1. Protein Purification and Crystallization The target protein must be expressed, purified to homogeneity, and most critically, crystallized. This is often the major bottleneck, as it requires finding conditions (pH, precipants, temperature) that lead to the formation of well-ordered, single crystals. High-throughput structural genomics initiatives have driven the automation of this process using robotic stations [12].
2. Data Collection A single crystal is mounted and exposed to an intense X-ray beam, typically at a synchrotron light source. The crystal is rotated to bring different sets of lattice planes into diffraction condition, and a detector records the pattern of diffracted spots. The intensity of each spot is measured [8] [13].
3. Phase Determination and Model Building To reconstruct an image of the electron density within the crystal, the lost phase information must be recovered. Historically, this was done by the method of isomorphous replacement, which involves introducing heavy atoms (e.g., mercury or gold) into the crystal [8]. Modern methods often rely on anomalous dispersion (MAD or SAD), which uses the specific scattering properties of atoms like selenium (incorporated as selenomethionine in the protein) at specific X-ray wavelengths [12]. With phases estimated, an initial electron density map is calculated. Researchers then build an atomic model into this map, iteratively refining the positions of the atoms against the experimental diffraction data to achieve the best possible agreement [8].
Table 2: Key Reagents and Materials in Protein Crystallography
| Reagent/Material | Function in Experiment |
|---|---|
| Purified Protein Sample | The biological macromolecule of interest, must be highly pure and monodisperse. |
| Crystallization Solutions | Precipitating agents (e.g., PEG, salts) and buffers to induce crystal formation. |
| Heavy Atoms (Hg, Au, Pt) | Used for experimental phasing via isomorphous replacement (MIR). |
| Selenomethionine | A selenium-containing amino acid incorporated into proteins for anomalous dispersion phasing (MAD/SAD). |
| Cryoprotectants | Chemicals (e.g., glycerol) used to protect crystals from ice formation during flash-cooling in liquid nitrogen. |
| Synchrotron X-ray Beam | High-intensity, tunable X-ray source enabling rapid data collection from micro-crystals. |
Evolution into Modern Structural Biology
The period from the 1950s onward marked the expansion of crystallography into the realm of biology, leading to the field of structural biology.
The First Protein Structures and the Rise of Synchrotrons
The first protein structures—myoglobin and hemoglobin—were solved in the late 1950s and early 1960s by John Kendrew and Max Perutz, a feat for which they received the 1962 Nobel Prize in Chemistry [10]. These pioneering studies, which took decades, demonstrated that the technique could be applied to massive, complex biological molecules. A major technological leap came with the advent of synchrotron light sources. These facilities produce X-rays that are orders of magnitude brighter than laboratory sources, enabling the study of smaller crystals and the collection of higher-resolution data [13]. Dedicated beamlines at facilities like the National Synchrotron Light Source (NSLS) and its successor, NSLS-II, have been instrumental, contributing to hundreds of new protein structures deposited in the Protein Data Bank (PDB) each year [13].
Automation and High-Throughput Structural Genomics
The post-genomic era, with its abundance of gene sequences, spurred the structural genomics initiative, which aimed to determine protein structures on a massive scale [12]. This required a radical acceleration of the crystallographic pipeline. Key developments included:
- Automation: Robotic systems for crystallization, crystal mounting (sample changers), and data collection [13] [12].
- Micro-focus beams: Beamlines capable of focusing X-rays to a tiny spot (<10 µm), allowing data collection from micro-crystals [13].
- Advanced detectors: Fast, sensitive detectors that drastically reduce data collection time from hours to minutes or even seconds [12].
These advances transformed crystallography into a high-throughput discipline, capable of generating atomic-level structures for use in rational drug design.
Current State and Future Perspectives
Today, X-ray crystallography operates alongside and synergistically with other powerful techniques, continuing to evolve and address new biological questions.
Integration with Complementary Techniques
While crystallography provides ultra-high-resolution "snapshots," it is often complemented by other methods to build a more dynamic picture of molecular function. Cryo-Electron Microscopy (cryo-EM) has emerged as a dominant technique for solving structures of large complexes that are difficult to crystallize [13]. Furthermore, the integration of X-ray Footprinting (XFP) and other biophysical methods allows researchers to probe conformational dynamics and interactions in solution, providing context for the static structures derived from crystals [13].
The Age of Computational Prediction and Time-Resolved Studies
Two recent developments are shaping the future of structural biology. First, the rise of computational structure prediction, exemplified by DeepMind's AlphaFold, has been a paradigm shift [14]. AlphaFold uses deep learning to predict protein structures from amino acid sequences with remarkable, often near-experimental, accuracy [14]. This does not replace experimental methods but rather augments them; predicted models can be used to solve the phase problem in crystallography via molecular replacement, accelerating structure determination [14].
Second, there is a growing emphasis on time-resolved structural biology. The latest strategies in both crystallography and cryo-EM aim to capture short-lived intermediate states and conformational changes, moving from static snapshots to "molecular movies" [15]. This involves advanced techniques such as mix-and-inject methods and the use of X-ray free-electron lasers (XFELs) to collect diffraction data from microcrystals in microseconds before they are destroyed by the beam [16] [15]. These approaches promise to reveal the fundamental mechanics of biological function in real time.
The journey of X-ray crystallography from Laue's seminal observation to a pillar of modern structural biology is a testament to the power of a robust physical technique. Its development, marked by theoretical insights like Bragg's Law and technological revolutions like synchrotrons and automation, has provided an unparalleled view of the atomic world. For protein research, it has been indispensable, yielding the fundamental principles of enzyme mechanism, molecular recognition, and allostery that underpin modern drug discovery. As it converges with cryo-EM, artificial intelligence, and ultra-fast methods, X-ray crystallography remains a vital tool, poised to continue illuminating the dynamic complexities of biological molecules for decades to come.
X-ray crystallography stands as the most favored technique for determining the three-dimensional structures of proteins and biological macromolecules, providing tremendous insight into numerous biological processes [2]. The technique's power to reveal atomic-scale detail has proven indispensable for unraveling fundamental biological mechanisms, studying protein-ligand interactions, and enabling structure-based drug design [17] [2]. At the heart of this methodology lies Bragg's Law, a fundamental physical principle that describes the conditions under which constructive interference occurs when X-rays interact with the regular, repeating planes of atoms within a crystal lattice [18]. This law, formulated by Sir William Henry Bragg and his son Sir William Lawrence Bragg in 1912-1913, connects the scattering angles with evenly spaced planes within a crystal and launched the entire field of X-ray crystallography, for which the Braggs shared the 1915 Nobel Prize in Physics [8].
For researchers, scientists, and drug development professionals, understanding Bragg's Law is essential not merely as historical context but as a living principle that continues to underpin modern structural biology. The law provides the mathematical relationship that allows crystallographers to determine the interplanar spacings within crystals from measured diffraction angles, ultimately enabling the reconstruction of electron density maps and the building of atomic models [18] [2]. In pharmaceutical research, this structural information has become crucial for designing lead drugs and improving the action of existing therapeutics by revealing precise atomic interactions between drug candidates and their protein targets [19]. Recent technological advances—including micro-focus beamlines, diffraction rastering, helical data collection, and high-speed detectors—have transformed the field, yet all still rely on the fundamental principle described by Bragg's Law to convert diffraction patterns into structural information [17].
Fundamental Principles of Bragg's Law
Theoretical Foundation and Mathematical Formulation
Bragg's Law establishes the geometric conditions under which X-rays scattered from different crystal planes interfere constructively to produce measurable diffraction peaks. When a monochromatic X-ray beam strikes a crystalline material, it interacts with atoms arranged in regular, repeating patterns called crystal lattices. The law specifically describes the situation where X-rays reflect from parallel planes of atoms within the crystal structure, with the incident angle equaling the reflection angle (specular reflection) [18].
The mathematical expression of Bragg's Law is:
Where:
- n = order of diffraction (positive integer: 1, 2, 3...)
- λ = wavelength of the incident X-rays
- d = interplanar spacing between crystal lattice planes
- θ = angle of incidence (glancing angle)
For constructive interference to occur, the path difference between X-rays reflected from adjacent crystal planes must equal an integer multiple of the X-ray wavelength. This condition ensures that reflected waves remain in phase, producing intense diffraction peaks that can be detected and analyzed [18]. The parameter n represents how many wavelengths fit into the path difference between rays reflected from successive crystal planes, with first-order diffraction (n = 1) typically producing the strongest intensity peaks [18]. The d-spacing represents the perpendicular distance between parallel atomic planes in the crystal lattice, which depends on the crystal structure, atomic arrangement, and unit cell dimensions [18].
Derivation of Bragg's Law
The derivation of Bragg's Law involves analyzing the geometric relationship between incident X-rays and crystal lattice planes [18] [20]:
- Consider parallel X-ray beams striking adjacent crystal planes separated by distance d
- The incident angle equals the reflection angle: θincident = θreflected
- Calculate the path difference between rays reflected from consecutive planes: Δ = 2d sinθ
- For constructive interference, this path difference must equal integer multiples of wavelength: Δ = nλ
- Combining these conditions yields Bragg's Law formula: nλ = 2d sinθ
Table: Key Parameters in Bragg's Law Equation
| Parameter | Symbol | Definition | Role in Diffraction |
|---|---|---|---|
| Order of Diffraction | n | Positive integer (1, 2, 3...) | Indicates how many wavelengths fit into the path difference between rays |
| Wavelength | λ | Distance between successive wave peaks of incident X-rays | Determines the scale of diffraction; must be comparable to atomic spacings |
| Interplanar Spacing | d | Perpendicular distance between parallel atomic planes in crystal lattice | Characteristic of the crystal structure and material composition |
| Angle of Incidence | θ | Angle between incident X-ray and crystal plane | Determines the specific orientation where constructive interference occurs |
X-Ray Diffraction Experimental Methodology for Protein Crystals
Protein Crystallization and Sample Preparation
The growth of protein crystals of sufficient quality for structure determination represents the rate-limiting step in most protein crystallographic work [2]. The process begins with a reliable source of purified protein and a concentration protocol that yields high-quality, homogeneous, soluble material. The principle of crystallization is to take a solution of the sample at high concentration and induce it to come out of solution slowly enough to form crystals rather than amorphous precipitate [2].
The challenges are considerable, with multiple variables to optimize: choice of precipitant, its concentration, buffer composition, pH, protein concentration, temperature, crystallization technique, and possible inclusion of additives [2]. Initial experiments typically employ commercially available "crystal screen" packages, often consisting of 50 solutions varying widely in precipitant, buffer, pH, and salt (sparse matrix) [2]. These are set up using techniques such as sitting drop vapor diffusion or hanging drop vapor diffusion, typically at both room temperature and 4°C [2]. For diffraction analysis, protein crystals generally need to be a minimum of 0.1 mm in the longest dimension to provide sufficient crystal lattice volume for exposure to the X-ray beam [2].
Data Collection Setup and Parameters
The experimental setup for X-ray diffraction requires precise optical configuration. X-rays can be generated from two primary sources: synchrotron storage rings (producing extremely intense, tunable X-rays) or laboratory sources where electrons strike a copper anode [2]. The X-rays must be focused into a beam and collimated to ensure they are parallel, typically using adjustable slits to create a 0.1–0.3 mm diameter beam [2].
The crystal is mounted in the beam on a goniometer head, which ensures it remains positioned correctly as the spindle rotates. A critical advancement has been the introduction of cryocrystallography, where crystals are mounted frozen in a small loop in a stream of liquid nitrogen at 100 K [2]. This approach significantly reduces radiation damage, often allowing complete data sets to be collected from a single crystal [2].
Table: Crystal Systems and Their Characteristics
| Crystal System | Unit Cell Conditions | Symmetry Level | Data Collection Requirements |
|---|---|---|---|
| Triclinic | No conditions | Lowest | Must collect through up to 360° |
| Monoclinic | α = γ = 90° | Low | Typically requires 180° of data |
| Orthorhombic | α = β = γ = 90° | Medium | Less than monoclinic but more than higher symmetry systems |
| Tetragonal | a = b; α = β = γ = 90° | High | Reduced angular range needed |
| Trigonal | a = b; α = β = 90°; γ = 120° | High | Reduced angular range needed |
| Hexagonal | a = b; α = β = 90°; γ = 120° | High | Reduced angular range needed |
| Cubic | a = b = c; α = β = γ = 90° | Highest | May need as little as 35° of data |
X-Ray Diffraction Workflow
The following diagram illustrates the complete X-ray crystallography structure determination workflow for proteins, from initial purification through final structure refinement and analysis:
Data Processing and Structure Solution
From Diffraction Images to Electron Density Maps
Once diffraction data are collected, the processing stage begins to convert the raw images into an interpretable electron density map. The diffraction patterns are initially processed to yield information about crystal packing symmetry and the size of the repeating unit that forms the crystal [2]. The intensities of the diffraction spots are used to determine "structure factors" from which a map of the electron density can be calculated [2].
Three software packages have dominated the processing of diffraction images: Mosflm (distributed as part of the CCP4 suite), HKL2000 (packaging Denzo and Scalepack), and the XDS suite [21]. A more recent initiative has produced DIALS, aimed particularly at data processing from synchrotrons and X-ray free electron lasers (XFELs) [21]. These programs perform critical steps including autoindexing, refining crystal and detector parameters, integrating the reflections, and putting the resultant measurements onto a common scale [21].
Modern detectors enable "shutterless" data collection with fine φ-slicing, where the crystal is continuously rotated while the detector rapidly reads out images [21]. This approach eliminates the need for accurate synchronization between mechanical shutter and crystal rotation, reduces background measurements, and allows better identification of closely-spaced diffraction spots [21].
Phase Problem and Structure Determination
The central challenge in crystallography is the "phase problem" - while diffraction patterns record the intensities of the reflections, the phase information is lost during measurement, yet both are required to calculate an electron density map [2]. Several methods address this:
- Molecular Replacement: Uses a known related structure as a starting model
- Multiple Isomorphous Replacement (MIR): Incorporates heavy atoms into the crystal
- Multiwavelength Anomalous Dispersion (MAD): Utilizes anomalous scattering from specific atoms at different wavelengths
After obtaining initial phases, iterative cycles of density modification and model building improve the quality of the electron density map until it reaches sufficient clarity to permit building of the molecular structure using the protein sequence [2]. The resulting structure is then refined to fit the map more accurately and to adopt a thermodynamically favored conformation [2].
Technological Advances in Protein X-Ray Crystallography
Emerging Technologies and Methodologies
Recent technological innovations have substantially expanded capabilities for analyzing protein structures through X-ray diffraction [17]:
Diffraction Rastering: Systematically pinpoints optimal regions within heterogeneous crystals by scanning across the crystal and gathering diffraction patterns at multiple points, then focusing data collection on the highest-quality regions [17]. This is particularly valuable for membrane proteins and large macromolecular complexes where crystal quality often varies greatly [17].
Micro-focus Beamlines: Generate tightly concentrated X-ray beams (1-10 micrometers diameter) enabling data collection from exceptionally small or weakly diffracting crystals [17]. These beamlines boost diffraction signals and minimize background noise, making it feasible to work with samples that previously would have been impossible to study [17].
Helical Data Collection: Involves rotating a crystal while simultaneously translating it through the beam in a spiral-like path, distributing X-ray dose more uniformly across the sample [17]. This approach reduces localized radiation damage, particularly beneficial for large protein complexes or radiation-sensitive crystals [17].
High-Speed Detectors: Modern pixel array detectors like the Dectris EigerX series feature rapid frame rates, wide dynamic range, and essentially zero dead-time, allowing researchers to record weak signals efficiently and reduce total data collection times [17] [21]. These detectors are particularly valuable for serial crystallography, where thousands of tiny crystals are exposed in rapid sequence [17].
Table: Advances in X-ray Crystallography Technologies
| Technology | Key Innovation | Impact on Protein Crystallography |
|---|---|---|
| Diffraction Rastering | Systematic mapping of crystal quality | Enables identification and targeting of best diffracting regions in heterogeneous crystals |
| Micro-focus Beamlines | X-ray beams focused to 1-10 μm diameter | Allows analysis of smaller crystals and weakly diffracting samples |
| Helical Data Collection | Spiral translation through beam during rotation | Reduces radiation damage by distributing dose across larger crystal volume |
| High-Speed Detectors | Rapid readout with zero dead-time | Enables serial crystallography and time-resolved studies |
| Synchrotron Sources | Extremely intense, tunable X-rays | Provides higher signal-to-noise ratio and ability to exploit anomalous scattering |
The Scientist's Toolkit: Essential Research Reagents and Materials
Table: Key Research Reagent Solutions for Protein X-Ray Crystallography
| Reagent/Material | Function and Application | Considerations |
|---|---|---|
| Crystal Screen Solutions | Sparse matrix screens systematically varying precipitant, buffer, pH, and salt to identify initial crystallization conditions [2] | Commercial screens typically include 50-96 conditions covering broad chemical space |
| Cryoprotectants | Compounds (e.g., glycerol, ethylene glycol) that prevent ice formation during cryocooling, preserving crystal structure at cryogenic temperatures | Must be compatible with crystal lattice and not cause cracking or disorder |
| Heavy Atom Derivatives | Compounds containing heavy atoms (e.g., mercury, platinum, selenium) used for experimental phasing via MIR or MAD methods | Requires derivatization without damaging crystal lattice; selenium-methionine incorporation is common |
| Crystallization Plates | Specialized plates (sitting drop, hanging drop) for vapor diffusion crystallization experiments | Design affects drop ratio, volume, and vapor diffusion kinetics |
| Crystal Mounting Loops | Micro-loops for harvesting and mounting crystals for X-ray exposure | Loop size should match crystal dimensions to minimize background scattering |
Applications in Protein Research and Drug Development
Biological Insights and Structure-Based Drug Design
X-ray crystallography has provided fundamental insights into biological mechanisms by revealing the atomic structures of countless proteins, enzymes, receptors, and nucleic acids. The technique has been instrumental in understanding enzyme mechanisms, specificity of protein-ligand interactions, and the molecular basis of numerous biological processes [2]. In pharmaceutical research, structure-based drug design utilizes three-dimensional atomic structures of proteins to design lead compounds and optimize existing drugs [19].
Notable successes include the development of HIV protease inhibitors, where iterative protein crystallographic analysis guided the design of potent antiviral agents [19], and influenza virus neuraminidase inhibitors designed based on the enzyme's structure [19]. More recently, X-ray crystallography played a pivotal role during the COVID-19 pandemic by rapidly determining the structure of the SARS-CoV-2 spike protein, enabling vaccine and therapeutic development [17].
The availability of a protein structure provides a more detailed focus for future research, enabling site-directed mutagenesis to probe function, elucidating enzyme mechanisms, and clarifying the structural basis of disease-causing mutations [2]. The extension of the technique to increasingly complex systems such as viruses, immune complexes, and protein-nucleic acid complexes continues to widen its appeal and application [2].
Current Trends and Future Perspectives
The field of protein crystallography continues to evolve rapidly. Emerging trends include the integration of X-ray free electron lasers (XFELs) for studying enzyme mechanisms and transient states, the application of machine learning techniques to improve data processing and structure prediction, and the development of hybrid methods that combine crystallographic data with other structural techniques like cryo-electron microscopy [22].
Recent conferences highlight growing interest in methods for analyzing microcrystals, time-resolved crystallography to capture molecular movies of proteins in action, and applications in sustainable materials and environmental analysis [22]. The ongoing development of brighter X-ray sources, faster detectors, and more sophisticated computational methods promises to further expand the boundaries of what can be studied using X-ray crystallography, ensuring Bragg's Law remains as relevant today as when it was first formulated over a century ago.
X-ray crystallography stands as a foundational technique in structural biology, enabling researchers to determine the three-dimensional atomic structures of proteins and other biological macromolecules. The power of this method relies entirely on the ordered, repeating nature of crystals, which amplifies the diffraction signal from individual molecules to a measurable intensity. Understanding the crystalline state—specifically the concepts of unit cells, symmetry, and space groups—is therefore prerequisite to interpreting crystallographic data and leveraging it for drug design and mechanistic studies. For protein researchers, these crystallographic principles transform disordered protein solutions into precisely arranged lattices that can be deciphered using X-ray beams, shedding light on previously unanswered questions about biological function and interaction [2].
The arrangement of atoms within a crystal can be described by a small set of fundamental parameters: the unit cell (the smallest repeating unit), the crystal lattice (the periodic arrangement of these units), and the space group (the complete set of symmetry operations that defines the crystal's structure) [23]. Together, these elements form the mathematical framework that allows crystallographers to convert observed diffraction patterns into electron density maps and, ultimately, into atomic models that reveal protein function and inform therapeutic development [2] [1].
Fundamental Building Blocks: Unit Cells and Crystal Lattices
The Unit Cell
In crystallography, the unit cell represents the smallest volumetric component that retains the complete geometric information of the crystal structure. When repeated indefinitely through three-dimensional space, it reconstructs the entire crystal lattice [23]. The unit cell is defined by three edge lengths (a, b, c) and the three angles between them (α, β, γ), collectively known as lattice parameters [2] [24]. The lengths are typically measured in Ångströms (Å), where 1 Å equals 10⁻¹⁰ meters, a scale comparable to atomic bond lengths.
The contents of the unit cell are described by the spatial coordinates (x, y, z) of each atom within its volume. In protein crystallography, the asymmetric unit—the smallest part of the unit cell that can generate the complete unit cell through symmetry operations—may contain one or more protein molecules [25]. The number of replicates of the asymmetric unit in a full unit cell depends on both the lattice centering and the order of the point group, ranging from 1 in space group P1 to 192 in high-symmetry space groups like Fm3m [25].
Crystal Systems and Bravais Lattices
Based on their lattice parameters, all crystals can be classified into seven crystal systems, which describe the fundamental symmetry relationships of the unit cell [2]. These seven systems form the basis for the fourteen three-dimensional Bravais lattices, which describe the distinct ways points can be arranged in space while maintaining translational periodicity [26] [23]. The following table summarizes the defining characteristics of the seven crystal systems:
Table 1: The Seven Crystal Systems and Their Defining Parameters
| Crystal System | Defining Parameters | Bravais Lattices |
|---|---|---|
| Triclinic | No restrictions | Primitive |
| Monoclinic | α = γ = 90° | Primitive, Side-centered |
| Orthorhombic | α = β = γ = 90° | Primitive, Side-centered, Body-centered, Face-centered |
| Tetragonal | a = b; α = β = γ = 90° | Primitive, Body-centered |
| Trigonal | a = b; α = β = 90°, γ = 120° | Primitive (Rhombohedral) |
| Hexagonal | a = b; α = β = 90°, γ = 120° | Primitive |
| Cubic | a = b = c; α = β = γ = 90° | Primitive, Body-centered, Face-centered |
The Bravais lattices are categorized as primitive (P), body-centered (I), face-centered (F), or side-centered (C), depending on where additional lattice points are located beyond the unit cell corners [26] [23]. A primitive lattice has points only at its corners, while a body-centered lattice has an additional point at the center of the volume. A face-centered lattice has extra points at the center of all six faces, and a side-centered lattice has points on one pair of opposite faces [26].
Symmetry in Crystals: From Point Groups to Space Groups
Crystal Symmetry Operations
Symmetry operations are transformations that map a crystal onto itself, resulting in an arrangement indistinguishable from the original. These operations include:
- Translational Symmetry: The periodic repetition of the unit cell along the crystal lattice vectors [25].
- Rotation Axes: Symmetry operations that rotate the crystal around an axis by 360°/n, where n is 1, 2, 3, 4, or 6 (the only rotations permitted by crystal lattices due to the crystallographic restriction theorem) [26].
- Reflection Planes (Mirrors): Planes that reflect one half of the crystal onto the other half [25].
- Inversion Centers: Points that invert the coordinates of every atom in the crystal (x,y,z → -x,-y,-z) [25].
- Screw Axes: Combinations of rotation and translation parallel to the rotation axis, noted as nₘ, where n indicates the rotation order (2, 3, 4, or 6) and m indicates the fraction of the unit cell translation (e.g., 2₁ represents a 180° rotation followed by a translation of 1/2 the unit cell length) [25].
- Glide Planes: Combinations of reflection and translation parallel to the reflection plane, indicated by letters a, b, c (axial glides), n (diagonal glides), or d (diamond glides) [25].
The 230 Space Groups
The complete set of symmetry operations for a crystal defines its space group. In three dimensions, there are exactly 230 possible space groups that describe all distinct ways to combine the 32 crystallographic point groups with the 14 Bravais lattices and incorporate screw axes and glide planes [25]. Each space group represents a unique combination of symmetry elements that determines how the asymmetric unit is repeated to fill space [25].
For biological macromolecules like proteins, an important restriction applies: only 65 of the 230 space groups (known as Sohncke groups) are possible for chiral molecules because proteins are composed exclusively of L-amino acids [25]. These Sohncke groups contain only rotational and translational symmetry operations—no mirrors, inversions, or glide planes that would require enantiomeric forms [25].
Table 2: Classification of Crystallographic Groups with Protein Relevance
| Group Type | Number in 3D | Description | Relevance to Proteins |
|---|---|---|---|
| Point Groups | 32 | Combinations of rotational symmetry, reflection, and inversion around a point | Describe molecular symmetry |
| Bravais Lattices | 14 | Distinct patterns of lattice points in 3D space | Define crystal packing geometry |
| Space Groups | 230 | Full combinations of point groups with Bravais lattices, screws, and glides | Complete crystal symmetry description |
| Sohncke Groups | 65 | Space groups without mirror, inversion, or glide symmetry | Permissible for chiral protein molecules |
The following diagram illustrates the conceptual relationship between these fundamental crystallographic elements and how they build upon one another to define a crystal's structure:
Practical Application in Protein X-ray Crystallography
From Protein to Crystal
The process of determining a protein structure via X-ray crystallography begins with protein production and purification, followed by crystallization—often described as the major bottleneck in the process [2] [4]. Protein crystallization requires creating supersaturated conditions where the protein slowly comes out of solution to form an ordered lattice rather than an amorphous precipitate [2] [24].
Common crystallization methods include:
- Vapor Diffusion (Hanging/Sitting Drop): A drop containing purified protein and precipitant is suspended (hanging drop) or placed (sitting drop) above a reservoir solution with higher precipitant concentration. Water vapor diffuses from the drop to the reservoir, slowly increasing the concentration of protein and precipitant in the drop until crystallization conditions are reached [2] [24] [5].
- Batch Crystallization: A saturated protein solution is left undisturbed in a sealed container to allow crystal growth over time [24].
- Microbatch Crystallization: A small drop of protein solution is placed under inert oil, where slow diffusion lowers saturation over time, promoting crystal formation [24].
- Dialysis: Protein solution is separated from precipitant solution by a semipermeable membrane, allowing slow equilibrium through diffusion [2] [24].
For successful X-ray diffraction analysis, protein crystals typically need to be at least 0.1 mm in their smallest dimension to provide sufficient crystal lattice volume for measurable diffraction [2].
Data Collection and Symmetry Determination
When a mounted crystal is exposed to an X-ray beam, it produces a diffraction pattern composed of regularly spaced spots known as reflections [2] [5]. The first analysis of this pattern reveals critical information about the crystal's internal symmetry:
- The spot spacing indicates the dimensions of the unit cell (a reciprocal relationship exists where larger unit cells produce more closely spaced spots) [2].
- The symmetry of the diffraction pattern reveals the crystal system and space group [2].
- The resolution of the diffraction pattern (determined by how far the spots extend to the edge of the detector) indicates the level of atomic detail attainable, with spots beyond 3 Å generally required to distinguish amino acid side chains [2].
The following diagram illustrates the complete workflow of a protein X-ray crystallography experiment, highlighting how crystallographic symmetry enables structure determination:
Solving the Phase Problem and Model Building
A fundamental challenge in crystallography is the "phase problem"—while diffraction patterns provide the amplitudes of structure factors, the phase information is lost during measurement but essential for calculating electron density maps [1] [5]. Several methods address this problem in protein crystallography:
- Molecular Replacement: Uses a known homologous structure as a starting model to estimate initial phases [5].
- Single/Multiple Wavelength Anomalous Dispersion (SAD/MAD): Utilizes the anomalous scattering from incorporated heavy atoms (e.g., selenium in methionine residues) or native sulfurs to determine phases [27].
- Heavy Atom Methods: Involves introducing heavy atoms (e.g., mercury, platinum) into the crystal through derivatization to provide phase information [5].
Once initial phases are obtained, an iterative process of electron density map calculation, model building, and refinement begins. The quality of the structure is assessed by R-factor and R-free values, with lower values indicating better agreement between the model and the experimental data [5].
The Scientist's Toolkit: Essential Reagents and Materials
Table 3: Key Research Reagent Solutions for Protein Crystallography
| Reagent/Material | Function in Crystallography | Application Notes |
|---|---|---|
| Crystallization Screens | Sparse matrix solutions varying precipitant, buffer, pH, and salt to identify initial crystallization conditions [2] | Commercial screens typically include 50-100 conditions covering a wide range of variables [2] |
| Precipitants | Agents that reduce protein solubility to promote crystallization (e.g., PEGs, salts, organic solvents) [2] | Concentration optimization critical for crystal quality; affects both crystal nucleation and growth [2] |
| Cryoprotectants | Compounds (e.g., glycerol, ethylene glycol) that prevent ice formation during cryo-cooling of crystals [2] | Essential for data collection at synchrotron sources; typically require concentration 15-25% [2] |
| Heavy Atom Derivatives | Compounds containing heavy atoms (e.g., Hg, Pt, Au) used for experimental phasing [5] | Soak concentrations typically 0.1-10 mM; must bind without disrupting crystal lattice [5] |
| Crystal Mounting Loops | Thin polymer loops (nylon, Kapton) for suspending crystals in cryogenic streams [2] | Size matched to crystal dimensions; provide minimal background scattering [2] |
Advanced Techniques: Serial Crystallography at XFELs
Traditional crystallography requires large, well-ordered single crystals, but recent advances in serial crystallography (SX) have revolutionized the field by enabling structure determination from micro- and nanocrystals [28]. This approach is particularly valuable for membrane proteins and large complexes that are difficult to crystallize to large sizes. Serial crystallography involves rapidly streaming microcrystals across an X-ray beam, collecting diffraction patterns from thousands of individual crystals before they are destroyed by radiation damage [28].
Two primary sample delivery methods have been developed to minimize sample consumption:
- Fixed-Target Systems: Crystals are deposited on a solid support and raster-scanned through the X-ray beam, allowing efficient recovery of unused sample [28].
- Liquid Injection Systems: Crystal slurries are continuously injected as a liquid stream or segmented into droplets, enabling high data collection rates [28].
These advanced methods have reduced protein consumption from gram quantities in early SX experiments to microgram amounts today, making structural studies feasible for biologically relevant proteins that were previously intractable [28]. The theoretical minimum sample requirement for a complete SX dataset has been estimated at approximately 450 ng of protein, assuming optimal conditions [28].
The concepts of unit cells, symmetry, and space groups form the essential framework that enables protein structure determination through X-ray crystallography. For researchers in drug development and structural biology, understanding these principles is not merely academic—it provides the foundation for interpreting electron density maps, validating atomic models, and designing experiments to capture protein-ligand interactions. As crystallographic techniques continue to evolve, particularly with the advent of serial methods at X-ray free-electron lasers, these fundamental concepts remain central to extracting biological insight from diffraction data. The crystalline state, with its precise mathematical description of molecular arrangement, continues to serve as the critical bridge between a protein's amino acid sequence and its three-dimensional atomic structure, enabling targeted drug design and mechanistic studies across all areas of biomedicine.
In the realm of structural biology, X-ray crystallography has been instrumental in elucidating the three-dimensional atomic structures of proteins, thereby providing profound insights into their function and facilitating drug discovery. The technique relies on measuring the diffraction patterns generated when X-rays interact with a protein crystal. However, a fundamental challenge—the "phase problem"—arises because the recorded diffraction data contains information about the amplitudes of the diffracted waves but lacks their phase information. Since both amplitudes and phases are required to compute an electron density map and determine the atomic structure, solving the phase problem is a critical step in structural determination. This whitepaper provides an in-depth examination of the phase problem, detailing its origins, the methodological approaches developed to overcome it, and the modern innovations that have made this challenge more tractable for today's researchers.
X-ray crystallography enables the determination of atomic structures by analyzing the diffraction patterns produced when a crystal is exposed to X-ray radiation. A crystal is a periodic arrangement of molecules, and this periodicity amplifies the diffraction signal to measurable levels [29]. The relationship between the crystal lattice and the resulting diffraction pattern is described by Bragg's Law, ( nλ = 2d \sin(θ) ), which relates the X-ray wavelength ( λ ), the lattice spacing ( d ), and the diffraction angle ( θ ) [4].
The diffraction pattern is a collection of reflections (spots), each characterized by an amplitude and a phase. The amplitude can be derived from the measured intensity of the reflection. However, the phase, which indicates the relative shift of the wave, is lost during data collection [30] [31]. This constitutes the phase problem: the inability to directly measure the phase information essential for reconstructing the electron density map via Fourier synthesis [30]. The central importance of phases is underscored by the fact that they often contribute more significantly to the quality of the electron density map than the amplitudes [31].
The Critical Role of Phases in Structure Determination
The Critical Role of Phases in Structure Determination
The process of structure determination requires the calculation of an electron density map, ( ρ(x, y, z) ), from the measured diffraction data. This calculation is a Fourier synthesis that incorporates both the structure factor amplitudes ( |F(hkl)| ) and their corresponding phases ( φ(hkl) ) for each reflection index ( hkl ) [30]. The electron density map is thus expressed as:
[ ρ(x, y, z) = \frac{1}{V} \sum{h} \sum{k} \sum_{l} |F(hkl)| e^{iφ(hkl)} e^{-2π i (hx + ky + lz)} ]
Without phase information, the transformation from diffraction data to a meaningful structural model is impossible. The phases determine the positions of the atoms in the map, while the amplitudes primarily influence the sharpness of the peaks [31]. It is estimated that approximately 40% of crystallography projects are hindered by the phase problem, particularly for novel proteins that lack homologous structural models [31].
Methodologies for Solving the Phase Problem
Several experimental and computational strategies have been developed to overcome the phase problem. The choice of method often depends on the protein under investigation and the availability of previous structural information.
Experimental Phasing Methods
Experimental phasing involves introducing atoms with strong scattering power into the crystal and measuring the resulting changes in diffraction.
- Heavy Atom and Isomorphous Replacement Methods: The traditional method of Multiple Isomorphous Replacement (MIR) involves soaking heavy-atom compounds (e.g., mercury or platinum derivatives) into protein crystals. By comparing the diffraction patterns from native and derivative crystals, phase information can be derived [30]. A key requirement is that the incorporation of heavy atoms must not alter the crystal lattice (i.e., the crystals must be isomorphous).
- Anomalous Diffraction: This powerful method exploits the anomalous scattering that occurs when the X-ray wavelength is tuned near the absorption edge of a specific element within the crystal. Commonly used methods include Single-wavelength Anomalous Diffraction (SAD) and Multi-wavelength Anomalous Diffraction (MAD) [30] [31]. A prevalent strategy is to incorporate selenomethionine (Se-Met), where the sulfur in methionine is replaced with selenium, providing a strong anomalous signal. This method has become a mainstay for de novo structure determination [30] [31]. Furthermore, native SAD, which utilizes the weak anomalous signal from intrinsic sulfur atoms in cysteine and methionine, has become increasingly routine, eliminating the need for heavy-atom derivatization [30].
Table 1: Key Experimental Phasing Methods and Their Characteristics
| Method | Key Principle | Common Reagents | Key Advantage | Key Challenge |
|---|---|---|---|---|
| MIR/SIR | Uses heavy atoms to perturb diffraction amplitudes. | Hg, Pt, Au compounds | Established, reliable method. | Requires perfectly isomorphous crystals. |
| SAD/MAD | Exploits wavelength-dependent anomalous scattering. | Selenomethionine, Halides | Can be performed with a single crystal. | Requires tunable X-ray source (synchrotron). |
| Native SAD | Uses anomalous signal from intrinsic atoms (S, P). | None (intrinsic S atoms) | No chemical modification of the protein needed. | Very weak signal; requires high-quality data. |
Computational and Hybrid Phasing Methods
- Molecular Replacement (MR): This is currently the most dominant phasing method [30]. MR utilizes a known, homologous protein structure (a "search model") to generate initial phases for the unknown crystal structure. The method involves rotating and translating the search model within the unit cell of the target crystal until its calculated diffraction pattern matches the observed data [31]. The success of MR is highly dependent on the sequence similarity and structural conservation between the search model and the target.
- Direct Methods and Density Modification: Direct methods use probabilistic relationships between reflection intensities and phases and are highly effective for small molecules. For macromolecules, they are primarily used to locate heavy atoms in SAD analyses [30]. Density modification is an iterative process that refines initial phases by imposing known chemical constraints, such as the non-negativity of electron density and the uniformity of the solvent region [30] [31]. Software packages like PHENIX AutoBuild integrate these techniques for automated model building and refinement [31].
- Advanced Computing and Artificial Intelligence: The field has been revolutionized by the advent of AI-based protein structure prediction tools. AlphaFold and RoseTTAFold can generate highly accurate predicted structures, which can then be used as search models for Molecular Replacement, often obviating the need for experimental phasing altogether [30] [31]. Furthermore, deep learning models like CrysFormer are being developed to infer phases or atomic coordinates directly from diffraction data [31].
Table 2: Key Reagents and Computational Tools for Phase Determination
| Category | Item | Primary Function in Phase Determination |
|---|---|---|
| Research Reagents | Selenomethionine | Provides a strong anomalous scatterer for SAD/MAD phasing via incorporation into expressed proteins [31]. |
| Heavy Atom Compounds (e.g., K₂PtCl₄) | Used in soaking experiments for MIR phasing by perturbing diffraction amplitudes [30]. | |
| Computational Tools | Molecular Replacement Software (e.g., Phaser) | Positions a known homologous structure in the target unit cell to obtain initial phases [31]. |
| Density Modification (e.g., PHENIX) | Iteratively improves initial phases using chemical constraints like solvent flattening [31]. | |
| AI Models (e.g., AlphaFold) | Generates predicted protein structures for use as search models in Molecular Replacement [30] [31]. |
The Experimental Workflow for Phase Determination
The following diagram outlines the standard decision-making workflow and methodologies employed to solve the phase problem in a typical X-ray crystallography project.
Workflow for Solving the Phase Problem
Recent Advances and Future Outlook
The field of crystallographic phasing continues to evolve rapidly. Native SAD, leveraging intrinsic sulfur atoms, is now a routine and powerful approach, avoiding the need for selenomethionine incorporation [30]. The development of serial crystallography at X-ray free-electron lasers (XFELs) and synchrotrons, which uses microcrystals and a "diffraction-before-destruction" approach, has opened new avenues for studying challenging proteins [28]. Most significantly, the integration of artificial intelligence, particularly AlphaFold2, has transformed the practice. Researchers can now often bypass experimental phasing entirely by using AI-predicted models for Molecular Replacement, fundamentally changing the strategy for many structural biology projects [30] [31]. While cryo-electron microscopy (cryo-EM) has emerged as a complementary technique that "finesses the phase problem" by creating images directly [30] [32], X-ray crystallography remains a cornerstone of structural biology, with the phase problem now being a more manageable challenge due to this powerful confluence of experimental and computational methods.
The phase problem has been a central intellectual and practical challenge in X-ray crystallography since its inception. Overcoming it requires a combination of sophisticated experimental techniques, such as anomalous diffraction and isomorphous replacement, and advanced computational methods, including molecular replacement and density modification. The ongoing integration of artificial intelligence and the development of more sensitive experimental approaches like native SAD have dramatically increased the success rate and efficiency of structure determination. For researchers in drug development and structural biology, a deep understanding of these phasing strategies is indispensable for determining and analyzing the high-quality protein structures that underpin modern mechanistic studies and rational drug design.
A Step-by-Step Workflow from Protein to Atomic Model
Within the broader context of X-ray crystallography, the production and purification of a protein sample are not merely preliminary steps; they are the fundamental determinants of success. X-ray crystallography is the premier technique for determining the three-dimensional atomic structures of biological macromolecules, providing indispensable insights into their function and guiding areas such as rational drug design and enzyme mechanism elucidation [2]. The technique's ultimate goal is to obtain a high-resolution three-dimensional molecular structure from a crystal [2]. However, this entire process is critically dependent on the ability to grow a high-quality crystal, which in turn is almost exclusively governed by the homogeneity, stability, and monodispersity of the purified protein sample [33] [34]. It is often stated that the growth of protein crystals is the rate-limiting step in most crystallographic work [2], and this step is intrinsically linked to the quality of the purified protein. A protein that is heterogeneous, impure, or unstable will simply not form the ordered lattice necessary for diffraction studies. This guide details the core principles and methodologies for producing and purifying proteins to meet the exacting standards required for successful crystallization.
Core Principles: The Link Between Protein Purity and Crystallizability
The process of crystallization requires protein molecules to self-assemble into a highly ordered, repeating three-dimensional lattice. For this to occur, the protein must adopt a uniform conformational state and present consistent surface properties to form specific, reversible contacts with neighboring molecules in the crystal [33]. The presence of impurities, conformational heterogeneity, or aggregation disrupts these precise interactions, leading to precipitation or the formation of microcrystals unsuitable for data collection.
Macromolecular crystals are, by their nature, porous structures, typically composed of approximately 50% solvent on average [33]. The lattice is stabilized by a relatively small number of contacts between protein molecules compared to crystals of small molecules. Consequently, they are mechanically fragile and require a highly pure and uniform sample to form a stable crystal lattice [33]. The objective during purification is therefore to obtain a sample that is not only chemically pure (a single amino acid sequence) but also conformationally pure (a single, stable folding state).
Recent advances in crystal growth prediction models highlight the critical importance of biophysical characterization. A hybrid model, HyXG-1, which combines sequence-derived data with experimental biophysical data, has been shown to be more powerful than sequence-based prediction alone [34]. Key experimentally determined factors that impact crystallizability include:
- Homogeneity: A uniform population of protein molecules in terms of aggregation state and purity [34].
- Solubility: The protein must remain soluble at the high concentrations required for crystallization [34].
- Stability: The folded state must be stable under the conditions used for crystallization screening [34].
Protein Production Systems
The first step is obtaining a sufficient quantity of the protein of interest. A reliable source of protein must be available, together with a purification/concentration protocol that will yield high-quality, homogeneous, soluble material [2].
Table 1: Common Protein Production Systems for Crystallography
| Production System | Typical Yield | Key Advantages | Key Limitations | Ideal For |
|---|---|---|---|---|
| Prokaryotic (E. coli) | High (mg/L scale) | Cost-effective, rapid growth, well-established genetics [4] | Lack of post-translational modifications (PTMs), potential insolubility (inclusion bodies) [4] | Non-glycosylated proteins, prokaryotic proteins, initial screening |
| Baculovirus/Insect Cells | Moderate to High | Supports most PTMs, higher complexity proteins, correct folding [34] | More expensive, slower, technically more complex | Eukaryotic proteins, kinases, membrane-associated proteins |
| Mammalian Cells | Low to Moderate | Full human-like PTMs, highest biological accuracy | Highest cost, lowest yield, technically demanding | Complex proteins requiring specific glycosylation |
For most research purposes, molecular biology techniques are used to clone the gene of interest into an expression plasmid, which is then used to transform a host organism, most commonly Escherichia coli [4]. Expression is typically induced, and the cells are later lysed to release the protein [4]. The choice of expression system is a critical first decision, as it dictates the need for subsequent steps to address issues like misfolding or the absence of necessary modifications.
Key Purification Techniques and Strategies
A multi-step purification strategy is essential to achieve the homogeneity required for crystallization. The following techniques are routinely employed in various combinations.
Affinity Chromatography
This is almost universally the first purification step due to its high specificity and yield. A genetic tag, such as a polyhistidine-tag (His-tag), is engineered onto the protein. The tagged protein binds specifically to a resin (e.g., nickel-nitrilotriacetic acid, Ni-NTA) while impurities are washed away. The pure protein is then eluted, typically using imidazole [34]. The SGPP and MSGPP consortium protocols, for example, use N-terminal His6 tags and Ni-NTA chromatography as a primary capture step [34]. A key consideration is whether to cleave the affinity tag after purification, as it can sometimes interfere with crystallization [34].
Size Exclusion Chromatography (SEC)
SEC, or gel filtration, separates proteins based on their hydrodynamic radius. It is an excellent polishing step to remove aggregates and higher-order oligomers, which are detrimental to crystallization [34]. Furthermore, SEC can be used to exchange the protein into a final buffer suitable for concentration and crystallization trials, and it provides information about the monodispersity and oligomeric state of the sample in solution [34] [5].
Ion Exchange Chromatography
This technique separates proteins based on their net surface charge. It is a powerful intermediate step for resolving proteins with similar sizes but different charge characteristics, further enhancing sample purity.
The following workflow diagram illustrates a typical multi-step purification strategy for a crystallography-grade protein.
Biophysical Characterization: The Quality Control Gateway
Before proceeding to crystallization trials, the purified protein must be rigorously characterized to assess its suitability. Several biophysical assays are used to predict crystallization outcomes [34].
- Dynamic Light Scattering (DLS): This technique measures the hydrodynamic radius of particles in solution. It is a critical tool for assessing the monodispersity of a sample. A monodisperse sample will show a single, sharp peak, whereas multiple peaks or a broad peak indicate aggregation or heterogeneity, which is negatively correlated with crystallization success [34].
- Differential Scanning Fluorimetry (DSF): Also known as a thermal shift assay, DSF measures protein thermal stability by monitoring the unfolding of a protein as temperature increases, using a fluorescent dye that binds to hydrophobic patches exposed upon denaturation. The melting temperature (Tm) provides a measure of stability, and the shape of the curve can indicate homogeneity. The ratio of DSF intensity at 30°C to that at Tm, known as R30, has been used as a novel variable in predictive models of crystallization [34].
- Limited Proteolysis (LP): This assay probes the flexibility and dynamics of surface loops. A protein with rigid, well-structured domains will show a characteristic pattern of stable fragments when exposed to a protease for a limited time. Excessive degradation suggests high flexibility, which can hinder crystallization [34].
- SDS-PAGE Analysis: This standard technique confirms chemical purity and the integrity of the protein sample, ensuring no degradation has occurred during purification [34].
Table 2: Biophysical Characterization Methods for Crystallization Assessment
| Method | Parameter Measured | Target Outcome for Crystallization | Interpretation of Results |
|---|---|---|---|
| Dynamic Light Scattering (DLS) | Hydrodynamic radius, polydispersity | Monodisperse population (polydispersity < 25-30%) | A single, sharp peak suggests a uniform sample; multiple peaks suggest aggregates. |
| Differential Scanning Fluorimetry (DSF) | Thermal stability (Tm), cooperativity of unfolding | High Tm, cooperative single transition | A single, sharp melting transition suggests a homogeneous, stable protein. |
| Analytical SEC | Oligomeric state, aggregation | Single, symmetric elution peak | Confirms the sample is in a single, uniform oligomeric state without aggregates. |
| Limited Proteolysis | Protein flexibility/dynamics | Stable, defined protein fragments | Suggests the presence of stable, folded domains; excessive cleavage suggests disorder. |
The Scientist's Toolkit: Essential Reagents and Materials
The following table details key reagents and materials essential for the production, purification, and characterization of proteins for crystallography.
Table 3: Key Research Reagent Solutions for Protein Production and Purification
| Reagent / Material | Function / Purpose | Example Use in Protocol |
|---|---|---|
| Affinity Resins | Selective capture of tagged protein | Ni-NTA resin for purifying His-tagged proteins [34]. |
| Protease Inhibitors | Prevent proteolytic degradation during purification | Added to lysis buffer to maintain protein integrity. |
| Detergents | Solubilize membrane proteins or prevent aggregation | CHAPS used in lysis buffer for some membrane-associated proteins [34]. |
| Size Exclusion Resins | Polishing step to remove aggregates and buffer exchange | Superdex or Sephacryl resins for final purification step [34]. |
| Reducing Agents (DTT) | Maintain cysteine residues in reduced state | Added (e.g., 5 mM) to purification and storage buffers to prevent disulfide-mediated aggregation [34]. |
| Crystallization Screens | Sparse matrix of conditions to identify initial crystallization hits | Commercial screens used in vapor diffusion experiments [2] [33]. |
| SYPRO Orange Dye | Fluorescent dye for DSF/thermal shift assays | Binds hydrophobic patches exposed upon protein unfolding to measure stability [34]. |
Protein production and purification are the unsung heroes of successful X-ray crystallography. While the allure of atomic-resolution structures is powerful, it is the meticulous, often iterative work at the bench—expressing, purifying, and rigorously characterizing a protein—that lays the indispensable groundwork for growing a diffraction-quality crystal. By adhering to a strategy that prioritizes homogeneity, stability, and monodispersity, and by employing biophysical tools to quantitatively assess these properties, researchers can systematically overcome the primary bottleneck in structural biology and pave the way for groundbreaking discoveries.
X-ray crystallography remains one of the most powerful methods for determining the three-dimensional structure of biological macromolecules at atomic resolution, providing deep and unique understanding of protein function and helping to unravel the inner workings of the living cell [35]. To date, approximately 86% of the structures in the Protein Data Bank (rcsb-PDB) were determined using X-ray crystallography [35]. The process involves several critical steps: protein purification, crystallization, X-ray diffraction, data collection, and model building [36]. Among these, protein crystallization often represents the most significant bottleneck, requiring bringing the macromolecule to a state of supersaturation where it can form a regular, ordered three-dimensional lattice [35] [37].
The quality of the final protein structure is fundamentally dependent on the quality of the crystals obtained. This technical guide focuses on the core methods of vapor diffusion crystallization and screening strategies, framing them within the broader context of structural biology research and drug development. Mastering these techniques enables researchers to progress from purified protein samples to diffraction-quality crystals suitable for structural analysis.
Fundamental Principles of Protein Crystallization
Protein crystallization occurs when a purified protein solution is brought to a state of supersaturation under controlled conditions. In this metastable state, the protein solution contains a higher concentration of protein than would be stable at equilibrium, creating a driving force for the molecules to leave the solution phase and form a solid crystal lattice [35]. The process involves two key stages: nucleation, where small, stable aggregates (nuclei) form, and crystal growth, where these nuclei grow as additional molecules from the solution incorporate into the lattice.
The crystallization process is typically mapped on a phase diagram that plots protein concentration against precipitant concentration. This diagram identifies several key zones:
- Undersaturated Zone: The protein remains in solution and no crystallization occurs.
- Metastable Zone: Crystal growth can occur but nucleation is unlikely.
- Nucleation Zone: Both nucleation and crystal growth can occur spontaneously.
- Precipitation Zone: The protein concentration is too high, leading to rapid, disordered aggregation [35] [38].
The objective of vapor diffusion methods is to guide the protein solution from an undersaturated state through the metastable zone into the nucleation zone in a controlled manner, then allow it to return to the metastable zone for optimal crystal growth.
Vapor Diffusion Methods: Core Techniques and Protocols
Vapor diffusion is the most commonly employed technique for protein crystallization screening and optimization. Two principal variants—hanging drop and sitting drop—share the same fundamental mechanism but differ in their practical setup.
The Principle of Vapor Diffusion
In vapor diffusion experiments, a small drop containing a mixture of protein solution and precipitant is sealed in an enclosed chamber alongside a larger reservoir of precipitant solution. The key feature is that the precipitant concentration in the reservoir is higher than in the initial drop. This creates an osmotic pressure difference, causing water vapor to diffuse from the protein drop toward the reservoir until equilibrium is reached [35]. This gradual dehydration slowly concentrates both the protein and precipitant in the drop, ideally guiding the system through the nucleation zone of the phase diagram and resulting in crystal formation [35].
Table 1: Comparison of Vapor Diffusion Crystallization Techniques
| Feature | Hanging Drop | Sitting Drop | Micro-Batch |
|---|---|---|---|
| Drop Setup | Drop on cover slide suspended over reservoir | Drop on a shelf or bridge within the well | Drop under oil, no vapor diffusion |
| Protein Consumption | Small to Large | Small | Small |
| Ease of Automation | Possible | Possible | Not Possible |
| Ease of Harvesting | Easy | Easy | Difficult |
| Key Advantage | Well-established, easy to observe | Reduced surface tension, better for some proteins | No equilibration time, direct control |
Standardized Experimental Protocol
The following protocol details the steps for setting up vapor diffusion crystallization experiments, applicable for both initial screening and optimization [35] [37].
Materials Required:
- Protein sample: Purified to homogeneity, concentrated (typically 5-50 mg/mL)
- Crystallization tray: 24-well hanging/sitting drop tray
- Precipitant solutions: Commercial screens or custom formulations
- Reservoir solution: Precipitant at appropriate concentration
- Silicon grease (for hanging drop)
- Cover slides (for hanging drop) or Optical sealing tape (for sitting drop)
- Micropipette with low-retention tips (0.1-2 μL)
- Professional wipes for cleaning
Step-by-Step Procedure:
Protein Sample Preparation:
- Thaw the protein sample on ice. Typical concentrations range from 5-50 mg/mL, with higher concentrations generally giving better results [35].
- Centrifuge the sample at 18,000 × g for 15 minutes at 4°C to remove any aggregates or precipitate that could promote amorphous precipitation.
- Determine the final protein concentration by measuring absorbance at 280 nm using a UV spectrophotometer and the protein's extinction coefficient [35] [37].
Precipitant Solution Preparation:
- Prepare crystallization solutions, typically combining a precipitating agent, salt, and buffer to set the pH. Additives may be included for specific proteins.
- Filter all stock solutions using a 0.22 μm filter, particularly for viscous solutions like PEG [35].
- For initial screens, use commercially available screens that exploit the sparse matrix incomplete factorial method of trial conditions, biased toward known successful crystallization conditions [35].
Tray Setup:
- Fill the wells of the 24-well tray with 500 μL of precipitant solution as the reservoir.
- For hanging drops: Create a silicone grease ring around the edge of each well, leaving a small gap to prevent air pressure buildup.
- For sitting drops: No grease is required as the well will be sealed with optical tape [35].
Drop Preparation and Sealing:
- Clean a cover slide (hanging drop) or the shelf (sitting drop) with condensed air spray or a professional wipe to remove dust.
- Pipette equal volumes of protein sample and reservoir solution onto the cover slide or shelf. A typical starting point is 2 μL of each, though different ratios can be optimized later.
- Exercise extreme care to avoid bubble formation during pipetting.
- For hanging drops: Gently flip the cover slide and place it over the well, pressing down to create a seal while allowing air to escape through the notch.
- For sitting drops: Seal the well with optically clear transparent tape [35] [37].
Incubation and Monitoring:
- Place the tray at the desired incubation temperature (commonly 20°C, or between 4°C and room temperature).
- Handle trays gently and avoid vibrations or temperature changes that can disrupt crystal growth.
- Check trays for crystal formation the following day, then every few days. Document findings in a scoring sheet.
- Crystals typically appear in 2-5 days, though some may appear immediately or take months. Once identified, minimize disturbance to allow crystals to grow to their full size [35].
The following diagram illustrates the vapor diffusion workflow and the changing concentration dynamics within the drop:
Vapor Diffusion Workflow
Crystallization Screening and Optimization Strategies
Initial crystallization screening employs a systematic approach to explore a broad range of conditions to identify "hits" – conditions that produce crystals, even of poor quality, which can then be optimized.
Screening Methodologies
- Sparse Matrix Incomplete Factorial Screening: This is the most common initial screening approach, using commercially available screens that bias conditions toward known successful crystallization parameters. These screens efficiently explore chemical space with a minimal number of trials by combining precipitants, salts, and buffers at varying pH levels [35].
- Grid Screening: Once initial hits are identified, grid screening around the successful condition systematically varies parameters such as precipitant concentration and pH to optimize crystal quality and size [35] [37].
The most commonly successful precipitants are polyethylene glycol (PEG), followed by ammonium sulfate. Together, these two precipitants account for approximately 60% of all recorded macromolecular crystallization conditions [35].
Optimization Techniques
After identifying initial hits, several optimization strategies can improve crystal quality:
- Additive Screening: Introducing small molecules (additives) that can modify crystal packing or improve crystal morphology.
- Seeding: Transferring microscopic crystal nuclei from a pre-existing crystallization experiment to a fresh, supersaturated protein solution to promote growth without spontaneous nucleation.
- Temperature Variation: Testing crystallization at different temperatures (e.g., 4°C, 12°C, 20°C) to find optimal growth conditions.
- Protein:Precipitant Ratio Adjustment: Varying the ratio of protein to precipitant in the drop (e.g., 2:1, 1:1, 1:2) to control the rate of concentration and nucleation density [35] [37] [38].
Table 2: Common Precipitants and Their Successful Application Rates in Protein Crystallization
| Precipitant Type | Examples | Approximate Success Rate | Key Considerations |
|---|---|---|---|
| Polymers | Polyethylene Glycol (PEG) 400, 1000, 8000 | ~40% | Viscous; requires filtration and careful mixing |
| Salts | Ammonium Sulfate, Sodium Chloride, Sodium Citrate | ~20% | Can require high concentrations |
| Organic Solvents | MPD, 2-Propanol, Ethanol | ~15% | Can denature sensitive proteins |
| Buffers and pH | HEPES, Tris, Acetate, Phosphate | Critical factor | Affects protein solubility and stability |
The Scientist's Toolkit: Essential Research Reagents and Materials
Successful protein crystallization requires specific reagents and tools designed to handle small volumes and create controlled environments.
Table 3: Essential Research Reagent Solutions for Protein Crystallization
| Item | Function | Technical Specifications |
|---|---|---|
| Purified Protein Sample | The target molecule for crystallization | Homogeneous, concentrated (5-50 mg/mL), high purity [35] |
| Precipitant Solutions | Reduce protein solubility to induce crystallization | PEG, salts, organic solvents; filtered through 0.22 μm filter [35] |
| Crystallization Plates | Platform for setting up crystallization trials | 24-well for manual setup; 96-well for high-throughput screening |
| Silicon Grease | Creates airtight seal for vapor diffusion chambers | Applied in rings around well edges with a small gap for pressure release [35] |
| Cover Slides | Surface for hanging drops in vapor diffusion | Siliconized to control drop spreading; cleaned to eliminate dust [35] |
| Sealing Tape | Seals sitting drop and batch crystallization wells | Optically clear for visualization without disturbing the experiment [35] |
| Paraffin/Mineral Oil | Prevents evaporation in microbatch crystallization | Creates a protective overlay; minimal interaction with protein and reagents [35] [38] |
Advanced Approaches and Future Directions
The field of protein crystallization continues to evolve with new technologies enhancing efficiency and success rates.
- Automation and Robotics: Automated systems like the NT8 Drop Setter can dispense nanoliter-scale drops (10 nL to 1.5 μL) with high precision, enabling high-throughput screening while conserving precious protein samples. These systems support various setups including hanging drops, sitting drops, and lipidic cubic phase (LCP) methods [38].
- Advanced Imaging and AI: Automated imaging systems (Rock Imagers) equipped with multiple modalities (visible light, UV, multi-fluorescent imaging, SONICC) can distinguish protein crystals from salt crystals. Integration of AI-based autoscoring models (e.g., Sherlock) helps analyze extensive image datasets to identify promising crystallization hits [38].
- Fixed-Target Serial Crystallography: New devices like the HARE chip and AFD-X allow protein crystallization directly within the features of X-ray transparent microfluidic chips. This approach minimizes sample handling and physical stress on crystals, making it particularly valuable for serial crystallography experiments at synchrotrons and XFELs [39] [40].
- Computational Prediction: Emerging computational approaches, such as the MASCL method that integrates AlphaFold with symmetrical docking, show promise for predicting crystal packing interfaces and systematically exploring crystallization conditions, potentially reducing experimental trial-and-error [41].
Protein crystallization through vapor diffusion and systematic screening remains a cornerstone technique in structural biology, enabling researchers to decipher protein function through three-dimensional structure determination. While often considered challenging, mastering the principles of supersaturation, phase diagrams, and vapor diffusion mechanics provides a foundation for successful crystal growth.
The continuing evolution of crystallization technologies—including automation, advanced imaging, and microfluidic devices—is steadily transforming crystallization from an artisanal "black magic" process to a more predictable, high-throughput science. These advancements, combined with robust screening methodologies and careful optimization, are expanding the frontiers of structural biology and opening new possibilities for drug discovery and functional analysis of biological macromolecules.
Within the broader context of a thesis on how X-ray crystallography works for protein research, the data collection phase is a critical experimental juncture. This stage transforms a physical protein crystal into a digital diffraction dataset, the primary source from which a three-dimensional atomic model will be derived. The fidelity of the final model is entirely contingent upon the quality of the raw data collected [2]. This guide details the core components and methodologies of modern data collection, focusing on the essential triad of the X-ray source, the detector, and the rotation method. For researchers in structural biology and drug development, mastering these elements is key to elucidating protein function, understanding disease mechanisms, and facilitating structure-based drug design [2] [8].
Essential Components of Data Collection
X-rays for protein crystallography are generated by accelerating electrons onto a metal target. The resulting X-ray wavelength is characteristic of the target material, with common anodes including Copper (Cu, λ = 1.54 Å), Molybdenum (Mo, λ = 0.71 Å), and Silver (Ag, λ = 0.56 Å) [42]. The choice of source dictates the flux, brightness, and scale of feasible experiments.
Table 1: Comparison of X-ray Sources Used in Protein Crystallography
| Source Type | Key Technology | Typical Flux & Brightness | Key Advantages | Common Applications |
|---|---|---|---|---|
| Sealed Tube [43] [42] | Fixed metal anode (e.g., Cu, Mo) in a vacuum. | ~10⁸ photons/sec/mm² | Beam stability, low maintenance, ease of use. | Routine chemical crystallography; educational use. |
| Rotating Anode [42] [44] | Spinning anode to distribute heat from electron impact. | ~10⁹ photons/sec/mm² | Higher intensity than sealed tubes. | Medium-quality protein crystals; in-house data collection. |
| Microfocus Source (e.g., IµS) [43] | Microfocus electron beam on a hybrid metal-diamond anode. | High brightness (>10¹⁰ photons/sec/mm²) | High brilliance from a small beam, air-cooled. | Standard for modern in-house protein crystallography. |
| Liquid Jet Source (e.g., METALJET) [43] | Liquid gallium jet as a regenerating anode. | Extremely high (>10¹² photons/sec/mm²) | Highest in-house intensity, stable over time. | Very small or weakly diffracting crystals; synchrotron-like performance in-lab. |
| Synchrotron [2] [42] | Bending magnets or undulators force high-energy electrons to emit X-rays. | Exceptional (many orders brighter than lab sources) | Tunable wavelength, extreme intensity, microbeams. | The most challenging projects: tiny crystals, large unit cells, time-resolved studies. |
X-Ray Detectors
The detector's role is to accurately record the position and intensity of diffracted X-rays. Modern protein crystallography has moved from historical X-ray film and imaging plates to faster, more sensitive electronic detectors [2]. The current standard is the hybrid pixel detector, which offers direct, noise-free photon counting [45] [46].
Table 2: Key Detector Technologies for Protein Crystallography
| Detector Type | Detection Principle | Key Performance Characteristics | Advantages for Protein Crystallography |
|---|---|---|---|
| Imaging Plates [2] | Photo-stimulable phosphor plate. | High sensitivity, large area. | Was an improvement over film; now largely superseded. |
| CCD Detectors [2] | Fiber-optic coupling to a scintillator, then a Charge-Coupled Device. | Fast readout, good sensitivity. | Revolutionized data collection speed; now being replaced by direct-detection methods. |
| Hybrid Pixel (e.g., PHOTON IV, EIGER2, PILATUS4) [45] [47] [46] | Direct conversion of X-rays to charge in a semiconductor sensor (Si or CdTe). | True photon counting (zero noise), high dynamic range, very fast frame rates (ms), high sensitivity over a wide energy range. | Gold standard. Enables shutterless data collection, accurate measurement of strong/weak reflections simultaneously, and handles high flux from synchrotrons and modern lab sources. |
Critical detector features for high-quality data include:
- Large Active Area (e.g., 111 x 145 mm²): Captures more reflections per image [45].
- High Dynamic Range: Accurately measures both very strong and very weak reflections within the same image, crucial for solving the phase problem [45].
- Small Pixels and High Spatial Resolution: Allows clear separation of closely-spaced diffraction spots from large protein unit cells [46].
- Mixed-Mode Detection: Combines photon-counting for weak signals with integrating modes for very strong exposures, maximizing data accuracy [45].
The Rotation Method
The rotation method (or oscillation method) is the universal technique for collecting a complete X-ray diffraction dataset from a single crystal [2]. The crystal is mounted on a goniometer and rotated through a small angle (typically 0.1° to 1.0°) while the detector records all diffracted spots in a still image. This process is repeated over a total rotation range—often 180° or more for lower-symmetry crystals—to capture a complete set of unique reflections [2].
The following diagram illustrates the core workflow and logical relationships in a standard rotation data collection experiment.
Detailed Experimental Protocol & Methodologies
Pre-Data Collection: Crystal Preparation and Mounting
- Crystal Harvesting: Using a micromount loop, a single protein crystal of adequate size (typically > 0.1 mm) is extracted from the crystallization drop [2].
- Cryo-Cooling: The crystal is rapidly vitrified by plunging the loop into liquid nitrogen. This is almost universally performed to minimize radiation damage during data collection. A cryoprotectant (e.g., glycerol, ethylene glycol) is added to the mother liquor prior to freezing to prevent ice formation [2] [42].
- Mounting: The loop containing the frozen crystal is then transferred to the goniometer on the diffractometer, which maintains the crystal at cryogenic temperature (typically 100 K) via a stream of liquid nitrogen [2].
Instrument Setup and Alignment
- Beam Collimation: X-rays are focused into a parallel beam and collimated with adjustable slits to a diameter (e.g., 0.1-0.3 mm) matched to the crystal size [2].
- Crystal Centering: The goniometer head is used to meticulously adjust the crystal's position so it remains precisely at the center of rotation and within the X-ray beam during the entire experiment [2] [47].
- Detector Positioning: The detector distance is set based on the desired resolution. The relationship is given by the equation: ( Resolution = \frac{\lambda}{2 \sin(\theta)} ), where 2θ is the diffraction angle. A smaller distance captures lower-resolution data, while a larger distance is needed to resolve high-resolution spots at the detector's edge [2].
Data Collection Strategy
A successful strategy involves determining the optimal parameters to measure all unique reflections with high completeness and precision while minimizing radiation damage.
- Test Exposure: A preliminary, still image or a small (1-5°) rotation test is collected to assess crystal quality, diffraction resolution, and determine initial crystal symmetry and unit cell parameters [2].
- Strategy Calculation: Software (e.g., XCollect SC [47]) uses the test data to recommend an optimal strategy. This includes:
- Total Rotation Range: Dependent on the crystal's space group symmetry. High-symmetry crystals (e.g., cubic) may require as little as 35°, while low-symmetry crystals (e.g., monoclinic) may require 180° or more [2].
- Rotation Width per Image: A compromise between data completeness (smaller width) and file size/collection time (larger width). Typically 0.1° to 1.0°.
- Exposure Time per Image: Optimized to ensure strong reflections are not saturated and weak reflections are still measurable above the noise, leveraging the detector's high dynamic range [45] [46].
- Data Collection Execution: The strategy is executed automatically by the diffractometer. Modern shutterless detectors and fast readout rates allow for continuous rotation and data acquisition, significantly speeding up the process [2] [46].
The Scientist's Toolkit: Essential Research Reagent Solutions
The following table catalogs key materials and reagents essential for successful X-ray crystallography data collection.
Table 3: Essential Materials and Reagents for Data Collection
| Item / Reagent | Function & Application in Data Collection |
|---|---|
| High-Purity Protein | A homogeneous, monodisperse sample at high concentration (>10 mg/mL) is the non-negotiable starting material for growing diffraction-quality crystals [2] [4]. |
| Crystallization Screens | Sparse-matrix solutions (e.g., from Hampton Research, Qiagen) systematically varying precipitant, buffer, pH, and salt to identify initial crystallization conditions [2]. |
| Cryoprotectants | Chemicals like glycerol, ethylene glycol, or sucrose. Added to the crystal's mother liquor prior to flash-cooling to prevent destructive ice formation [2]. |
| Microsample Loops | Small nylon or plastic loops (e.g., MITeGen loops) used to harvest and mount the individual crystal for the diffraction experiment [2]. |
| Crystal Mounting Pins | Metal pins that hold the microsample loops; designed to be secured on the goniometer of the diffractometer [2]. |
| Liquid Nitrogen | Essential for cryo-cooling crystals and for maintaining the cryo-stream at ~100 K during data collection to mitigate radiation damage [2]. |
The essentials of data collection in X-ray crystallography—advanced X-ray sources, high-performance detectors, and the precise rotation method—form an integrated technological pipeline. This pipeline is fundamental to the broader thesis of how X-ray crystallography works for protein research. The continuous innovation in source brilliance and detector sensitivity directly empowers researchers to tackle increasingly complex biological questions, from enzyme mechanisms to protein-drug interactions, by providing the high-fidelity experimental data required to build accurate atomic models. For the drug development professional, this translates to a more reliable structural foundation for rational inhibitor design and optimization.
X-ray crystallography is a cornerstone technique in structural biology for determining the three-dimensional atomic structures of proteins and other biological macromolecules [2]. The ultimate aim of the technique is to obtain a three-dimensional molecular structure from a crystal [2]. This process begins by exposing a purified protein crystal to an X-ray beam, resulting in a diffraction pattern composed of numerous spots, known as reflections [1] [2]. Each reflection is associated with a structure factor, F(hkl), a complex number described by both an amplitude, |F(hkl)|, and a phase, φ(hkl) [48]. The amplitude is directly proportional to the square root of the measured intensity of the diffraction spot [48]. However, while these intensities can be experimentally measured, the corresponding phase information is lost during data collection [48]. This fundamental challenge is known as the "crystallographic phase problem" [48].
The electron density map, ρ(x,y,z), which reveals the location of atoms within the crystal, is calculated via an inverse Fourier transform that requires both the amplitudes and the phases of the structure factors [1] [48]. Without phases, it is impossible to compute a meaningful electron density map and thus determine the protein's structure. This article provides an in-depth technical guide to the core principles of phasing and map calculation, framing them within the broader context of how X-ray crystallography powers modern protein research and drug development.
Theoretical Foundation: From Diffraction to Density
The relationship between the diffraction pattern and the electron density is mathematically defined. The electron density at any point (x,y,z) within the unit cell is given by the equation:
ρ(x,y,z) = 1/V ⋅ Σ|F(hkl)| ⋅ e^{-2πi(hx+ky+lz - φ(hkl))} [48]
Here, V is the volume of the unit cell, and the summation is over all Miller indices h, k, l [48]. The structure factor F(hkl) itself can be approximated as a discrete Fourier transform dependent on the atoms in the unit cell:
F(hkl) = Σ f_j ⋅ e^{2πi(hx_j+ky_j+lz_j)} ⋅ e^{-B_j/4 (1/d_hkl)^2} [48]
where f_j is the scattering factor, B_j is the B-factor, and (x_j, y_j, z_j) are the fractional coordinates of the j-th atom [48].
Table 1: Key Mathematical Components in Electron Density Calculation
| Component | Symbol | Description | Source in Experiment |
|---|---|---|---|
| Structure Factor | F(hkl) |
A complex number representing the wave diffracted by a specific set of crystal planes. | Derived from diffraction spot intensities. |
| Amplitude | |F(hkl)| |
The magnitude of the structure factor. | Directly measurable from the diffraction spot intensity. |
| Phase | φ(hkl) |
The angular displacement of the structure factor wave. | Lost in experiment; must be solved via phasing methods. |
| Electron Density | ρ(x,y,z) |
A 3D map showing the distribution of electrons in the unit cell. | Calculated via inverse Fourier transform using |F| and φ. |
Core Methodologies for Solving the Phase Problem
Over time, several experimental and computational methods have been developed to solve the phase problem. The choice of method often depends on the protein under study and the resources available.
Experimental Phasing Methods
Traditional experimental phasing methods require the collection of additional diffraction datasets from derivatized crystals.
- Isomorphous Replacement (IR): This method involves introducing heavy atoms (e.g., mercury, gold, or platinum) into the protein crystal without disturbing the crystal lattice [48]. By comparing the diffraction patterns from the native and heavy-atom-derivatized crystals, the phases for the native protein can be deduced.
- Anomalous Dispersion (AD): This technique exploits the anomalous scattering that occurs when the X-ray wavelength is tuned to the absorption edge of a specific element present in the crystal [48]. Elements like selenium (in selenomethionine) or sulfur (native) can be used. Multi-wavelength Anomalous Dispersion (MAD) or Single-wavelength Anomalous Dispersion (SAD) are powerful and now widely used variants.
Computational and Hybrid Phasing Methods
- Molecular Replacement (MR): This is a computational method used when a structurally similar homolog (a "search model") is already known [48]. The known model is oriented and positioned within the unit cell of the unknown crystal through rotational and translational searches. The phased structure factors from this positioned model then provide initial phase estimates for the new structure [48].
- Machine Learning (ML) Integration: Recent advances are bridging traditional crystallography with ML. For instance, predictions from models like AlphaFold2 are increasingly used as highly accurate search models for Molecular Replacement, effectively solving the phase problem for many targets without the need for experimental phasing [48]. Furthermore, new hybrid models, such as CrysFormer, are being trained to use Patterson maps and partial structural templates (e.g., from AlphaFold Database predictions) to improve phases and complete missing regions in electron density maps [48].
Table 2: Comparison of Primary Phasing Methods
| Method | Key Requirement | Principle | Typical Application Context |
|---|---|---|---|
| Molecular Replacement (MR) | A known homologous structure. | Positions a known model in the new crystal cell to provide initial phases. | High sequence similarity to a known structure. |
| Single-Wavelength Anomalous Dispersion (SAD) | Crystals with an anomalous scatterer (e.g., Se-Met). | Uses anomalous scattering differences from a single dataset to solve phases. | De novo structure determination; common with selenomethionine labeling. |
| Multi-Wavelength Anomalous Dispersion (MAD) | Tunable X-ray source & an anomalous scatterer. | Measures anomalous scattering at multiple wavelengths for phasing. | Provides high-quality phases; requires synchrotron beamline. |
| Machine Learning (ML) Phasing | An AF2/ESMFold prediction or other template. | Uses ML models to predict/improve phases from data and templates. | Rapidly growing field for de novo and partial structure completion. |
The Phasing and Map Calculation Workflow
The journey from a raw diffraction image to a refined atomic model involves a series of critical, interdependent steps. The following diagram illustrates the core workflow for overcoming the phase problem.
The Patterson Function as a Phasing Intermediary
The Patterson function, p(u,v,w), is a crucial intermediary in many phasing methods [48]. It is a Fourier transform calculated using the squared amplitudes of the structure factors while ignoring the phases entirely:
p(u,v,w) = 1/V ⋅ Σ|F(hkl)|² ⋅ e^{-2πi(hu+kv+lw)} [48]
Because it requires no phase information, a Patterson map can be computed directly from the raw experimental diffraction data [48]. While it does not directly show atomic positions, the Patterson map contains a set of interatomic vectors, which can be interpreted to locate heavy atoms in IR or AD, or to find the orientation and position of a search model in MR [48].
Density Modification and Model Building
Once initial phases are obtained, the quality of the resulting electron density map is often improved through a process called density modification. Techniques like solvent flattening, histogram matching, and non-crystallographic symmetry averaging are applied to improve the phases iteratively. The final, interpreted electron density map is used to build an atomic model, which is then refined against the experimental |F(hkl)| data to produce the final, accurate protein structure [1] [2].
Advanced Techniques: Time-Resolved Crystallography
Understanding static protein structures is invaluable, but capturing their dynamics is a frontier of structural biology. Time-resolved X-ray crystallography (TRX) visualizes protein motions in real-time [49]. In a pump-probe setup, a rapid perturbation, such as a laser pulse, drives the protein out of equilibrium. X-ray pulses then probe the structure at defined time delays after the perturbation, capturing structural snapshots as the protein relaxes [49].
A universal perturbation method is the Temperature-Jump (T-jump), where a mid-infrared laser rapidly heats the solvent surrounding the protein crystal [49]. This thermal perturbation excites the protein's intrinsic dynamics, allowing researchers to visualize widespread atomic vibrations on the nanosecond timescale and coordinated functional movements on the microsecond to millisecond timescale [49]. This technique is particularly powerful for studying enzyme catalysis and allosteric regulation.
The Scientist's Toolkit: Essential Research Reagents and Materials
The following table details key reagents, tools, and materials essential for successful protein crystallography.
Table 3: Key Research Reagent Solutions in Protein Crystallography
| Item / Reagent | Function / Explanation |
|---|---|
| Crystallization Screening Kits | Pre-formulated sparse matrix solutions (e.g., from Hampton Research, Molecular Dimensions) that systematically vary precipitant, buffer, pH, and salt to identify initial crystal growth conditions [2]. |
| Precipitants (PEGs, Salts) | Polymers like Polyethylene Glycol (PEG) or salts (e.g., Ammonium Sulfate) that reduce protein solubility in a controlled manner, encouraging crystal nucleation and growth [2]. |
| Heavy Atom Compounds | Reagents containing atoms with high electron density (e.g., Mercury, Platinum, Gold, or Uranyl compounds) used for derivatizing crystals for Isomorphous Replacement phasing [48]. |
| Selenomethionine | An amino acid analog where sulfur is replaced with selenium. Incorporated into recombinant proteins via metabolic labeling to provide a strong anomalous signal for SAD/MAD phasing [48]. |
| Cryoprotectants (e.g., Glycerol) | Chemicals used to prepare crystals for flash-cooling in liquid nitrogen, which protects them from radiation damage during data collection by forming a vitreous ice [1]. |
| Synchrotron Beamtime | Access to a synchrotron radiation facility is a critical "resource." These provide high-intensity, tunable X-ray beams essential for collecting high-resolution data, especially for weak diffractors or anomalous dispersion experiments [1] [2]. |
| Crystallography Software Suites | Essential computational tools for data processing (e.g., XDS, DIALS), phasing (e.g., PHASER, SHELXC/D/E), model building (e.g., Coot), and refinement (e.g., PHENIX.refine, REFMAC5) [1]. |
X-ray crystallography serves as a foundational technique in structural biology, enabling researchers to determine the three-dimensional atomic structures of proteins and other biological macromolecules. The process culminates in the interpretation of electron density maps to build and refine an atomic model, a stage that bridges the gap between experimental diffraction data and a biologically meaningful structure. This model provides critical insights into protein function, mechanism, and interactions, which are indispensable for fundamental research and rational drug design [50] [2]. The accuracy of this atomic model is paramount, as it forms the basis for understanding biological processes at a molecular level and for structure-based drug discovery campaigns.
The journey from a protein crystal to a refined atomic model is a meticulous process. After a crystal is exposed to an X-ray beam, the resulting diffraction pattern is processed to yield structure factors, which are used to calculate an electron density map [50] [2]. This map is a three-dimensional contour plot representing the distribution of electrons within the crystal lattice. The core challenge for the crystallographer is to interpret this map by building an atomic model that best fits the observed electron density, and then to refine that model to improve its agreement with the experimental data [51].
From Diffraction Data to Electron Density
The Phase Problem
In a crystallographic experiment, the intensities of the diffraction spots (reflections) can be measured directly [50]. However, to calculate an electron density map, both the amplitudes and the phases of the X-rays in each reflection are required. Together, this information defines a complex number known as the structure factor [50]. While the amplitudes are derived from the measured reflection intensities, the phases are lost in the data collection process, giving rise to the fundamental "phase problem" in crystallography.
Methods for Phase Determination
Several experimental and computational methods have been developed to estimate phases:
- Molecular Replacement (MR): This common method uses a previously-solved, structurally similar model as a starting point to estimate phases for the new crystal [50]. It is particularly effective when a homologous structure is available.
- Experimental Phasing: This involves collecting additional diffraction data from crystals that have been modified, typically by introducing heavy atoms (e.g., selenium, bromine, or metal ions).
- Anomalous Scattering: Atoms like selenium are incorporated into the protein (e.g., via selenomethionine), and diffraction data are collected at a specific X-ray wavelength to exploit anomalous scattering effects [50].
- Isomorphous Replacement: Heavy atoms are added to the crystal without disturbing the crystal lattice. Differences in diffraction intensities between native and heavy-atom-derivatized crystals are used to locate the heavy atoms and estimate phases [50].
Once initial phases are obtained, an initial electron density map can be calculated and used for model building.
Interpreting the Electron Density Map
The Relationship Between Resolution and Map Quality
The quality and interpretability of an electron density map are directly governed by the resolution of the diffraction data [50]. Resolution is a measure of the finest detail visible in the map and is inversely related to the diffraction angle. The following table summarizes how resolution impacts the interpretation of an atomic model.
Table 1: The Impact of Resolution on Model Building and Features
| Resolution Range | Map Quality & Model Features | Confidence in Atomic Positions |
|---|---|---|
| ≤ 1.0 Å (Ultra-High) | Individual atoms are resolved; atom types can be distinguished. | Very high; anisotropic motion can be modeled. |
| 1.0 – 1.5 Å (High) | Well-defined positions for all atoms; clear density for side chains and main chain. | High; individual atoms can be accurately placed. |
| 1.5 – 2.5 Å (Medium) | Continuous density for polypeptide chain; side chains are discernible but may be less defined. | Moderate to high; amino acid residues can be identified. |
| 2.5 – 3.5 Å (Low) | Basic chain tracing is possible; side chains appear as blobs; backbone density is clear. | Lower; the atomic structure must be inferred in parts. |
| ≥ 3.5 Å (Very Low) | Only the overall molecular envelope and secondary structure elements (e.g., alpha-helices) may be visible. | Low; detailed atomic model building is challenging. |
As illustrated, high-resolution structures (with small resolution values, e.g., 1.0 Å) are highly ordered, and it is easy to see every atom in the electron density map. In contrast, at lower resolutions (e.g., 3.0 Å or higher), the map shows only the basic contours of the protein chain [50].
The Model Building Workflow
Interpreting density is an iterative process of matching the protein's known amino acid sequence to the features observed in the electron density map. The process typically follows these steps:
- Backbone Tracing: The crystallographer identifies continuous tube-like density corresponding to the polypeptide backbone and traces its path.
- Side Chain Docking: Bulges in the density along the backbone are interpreted as amino acid side chains. The unique shape and size of the density for each residue help in its identification.
- Sequence Docking: The known protein sequence is then docked into the traced path, assigning specific amino acids to the density features.
- Inclusion of Ligands and Solvent: Density for bound ligands, substrates, inhibitors, or water molecules is identified and modeled accordingly.
The following diagram outlines the core iterative cycle of model building and refinement.
Refining the Atomic Model
The Principles of Refinement
Once an initial model is built, it must be refined to improve its agreement with the experimental diffraction data. Refinement is a computational process that adjusts the atomic parameters—primarily coordinates and atomic displacement parameters (B-factors, which model atomic vibration and disorder)—to minimize the difference between the observed structure factor amplitudes (F~obs~) and those calculated from the model (F~calc~) [51].
Key Metrics for Assessing Refinement Quality
The quality of the refined model is assessed using several key metrics:
- R-value (R-work): This measures the fit between the simulated diffraction pattern from the model and the experimentally-observed diffraction pattern. A random set of atoms has an R-value of about 0.63, while a perfect fit is 0. Typical values for a well-refined protein structure are around 0.20 (or 20%) [50].
- R-free: To prevent over-fitting or over-interpretation of the data during refinement, a randomly selected subset (~10%) of the reflections is set aside and not used in refinement. The R-free value is calculated using only this unused data. It provides a less biased measure of the model's quality and is typically a little higher than the R-value, often around 0.26 [50]. A large discrepancy between R-value and R-free can indicate over-fitting.
Refinement is not a purely mathematical exercise; the model must also conform to known chemical restraints, such as reasonable bond lengths, bond angles, and van der Waals contacts [51]. Modern refinement programs use a hybrid approach, minimizing a target function that combines the agreement with experimental data and the deviation from ideal stereochemistry.
The Scientist's Toolkit: Essential Reagents and Materials
Successful model building and refinement rely on a foundation of high-quality experimental data and computational tools. The following table details key resources used in the process.
Table 2: Key Research Reagent Solutions for Crystallographic Structure Determination
| Item / Reagent | Function in the Process |
|---|---|
| Pure, Homogeneous Protein | The starting material for growing high-quality, single crystals that diffract well [2]. |
| Crystallization Kits (Sparse Matrix Screens) | Commercial suites of solutions with varying precipitants, buffers, and salts to efficiently screen for initial crystallization conditions [51] [2]. |
| Heavy Atoms (e.g., Selenium, Bromine) | Used for experimental phasing. Incorporated into the protein (e.g., selenomethionine) or co-crystallized with it to provide a reference for phase determination via anomalous scattering or isomorphous replacement [50]. |
| Cryoprotectants (e.g., Glycerol, PEG) | Chemicals used to protect crystals from ice formation during flash-cooling in liquid nitrogen, which is standard practice for data collection at cryogenic temperatures [2]. |
| Refinement & Modeling Software (e.g., Phenix, Buster, Coot) | Computational tools for building the atomic model into electron density, refining its parameters, and validating its geometric and stereochemical quality [51]. |
Advanced Considerations and the Impact of Sample Delivery
The field of macromolecular crystallography continues to evolve, with new methods expanding the scope and efficiency of structure determination. Serial crystallography (SX), conducted at powerful X-ray sources like synchrotrons and X-ray free-electron lasers (XFELs), has revolutionized the study of biomolecular reaction mechanisms and hard-to-crystallize proteins [28]. A primary focus of recent technological advancement has been on reducing sample consumption, which was a major limitation in early SX experiments.
Modern sample delivery methods, crucial for enabling these studies, include:
- Fixed-Target Systems: Microfluidic chips or other solid supports onto which crystal slurries are loaded and scanned [28].
- Liquid Injection: Continuous injection of a crystal suspension in a liquid jet into the X-ray beam [28].
- Hybrid Methods: Approaches that combine features of both fixed-target and injection systems [28].
These advancements have drastically reduced the amount of protein required for a complete dataset, from grams in early experiments down to microgram amounts, making the study of a broader range of biologically significant samples feasible [28]. This progress in data collection directly benefits model building by providing high-quality diffraction data from more challenging protein systems.
Model building and refinement represent the crucial interpretive stage in protein X-ray crystallography, transforming experimental diffraction data into a detailed atomic model. The process is a careful balance of interpreting electron density, optimizing the model's fit to the data, and ensuring its chemical rationality. The resulting structures, when determined to high resolution and with careful refinement, provide an invaluable resource for understanding the molecular mechanisms of life and for informing the design of new therapeutics. As methods for data collection, such as serial crystallography, continue to advance, the scope and efficiency of this powerful technique will only increase, further solidifying its role as a cornerstone of modern structural biology.
Structure-based drug design (SBDD) and fragment-based drug discovery (FBDD) represent paradigm shifts in modern pharmaceutical development, moving away from traditional trial-and-error approaches toward rational, targeted therapeutic design. These methodologies rely fundamentally on obtaining high-resolution three-dimensional structures of biological targets, primarily proteins. X-ray crystallography serves as the cornerstone technique for this structural determination, providing the atomic-level detail necessary to visualize drug-target interactions [52]. The integration of these approaches has revolutionized drug discovery, enabling the development of highly specific inhibitors for challenging targets, including those previously considered "undruggable" [53].
The success of this structural approach is evidenced by its contributions to the development of FDA-approved drugs. Fragment-based drug discovery alone has led to the approval of several therapeutics, including vemurafenib for melanoma, acalabrutinib for certain leukemias, and sotorasib for non-small cell lung cancer [53] [52]. Furthermore, SBDD is estimated to have contributed to the development of over 200 FDA-approved medicines, underscoring its profound impact on modern medicine [53]. This whitepaper details the technical principles, methodologies, and real-world applications of X-ray crystallography in structure-based and fragment-based drug discovery.
The Foundation: Protein X-ray Crystallography
Technical Principles of Protein Crystallography
Protein X-ray crystallography is a technique that determines the three-dimensional positions of atoms in a protein molecule. The fundamental principle involves purifying the protein of interest, crystallizing it, and then exposing the crystal to an intense beam of X-rays. The proteins in the crystal diffract the X-ray beam into a characteristic pattern of spots. This diffraction pattern is then analyzed, using specialized methods to determine the phase of the X-ray waves, to compute a map of the electron density within the crystal. This electron density map is interpreted to build an atomic model of the protein [2] [54].
The diffraction process is governed by Bragg's Law: nλ = 2d sinθ Where n is an integer, λ is the wavelength of the X-rays, d is the spacing between atomic planes in the crystal, and θ is the angle of incidence. This relationship means that the angles at which constructive interference occurs reveal the distances between atomic layers within the crystal [1] [55].
The Crystallography Workflow
The process of determining a protein structure via X-ray crystallography involves a multi-step workflow, from protein preparation to final refined model.
Figure 1: The key stages in a protein X-ray crystallography project, culminating in a validated atomic model.
- Protein Production and Purification: The target protein is typically expressed in a system like E. coli, purified to high homogeneity (>95%), and concentrated. A reliable source of high-quality, soluble protein is a prerequisite for crystallization [2] [56].
- Crystallization: This is often the rate-limiting step. The concentrated protein solution is mixed with a precipitant solution and allowed to equilibrate. The goal is to slowly bring the protein out of solution in a controlled manner, encouraging the formation of an ordered crystal lattice instead of amorphous precipitate. This process is typically performed via vapor diffusion (hanging or sitting drop) and involves screening hundreds to thousands of conditions varying in precipitant, buffer, pH, and temperature to identify initial crystallization hits [2] [56].
- Data Collection: A crystal of suitable size (typically >0.1 mm) is mounted and exposed to an X-ray beam, usually from a synchrotron source due to its high intensity. The crystal is rotated to collect a complete diffraction dataset. Modern facilities use robotic sample mounters and area detectors (e.g., CCD detectors) that can collect a full dataset in seconds to minutes [2] [1].
- Data Processing and Phasing: The diffraction images are processed to determine the crystal's unit cell dimensions, space group (packing symmetry), and the intensities of the diffraction spots. The critical "phase problem" must be solved to convert the spot intensities into an electron density map. This can be achieved through methods like molecular replacement (using a known similar structure) or experimental techniques like anomalous dispersion [2] [54].
- Model Building and Refinement: An atomic model is built into the electron density map using the known protein sequence. The model is then iteratively refined against the experimental diffraction data to improve its fit to the electron density while ensuring favorable stereochemistry [1] [57]. The quality of the final model is assessed by metrics like the R-factor and free R-factor, which measure how well the model agrees with the experimental data [57].
Critical Quality Metrics
The reliability of a crystallographic structure is judged by key quantitative metrics, primarily resolution and R-factors.
- Resolution: Expressed in Angstroms (Å), this is the most important indicator of structure quality. It defines the level of detail visible in the electron density map [1].
- R-factor and R-free: The R-factor measures how well the calculated diffraction pattern from the atomic model fits the experimentally observed diffraction data. The R-free is calculated with a small subset of data not used in refinement and is a better indicator of the model's validity, guarding against over-fitting [57].
Table 1: Interpreting Resolution in Protein Crystallography
| Resolution (Å) | Structural Details Observable |
|---|---|
| >4.0 (Low) | Overall chain trace and secondary structure outlines may be visible. |
| 3.5 - 2.8 (Medium) | Chain tracing is clear; bulky side chains can be distinguished. |
| 2.8 - 2.0 (High) | Most side chains are well-defined; water molecules can be placed. |
| <2.0 (Atomic) | Individual atoms become resolvable; fine structural details are clear. |
Fragment-Based Drug Discovery (FBDD)
Core Principles of FBDD
Fragment-based drug discovery is a powerful strategy for generating lead compounds. Instead of screening large, complex molecules (as in High-Throughput Screening, or HTS), FBDD begins with small, low molecular weight compounds known as fragments. These fragments typically follow the "Rule of Three" (molecular weight <300 Da, cLogP ≤3, number of hydrogen bond donors and acceptors ≤3) [53]. The principle is that smaller, simpler fragments have a higher probability of binding to a target protein, albeit weakly, because they sample chemical space more efficiently than larger, more complex molecules [53] [58].
The process is often analogized to a game of Tetris, where starting with small, simple shapes makes it easier to find an initial fit, which can then be built upon [58]. While the initial binding affinity of a fragment is low (often in the millimolar range), its binding efficiency—the amount of binding energy per heavy atom—is high. These initial fragment "hits" are then grown, linked, or optimized into larger, potent lead compounds with nanomolar affinity [53].
Fragment Screening and Optimization
Identifying fragments that bind to the target requires sensitive biophysical techniques. The two most popular primary screening methods are Nuclear Magnetic Resonance (NMR) and Surface Plasmon Resonance (SPR). Other methods include thermal shift assays, isothermal titration calorimetry, and microscale thermophoresis [53].
However, protein X-ray crystallography plays a unique and invaluable role. While not always used for the initial primary screen due to throughput constraints, it is the "gold standard" for FBDD because it provides unambiguous, atomic-level detail of the fragment bound to the target [53]. This reveals the precise binding mode, location (orthosteric or allosteric site), and key protein-ligand interactions, which directly informs the medicinal chemistry strategy for optimization [53] [52]. High-throughput crystallography platforms, such as XChem at the Diamond Light Source, are now making crystallography a viable primary screening method [53].
Once a fragment hit is confirmed, optimization proceeds through:
- Fragment Growing: Adding functional groups to the core fragment to increase interactions with the target protein.
- Fragment Linking: If two fragments bind in proximal sites, they can be chemically linked to create a single, higher-affinity molecule.
- Analogue Screening: Testing commercially available compounds that are chemically similar to the hit fragment to find a better starting point.
Structure-Based Drug Design (SBDD)
Structure-based drug design utilizes the three-dimensional structure of a biological target to design or optimize small molecule agents (SMAs) that bind to and modulate the target's function [52]. This approach leverages the atomic-level details provided by X-ray crystallography to understand the target's structural and chemical features, enabling the design of drugs with high specificity and affinity [52].
SBDD is an iterative process where drug candidates are designed based on structural information, synthesized, and then tested. Their complexes with the target protein are crystallized, and the structures are determined again by X-ray crystallography. This reveals how well the designed molecule fits and indicates further modifications to improve properties like potency, selectivity, and metabolic stability [52] [58]. A prominent historical example is the development of HIV protease inhibitors, which was based on the structure of the HIV protease enzyme determined by X-ray crystallography [52].
The Scientist's Toolkit: Essential Reagents and Materials
Table 2: Key Research Reagent Solutions for Protein Crystallography and FBDD
| Reagent / Material | Function in the Workflow |
|---|---|
| Expression Vectors (Plasmids) | Molecular biology tools for inserting the gene of interest into a host (e.g., E. coli) for protein production. |
| Affinity Chromatography Resins | For protein purification; resins like Ni-NTA bind to affinity tags (e.g., His-tag) engineered onto the protein. |
| Crystallization Screening Kits | Commercial sparse matrix screens (e.g., from Hampton Research) providing a wide range of pre-made conditions to initiate crystallization trials. |
| Cryoprotectants (e.g., Glycerol) | Chemicals used to protect crystals from ice formation when they are flash-cooled in liquid nitrogen for data collection. |
| Fragment Libraries | Curated collections of 500-3000 rule-of-three compliant small molecules for screening in FBDD campaigns [53] [58]. |
| Synchrotron Beam Time | Access to a high-intensity X-ray source is not a reagent but a critical resource for high-quality data collection on challenging samples. |
Integrated Workflows and Case Studies
Integrated FBDD/SBDD Workflow
The power of FBDD and SBDD is fully realized when they are integrated into a cohesive workflow, driven by structural information. The following diagram outlines this iterative process.
Figure 2: The cyclical process of FBDD and SBDD, where structural data directly guides the optimization of drug leads.
Case Study: IRAK4 Inhibitor Development
Pfizer's development of an inhibitor for the kinase IRAK4 exemplifies a successful FBDD campaign. Targeting IRAK4 was challenging due to its similarity to hundreds of other kinases and its small binding site. Researchers screened a library of approximately 3,000 fragments, identifying hundreds of binders. One fragment stood out due to its unique chemical structure, which was not typical of known kinase inhibitors. This fragment bound with low affinity but high efficiency. Using X-ray crystallography, the team determined the exact binding mode of this fragment. Over three years of structure-based optimization, they elaborated this initial fragment into a potent and selective investigational drug candidate for autoimmune diseases like rheumatoid arthritis. The unique starting point was key to achieving selectivity over other kinases [58].
Current Evolution and Future Perspectives
The field of structural drug discovery is dynamically evolving. Cryo-Electron Microscopy (cryo-EM) is emerging as a powerful complementary technique, especially for large complexes and membrane proteins that are difficult to crystallize [52] [54]. However, X-ray crystallography remains the dominant source of structural data for drug discovery, with higher resolution than cryo-EM for most ligand-bound structures [52].
The most transformative recent advancement is the integration of Artificial Intelligence (AI). Tools like AlphaFold2 have demonstrated remarkable accuracy in predicting protein structures from amino acid sequences [52]. These AI-predicted structures are already impacting crystallography by simplifying the "phasing" problem through molecular replacement, dramatically speeding up structure determination [52]. Furthermore, AI and computational methods are being increasingly used for virtual fragment screening, helping to prioritize fragments for experimental testing [53].
As of late 2023, nearly half (48%) of the small molecule agents in the DrugBank database have at least one representative structure in the Protein Data Bank (PDB), illustrating the deep interlinking of structural information and modern drug discovery [52]. This trend will only accelerate as AI and experimental methods continue to advance and synergize, providing unprecedented insights into biological function and enabling the design of next-generation therapeutics.
Overcoming Common Challenges in Macromolecular Crystallography
X-ray crystallography remains the gold standard for determining the three-dimensional structures of proteins at an atomic scale, providing indispensable insights for understanding biological function, elucidating enzyme mechanisms, and advancing structure-based drug discovery [59] [60]. The technique involves growing protein crystals, exposing them to X-ray beams, and analyzing the resulting diffraction patterns to determine the protein's atomic architecture [2] [59]. However, this powerful methodology faces a fundamental constraint: its success is ultimately limited by the requirement for high-quality, well-ordered crystals [60] [61]. The unpredictability of obtaining such crystals constitutes the most significant bottleneck in structure determination pipelines, with many proteins, particularly those with intrinsic flexibility or membrane-associated proteins, proving recalcitrant to crystallization despite extensive effort [62] [61]. This technical guide examines the biochemical and biophysical underpinnings of this crystallization bottleneck and presents a comprehensive overview of strategic approaches to overcome these challenges, enabling structural biologists to expand the repertoire of proteins amenable to high-resolution structure determination.
Understanding the Crystallization Bottleneck: Fundamental Challenges
Biochemical and Biophysical Impediments to Crystallization
The process of protein crystallization represents a delicate balance between bringing protein molecules together into an ordered lattice while avoiding uncontrolled aggregation or precipitation. Several intrinsic protein properties significantly impact crystallization success:
Sample Purity and Homogeneity: Protein samples must demonstrate high purity (>95%) and monodispersity (homogeneity) to enable successful lattice formation. Impurities or protein aggregates can disrupt crystal packing, leading to defects or disordered crystals [62]. Dynamic light scattering (DLS) provides a valuable method for monitoring monodispersity and preventing aggregation prior to crystallization trials [62].
Conformational Dynamics and Surface Properties: Proteins containing highly flexible regions (e.g., loops or charged residues) often fail to form stable crystal lattices. For instance, flexible lysine residues on lysozyme's surface can lead to disordered packing [62]. Similarly, glycosylated proteins or those containing conformationally constrained domains present particular challenges for crystallization [2].
Membrane Protein Complexities: Membrane proteins pose additional challenges due to their hydrophobic transmembrane regions, which tend to aggregate and require detergents for solubilization—factors that substantially complicate crystallization [62]. Their inherent instability when removed from lipid bilayers further exacerbates these difficulties.
The Complexity of Crystallization Condition Optimization
Crystallization condition optimization presents a multidimensional challenge involving numerous variables that must be precisely balanced:
Vast Chemical Parameter Space: Crystallization conditions encompass an extensive array of parameters including pH, salt concentration, precipitant type and concentration, buffer composition, temperature, and possible additives [2] [62]. Subtle variations in these parameters can significantly impact protein solubility and nucleation kinetics. For example, minor adjustments in polyethylene glycol (PEG) concentration can dramatically alter crystallization outcomes [62].
Physical and Environmental Factors: Environmental parameters such as temperature, gravity, and even electric fields significantly influence crystal growth but are frequently overlooked in standard crystallization screens [62]. Temperature fluctuations can shift protein solubility curves, potentially leading to unwanted phase transitions instead of controlled crystal formation.
Strategic Approaches to Overcome Crystallization Challenges
Protein Engineering and Sample Optimization Strategies
Table 1: Protein Engineering Strategies for Improved Crystallization
| Strategy | Methodology | Application Examples | Key Considerations |
|---|---|---|---|
| Surface Entropy Reduction (SER) | Replace high-entropy residues (Lys, Glu) with Ala or Thr | Lysozyme surface residue optimization [62] | Reduces conformational heterogeneity while maintaining structural integrity |
| Fusion Protein Approaches | Introduce stable structural domains (T4 lysozyme, GST tags) | β2 adrenergic receptor-T4 lysozyme fusions [62] [63] | Enhances crystal contacts; particularly valuable for membrane proteins |
| Loop Truncation and Stabilization | Remove or stabilize flexible loops | RhoGDI Lys to Ala mutations [61] | Minimizes structural flexibility that impedes lattice formation |
| Affinity Tag Optimization | Carefully designed purification tags | Histidine tags with optimized linkers [61] | Facilitates purification while minimizing interference with crystallization |
Several biochemical and genetic approaches can substantially improve the crystallizability of challenging proteins:
Surface Entropy Reduction: This rational mutagenesis approach involves replacing surface residues that confer high conformational entropy (typically lysine, glutamate, and glutamine) with smaller, less flexible residues such as alanine or threonine. These modifications reduce surface flexibility without compromising protein folding or function, thereby promoting the formation of stable crystal contacts [62].
Fusion Protein Strategies: The introduction of stable, well-folded protein domains (such as T4 lysozyme, maltose-binding protein, or GST) can enhance protein solubility and provide additional surfaces for crystal contact formation. This approach has proven particularly valuable for membrane proteins, as demonstrated by the successful crystallization of β2 adrenergic receptor-T4 lysozyme fusions [62] [63].
Membrane Protein Stabilization: For membrane proteins, strategies such as lipidic cubic phase (LCP) crystallization can mimic the native membrane environment, maintaining protein stability in a crystallization-compatible state [62]. Additionally, antibody fragment binding can stabilize specific conformations and provide crystallization chaperones that facilitate lattice formation [61].
Advanced Crystallization Methodologies and Technologies
Table 2: Advanced Crystallization Methodologies for Challenging Proteins
| Methodology | Technical Approach | Advantages | Sample Requirements |
|---|---|---|---|
| Lipidic Cubic Phase (LCP) | Crystallization in lipid mesophases mimicking native membranes | Ideal for membrane proteins; enhances stability | Requires specialized handling; optimized detergent conditions |
| Microseed Matrix Screening (MMS) | Uses pre-formed microcrystals as nucleation templates | Expands crystallization conditions; improves reproducibility | Requires initial microcrystals; optimized seeding dilution |
| Counter-Diffusion Methods | Controlled mixing of protein and precipitant through a matrix | Precise supersaturation control; reduces nucleation density | Compatible with gel media; suitable for microgravity simulations |
| Solid/Liquid Interface Crystallization | Utilizes functionalized surfaces to promote nucleation | Reduces nucleation energy barrier; enhances crystal order | Various surfaces (porous, hydrophobic, charged) available |
Modern crystallization science has developed sophisticated methodologies to address the nucleation and growth challenges associated with difficult proteins:
Heterogeneous Nucleation Enhancement: Traditional homogeneous nucleation relies on high supersaturation, which often results in excessive microcrystal formation. The introduction of porous materials (such as polystyrene-divinylbenzene microspheres or Bioglass) can reduce the nucleation energy barrier, promoting more controlled and ordered crystal growth [62].
Automation and High-Throughput Screening: Robotic liquid handling systems (e.g., Crystal Gryphon) enable nanoliter-scale screening of thousands of crystallization conditions, maximizing sample efficiency while minimizing resource requirements [62]. When combined with AI-driven image analysis using convolutional neural networks (CNNs) for crystal recognition and classification, these systems significantly accelerate the identification of promising crystallization leads [62].
Solid/Liquid Interface Engineering: The use of specifically engineered surfaces—including porous, hydrophobic, charged, rough, and functionalized substrates—has demonstrated considerable promise in promoting and modulating nucleation events [60]. Additive-assisted nucleation utilizing micro-/macroparticles, nanoparticles, and even DNA scaffolds can further enhance crystallization efficiency [60].
Diagram 1: Strategic workflow for crystallizing difficult proteins
Essential Reagents and Materials for Crystallization Research
Table 3: Essential Research Reagent Solutions for Protein Crystallization
| Reagent Category | Specific Examples | Function and Application | Technical Considerations |
|---|---|---|---|
| Precipitants | PEGs (various MW), Ammonium sulfate, Salts | Solubility reduction to promote supersaturation | Concentration optimization critical; affects crystal morphology |
| Buffers | Tris, HEPES, MES, Citrate | pH maintenance and control | pH affects surface charge and crystal contacts; screen broadly |
| Additives | Salts, Divalent cations, Detergents | Modulate crystallization kinetics and interactions | Particularly important for membrane proteins and complexes |
| Nucleation Enhancers | SDB microspheres, Nanodiamonds, DNA scaffolds | Reduce nucleation energy barrier | Promote controlled nucleation rather than precipitation |
| Lipidic Media | Monoolein, Bicelles | Membrane protein stabilization in LCP | Mimics native environment; specialized handling required |
| Cryoprotectants | Glycerol, Ethylene glycol, Sugars | Protect crystals during cryocooling | Essential for data collection at synchrotron sources |
A well-stocked crystallization laboratory requires specialized reagents and materials to address the diverse challenges presented by different protein targets:
Commercial Sparse Matrix Screens: Commercially available "crystal screen" packages typically consist of 50 or more solutions varying widely in precipitant, buffer, pH, and salt composition. These sparse matrix screens provide a systematic approach to initial condition screening, efficiently exploring a broad range of chemical space [2] [62].
Specialized Additives and Nucleation Enhancers: A diverse array of additives—including micro-/macroparticles, nanoparticles, and DNA scaffolds—can promote nucleation and enhance crystal quality [60]. For instance, gold nanoparticles (GNPs) and platinum nanoparticles (PtNPs) have demonstrated particular utility in facilitating crystal nucleation [60].
Lipidic Cubic Phase Materials: Monoolein-based lipid matrices are essential for LCP crystallization of membrane proteins, providing a stable membrane-mimetic environment that maintains protein stability and function [62]. These specialized materials require specific handling protocols and expertise.
Detailed Experimental Protocols for Challenging Targets
Surface Entropy Reduction Mutagenesis Protocol
The systematic implementation of surface entropy reduction involves the following methodological steps:
Identify Flexible Surface Residues: Using sequence analysis tools, identify surface-exposed lysine and glutamate residues located in flexible regions, particularly those with high B-factors in homolog structures or predicted disorder.
Design Conservative Mutations: Select 3-5 candidate residues for mutation to alanine or other small residues. Prioritize residues that are not involved in functional sites or structurally critical positions.
Generate Mutant Constructs: Use site-directed mutagenesis to create individual and combination mutants. Consider constructing multiple variants to test different combinations of mutations.
Express and Purify Mutants: Express mutant proteins using standard expression systems (typically E. coli) and purify using affinity chromatography followed by size exclusion chromatography to ensure monodispersity.
Evaluate Protein Stability: Assess mutant stability using thermal shift assays or differential scanning fluorimetry to confirm that mutations have not compromised structural integrity.
Parallel Crystallization Screening: Subject wild-type and mutant proteins to identical crystallization screens to directly compare crystallization behavior and identify improved variants.
Microseed Matrix Screening (MMS) Protocol
Microseed Matrix Screening provides a powerful approach to optimize initial crystal hits:
Prepare Microseed Stock: Harvest initial microcrystals by crushing them in a solution containing precipitant concentration slightly below crystallization conditions. Serial dilution is typically performed (1:10, 1:100, 1:1000) to optimize seeding density.
Prepare Crystallization Plates: Set up crystallization trials using conditions slightly under-saturated compared to the original hit condition, typically by reducing precipitant concentration by 10-20%.
Transfer Microseeds: Add 0.1-0.5 μL of diluted microseed stock to each crystallization drop, using a dedicated seed bead or transfer tool to ensure consistent delivery.
Incubate and Monitor: Incubate plates under appropriate temperature conditions and monitor regularly for crystal growth. Seeded crystals often appear more rapidly and with improved morphology compared to spontaneous nucleation.
Iterative Optimization: Use the best crystals from initial MMS trials to generate new microseed stocks for further optimization cycles, progressively improving crystal size and quality.
Lipidic Cubic Phase Crystallization Protocol
For membrane proteins, lipidic cubic phase crystallization offers distinct advantages:
Prepare Protein-Lipid Mixture: Combine purified membrane protein (typically at 20-60 mg/mL concentration) with molten monoolein at a ratio of approximately 2:3 (protein:lipid) using specialized syringes and connectors.
Form Cubic Phase: Cycle the protein-lipid mixture through alternating syringes until the mixture becomes transparent and highly viscous, indicating formation of the cubic phase.
Dispense and Overlay: Dispense 50-100 nL of the protein-lipid mixture onto crystallization plates and overlay with 0.8-1.0 μL of precipitant solution.
Monitor Crystal Growth: Monitor plates for crystal formation, which typically appears as birefringent inclusions within the lipid matrix. Crystals grown in LCP often have distinct morphology compared to those grown in aqueous solutions.
Harvest and Cryocool: Harvest crystals directly from the lipid matrix using specialized micromounts and cryocool for data collection, typically without additional cryoprotection due to the protective nature of the lipid matrix.
Emerging Technologies and Future Directions
The field of protein crystallization continues to evolve with several promising technological developments:
Serial Crystallography Approaches: Serial femtosecond crystallography (SFX) at X-ray free-electron lasers (XFELs) and serial millisecond crystallography (SMX) at synchrotrons have revolutionized data collection from microcrystals, eliminating the need for large, single crystals [28]. These techniques utilize showers of microcrystals (typically 1-10 μm in size) that are continuously delivered to the X-ray beam via liquid injectors or fixed-target devices [28]. Advanced sample delivery methods have dramatically reduced sample consumption requirements from gram quantities in early experiments to microgram amounts in recent studies [28].
Integrated AI and Computational Prediction: Artificial intelligence approaches, particularly deep learning algorithms, are increasingly being applied to predict crystallization conditions and optimize crystal quality [62] [63]. These methods can analyze historical crystallization data, identify patterns in successful conditions, and recommend personalized screening strategies for specific protein targets.
Hybrid Methodologies: The integration of crystallography with complementary techniques such as cryo-electron microscopy (cryo-EM) and AI-based structure prediction (exemplified by AlphaFold2) provides alternative pathways for structural determination when crystallization proves intractable [63]. These hybrid approaches enable researchers to validate and refine computational models using limited experimental data, potentially bypassing traditional crystallization bottlenecks altogether.
Diagram 2: Evolution of crystallization technologies for difficult proteins
The crystallization bottleneck, while persistent, is being progressively addressed through integrated strategies combining biochemical optimization, advanced crystallization methodologies, and emerging technologies. The strategic application of protein engineering, specialized crystallization techniques, and high-throughput automation enables researchers to overcome the intrinsic challenges presented by difficult protein targets. Furthermore, the ongoing development of serial crystallography approaches and AI-driven crystallization prediction promises to further expand the frontiers of structural biology. By systematically implementing these strategies, researchers can significantly improve their success rates in determining high-resolution structures of biologically and therapeutically important proteins that have traditionally resisted crystallization efforts, thereby advancing our understanding of protein structure-function relationships and accelerating drug discovery pipelines.
In protein X-ray crystallography, diffraction data collection represents the final experimental step, with all subsequent structure solution and refinement stages being computational. The quality of the collected data directly dictates the accuracy and reliability of the final atomic model [64]. The process involves exposing a protein crystal to an X-ray beam and measuring the intensities of the resulting diffraction patterns [2]. Three fundamental, yet often competing, characteristics define an ideal data set: resolution, which determines the atomic detail discernible in the electron density map; completeness, the percentage of all possible unique reflections measured; and redundancy (or multiplicity), the average number of times each unique reflection is measured [64]. Achieving excellence in all three areas simultaneously is challenging, as efforts to maximize one can often compromise the others. For instance, aiming for the highest possible resolution may require such long exposures that the crystal suffers significant radiation damage, rendering the data set incomplete [64]. Similarly, pursuing very high redundancy to improve counting statistics might force a compromise on the ultimate resolution attainable [64]. This guide details the principles and practical strategies for optimizing these parameters to collect the best possible data for a given crystallographic experiment.
Fundamental Concepts and Their Interrelationships
Defining the Key Parameters
Resolution: Measured in Ångströms (Å), resolution is the most critical parameter for determining the level of detail in a final structure. It is determined by the smallest interplanar spacing (
d) that produces measurable diffraction, according to Bragg's Law: nλ = 2d sinθ [1]. Higher resolution (indicated by a smaller number) provides finer detail, allowing for more precise atomic positioning.Completeness: This measures the percentage of unique reflections collected within the desired resolution shell. A complete data set contains all possible reflections, and omissions, particularly of strong, low-resolution reflections, can severely bias the calculated electron density and subsequent structural analysis [64].
Redundancy: Also known as multiplicity, redundancy refers to the average number of independent measurements of each unique reflection. Higher redundancy improves the signal-to-noise ratio and the accuracy of intensity measurements through averaging, and facilitates the identification and rejection of outliers [65] [64].
The Interplay of Parameters in Experiment Design
The core challenge of optimization lies in the interconnected nature of these parameters. A strategic balance must be struck based on the specific goals of the experiment:
- Resolution vs. Radiation Damage: Pushing for high-resolution data requires a high X-ray dose, which risks excessive radiation damage. This can degrade diffraction quality during collection, leading to an incomplete data set [64].
- Completeness vs. Redundancy: Collecting a highly redundant data set requires a larger total rotation range, which can be time-consuming. If the crystal has a limited lifetime in the beam, this can force a choice between measuring all unique reflections once (high completeness) or measuring a subset of them multiple times (high redundancy) [64].
- Experimental Goals Dictate Priorities: The optimal balance differs depending on the crystallographic method being used. For example, anomalous phasing (SAD/MAD) requires high accuracy and redundancy to detect weak anomalous signals, but not necessarily the highest resolution. In contrast, refinement of an atomic model benefits most from extending to the highest resolution the crystal can provide [64].
Table 1: Data Quality Requirements for Different Crystallographic Applications
| Application | Resolution Priority | Completeness Priority | Redundancy Priority | Rationale |
|---|---|---|---|---|
| SAD/MAD Phasing | Medium | High (especially low-res) | Very High | Maximizes accuracy to detect the inherently small anomalous signal [64]. |
| Molecular Replacement | Low to Medium | High (especially low-res) | Medium | Relies on strong low-resolution reflections for Patterson function [64]. |
| High-Resolution Refinement | Very High | High (minimal missing data) | Medium | Aims for atomic detail; missing strong reflections bias maps [64]. |
| Ligand Finding | Low | Medium | Low | Rapid identification is key; relies on difference Fourier maps [64]. |
Practical Optimization Strategies
Data Collection Parameters and Their Optimization
Several instrumental parameters can be tuned to achieve the desired balance.
- Crystal-to-Detector Distance: This distance directly controls the resolution captured on the detector. A shorter distance increases the resolution at the edge of the detector but may cause spot overlap. A longer distance improves spot separation but reduces the resolution limit [2] [65].
- Rotation Range per Image (Oscillation Width): A smaller oscillation width (e.g., 0.1-1.0°) minimizes spot overlap (important for large unit cells) and reduces background, but requires more images to cover a given angular range, increasing collection time and the risk of radiation damage before completion.
- Total Rotation Range: The total rotation range required for a complete data set depends on the crystal's symmetry and its orientation on the goniometer. While a 180° range always ensures completeness, a properly chosen starting orientation can achieve completeness with a smaller range (e.g., 45° for a crystal with a fourfold axis), preserving crystal lifetime for higher redundancy or resolution [64].
- Exposure Time: Longer exposure times improve the signal-to-noise ratio but also accelerate radiation damage. The optimal exposure is the minimum required to measure the weakest high-resolution reflections accurately [65] [64].
Table 2: Guide to Optimizing Data Collection Parameters
| Parameter | Effect on Data Quality | Optimization Strategy |
|---|---|---|
| Detector Distance | Controls resolution and spot separation. | Adjust to capture desired resolution; balance spot separation against resolution needs [2] [65]. |
| Oscillation Width | Affects spot overlap, background, and number of images. | Use smaller widths for large unit cells to avoid overlap; larger widths for faster collection on robust crystals. |
| Total Rotation Range | Determines completeness and redundancy. | Use strategy programs to find the minimal range for completeness from an optimal starting orientation [64]. |
| Exposure Time / Flux | Determines signal-to-noise and radiation damage rate. | Use a dose-efficient beamline (synchrotron) and balance exposure to measure weak reflections without destroying the crystal [64]. |
Strategy and Technology for Optimization
Modern crystallography heavily relies on technology and strategy to streamline optimization.
- Data Collection Strategy Programs: Before collecting a full data set, it is beneficial to run one or two test images through a data collection strategy program [64]. These software tools use the crystal's unit cell and orientation to recommend an optimal starting angle and total rotation range to achieve high completeness and redundancy most efficiently.
- Multi-Pass Data Collection: For very well-diffracting crystals, a multi-pass (or multi-wedge) strategy is advantageous. A low-dose, low-resolution pass is collected first to accurately measure strong, low-resolution reflections without detector saturation. This is followed by a high-dose, high-resolution pass to capture the weaker reflections at the resolution limit [64].
- Cryo-Cooling: Flash-freezing crystals in a stream of liquid nitrogen at around 100 K is a standard practice. This dramatically reduces radiation damage, allowing for longer exposure times and the collection of more images (higher redundancy) from a single crystal [2] [66].
- Synchrotron Radiation: The use of synchrotron beamlines is now standard for most protein crystallography projects. Their highly intense, collimated, and tunable X-ray beams allow for shorter exposures, higher resolution data, and the optimization of the wavelength for anomalous diffraction experiments [2] [1] [66].
Diagram 1: Data collection optimization workflow.
The Scientist's Toolkit: Essential Reagents and Materials
Table 3: Key Research Reagent Solutions for Data Collection
| Item | Function |
|---|---|
| Cryo-Protectant (e.g., Glycerol, PEG) | Prevents formation of crystalline ice during flash-cooling, which can disrupt the crystal lattice and degrade diffraction quality [66]. |
| Liquid Nitrogen | Used to flash-freeze and maintain crystals at cryogenic temperatures (~100 K) during storage and data collection, mitigating radiation damage [2] [66]. |
| Cryo-Loops | Thin nylon or plastic loops that suspend a crystal in a thin film of mother liquor for mounting and flash-cooling [66]. |
| Crystallization Screen Sparse Matrix | Commercially available suites of 50+ pre-mixed solutions that systematically vary precipitant, buffer, pH, and salt to identify initial crystallization conditions [2]. |
| Synchrotron Beam Time | Access to a particle accelerator facility that produces extremely intense, tunable X-rays, essential for high-resolution and challenging phasing experiments [1] [67]. |
Optimizing data collection in protein X-ray crystallography is a deliberate balancing act rather than a process of maximizing single metrics. Success hinges on understanding the fundamental trade-offs between resolution, completeness, and redundancy, and then strategically tuning experimental parameters to suit the specific goals of the project. By leveraging modern tools—including strategy software, cryo-cooling, and synchrotron radiation—researchers can navigate these compromises effectively. The reward for this rigorous approach is a high-quality data set that forms a solid foundation for an accurate, reliable, and biologically insightful atomic model, ultimately driving progress in fields ranging from basic biochemistry to structure-based drug design.
Cryo-Cooling and Radiation Damage Mitigation for High-Resolution Data
Radiation damage represents a fundamental limitation in X-ray crystallography, particularly for biological macromolecules where high-resolution data is essential for accurate structure determination. When X-rays interact with a protein crystal, they cause both primary damage (ionization and bond breakage) and secondary damage (through the diffusion of free radicals) that degrade the crystal lattice and obscure atomic details [68]. Cryo-cooling, the practice of rapidly reducing crystal temperature to cryogenic levels (typically around 100 K or -173 °C), has become an indispensable technique for mitigating this radiation damage in structural biology [69] [70]. Within the context of protein research, this technique enables the collection of diffraction data at or near atomic resolution, providing researchers with reliable structural information about enzyme active sites, ligand-binding pockets, and molecular interaction surfaces that is crucial for understanding biological function and guiding drug design [71] [29].
The development of cryo-cooling methodologies represents a pivotal advancement in structural biology. Prior to its widespread adoption in the 1990s, data collection at room temperature severely limited data quality due to rapid radiation-induced decay. The implementation of cryo-cooling techniques extended the lifetime of crystals in the X-ray beam by approximately 100-fold, enabling the collection of complete datasets from single crystals and facilitating the study of more radiation-sensitive targets such as metalloproteins and large complexes [71] [69]. This technical guide explores the mechanisms, protocols, and practical considerations for implementing cryo-cooling to mitigate radiation damage in protein X-ray crystallography.
Understanding Radiation Damage in Macromolecular Crystallography
Fundamental Mechanisms of Radiation Damage
Radiation damage in X-ray crystallography occurs through two primary mechanisms: primary radiation damage resulting from direct ionization of atoms by X-ray photons, and secondary radiation damage caused by diffusing free radicals generated through radiolysis of solvent molecules [68]. The secondary damage mechanism is particularly destructive in biological samples, as highly reactive free radicals can propagate through the crystal lattice, breaking chemical bonds and disrupting the ordered arrangement of molecules necessary for diffraction.
For protein crystals, specific manifestations of radiation damage include:
- Decarboxylation of acidic residues (aspartic and glutamic acids)
- Disulfide bond cleavage in cysteine residues
- Loss of resolution due to disruption of crystal lattice order
- Reduced diffraction intensity (especially at higher resolutions)
- Specific damage to active sites in enzymes, potentially misleading mechanistic interpretations [71] [68]
Quantitative Assessment of Radiation Damage
The extent of radiation damage is directly proportional to the total X-ray dose absorbed by the crystal, typically measured in Grays (Gy) or kilograys (kGy). The critical dose (D~1/2~) defines the exposure level at which diffraction intensity decays to half its original value, providing a quantitative metric for comparing radiation sensitivity across different samples and conditions [70]. Experimental measurements have demonstrated that cryo-cooling can increase the critical dose by factors of 10-100 compared to room temperature data collection, dramatically extending the useful lifetime of crystals during X-ray exposure [69].
Table 1: Radiation Damage Effects at Different Specimen Temperatures
| Temperature | Relative Radiation Resistance | Key Observations | Recommended Applications |
|---|---|---|---|
| 4 K | Moderate | Significant structural rearrangements and beam-induced specimen movement | Specialized applications requiring ultra-low temperatures |
| 25 K | High | Good cryo-protection, minimal specimen movement | Tomography, intermediate resolution studies |
| 42 K | High | Good cryo-protection, minimal specimen movement | Tomography, intermediate resolution studies |
| 100 K | Highest | Most consistent high-quality data, established protocols | High-resolution single-particle imaging, routine macromolecular crystallography |
Data adapted from cryo-EM studies of ice-embedded catalase crystals, showing similar temperature-dependent radiation damage trends to protein crystallography [70].
Cryo-Cooling as a Mitigation Strategy: Mechanisms and Evidence
The Physical Basis of Cryo-Protection
Cryo-cooling mitigates radiation damage through several complementary physical mechanisms. At cryogenic temperatures (typically 77-100 K), the diffusion of free radicals is significantly reduced, limiting the propagation of secondary damage through the crystal lattice [70] [68]. This "cage effect" traps molecular fragments liberated by ionizing radiation, preventing them from migrating and causing additional damage [70]. Additionally, reduced thermal vibrations at low temperatures decrease atomic displacement parameters (B-factors), leading to improved diffraction quality and extending the crystal's lifetime in the X-ray beam [69].
The protective effect demonstrates temperature dependence, with significant improvements observed as temperature decreases from room temperature to approximately 100 K. Below this threshold, additional gains in radiation resistance become more modest, with some studies suggesting optimal practical outcomes at liquid nitrogen temperatures (100 K) rather than more challenging liquid helium temperatures (4 K) for many applications [70].
Experimental Validation of Cryo-Protection Efficacy
Multiple experimental approaches have quantified the protective effect of cryo-cooling in structural studies. Analysis of diffraction data from cryo-cooled crystals demonstrates a substantial increase in total tolerable dose before significant resolution loss occurs. Comparative studies collecting consecutive images of the same crystal area show that normalized diffraction intensities remain higher for longer durations at cryogenic temperatures compared to room temperature [70].
In practical terms, cryo-cooling enables the collection of complete datasets from single crystals, whereas multiple crystals would be required at room temperature due to rapid radiation decay. This is particularly valuable for limited samples or challenging targets such as membrane proteins, which often produce small, sensitive crystals [71] [69]. The table below summarizes key advantages of cryo-cooling established through experimental evidence.
Table 2: Experimentally Determined Benefits of Cryo-Cooling in Protein Crystallography
| Parameter | Room Temperature | Cryo-Temperature (100 K) | Experimental Basis |
|---|---|---|---|
| Typical Crystal Lifetime | Limited (often multiple crystals per dataset) | Extended (usually single crystal sufficient) | Measurement of diffraction intensity decay vs. dose [70] |
| Radical Diffusion | Extensive | Significantly suppressed | Analysis of specific damage signatures [68] |
| Dose Tolerance | Low (D~1/2~ ~2-5 MGy) | High (D~1/2~ ~20-30 MGy) | Fading curves of Bragg reflections [70] |
| Functional Conformations | May better represent physiological states | Potentially altered by cryoprotectant | Identification of alternative conformations at active sites [69] |
| Technical Implementation | Simple mounting | Requires cryoprotection strategy | Success rates in high-resolution data collection [69] |
Practical Implementation: Cryo-Cooling Methodologies
Cryoprotectant Solutions and Strategy
Successful cryo-cooling requires the use of cryoprotectant solutions to prevent the formation of ice crystals that would damage the protein crystal lattice. The cryoprotectant replaces water molecules in and around the crystal with a glass-forming solution that vitrifies upon cooling, preserving the crystalline order [69]. Common cryoprotectants include:
- Glycerol (typically 15-30% v/v)
- Ethylene glycol (typically 20-30% v/v)
- Low-molecular-weight polyethylene glycols (PEG)
- Sucrose (typically 1.0-2.5 M)
- Sodium malonate (typically 1.0-3.0 M)
The optimal cryoprotectant concentration must be determined empirically for each crystal system, balancing sufficient protection against ice formation with potential damage to crystal order from osmotic stress or chemical interactions [69] [72]. Standard practice involves briefly transferring crystals through cryoprotectant solutions of increasing concentration before flash-cooling.
Standardized Cryo-Cooling Protocol
The following protocol outlines the essential steps for successful cryo-cooling of protein crystals:
Step 1: Cryoprotectant Solution Preparation
- Prepare cryoprotectant solutions by adding the cryoprotectant agent to the mother liquor (the solution in which the crystal grew)
- Create a series of solutions with increasing cryoprotectant concentration (e.g., 5%, 10%, 15%, 20%, 25%)
- Include any precipitant, buffers, and salts from the crystallization condition to maintain crystal stability
Step 2: Crystal Transfer and Soaking
- Using a cryo-loop, carefully extract a single crystal from the crystallization drop
- Briefly transfer the crystal through the cryoprotectant series, with typical soaking times of 10-30 seconds at each step
- Monitor the crystal for signs of damage or cracking during transfers
- Perform a final soak in the highest concentration cryoprotectant solution for 15-60 seconds
Step 3: Flash-Cooling
- Rapidly plunge the crystal, mounted in the cryo-loop, into a cryogen (typically liquid nitrogen at 77 K or liquid propane)
- Ensure rapid and uniform cooling to achieve vitrification rather than crystalline ice formation
- Transfer the cooled crystal under continuous cryogenic conditions to the goniometer for data collection
Step 4: Data Collection
- Maintain crystal temperature at 100 K throughout data collection using a nitrogen cryostream
- Optimize data collection strategy considering the enhanced radiation resistance of cryo-cooled crystals
Cryo-Cooling Experimental Workflow
Troubleshooting Common Cryo-Cooling Issues
Several problems may arise during cryo-cooling, each with specific solutions:
- Ice formation: Increase cryoprotectant concentration or modify soaking time
- Crystal cracking: Reduce cryoprotectant concentration gradient or modify transfer protocol
- Poor diffraction: Optimize cryoprotectant composition or evaluate crystal quality before cooling
- Non-uniform freezing: Ensure rapid, consistent plunging technique
The Researcher's Toolkit: Essential Reagents and Materials
Table 3: Essential Research Reagents and Materials for Cryo-Crystallography
| Item | Function | Application Notes |
|---|---|---|
| Cryo-loops | Crystal mounting and support | Various sizes to match crystal dimensions; mounted on magnetic caps |
| Liquid nitrogen | Primary cryogen for cooling and storage | Maintains 77 K temperature; requires proper safety precautions |
| Cryoprotectant agents | Prevent ice formation | Glycerol, ethylene glycol, sucrose most common; concentration must be optimized |
| Crystal mounting tools | Manipulate crystals | Micro-tools, loops, and magnetic wands for crystal transfer |
| Puck and cane system | Crystal storage and organization | Standardized containers for cryogenic storage and shipment |
| Nitrogen Dewars | Long-term crystal storage | Maintain cryogenic temperatures for archive or transport |
Advanced Applications and Future Directions
The development of X-ray free-electron lasers (XFELs) has enabled serial femtosecond crystallography (SFX), which uses extremely brief X-ray pulses to collect diffraction patterns before the onset of significant radiation damage [28]. This "diffraction before destruction" approach effectively eliminates radiation damage by collecting data faster than damage processes can occur. Cryo-cooling remains relevant in this context for crystal storage and in some delivery methods, such as fixed-target systems where crystals are arrayed at cryogenic temperatures [28].
Time-Resolved Crystallography
Cryo-cooling enables time-resolved crystallography studies by trapping intermediate states in enzymatic reactions. By rapidly cooling crystals at specific time points after reaction initiation, researchers can capture structural snapshots of transient intermediates that would be inaccessible at room temperature due to radiation limitations [71] [28].
Emerging Trends and Methodological Refinements
Recent advances include:
- Advanced cryoprotectants with improved glass-forming properties and reduced crystal perturbation
- Microcrystal cryo-cooling techniques for challenging targets that only form small crystals
- Hybrid approaches combining room temperature serial crystallography with cryo-cooled data collection for specific applications
- Automated crystal mounting and cooling systems improving reproducibility and throughput [69] [28] [72]
Cryo-cooling represents an indispensable methodology for mitigating radiation damage in protein X-ray crystallography, enabling the determination of high-resolution structures that underpin modern structural biology and drug discovery. Through the physical mechanisms of radical diffusion suppression and reduced atomic displacement, cryo-cooling extends crystal lifetime in the X-ray beam by approximately 100-fold, facilitating the study of challenging targets including membrane proteins, large complexes, and radiation-sensitive metalloenzymes [71] [70]. The standardized protocols for cryoprotectant optimization and flash-cooling, when properly implemented, provide researchers with robust tools for preserving crystalline order and collecting diffraction data at or near atomic resolution.
As structural biology continues to advance into increasingly complex biological systems, the principles and practices of cryo-cooling remain fundamental to extracting maximal structural information from precious crystalline samples. The integration of cryo-methods with emerging techniques such as serial crystallography at XFELs ensures that radiation damage mitigation will continue to play a central role in pushing the boundaries of what can be structurally characterized, ultimately providing deeper insights into biological function and creating new opportunities for therapeutic intervention [28].
X-ray crystallography has been the cornerstone of structural biology for half a century, enabling atomic-resolution understanding of macromolecules and driving structure-guided drug discovery [73]. When collecting X-ray diffraction data from a protein crystal, we measure the intensities of the diffracted waves, from which we derive the amplitudes of the scattered waves. However, in the experiment, we lose the phase information – how we offset these waves when we add them together to reconstruct an image of our molecule. This is fundamentally known as the "phase problem" [74]. Without both amplitude and phase information, we cannot calculate the electron density map needed to determine the protein's atomic structure. This introduction explores the core strategies researchers employ to solve this critical problem: Molecular Replacement (MR), Single-wavelength Anomalous Dispersion (SAD), and Multi-wavelength Anomalous Dispersion (MAD).
Molecular Replacement: Utilizing Known Structural Homologues
Molecular replacement (MR) is a phasing method used when a structurally similar model is available. Pioneered by Rossmann and Blow, it relies on the principle that proteins with similar sequences often share similar three-dimensional structures [74]. The method involves orienting (rotating) and positioning (translating) the known model into the unit cell of the unknown crystal structure. Once correctly positioned, the model provides an initial set of phases, which are then refined and used to calculate an initial electron density map for the new structure.
As a rule of thumb, MR typically requires a sequence identity of >25% together with a root-mean-square deviation (r.m.s.d.) of <2.0 Å between the Cα atoms of the model and the new structure, although exceptions exist [74]. The method usually employs the Patterson function, which is calculated using intensities (Fₕₖₗ)² and does not require phase information. The resulting map shows peaks at interatomic vectors rather than atomic positions, allowing for the determination of the model's orientation and position through rotational and translational searches [74].
The Impact of AlphaFold on Molecular Replacement
The advent of highly accurate AI-based protein structure prediction tools like AlphaFold2 has dramatically accelerated MR experiments. These computational models now provide viable search models for proteins without experimentally determined homologues. However, predictions still require experimental validation, as they can differ from actual structures on a global or local scale. Accuracy for side chains, crucial for understanding function and drug discovery, can be particularly variable [75]. While iterative AlphaFold predictions provided successful MR models for 87% of structures solved by SAD phasing in one analysis, over 10% still required experimental phasing, highlighting that MR with predicted models is not a universal solution [75].
Experimental Phasing: SAD and MAD Methods
When a suitable model for molecular replacement is unavailable, researchers turn to experimental phasing methods. These techniques involve introducing heavy atoms (e.g., selenium, mercury, or other metals) into the protein crystal or utilizing atoms naturally present in the protein. The most commonly used techniques today are based on anomalous dispersion [76].
Single-wavelength Anomalous Diffraction (SAD)
SAD is a powerful technique that facilitates structure determination using a single dataset collected at a single appropriate wavelength [77]. It exploits the anomalous scattering that occurs when the X-ray wavelength is near the absorption edge of specific atoms within the structure. This anomalous scattering causes a breakdown in Friedel's law, meaning that the intensities of symmetry-related reflections (Friedel pairs) are no longer equal (Fₕₖₗ ≠ F₋ₕ₋ₖ₋ₗ). These measurable differences, known as anomalous differences, contain information about the positions of the anomalous scatterers [78] [74].
Compared to MAD, SAD has weaker phasing power and requires density modification to resolve phase ambiguity [77]. However, this disadvantage is offset by its main benefit: the minimization of crystal exposure time to the X-ray beam, thus reducing potential radiation damage. SAD also allows a wider choice of heavy atoms and can be conducted without a synchrotron beamline [77]. A common modern application is selenium-SAD, which utilizes selenomethionine incorporated into recombinant proteins [77].
Multi-wavelength Anomalous Diffraction (MAD)
The MAD method involves collecting diffraction data at multiple wavelengths near the absorption edge of an anomalous scatterer [78]. Typically, datasets are collected at three wavelengths: the peak wavelength (λ₁, where f" is maximized), the inflection point (λ₂, where f' is minimal), and a remote wavelength (λ₃, away from the edge) [78]. The differences in anomalous scattering around the edge allow for the calculation of phase angles without the phase ambiguity present in SAD experiments, although density modification is usually still necessary to obtain an easily interpretable map [77].
While very powerful, MAD phasing has declined somewhat in popularity relative to SAD due to the more limited choice of heavy atoms, the difficulty of avoiding radiation damage from extended exposure, and the requirement for a synchrotron beamline [77].
Technical Comparison of Phasing Methods
Table 1: Quantitative Comparison of Advanced Phasing Strategies
| Method | Prior Knowledge Required | Data Collection Requirements | Key Advantages | Key Limitations |
|---|---|---|---|---|
| Molecular Replacement (MR) | Structurally similar model (>25% sequence identity) [74] | Single dataset at any wavelength | Fast; no heavy-atom derivatization needed [76] | Model bias; fails without a good search model |
| Single-wavelength Anomalous Diffraction (SAD) | Anomalous scatterer (e.g., Se, S) positions | Single dataset at specific wavelength [77] | Minimizes radiation damage; wide heavy atom choice [77] | Weaker phasing power; requires density modification [77] |
| Multi-wavelength Anomalous Diffraction (MAD) | Anomalous scatterer positions | Multiple datasets at specific wavelengths [78] | Reduced phase ambiguity [77] | Requires synchrotron; increased radiation damage risk [77] |
Table 2: Native Anomalous Scatterers for SAD Phasing at Long Wavelengths [75]
| Element | Absorption Edge | Wavelength (Å) | Anomalous Signal (f") | Biological Relevance |
|---|---|---|---|---|
| Sulfur (S) | K-edge | 5.02 | ~4 e⁻ | Cysteine, Methionine residues |
| Phosphorus (P) | K-edge | 5.78 | ~4 e⁻ | Nucleotides, Phospholipids |
| Chlorine (Cl) | K-edge | 4.40 | ~4 e⁻ | Ion channels, Cofactors |
| Calcium (Ca) | K-edge | 3.07 | ~4 e⁻ | Signaling, Structural stability |
| Potassium (K) | K-edge | 3.44 | ~4 e⁻ | Ionic balance, Cofactor |
Experimental Protocols and Workflows
Sample Preparation for Successful Crystallography
Careful sample preparation is a critical prerequisite for any phasing experiment. Key biochemical considerations include:
- High Purity: Biomolecules require a high level of purity (typically >95%) to crystallize. Impurities and heterogeneity from oligomerization, flexible regions, misfolded populations, or post-translational modifications can prevent crystallization or lead to poor diffraction [79].
- Sample Stability: Crystals can take days to months to nucleate. Components to maintain stability include buffers, salts, glycerol, and substrates for soluble proteins, plus detergents for membrane proteins. Ideal buffer components should be kept below ~25 mM concentration, and phosphate buffers should be avoided as they easily form insoluble salts [79].
- Reducing Agent Considerations: When using chemical reductants during crystallization, the reductant's lifetime must be considered. Tris(2-carboxyethyl)phosphine hydrochloride (TCEP) is often preferred due to its long solution half-life (>500 hours across a wide pH range), unlike DTT, which degrades quickly at higher pH [79].
- High Solubility and Homogeneity: The sample must be monodisperse and not prone to aggregation. Methods to assess homogeneity include dynamic light scattering (DLS) and size-exclusion chromatography (SEC) [79].
SAD Experimental Workflow
Figure 1: SAD Phasing Experimental Workflow. The process begins with protein purification and heavy atom incorporation, proceeds through data collection and substructure solution, and culminates in model building and refinement after essential density modification.
Native-SAD at Long Wavelengths
A significant advancement in SAD phasing is the native-SAD approach, which utilizes light atoms naturally occurring in proteins, such as sulfur in cysteine and methionine residues, eliminating the need for heavy-atom derivatization [75]. The anomalous signal from sulfur increases substantially at longer wavelengths near its absorption edge (λ = 5.02 Å). However, technical challenges like air absorption and scattering historically limited these experiments.
Dedicated beamlines like I23 at Diamond Light Source overcome these limitations by operating in a vacuum environment and using a large detector [75]. This setup allows routine native-SAD phasing using sulfur and other biologically important lighter atoms like calcium, potassium, chlorine, and phosphorus. Analysis shows that the average sulfur content in eukaryotic proteins is about 4.4%, which is more than sufficient for successful S-SAD phasing at long wavelengths [75]. A key metric for success is the ratio between the number of unique reflections and the number of anomalous scatterers; a ratio over 1000 typically enables successful S-SAD phasing [75].
The Scientist's Toolkit: Essential Reagents and Materials
Table 3: Key Research Reagent Solutions for Phasing Experiments
| Reagent/Material | Function in Phasing Experiments | Application Notes |
|---|---|---|
| Selenomethionine | Biosynthetic incorporation of anomalous scatterer (Se) for SAD/MAD [77] | Standard for recombinant proteins; may affect yield/crystallization [75] |
| Chemical Reductants (TCEP, DTT) | Maintain cysteine residues in reduced state, improving homogeneity [79] | Consider half-life (TCEP >500h; DTT ~40h at pH 6.5) for long crystallizations [79] |
| Polyethylene Glycol (PEG) | Polymer precipitant inducing macromolecular crowding for crystallization [79] | Various molecular weights; also acts as cryoprotectant |
| 2-methyl-2,4-pentanediol (MPD) | Common additive affecting hydration shell, promotes crystallization [79] | Binds hydrophobic protein regions |
| Ammonium Sulfate | Salt precipitant inducing "salting-out" phenomenon [79] | Common component in crystallization screens |
| Heavy Atom Soaks | Introduce heavy atoms (Hg, Pt, Au, I) via crystal soaking for phasing | Risk of non-isomorphism and crystal damage [76] |
Advanced phasing strategies remain fundamental to determining novel protein structures by X-ray crystallography. Molecular Replacement is the fastest path when suitable homologous structures or accurate AI-predicted models exist. When a model is unavailable, experimental phasing is required, with SAD having emerged as the predominant method due to its practicality and reduced radiation damage compared to MAD. The ongoing development of native-SAD techniques, particularly at long wavelengths, offers a highly attractive path for determining structures without the need for any derivatization, using only the native atoms within the protein. Mastery of these core strategies—MR, SAD, and MAD—equips structural biologists and drug development professionals with the tools necessary to illuminate the three-dimensional architecture of proteins, thereby unlocking insights into function and accelerating therapeutic discovery.
Handling Weak Density and Validating Ligand Binding in Active Sites
In protein X-ray crystallography, determining the precise structure of a ligand bound to a biological macromolecule is crucial for understanding function and guiding drug discovery. However, correctly interpreting electron density in active sites is often far from trivial. Weak or ambiguous electron density can arise from various factors, including partial ligand occupancy, high conformational flexibility, or low resolution of the experimental data. Distinguishing a bound ligand from water or buffer molecules in the electron density map presents a significant challenge, particularly for small ligands or when data resolution is lower than 3 Å. The quality of this interpretation is paramount, as the details of ligand binding are often the critical information needed for structure-guided drug discovery and design. This guide outlines the sources of weak density, systematic approaches for its handling, and rigorous methods for validating ligand binding.
Understanding Weak Electron Density: Causes and Identification
Weak electron density in a protein's active site complicates model building and interpretation. This weakness typically manifests as a faint, fragmented, or discontinuous map, making it difficult to unambiguously fit the atomic model of a ligand or protein side chain.
Primary Causes of Weak Density
- Low Resolution of Data: The resolution of the X-ray data is the primary experimental parameter determining the final quality of the electron density map. At low resolutions (e.g., worse than 3 Å), the fine details of the electron density are smeared, making it difficult to distinguish atomic positions and fit ligand models with confidence [1].
- Partial Occupancy and Disorder: A ligand may not be fully bound to all protein molecules in the crystal or may exhibit multiple, overlapping binding modes. This disorder results in an electron density map that appears weak or smeared, as it represents an average of multiple states [80].
- High B-factors (High Temperature Factors): High B-factors indicate high atomic displacement parameters, meaning the atom or molecule vibrates or is disordered in its position. This thermal motion leads to a weakening of the observed electron density [2].
- Radiation Damage: Prolonged exposure to high-intensity X-ray beams, particularly at synchrotrons, can damage the protein crystal, breaking bonds and disordering the structure. This damage often manifests as a general weakening of electron density over the course of data collection [2].
- Incorrectly Assembled or Purified Protein: If the protein sample is impure, heterogeneous, or misfolded, the resulting crystals may have inherent disorder, leading to poorer overall diffraction and weaker electron density maps [2] [81].
Table 1: Characteristics and Common Causes of Weak Electron Density
| Characteristic of Weak Density | Common Underlying Cause | Potential Remedial Action |
|---|---|---|
| Faint but continuous density | Low resolution; Partial occupancy | Improve data resolution; Refine ligand occupancy |
| Fragmented or broken density | High flexibility/disorder | Use of composite omit maps; Consider alternate conformations |
| "Blobby" or un-shapeable density | Bound solvent (water/buffer) | Check chemistry of crystallization solution; Validate ligand geometry |
| Density for only part of the ligand | Mixed binding modes; Conformational flexibility | Model alternate ligand conformers |
Quantifying Data and Map Quality
Assessing the quality of the experimental data and the resulting electron density is a critical first step before interpreting a ligand. Key metrics include:
- Resolution: The minimum interplanar spacing (d-spacing) to which diffraction data are measurable, reported in Ångströms (Å). A higher resolution (lower numerical value) provides more detailed electron density [1].
- Signal-to-Noise (⟨I/σ(I)⟩): The ratio of the average intensity of a reflection to the error in its measurement. A higher value indicates a stronger, more reliable signal.
- Correlation Coefficient (CC₁/₂): A robust statistic that measures the correlation between two half-datasets. Unlike traditional R-values, CC₁/₂ accurately reflects the information content in high-resolution shells, even when data are weak. CC* (CC-star), derived from CC₁/₂, estimates the correlation of the merged data with the "true" values [82].
- Real-Space Correlation Coefficient (RSCC): Measures the correlation between the calculated electron density from the model and the observed experimental electron density around a specific atom or group of atoms. It is a crucial local quality metric for ligands [80].
A Systematic Approach to Handling Weak Density
When weak density is encountered in an active site, a systematic, iterative approach is required to build a reliable model.
Pre-Refinement and Pre-Interpretation: Data Quality Assessment
Before attempting to model the ligand, it is essential to ensure the underlying data is of the highest possible quality and has been processed correctly.
- Avoid Discarding Weak Data Prematurely: A common practice is to discard high-resolution data where the signal-to-noise ratio (⟨I/σ(I)⟩) falls below a certain threshold (e.g., 2.0). However, paired-refinement tests have demonstrated that including data to a resolution where CC₁/₂ is as low as 0.1–0.2 can produce a superior refined model, even if the merging R-values appear poor. Discarding this weak data improves statistics but results in a loss of structural information and a lower-quality model [82].
- Validate Data Processing Statistics: Scrutinize the data processing reports. Prefer CC₁/₂ over traditional merging R-values (like Rmeas or Rp.i.m.) as the primary indicator for setting the high-resolution cutoff [82].
Model Building and Refinement Strategies for Weak Density
Once the data quality is assured, specific model-building and refinement protocols can be employed.
- Use of OMIT Maps: A critical technique to avoid model bias. In this process, the ligand and surrounding protein residues are removed from the model, and a new round of refinement is performed. Subsequently, an electron density map (the omit map) is calculated. Any density appearing in the active site in this map is unbiased by the prior model of the ligand, providing a more honest representation of the experimental data [80].
- Occupancy Refinement: If the ligand density is weak but well-defined, it may indicate partial occupancy. Most refinement software allows for the refinement of ligand occupancy. This should be done iteratively, ensuring the B-factors of the ligand are reasonable relative to the surrounding protein atoms.
- Restraint and Dictionary Validation: During refinement, the geometry of the ligand is restrained based on a predefined dictionary. It is vital that this dictionary is chemically correct. The refinement software will report on the root-mean-square Z-scores (RMSZ) for bond lengths and angles. Note that for larger ligands, the bond-length RMSZ may naturally be higher (e.g., ~1.5) than for small ligands [80].
- Modeling Alternate Conformations: If the density suggests the ligand can adopt multiple distinct conformations, these should be modeled as alternate conformers (e.g., conformer A and B), each with their own occupancy that refines to sum to 1.0 [80].
Table 2: Key Reagent and Software Solutions for Handling Weak Density
| Research Tool | Category | Function and Application |
|---|---|---|
| Coot | Software | Molecular graphics for model building, fitting, and validation; used for real-space refinement and generating omit maps [59]. |
| Phenix.refine | Software | Comprehensive refinement suite that supports occupancy refinement, B-factor refinement, and validation [82]. |
| CCP4 Suite | Software | A collection of programs for all stages of crystallographic analysis, from data processing to refinement [59]. |
| Mogul (CCDC) | Software | Validates ligand geometry (bond lengths, angles, torsions) against the Cambridge Structural Database of small-molecule structures [80]. |
| Cryoprotectant | Reagent | A solution (e.g., containing glycerol) in which crystals are soaked before flash-cooling in liquid nitrogen to prevent ice formation and reduce radiation damage [59]. |
Advanced Techniques for Challenging Cases
- Molecular Replacement with Homologous Structures: If the native protein structure is known, molecular replacement can provide initial phases. The resulting maps can be of higher quality than those from experimental phasing, aiding ligand interpretation [81].
- Single-Wavelength Anomalous Dispersion (SAD): Using proteins that incorporate anomalous scatterers (e.g., selenomethionine) can provide robust experimental phases, leading to more interpretable electron density maps [81].
- Serial Crystallography: For proteins that only form microcrystals or are highly sensitive to radiation damage, serial femtosecond crystallography (SFX) at X-ray free electron lasers (XFELs) can yield high-resolution data before the crystal is destroyed [83].
The following workflow diagram summarizes the systematic approach to handling weak electron density.
Rigorous Validation of Ligand Binding
After building a ligand model into weak density, rigorous validation is essential to ensure the interpretation is correct and not based on wishful thinking.
Geometric and Stereochemical Validation
The internal geometry of the ligand must be chemically reasonable.
- Mogul Analysis: The Mogul program is used to validate bond lengths and angles by comparing them to those found in high-quality small-molecule crystal structures from the Cambridge Structural Database (CSD). The results are reported as Z-scores. The current practice in the Worldwide PDB (wwPDB) validation report flags bonds/angles with an absolute Z-score > 2.0 as outliers, but this can be overly strict. A better practice is to visually inspect outliers in the context of the electron density to determine if the strain is justified by the data [80].
- Torsion Angle and Ring Pucker Checks: Mogul can also analyze torsion angles and ring conformations, which are often not tightly restrained during refinement and can reveal incorrect fittings [80].
Electron Density Fit and Real-Space Validation
The ligand must fit the experimental electron density.
- Real-Space Correlation Coefficient (RSCC): This is a key metric. The RSCC calculates the correlation between the observed electron density and the density calculated from the atomic model in real space. A well-fit ligand in clear density will have an RSCC close to 1.0 (e.g., >0.8). Lower values indicate a poor fit to the density [80].
- Local Ligand Density Fit (LLDF) Score: This metric is used in wwPDB validation reports to identify ligand electron-density fit outliers. However, it has been noted to produce a substantial number of false positives and false negatives, so it should not be used in isolation. The RSCC is generally considered more reliable [80].
- Visual Inspection: Ultimately, the model must be visually inspected in a molecular graphics program like Coot. The atomic model should match the shape and contour of the electron density map (e.g., the 2mFo-DFc map contoured at 1.0 σ). There should be no significant unexplained positive (green) or negative (red) density in the mFo-DFc difference map contoured at ±3.0 σ [80].
Validation of the Protein-Ligand Interaction
The binding mode should make chemical sense.
- Analysis of Non-bonded Contacts: Check for sensible hydrogen bonds, van der Waals contacts, and hydrophobic interactions with the protein. Also, check for unrealistic steric clashes, which can be quantified using tools like MolProbity [80].
- B-factor Consistency: The B-factors of the ligand atoms should be comparable to those of the surrounding protein atoms they are in contact with. A ligand with consistently low B-factors in an active site with high B-factors may be over-fit or incorrectly placed.
- Comparison with Biochemical Data: The structural model should be consistent with existing mutagenesis, kinetic, or affinity data. If a residue predicted to be critical for binding is not making contact with the ligand in the model, the interpretation may be incorrect.
Table 3: Key Metrics for Validating a Ligand Model
| Validation Metric | Target/Interpretation | Tool/Source | ||
|---|---|---|---|---|
| Real-Space Correlation Coefficient (RSCC) | >0.8 (Good fit); <0.7 (Poor fit) | PDB Validation Report; Coot [80] | ||
| Mogul Bond/Angle Z-score | Z | < 2.0 (Typical); Check if outliers are justified by density | Mogul (CCDC) [80] | |
| Ramachandran Outliers | <0.5% (High quality) | MolProbity; PDB Validation Report | ||
| Clashscore | Lower is better; Percentile vs. similar resolution | MolProbity; PDB Validation Report | ||
| Ligand B-factors | Consistent with surrounding protein atoms | Refinement Software (e.g., Phenix) | ||
| mFo-DFc Difference Map | No significant peaks (>±3.0 σ) in ligand site | Coot; Phenix |
Handling weak electron density and validating ligand binding is a multifaceted challenge at the heart of reliable protein-ligand structure determination. Success hinges on a rigorous methodology that prioritizes the use of unbiased quality metrics like CC₁/₂, employs techniques like omit mapping to minimize model bias, and demands thorough validation of both the ligand's fit to the density and its chemical and geometric reasonableness. By adhering to the systematic approaches and validation protocols outlined in this guide, researchers can navigate the ambiguities of weak density with greater confidence, ensuring that the resulting structural models provide a solid foundation for scientific insight and drug discovery efforts.
Ensuring Accuracy and Placing X-Ray Crystallography in the Modern Structural Biology Toolkit
X-ray crystallography has been instrumental in determining the atomic-resolution structures of a plethora of biomolecules, with over 200,000 protein structures deposited in the Protein Data Bank (PDB) [28]. This technique is a cornerstone of modern structural biology and is crucial for structure-based and fragment-based drug design, where huge sums of money are committed based on the outcome of crystallography experiments and their interpretation [84]. However, an X-ray structure is not a direct image but a model built into an electron density map, which must be interpreted. This interpretation is subject to human error, making validation an indispensable step in the process. Structure validation ensures the reliability, accuracy, and quality of the final atomic model, providing confidence to researchers who use these structures to understand biological mechanisms, design drugs, and derive principles of molecular recognition [84].
Validation in crystallography assesses the agreement between the atomic model and the experimental data, as well as the model's conformity to known stereochemical and energetic principles. The process has gained emphasis since the early 1990s when a spate of incorrect structures was identified, leading to the creation of protein validation tools [84]. Today, validation is a routine component of protein refinement, and its importance is underscored by the fact that errors in structures can be propagated, especially when erroneous structures are used to derive rules that influence subsequent model building [84]. This guide provides an in-depth technical overview of how stereochemistry and electron density are used to ensure the quality of protein structures determined by X-ray crystallography.
The Foundation: Experimental Data and Model Refinement
Key Experimental Metrics for Validation
The quality of a crystallographic structure is initially gauged by experimental metrics that describe the quality of the diffraction data and the refinement process. The most important of these are resolution, R-factor, and R-free.
Resolution is one of the most critical parameters, describing the level of detail visible in the electron density map. Higher resolution data yields a more accurate and detailed structure. R-factor (or R-work) measures how well the atomic model explains the experimental diffraction data, while R-free is calculated using a small subset of reflections not used during refinement, serving as a cross-validation tool to prevent overfitting [85].
Table 1: Key Experimental Metrics for Structure Validation
| Metric | Description | Typical Range for a Good Quality Structure |
|---|---|---|
| Resolution | The level of detail in the electron density map; lower values indicate higher resolution. | < 3.0 Å |
| R-factor / R-work | Agreement between the model and experimental diffraction data. | 14% - 25% |
| R-free | Cross-validation statistic using unused data to prevent overfitting. | Should be close to R-factor (typically within 0.05) |
| B-factors (Temperature Factors) | Measure of atomic displacement or flexibility/vibrational motion. | Varies by region; lower values indicate well-ordered atoms. |
The Refinement and Validation Workflow
The process of refining and validating a protein structure is iterative. The model is repeatedly adjusted to improve its fit to the electron density while maintaining realistic stereochemistry. The following diagram illustrates this workflow, showing how stereochemical and electron density validation are integrated into the refinement process.
Validating Stereochemistry
Stereochemical validation ensures that the geometry of the atomic model—bond lengths, angles, and torsion angles—conforms to expectations derived from high-resolution small-molecule structures.
Geometric Parameters: Bond Lengths and Angles
During refinement, bond lengths and angles are typically restrained to ideal values. The average deviations from these ideal values are reported in the PDB file header. Modern refinement software applies strong restraints, so significant deviations are rare in contemporary structures. Validation involves checking that these parameters are within expected ranges, using libraries of accurately determined small-molecule structures from the Cambridge Structural Database (CSD) as a reference [85] [80]. The Mogul program is used for this purpose, calculating Z-scores for each bond length and angle to identify outliers, which are values that deviate significantly from the CSD distribution [80].
The Ramachandran Plot and Torsion Angles
The Ramachandran plot is one of the most informative checks of a protein structure's quality. It plots the phi (φ) and psi (ψ) torsion angles of each amino acid residue in the protein backbone. These angles define the secondary structure and are typically not heavily restrained during refinement, making the plot a sensitive indicator of model quality [84]. Residues fall into favored, allowed, and disallowed regions based on steric constraints.
Table 2: Key Stereochemical Validation Criteria and Tools
| Validation Aspect | Description | Common Tools & Databases |
|---|---|---|
| Bond Lengths & Angles | Checks deviation from ideal geometry derived from high-resolution small-molecule structures. | Mogul, Cambridge Structural Database (CSD) |
| Ramachandran Plot | Analyzes the backbone torsion angles (phi/psi) to identify sterically disallowed conformations. | MolProbity, PROCHECK, PHENIX |
| Side-Chain Rotamers | Assesses the likelihood of side-chain conformations based on statistical distributions. | MolProbity |
| All-Atom Contacts | Identifies steric clashes (atoms placed too close together) that are energetically unfavorable. | MolProbity |
| Planar Groups | Validates the geometry of aromatic rings and peptide planes. | PROCHECK, MolProbity |
A high-quality, well-refined structure will have over 95% of its residues in the most favored regions of the Ramachandran plot, with few or no outliers in the disallowed regions. In contrast, a poor-quality model may have a significant percentage of outliers, indicating potential errors in the backbone conformation [85].
Validating the Fit to Electron Density
The atomic model must accurately represent the experimental observation: the electron density map. Validating this fit is crucial for confirming that the model is correct.
The Real-Space Correlation and Residual Density
The fit of a model to the electron density is often assessed in real space. A common metric is the real-space correlation coefficient (RSCC), which measures how well the electron density calculated from the model correlates with the experimentally observed electron density. An RSCC value of 1 indicates a perfect fit, while values below 0.8 often indicate problems [86]. Additionally, difference maps (e.g., Fo-Fc maps) are calculated by subtracting the model-based density from the observed density. These maps should be relatively flat; large positive peaks (indicating missing atoms) or large negative peaks (indicating atoms placed where there is no density) signal errors in the model.
Challenges in Ligand Validation
Validating the placement of small-molecule ligands is particularly challenging and critical in drug discovery. The electron density for ligands can be weak due to partial occupancy, high flexibility, or low resolution. The wwPDB validation report uses metrics like the local ligand density fit (LLDF) score to assess ligands, though this metric can sometimes produce false positives and negatives [80]. A careful visual inspection of the ligand in its electron density map, often using a 2Fo-Fc map contoured at 1.0 σ and a Fo-Fc map contoured at ±3.0 σ, is considered the gold standard. The following diagram outlines a robust protocol for validating a ligand's fit.
A Practical Toolkit for Researchers
Essential Validation Software and Reagents
For researchers embarking on a structure determination project, a suite of tools and reagents is essential for successful validation.
Table 3: Key Research Reagent Solutions and Software Tools
| Item | Type | Function in Validation |
|---|---|---|
| MolProbity | Software | Provides all-atom contact analysis, Ramachandran plot, side-chain rotamer, and C-beta deviation checks [84] [87]. |
| COOT | Software | Interactive molecular graphics tool for model building and refinement; integrates validation results from MolProbity for real-time feedback [84]. |
| PHENIX | Software Suite | Comprehensive suite for structure determination that includes integrated refinement and validation tools [84]. |
| Mogul | Software | Validates the geometry of small-molecule ligands against the Cambridge Structural Database (CSD) [80]. |
| Pure, Homogeneous Protein Sample | Reagent | Essential for growing high-quality, well-ordered crystals that yield high-resolution diffraction data [28] [88]. |
| Crystallization Screen Kits | Reagent | Used to find optimal conditions for growing diffraction-quality crystals, a prerequisite for a valid structure [89]. |
Protocol for a Comprehensive Validation Check
Before depositing a structure in the PDB or using one for drug design, perform these steps:
- Review Experimental Metrics: Check that the resolution, R-work, and R-free values are within acceptable ranges for the structure's size and complexity [85].
- Analyze Stereochemistry: Run the structure through MolProbity. Examine the Ramachandran plot for outliers, check the rotamer outliers, and review the clashscore. A good structure should have >95% of residues in favored regions and a low clashscore [84] [85].
- Inspect Electron Density Fit: Use COOT or a similar program to visually scan the entire model against the 2Fo-Fc and Fo-Fc maps. Pay special attention to flexible loops, surface side chains, and any ligands or ions.
- Validate Ligands and Ions: For every non-water, non-polymer ligand, check the electron density fit visually and review its geometry using Mogul. Ensure that the ligand's chemistry is correct and its placement makes chemical sense in the context of the protein binding site [80].
- Consult the wwPDB Validation Report: During deposition, a validation report is generated. Use this report to identify any remaining issues and address them if possible.
Rigorous structure validation using both stereochemistry and electron density is not an optional step but a fundamental requirement in protein X-ray crystallography. It bridges the gap between raw experimental data and a biologically meaningful atomic model. For researchers in drug development, this process is paramount. The quality of a protein-ligand structure directly impacts the accuracy of interaction analysis and the success of structure-based drug design campaigns. By applying the protocols and tools outlined in this guide, scientists can ensure their crystallographic models are of the highest quality, thereby providing a reliable foundation for scientific discovery and therapeutic innovation.
Understanding the three-dimensional structures of biological macromolecules is fundamental to elucidating their functions and mechanisms, with profound implications for basic research and drug discovery [90] [91]. The three primary experimental techniques for determining these structures at or near atomic resolution are X-ray crystallography, cryo-electron microscopy (cryo-EM), and nuclear magnetic resonance (NMR) spectroscopy. Each method has distinct principles, advantages, and limitations, making them suitable for different types of biological questions and samples.
According to the Protein Data Bank (PDB) statistics, X-ray crystallography remains the dominant technique, accounting for approximately 66% of structures released in 2023 [90]. However, the use of cryo-EM has increased dramatically, rising from being almost negligible in the early 2000s to constituting over 31.7% of new deposits by 2023 [90] [91]. NMR, while making a smaller contribution to the total number of structures (around 1.9% in 2023), provides unique insights into protein dynamics and interactions in solution [90] [67]. This review provides a comparative analysis of these three pivotal techniques, with a particular focus on their application in protein research and drug development.
X-ray Crystallography
X-ray crystallography determines structure by analyzing the diffraction patterns produced when a crystal is exposed to an X-ray beam [90] [2]. The technique is based on Bragg's Law (nλ = 2dsinϑ), which describes the condition for constructive interference of X-rays scattered by the periodic lattice of a crystal [90]. The positions and intensities of the resulting diffraction spots are used to calculate an electron density map, into which an atomic model is built [2] [29]. The technique's reliance on high-quality crystals represents both its primary challenge and its strength, as the periodic array amplifies the scattering signal to measurable levels [67].
Cryo-Electron Microscopy (Cryo-EM)
Cryo-EM involves rapidly freezing aqueous samples in vitreous ice to preserve their native structure, then imaging them using an electron microscope [92]. The technique generates numerous two-dimensional projection images of individual particles, which are computationally combined to reconstruct a three-dimensional structure [93] [92]. Key advancements, including direct electron detectors and improved computational software, have led to the "resolution revolution" that now allows cryo-EM to achieve near-atomic resolution for many biological samples [93] [92].
Nuclear Magnetic Resonance (NMR) Spectroscopy
NMR spectroscopy exploits the magnetic properties of certain atomic nuclei (e.g., ¹H, ¹⁵N, ¹³C) when placed in a strong magnetic field [67]. The resonance frequencies of these nuclei are sensitive to their local chemical environment, providing information about interatomic distances, torsion angles, and overall conformation [67] [93]. Unlike the other techniques, NMR studies proteins in solution, allowing for the investigation of protein dynamics and interactions under conditions closer to the physiological state [93] [91].
Comparative Analysis of Techniques
Table 1: Key Characteristics of the Three Major Structural Biology Techniques
| Feature | X-ray Crystallography | Cryo-EM | NMR Spectroscopy |
|---|---|---|---|
| Typical Resolution | Atomic (often <2.0 Å) [93] | Near-atomic to atomic (often <3.0 Å) [92] | Atomic (determined by spectral dispersion) [67] |
| Sample State | Crystalline solid [90] [2] | Vitrified solution (frozen-hydrated) [92] | Solution (liquid state) [67] [91] |
| Ideal Sample Size | No strict size limit [67] | > ~100 kDa [91] | < ~50 kDa (solution state) [93] [91] |
| Key Advantage | High resolution, well-established workflow [90] [93] | No crystallization needed, studies large complexes [93] [92] | Studies dynamics and interactions in solution [67] [93] |
| Major Limitation | Requires high-quality crystals [2] [93] | Requires significant sample and computational resources [92] | Limited to smaller proteins; complex data analysis [67] [91] |
| Throughput | High (once crystals are obtained) [91] | Moderate to high [93] | Low to moderate [90] |
| PDB Contribution (2023) | ~66% (9,601 structures) [90] | ~31.7% (4,579 structures) [90] | ~1.9% (272 structures) [90] |
Table 2: Sample and Instrumentation Requirements
| Aspect | X-ray Crystallography | Cryo-EM | NMR Spectroscopy |
|---|---|---|---|
| Sample Preparation | Crystallization trials requiring high protein concentration and purity [2] [67] | Purification, vitrification on specialized grids [92] | Isotopic labeling (¹⁵N, ¹³C) often required; high concentration and stability needed [67] |
| Sample Consumption | Can be high for crystallization trials; newer serial methods reduce consumption to microgram ranges [28] | Minimal amounts of biomolecules can be analyzed [92] | Requires relatively high concentrations (e.g., >200 µM in 250-500 µL volume) [67] |
| Primary Instrumentation | Synchrotron radiation sources or in-house X-ray generators [90] [67] | Transmission Electron Microscope (TEM) with cryo-holder [92] | High-field NMR spectrometer (≥600 MHz) [67] |
| Key Data Output | Diffraction pattern (spot intensities and positions) [2] | Series of 2D particle images [92] | Multidimensional NMR spectra (chemical shifts, coupling constants) [67] |
X-ray Crystallography: A Detailed Workflow for Protein Research
The process of determining a protein structure via X-ray crystallography follows a well-defined sequence, with each stage being critical to the success of the overall endeavor.
Protein Crystallization
The growth of protein crystals of sufficient quality is widely considered the rate-limiting step in most crystallographic projects [2]. The principle involves taking a solution of the protein at high concentration and inducing it to come out of solution slowly to promote crystal growth rather than precipitation [2] [67]. This is typically achieved via the vapor diffusion method (hanging or sitting drop), where a drop containing a mixture of protein and precipitant solution is equilibrated against a reservoir with a higher precipitant concentration [2]. The numerous variables involved (precipitant type and concentration, buffer, pH, protein concentration, temperature, additives) make initial crystallization a trial-and-error process, often using commercially available sparse matrix screens [2]. For challenging targets like membrane proteins, advanced methods such as Lipidic Cubic Phase (LCP) crystallization have been developed to provide a more native membrane-like environment [67].
Figure 1: The X-ray Crystallography Workflow. The process begins with protein purification and ends with a refined atomic model deposited in the Protein Data Bank.
Data Collection and Processing
Once a suitable crystal is obtained, it is mounted and exposed to a high-intensity X-ray beam, typically at a synchrotron source [67] [29]. The crystal is rotated in the beam, and a series of diffraction images are collected. These images contain spots whose positions are determined by the symmetry and dimensions of the crystal lattice (unit cell), and whose intensities are related to the electron density within the crystal [2]. The data processing workflow involves indexing the diffraction pattern to determine the unit cell parameters, integrating the spot intensities, and scaling the data to correct for variations and merge them into a complete set of structure factor amplitudes [2] [67].
The Phase Problem and Structure Determination
A critical challenge in crystallography is that the recorded diffraction patterns contain information about the amplitude but not the phase of the diffracted waves—this is known as the "phase problem" [67]. Phases must be estimated to calculate an interpretable electron density map. Common methods include:
- Molecular Replacement (MR): Uses a known homologous structure as a search model [67].
- Experimental Phasing: Involves collecting data from crystals that contain heavy atoms (e.g., selenomethionine derivatives) using methods like Single-wavelength Anomalous Dispersion (SAD) or Multi-wavelength Anomalous Dispersion (MAD) [90] [67].
Model Building, Refinement, and Analysis
An initial atomic model is built into the experimental electron density map, followed by iterative cycles of refinement to improve the agreement between the model and the observed data while ensuring ideal stereochemistry [67] [29]. The final, validated model provides a detailed three-dimensional picture of the protein, revealing active sites, binding pockets, and oligomerization interfaces that are crucial for understanding function and for structure-based drug design [29].
Advanced and Emerging Methodologies
Serial Crystallography
A significant advancement in the field is Serial Crystallography (SX), which includes Serial Femtosecond Crystallography (SFX) at X-ray Free-Electron Lasers (XFELs) and Serial Millisecond Crystallography (SMX) at synchrotrons [28]. This approach uses microcrystals and the "diffraction before destruction" principle at XFELs, allowing structure determination from crystals too small or fragile for conventional methods [90] [28]. It is particularly powerful for time-resolved studies of reaction mechanisms, creating "molecular movies" of biochemical processes [28]. A major focus of current research is developing sample delivery methods (e.g., fixed-target chips, liquid injectors) that minimize the substantial sample consumption historically associated with SX [28].
Complementary and Integrated Approaches
The field is increasingly moving toward integrative structural biology, where data from multiple techniques are combined to tackle complex biological questions [91]. For instance, X-ray crystallography might provide a high-resolution structure of a protein domain, while cryo-EM reveals how it is positioned within a large cellular complex, and NMR characterizes its dynamic regions. This synergy is especially important for studying intrinsically disordered regions, which constitute 30%-40% of the eukaryotic proteome and are often poorly visualized in static crystals [91].
The Scientist's Toolkit: Essential Reagents and Materials
Table 3: Key Research Reagent Solutions for X-ray Crystallography
| Reagent/Material | Function/Purpose | Example Applications |
|---|---|---|
| Crystallization Screens | Sparse matrix solutions varying precipitant, salt, buffer, and pH to identify initial crystallization conditions [2]. | First-step screening for any crystallography project. |
| Cryoprotectants | Chemicals (e.g., glycerol, ethylene glycol) that prevent ice crystal formation during flash-cooling of crystals in liquid nitrogen [2]. | Preparing crystals for data collection at cryogenic temperatures. |
| Heavy Atom Compounds | Salts containing atoms with high electron density (e.g., mercury, platinum, gold) for experimental phasing [67]. | Soaking into crystals for SAD or MAD phasing. |
| Selenomethionine | Selenium-containing methionine analogue incorporated during protein expression for anomalous phasing [67]. | Creating derivatized proteins for SAD/MAD phasing, now a standard method. |
| Detergents/Lipids | For solubilizing and stabilizing membrane proteins during purification and crystallization [67]. | Crystallization of membrane proteins, particularly using the LCP method. |
X-ray crystallography, cryo-EM, and NMR spectroscopy are complementary pillars of modern structural biology. X-ray crystallography remains the workhorse for high-resolution structure determination, especially when high throughput is required, as in fragment-based drug discovery [67]. Cryo-EM has emerged as a transformative technique for elucidating the structures of large and dynamic complexes that defy crystallization [93] [92]. NMR spectroscopy is unparalleled for studying protein dynamics, folding, and weak interactions in solution [67] [93].
The choice of technique depends heavily on the biological question and the sample properties, including size, stability, and ability to form crystals. While computational methods like AlphaFold have dramatically advanced structure prediction, experimental structures remain essential for elucidating detailed mechanistic insights, conformational changes, and molecular interactions, particularly in the context of drug design [67] [91]. The continued evolution of these techniques, along with their integration into a unified structural biology approach, promises to further deepen our understanding of life's molecular machinery and accelerate the development of new therapeutics.
The Protein Data Bank (PDB) archive serves as the single global repository for three-dimensional structural data of biological macromolecules, empowering breakthroughs in science and education by providing essential tools for exploration, visualization, and analysis [94]. Established in 1971, this resource began with just 13 structures and has grown into an indispensable resource for the scientific community, with over 238,000 released atomic coordinate entries as of 2025 [95] [4]. The PDB represents one of the most enduring and impactful community-driven digital resources in all of biology, enabling researchers to understand biological function at the molecular level through structural analysis.
The worldwide PDB (wwPDB) consortium maintains this critical resource through an international collaboration between the Research Collaboratory for Structural Bioinformatics (RCSB PDB), Protein Data Bank in Europe (PDBe), Protein Data Bank Japan (PDBj), and Biological Magnetic Resonance Data Bank (BMRB) [96]. This cooperative framework ensures that structural data generated using public funds remain freely available to all, supporting research across diverse fields including structural biology, drug discovery, biochemistry, and molecular medicine. For researchers utilizing X-ray crystallography for protein research, the PDB provides both the foundational data for comparative studies and the infrastructure for archiving new structural discoveries.
Protein Structure Determination via X-ray Crystallography
Theoretical Foundations
X-ray crystallography remains the dominant technique for determining high-resolution protein structures, accounting for approximately 89% of holdings in the PDB archive [96]. The methodology relies on Bragg's Law (nλ = 2d sinθ), which establishes the fundamental relationship between the X-ray diffraction pattern and the three-dimensional structure of a crystal [4]. When X-rays interact with a protein crystal, they scatter in specific directions determined by the arrangement of atoms within the crystal lattice. The resulting diffraction pattern contains information about the electron density distribution, which researchers use to build atomic models of the protein structure.
Table: Key Historical Developments in Protein Crystallography
| Year | Development | Significance |
|---|---|---|
| 1912 | Discovery of X-ray diffraction by Max von Laue | Established that crystals could diffract X-rays |
| 1915 | Bragg's Law formulation | Provided mathematical foundation for interpreting diffraction patterns |
| 1965 | First enzyme structure (lysozyme) | Demonstrated applicability to biological macromolecules |
| 1971 | Protein Data Bank established | Created centralized repository for structural data |
| Present | >200,000 structures in PDB | Enables data mining and comparative studies |
Experimental Workflow
The process of determining a protein structure via X-ray crystallography involves multiple technically demanding steps, each critical to the success of the overall endeavor.
Workflow for X-ray Crystallography Structure Determination
Protein Production and Crystallization
The initial stage requires obtaining sufficient quantities of highly pure, homogeneous protein. Researchers typically clone the gene of interest into an expression plasmid, express the protein in systems like Escherichia coli, and purify it using affinity chromatography to achieve high purity (typically >95%) [4]. The purified, concentrated protein solution then undergoes crystallization trials, which remains the most unpredictable step in the process. Researchers use sparse matrix screens to systematically explore crystallization conditions by varying parameters including precipitant type and concentration, buffer composition, pH, protein concentration, temperature, and additives [2]. Through vapor diffusion methods (hanging or sitting drop), the protein solution slowly equilibrates against a reservoir containing precipitant solution, potentially leading to the formation of well-ordered crystals suitable for X-ray diffraction analysis.
Data Collection and Processing
Once suitable crystals are obtained (typically >0.1 mm in dimension), they are exposed to X-ray beams, traditionally from laboratory sources but increasingly from synchrotron facilities that provide more intense, focused radiation [2]. Modern detectors using charged coupled device (CCD) technology capture diffraction patterns in seconds, a significant improvement over the X-ray film methods used historically [2]. The diffraction pattern provides two critical types of information: the spot intensities relate to structure factor amplitudes, while the spot positions reveal the crystal lattice symmetry and unit cell dimensions. Researchers process these diffraction images to determine the crystal system (triclinic, monoclinic, orthorhombic, etc.) and space group, which defines how asymmetric units pack within the crystal [2].
Phase Determination and Model Building
The "phase problem" represents a fundamental challenge in crystallography—while diffraction patterns provide information about structure factor amplitudes, the phase information is lost during measurement. Researchers overcome this using methods like molecular replacement (using similar known structures), multiple isomorphous replacement (using heavy atom derivatives), or anomalous dispersion (using intrinsic or introduced anomalous scatterers) [2]. Once initial phases are obtained, researchers calculate electron density maps and build atomic models into them, iteratively refining the model to improve the fit to the experimental data while maintaining realistic geometry. Refinement metrics include R and Rfree factors, with the latter providing a validation measure against a subset of data excluded from refinement [96].
Data Validation and Deposition to the PDB
Validation Standards and Metrics
Before deposition in the PDB, structures undergo rigorous validation to ensure quality and reliability. The wwPDB has established comprehensive validation pipelines based on recommendations from expert Validation Task Forces for each structural biology method [96]. The validation report assesses three broad categories: (1) knowledge-based validation of the atomic model (e.g., Ramachandran plot outliers, steric clashes); (2) quality of experimental data (e.g., resolution, completeness); and (3) fit between the model and experimental data (e.g., Rfree, real-space correlation) [96]. These reports provide both overall quality scores and detailed lists of specific issues, helping researchers identify potential problems before finalizing their structures.
Table: Key Validation Metrics for X-ray Crystal Structures
| Validation Category | Specific Metrics | Interpretation |
|---|---|---|
| Model Geometry | Ramachandran outliers | Percentage of residues in disallowed regions |
| Rotamer outliers | Unusual side-chain conformations | |
| Clashscore | Steric overlaps per 1000 atoms | |
| Data Quality | Resolution | Finest details discernible (Å) |
| Completeness | Percentage of possible measurements | |
| Wilson B-factor | Overall disorder in crystal | |
| Model-Data Fit | Rfree | Cross-validation measure |
| Real-space correlation | Local fit to electron density |
The Deposition Process
The wwPDB provides OneDep, a unified system for deposition, biocuration, and validation of macromolecular structures [96]. Deposition includes not only atomic coordinates but also experimental data (structure factors for crystallography) and metadata describing experimental details, sample information, and polymer sequence. Biocurators at wwPDB sites verify, standardize, and annotate submissions to ensure consistency across the archive. Upon public release, the validation report becomes part of the permanent PDB record, providing transparency and allowing users to assess structure quality independently. Notably, many scientific journals now require wwPDB validation reports to accompany manuscripts describing new macromolecular structures [96].
Accessing and Analyzing PDB Data
Navigating the RCSB PDB Portal
The RCSB PDB website (rcsb.org) serves as the primary access point for most researchers, providing multiple tools for searching, visualizing, and analyzing structural data [94]. The interface enables users to search by various criteria including protein name, author, ligand identity, sequence similarity, or structural attributes. Each PDB entry has a dedicated Structure Summary page that organizes information systematically and provides access to the molecular visualization tool Mol* [97]. The portal also offers specialized resources for different user communities, including educators, students, and software developers.
Molecular Visualization and Analysis
Effective visualization is essential for interpreting three-dimensional structural data. The Mol* tool, integrated into the RCSB PDB website, enables interactive exploration of structures with multiple representation options [97] [98]:
- Wireframe/ball-and-stick diagrams: Display individual atoms and bonds, ideal for examining active sites or ligand interactions
- Spacefilling models: Show overall molecular shape and surface accessibility
- Ribbon diagrams: Highlight secondary structure and protein folding patterns
Researchers can selectively display and color specific components, measure distances and angles, and analyze interactions between molecules. The ability to compare multiple structures (either by uploading separate files or using the pairwise alignment tool) facilitates the study of structural variations, conformational changes, and evolutionary relationships [97].
Leveraging Structural Data for Drug Discovery
The PDB plays an increasingly crucial role in structure-based drug design, exemplified by recent work on GLP-1 receptor agonists for treating obesity and diabetes [94]. Researchers use protein-ligand complex structures to understand molecular recognition principles and guide the optimization of small molecule therapeutics. For membrane proteins (historically challenging targets for structural biology), advances in cryo-electron microscopy have dramatically increased the number of available structures, enabling drug discovery for previously intractable targets. The PDB also supports the study of protein-nucleic acid complexes, viral architecture, and large macromolecular machines, providing fundamental insights for developing antiviral agents and other therapeutics.
Research Reagent Solutions for Structural Biology
Table: Essential Materials and Tools for Protein Crystallography
| Reagent/Resource | Function/Purpose | Examples/Sources |
|---|---|---|
| Expression Vectors | High-level protein production | Plasmid systems with inducible promoters |
| Affinity Tags | Protein purification | His-tag, GST, MBP fusion systems |
| Crystallization Screens | Initial crystal screening | Sparse matrix screens (e.g., Crystal Screen) |
| Synchrotron Beamlines | High-intensity X-ray source | Advanced photon sources worldwide |
| Cryoprotectants | Crystal freezing for data collection | Glycerol, ethylene glycol, various cryo-solutions |
| Validation Software | Structure quality assessment | MolProbity, wwPDB validation server |
| Molecular Graphics | Structure visualization & analysis | Mol*, PyMOL, Coot |
Structural biology continues to evolve rapidly, with several emerging technologies enhancing the value and utility of the PDB archive. Integrative/hybrid methods that combine multiple experimental techniques are providing structures for increasingly complex systems [94]. The inclusion of computed structure models from AlphaFold DB and ModelArchive has dramatically expanded the structural coverage of protein sequence space [94]. Ongoing efforts to archive raw experimental data (diffraction images, EM micrographs, NMR free induction decays) will further enhance validation and enable new analytical approaches [96].
For researchers using X-ray crystallography, the PDB provides both essential reference data for structural interpretation and a platform for sharing results with the scientific community. As the archive continues to grow, it enables large-scale analyses that reveal fundamental principles of protein structure and function. By following standardized deposition procedures and utilizing the validation resources provided by the wwPDB, structural biologists contribute to a cumulative knowledge base that accelerates discovery across the life sciences. The PDB thus remains an indispensable resource, connecting the detailed atomic insights from X-ray crystallography to the broader landscape of biological and biomedical research.
The determination of protein three-dimensional structures is fundamental to understanding biological mechanisms and advancing drug development. For decades, X-ray crystallography has been the cornerstone technique for this task, despite being labor-intensive and time-consuming. The recent emergence of deep-learning-based protein structure prediction tools, namely AlphaFold and RoseTTAFold, has fundamentally reshaped the structural biology landscape. This whitepaper details the transformative impact of these AI tools on crystallographic workflows. We explore how these models are accelerating structure solution—most notably by providing high-quality solutions to the phase problem—enabling novel approaches like fragment-based drug screening, and providing accurate starting models for complex experimental data. While these AI predictions serve as powerful hypotheses, we present evidence that they complement, rather than replace, experimental validation, especially for elucidating protein-ligand interactions and capturing physiological conformations. This technical guide provides methodologies, comparative performance data, and practical resources for integrating these AI tools into modern crystallographic research.
Proteins perform virtually every function essential to life, and their functions are dictated by their precise three-dimensional structures. Understanding these structures is therefore paramount for fundamental biological insight and for the rational design of therapeutics. Since the pioneering work of Perutz and Kendrew in determining the structures of hemoglobin and myoglobin, X-ray crystallography has been a premier method for elucidating protein structures at atomic resolution [99].
The core principle of X-ray crystallography involves growing a crystal of the protein of interest, bombarding it with X-rays, and measuring the diffraction pattern produced. Computational methods are then used to convert this diffraction data into an electron density map, which is interpreted to build an atomic model of the protein. However, this process is fraught with challenges. A major bottleneck is the "phase problem": while the diffraction pattern reveals the amplitudes of the X-ray waves, it loses their phase information, which is essential for reconstructing the electron density map. Solving this phase problem often requires additional, complex experiments such as molecular replacement (using a known homologous structure), or the creation of heavy-atom derivatives for experimental phasing—processes that can take months or even years [100] [99].
The laborious nature of traditional crystallography is exemplified by historical cases where a doctoral candidate might spend their entire graduate career solving the structure of a single protein [99]. It is within this context that the revolutionary arrival of AI-based protein structure prediction tools must be understood.
The AI Predictors: AlphaFold and RoseTTAFold
In 2020, the protein science community witnessed a paradigm shift with the introduction of AlphaFold2 by Google DeepMind. At the Critical Assessment of protein Structure Prediction (CASP14) competition, AlphaFold2 demonstrated the ability to predict protein structures with an accuracy exceeding 90%, a level of performance previously unseen [99]. Shortly thereafter, the Baker laboratory at the University of Washington released RoseTTAFold, which also achieved remarkable prediction accuracy [101]. These tools leverage deep neural networks trained on the hundreds of thousands of structures in the Protein Data Bank (PDB) to predict a protein's 3D coordinates directly from its amino acid sequence.
Core Methodologies and Evolution
Both systems have evolved significantly. A key innovation in RoseTTAFold is its three-track architecture, which simultaneously processes information on protein sequence, distance between amino acid pairs, and 3D coordinates, allowing the model to reason about relationships within a protein across different scales [102]. This framework has been adapted for tasks beyond prediction, such as de novo protein design with tools like ProteinGenerator (PG), which uses a sequence space diffusion model to generate novel protein sequences and structures that fulfill specific design criteria [102].
The field continues to advance rapidly. The release of AlphaFold3 and RoseTTAFold All-Atom has extended capabilities beyond single proteins to predicting the structures of molecular complexes, including proteins with DNA, RNA, ligands, and post-translational modifications [103]. Furthermore, efforts are underway to create more efficient, accessible models. LightRoseTTA, for instance, is a lightweight deep graph network that achieves prediction accuracy competitive with RoseTTAFold but with a model containing only 1.4 million parameters, enabling training on a single GPU in just one week [104].
Table 1: Key AI Models in Structural Biology
| Model | Developer | Key Capabilities | Notable Advantages |
|---|---|---|---|
| AlphaFold2/3 | Google DeepMind | High-accuracy monomer & complex prediction | >90% accuracy on many targets; Extensive database of pre-computed models |
| RoseTTAFold | Baker Lab | Protein structure prediction & design | Three-track architecture; Integrated design via ProteinGenerator |
| LightRoseTTA | Academic Research | High-efficiency structure prediction | Lightweight (1.4M parameters); Low MSA dependency; Fast training & inference |
| ESMBind | Brookhaven Lab | Prediction of metal-binding sites | Specialized in identifying protein interactions with nutrient metals |
Transformative Applications in Crystallographic Workflows
AI-predicted models are being integrated into nearly every stage of the crystallographic pipeline, dramatically accelerating the pace of research.
Solving the Phase Problem via Molecular Replacement
The most immediate and profound impact of AlphaFold and RoseTTAFold on crystallography has been in solving the phase problem through molecular replacement (MR). In MR, a structurally similar model is used to derive initial phase estimates. AI-predicted models now serve as excellent search models for MR, even for proteins with no previously solved structures.
Case Study: Researchers struggling for two years to solve the crystal structure of a protein involved in the nonsense-mediated mRNA decay pathway found that models from both AlphaFold and RoseTTAFold enabled straightforward molecular replacement and structure solution. The study reported that the AlphaFold model, in particular, "largely outcompetes" other models for this purpose [100].
Enabling Advanced Drug Discovery Screens
AI models are accelerating structure-based drug discovery. While predicting protein-ligand interactions remains challenging, AI-powered crystallography is enabling high-throughput screening.
Experimental Protocol: Room-Temperature Fragment Screening A 2025 study systematically compared fragment screening at room temperature (RT) using serial crystallography against conventional cryogenic methods [105].
- Protein Crystallization: Crystals of the target protein (FosA) were directly grown in microporous compartments of a fixed-target sample holder via sitting-drop vapor diffusion.
- Fragment Soaking: Crystallization solution was blotted away, and solutions containing fragments from the 95-compound F2X entry library were added to the crystals and incubated for 24 hours.
- Data Collection:
- RT Serial Crystallography (RT-SSX): After blotting, data was collected at 296 K and 98% relative humidity using a fixed-target serial synchrotron crystallography setup at the PETRA III synchrotron. This method collects diffraction stills from thousands of microcrystals.
- Cryogenic Control: For comparison, loop-mounted single crystals were screened at 100 K at the same synchrotron.
- Data Analysis: Datasets were processed and refined. The study found RT-SSX achieved resolutions comparable to cryo-methods and revealed a previously unobserved conformational state of the active site, providing an additional starting point for drug design [105].
Diagram 1: RT Serial Crystallography Workflow
Designing Proteins with Tailored Properties
The design of novel proteins with pre-specified properties is another area transformed by AI. ProteinGenerator (PG), a RoseTTAFold-based model, uses a sequence-space diffusion approach to design proteins with custom attributes [102].
Experimental Protocol: Designing Amino Acid-Enriched Proteins
- Guidance Specification: The desired amino acid composition (e.g., 20% tryptophan) is specified.
- Iterative Denoising: Beginning from a noised sequence, PG iteratively denoises while guided by the desired attribute.
- Sequence Biasing: At each denoising step, sequence positions are ranked by the frequency of the target amino acid. A bias toward that amino acid is added to the update for the top N positions.
- Validation: Designed sequences are filtered with AlphaFold2 to ensure predicted foldedness (pLDDT > 90, RMSD to design < 2 Å) before experimental characterization [102].
This methodology has been successfully used to design stable, folded proteins enriched in typically rare amino acids like tryptophan and cysteine, as well as proteins with specified internal sequence repeats [102].
Quantitative Performance and Limitations
Despite their transformative power, AI predictions are not a panacea. A critical evaluation of their performance against experimental data reveals both their strengths and limitations.
Accuracy and Artifacts
A 2024 study in Nature Methods directly compared AlphaFold predictions with experimental crystallographic electron density maps. The findings were nuanced:
- In many cases, high-confidence predictions (pLDDT > 90) matched experimental maps remarkably closely.
- However, even high-confidence predictions could show significant deviations from experimental maps on both global (domain orientation, distortion) and local (backbone and side-chain conformation) scales [106].
- The mean map–model correlation for AlphaFold predictions was 0.56, substantially lower than the 0.86 for deposited experimental models. After applying computational "morphing" to correct for distortions, the correlation improved to 0.67, but still fell short of experimental models [106].
Table 2: Performance Comparison: AlphaFold vs. Experimental Structures
| Metric | AlphaFold Prediction (vs. Exp. Map) | Deposited Model (vs. Exp. Map) | Morphed AlphaFold (vs. Exp. Map) |
|---|---|---|---|
| Mean Map-Model Correlation | 0.56 [106] | 0.86 [106] | 0.67 [106] |
| Median Cα RMSD to PDB Entry | 1.0 Å [106] | N/A | 0.4 Å (after morphing) [106] |
| Inter-atomic Distance Deviation (for 48-52 Å pairs) | 0.7 Å [106] | 0.4 Å (between different crystal forms) [106] | N/A |
| Typical Experimental Success Rate | N/A | N/A | 32 of 42 unconditionally designed proteins were soluble, monomeric, and stable [102] |
These discrepancies underscore that AI models are trained on static models from the PDB and do not fully account for the influence of the cellular environment, ligands, covalent modifications, or protein dynamics [106]. As such, the scientific community has largely adopted the view that AlphaFold predictions are valuable hypotheses that can accelerate, but not replace, experimental structure determination [106]. They provide an excellent starting point for MR and for designing experiments, but critical structural details, particularly regarding functional interactions, often still require experimental validation.
The Scientist's Toolkit: Essential Research Reagents and Materials
Table 3: Key Reagents and Materials for AI-Augmented Crystallography
| Item | Function in Research |
|---|---|
| Fixed-Target Sample Holders | Microporous chips for high-throughput room-temperature serial crystallography, allowing on-chip crystallization and ligand soaking [105]. |
| Fragment Libraries (e.g., F2X Entry) | Curated collections of small, low molecular weight compounds used for fragment-based drug screening to identify initial hits for drug development [105]. |
| Synchrotron Beamlines | Facilities producing ultra-bright X-rays for data collection; beamlines like PETRA III's P09 and P11 are equipped for both serial and single-crystal crystallography [105]. |
| Cryoprotectants | Chemicals (e.g., glycerol, ethylene glycol) used to protect protein crystals from ice formation during flash-cooling in cryo-crystallography. |
| Molecular Replacement Software | Programs (e.g., Phaser) that use a search model (like an AF2 prediction) to solve the crystallographic phase problem [100]. |
The integration of AlphaFold and RoseTTAFold into the practice of X-ray crystallography marks a profound and permanent shift in structural biology. These AI tools have effectively solved the long-standing challenge of producing accurate initial models for molecular replacement, turning a previously arduous bottleneck into a routine computational step. This acceleration is enabling new scientific frontiers, from high-throughput fragment screening at physiologically relevant temperatures to the rational design of proteins with novel functions. However, the narrative that AI has rendered experimental biology obsolete is false. Instead, these powerful hypothesis generators are most effective when coupled with experimental validation, creating a synergistic cycle where computational predictions inform experiments and experimental results refine computational models. For researchers and drug development professionals, the future lies in mastering this integrated workflow, leveraging the speed of AI to guide and enhance the definitive power of experimental structural biology.
X-ray crystallography has served as the cornerstone technique for determining the three-dimensional structures of proteins and biological macromolecules, providing atomic-level resolution that has profoundly advanced our understanding of molecular mechanisms in biology [2] [107]. Since the determination of the first protein structures in the late 1950s, the field has witnessed exponential growth in the number of solved structures, largely driven by methodological and technological advances [108]. According to recent statistics, X-ray crystallography continues to account for the majority of structures deposited in the Protein Data Bank (PDB) annually, underscoring its enduring importance in structural biology [107].
Despite its powerful capabilities, X-ray crystallography faces several fundamental limitations that can restrict its biological applications. The technique requires high-quality crystals, which can be challenging or impossible to obtain for many biologically important targets, particularly membrane proteins and dynamic complexes [109]. Furthermore, the crystalline environment can introduce artifacts, and the resulting structures represent conformational averages that may not capture functionally relevant dynamics [110] [108]. Perhaps most significantly, crystallography provides a structural snapshot but limited direct information about the kinetic and thermodynamic parameters that govern molecular interactions [109]. These inherent constraints have driven the development of integrated approaches that combine crystallographic data with complementary biochemical and biophysical methods to create more comprehensive models of biological function.
Table 1: Key Limitations of X-ray Crystallography and Complementary Methods
| Limitation of X-ray Crystallography | Complementary Technique | Information Gained |
|---|---|---|
| Static structural snapshots | NMR Spectroscopy | Protein dynamics and conformational ensembles [108] |
| Membrane protein challenges | Cryo-Electron Microscopy | Structures of large complexes without crystallization [109] |
| Unresolved protein dynamics | Hydrogen-Deuterium Exchange Mass Spectrometry | Flexibility and solvent accessibility [108] |
| Crystal packing artifacts | Small-Angle X-ray Scattering (SAXS) | Solution-state conformation validation [108] |
| Limited detection of weak binders | Thermal Shift Assays | Ligand binding and stabilization effects [109] |
Complementary Methodologies: A Multi-Technique Toolkit
Nuclear Magnetic Resonance (NMR) Spectroscopy
Solution-state NMR provides unique advantages for studying protein dynamics and transient conformations that complement static crystal structures. Unlike crystallography, which requires molecules to be locked in a crystal lattice, NMR allows proteins to be studied in near-physiological solution conditions, preserving their natural dynamics [108]. This technique is particularly valuable for characterizing disordered regions of proteins, conformational heterogeneity, and mapping interaction surfaces through chemical shift perturbations. The combination of crystallography and NMR has proven powerful for studying allosteric mechanisms and folding pathways, with NMR data providing information about timescales of motion and crystallography delivering precise atomic coordinates of distinct states [108].
Cryo-Electron Microscopy (Cryo-EM)
The recent resolution revolution in cryo-EM has established it as a premier technique for determining structures of large macromolecular complexes that are difficult to crystallize, such as ribosomes, viral capsids, and membrane protein complexes [108] [109]. Cryo-EM is particularly valuable for capturing multiple conformational states from the same sample, providing insights into functional mechanisms without the potential constraints of crystal packing [108]. The integration of cryo-EM density maps with high-resolution crystal structures of individual components or domains enables the construction of accurate atomic models for complex macromolecular machines that defy crystallization in their entirety.
Mass Spectrometry-Based Methods
Modern mass spectrometry approaches provide complementary information about protein dynamics, interactions, and post-translational modifications. Hydrogen-deuterium exchange (HDX) mass spectrometry measures the rate at which protein backbone amides exchange with solvent, revealing regions of flexibility and conformational changes upon ligand binding [108]. Native mass spectrometry can determine stoichiometry and stability of protein complexes, while cross-linking mass spectrometry identifies proximal residues and interaction interfaces, providing distance restraints that can guide and validate structural models [108].
Biochemical and Biophysical Binding Assays
A suite of functional assays provides critical context for structural findings by quantifying molecular interactions. Fluorescence-based thermal shift assays monitor protein stability under different conditions or in the presence of ligands, helping to identify optimal constructs for crystallization and providing evidence for binding events [109]. Surface plasmon resonance (SPR) yields precise kinetic parameters (kon, koff) and affinity measurements (KD), while isothermal titration calorimetry (ITC) provides thermodynamic profiles (ΔH, ΔS) of molecular interactions [109]. These functional data help distinguish biologically relevant conformations from crystallization artifacts and provide the energetic framework for understanding structure-function relationships.
Practical Integration: From Data Collection to Model Building
Experimental Design and Sample Preparation
Successful integration begins with strategic experimental design that leverages the strengths of each technique. The process typically starts with biophysical characterization using thermal shift assays and dynamic light scattering to identify optimal protein constructs, buffer conditions, and ligands that promote stability and monodispersity—key factors for successful crystallization [109]. For membrane proteins, detergent screening combined with analytical ultracentrifugation can identify conditions that maintain native oligomeric states. These preliminary studies dramatically improve the efficiency of crystallization trials by focusing efforts on the most promising constructs and conditions.
Data Collection and Processing Workflows
Integrated structural biology relies on sophisticated computational pipelines that combine diverse data types. Modern crystallography software suites like HKL-3000 and PHENIX have evolved to incorporate external restraints and validation metrics from complementary methods [109]. For instance, NMR-derived distance restraints can guide molecular replacement solutions for crystal structures, while cryo-EM density maps can help resolve ambiguous regions in electron density. Cross-linking mass spectrometry data provides distance constraints that are particularly valuable for modeling flexible regions and validating quaternary structures. The key challenge lies in appropriately weighting the various data sources to avoid overfitting while maximizing information content.
Table 2: Computational Tools for Data Integration in Structural Biology
| Software/Platform | Primary Function | Integration Capabilities |
|---|---|---|
| HKL-3000 | Integrated crystallography data processing | Molecular replacement with NMR/models, ligand validation [109] |
| PHENIX | Crystallographic structure solution | Multi-crystal averaging, cross-validation with EM maps [109] |
| Rosetta | Molecular modeling and design | Incorporates EM, NMR, SAXS, and mutagenesis data [108] |
| COOT | Model building and refinement | Real-space refinement, validation against electron density [109] |
| HADDOCK | Docking of macromolecular complexes | Integrates NMR, MS, mutagenesis data as restraints [108] |
Validation and Quality Assessment
Rigorous validation is essential when building models from multiple data sources. The integrated approach employs cross-validation between techniques to identify inconsistencies and artifacts. For example, crystal structures can be validated against solution scattering data to detect crystal packing influences, while cryo-EM maps can be compared with crystal structures of individual components to assess conformational differences [109]. Modern validation servers routinely check structures against geometric databases, electron density fit, and consistency with biochemical data. Particular attention must be paid to ligand modeling, as studies have shown that a significant number of protein-ligand complexes in the PDB exhibit suboptimal ligand density fit, potentially misleading drug discovery efforts [109].
Case Studies in Integrated Structural Biology
COVID-19 Drug Discovery: The Moonshot Initiative
The COVID Moonshot Initiative exemplifies the power of integrating crystallography with complementary approaches for rapid therapeutic development. This open-science project utilized high-throughput crystallographic screening of the SARS-CoV-2 main protease (Mpro) to identify 71 promising fragment hits from a library of electrophiles [110] [111]. The structural data were made publicly available, enabling scientists worldwide to design potential inhibitors using computational methods. Machine learning algorithms predicted molecular interactions and optimized compounds, while functional assays validated inhibition potency and cellular activity [111]. This integrated approach accelerated the development of promising antiviral candidates by combining atomic-level structural insights with large-scale computational design and biochemical validation.
Membrane Protein Structure Determination
Membrane proteins represent particularly challenging targets for structural biology due to solubility issues and conformational heterogeneity. Successful structure determination of targets like G protein-coupled receptors (GPCRs) and ion channels has increasingly relied on combining crystallography with complementary methods. For instance, electron paramagnetic resonance (EPR) spectroscopy provides distance measurements between spin labels in different domains, revealing conformational changes that may be constrained in crystals [109]. Similarly, solid-state NMR can probe local structure and dynamics in membrane-embedded regions that are often poorly ordered in crystal structures [109]. The integration of these dynamic measurements with high-resolution crystal structures has been instrumental in understanding the mechanistic principles of membrane protein function.
Table 3: Key Research Reagents and Resources for Integrated Structural Studies
| Reagent/Resource | Function/Application | Examples/Notes |
|---|---|---|
| Crystallization Screens | Initial crystal condition screening | Sparse matrix screens (e.g., Hampton Research) optimize precipitant, buffer, pH [2] |
| Detergents/Membrane Mimetics | Solubilization of membrane proteins | Amphiphils, nanodiscs, lipid cubic phases for membrane protein crystallization [109] |
| Synchrotron Beamlines | High-intensity X-ray data collection | Automated facilities (e.g., Diamond Light Source) enable high-throughput data collection [110] |
| Public Data Repositories | Structure validation and modeling | PDB (structures), EMDB (maps), BMRB (NMR data) enable cross-validation [109] |
| Fragment Libraries | Ligand screening for drug discovery | Covalent fragment libraries screened against targets like ERK2, SARS-CoV-2 Mpro [110] |
The future of integrated structural biology lies in developing more sophisticated computational frameworks that can seamlessly combine data from multiple sources with appropriate error estimation and weighting. Emerging technologies such as X-ray free-electron lasers (XFELs) enable time-resolved studies of molecular dynamics at femtosecond resolution, while advances in cryo-EM promise to push resolution boundaries further [108] [107]. Machine learning approaches are revolutionizing protein structure prediction, as demonstrated by AlphaFold2, and are increasingly being applied to integrate experimental data for modeling complex biological assemblies [108].
The ongoing development of validation standards and data management systems will be crucial for ensuring the reproducibility and reliability of integrated structural models [109]. Initiatives to deposit raw diffraction images and unprocessed data alongside final models will enable independent validation and reanalysis as methods improve [109]. Furthermore, the structural biology community is moving toward more collaborative models where specialists in different techniques work together on complex biological problems, leveraging their respective expertise to build comprehensive mechanistic models.
In conclusion, while X-ray crystallography remains a foundational technique in structural biology, its integration with biochemical and biophysical methods has dramatically expanded its capabilities and biological relevance. By combining atomic-level structural information with data on dynamics, interactions, and function, researchers can develop more accurate and physiologically relevant models of biological systems. This integrated approach is particularly powerful in drug discovery, where understanding both structure and dynamics is essential for designing effective therapeutics. As technologies continue to advance, the synergy between crystallography and complementary methods will undoubtedly yield deeper insights into the molecular mechanisms of life and disease.
Conclusion
X-ray crystallography remains an indispensable source of high-resolution structural data, directly fueling drug discovery efforts for diseases from AIDS to cancer. While the challenge of crystallization persists, innovations in automation, beamline technology, and data collection are continuously expanding the landscape of tractable targets. The most profound recent shift is the symbiotic relationship with AI; predictive models are solving the phase problem and accelerating structure determination. The future of the field lies in effectively integrating these computational advances with robust experimental data to tackle more complex biological questions, such as the dynamics of membrane proteins and large macromolecular assemblies, thereby providing an ever-clearer view of the molecular machinery of life for therapeutic intervention.
References
- 1. Protein X-ray Crystallography: Principles of the Technique [https://www.proteinstructures.com/protein-crystallography-basics/]
- 2. x Ray crystallography - PMC - PubMed Central - NIH [https://pmc.ncbi.nlm.nih.gov/articles/PMC1186895/]
- 3. High-resolution protein modeling through Cryo-EM and AI [https://pmc.ncbi.nlm.nih.gov/articles/PMC12590954/]
- 4. X-ray Protein Crystallography [https://phys.libretexts.org/Courses/University_of_California_Davis/Biophysics_200A%3A_Current_Techniques_in_Biophysics/X-ray_Protein_Crystallography]
- 5. - X - Creative BioMart ray Crystallography [https://www.creativebiomart.net/resource/principle-protocol-x-ray-crystallography-393.htm]
- 6. - X | Anton Paar Wiki ray Crystallography [https://wiki.anton-paar.com/fi-en/x-ray-crystallography/]
- 7. The powerful imaging technique revealing a hidden world ... [https://www.nature.com/articles/d42473-025-00158-y]
- 8. X-ray crystallography [https://en.wikipedia.org/wiki/X-ray_crystallography]
- 9. X-ray Crystallography [https://chem.libretexts.org/Bookshelves/Analytical_Chemistry/Supplemental_Modules_(Analytical_Chemistry)/Instrumentation_and_Analysis/Diffraction_Scattering_Techniques/X-ray_Crystallography]
- 10. Max von Laue Discovers the Diffraction of X-Rays in Crystals [https://www.historyofinformation.com/detail.php?entryid=4408]
- 11. The birth of X-ray crystallography [https://www.nature.com/articles/491186a]
- 12. High-throughput three-dimensional protein structure ... [https://www.sciencedirect.com/science/article/abs/pii/S0958166900002263]
- 13. Structural biology at the National Synchrotron Light Source II [https://journals.iucr.org/s/issues/2025/04/00/he5686/]
- 14. Highly accurate protein structure prediction with AlphaFold [https://www.nature.com/articles/s41586-021-03819-2]
- 15. latest strategies in cryo-EM and X-ray crystallography [https://pubmed.ncbi.nlm.nih.gov/40312512]
- 16. Structural biology in the age of X-ray free-electron lasers ... [https://www.sciencedirect.com/science/article/pii/S0959440X24000356]
- 17. Advances in X-ray Diffraction for Protein Crystals [https://www.helixbiostructures.com/white-paper/advances-in-x-ray-diffraction-for-protein-crystals-emerging-technologies]
- 18. ' Bragg : Formula, s & XRD Applications Explained Law Derivation [https://www.vedantu.com/physics/braggs-law]
- 19. Protein Structure from X-Ray Diffraction - PMC [https://pmc.ncbi.nlm.nih.gov/articles/PMC3456177/]
- 20. ' Bragg - GeeksforGeeks s Law [https://www.geeksforgeeks.org/physics/braggs-law/]
- 21. X-ray data processing - PMC - PubMed Central [https://pmc.ncbi.nlm.nih.gov/articles/PMC5629563/]
- 22. 2025 DXC Summary - DXC [https://www.dxcicdd.com/2025-dxc-summary/]
- 23. Basics | Chemical Instrumentation Facility Crystallography [https://www.cif.iastate.edu/services/acide/xrd-tutorial/crystallography]
- 24. - X RAY Crystallography [https://www.stolaf.edu/depts/chemistry/courses/toolkits/121/mo/x-ray.html]
- 25. Space group [https://en.wikipedia.org/wiki/Space_group]
- 26. 4.2: Unit - Chemistry LibreTexts Cells [https://chem.libretexts.org/Courses/Lafayette_College/CHEM_440%3A_Structure_Determination/04%3A_X-ray_Crystallography/4.02%3A_Unit_Cells]
- 27. Principles of Protein X-Ray Crystallography [https://link.springer.com/book/10.1007/0-387-33746-6]
- 28. Sample delivery methods for protein X-ray crystallography ... [https://www.nature.com/articles/s41467-025-65173-5]
- 29. X-Ray Crystallography - UF Health Cancer Center [https://cancer.ufl.edu/research/supported-shared-resources/other-supported-resources/drug-design-core/x-ray-crystallography/]
- 30. Facing the phase problem - PMC - PubMed Central [https://pmc.ncbi.nlm.nih.gov/articles/PMC10478523/]
- 31. Common Problems in Protein X-ray Crystallography and ... [https://www.creative-biostructure.com/resource-common-problems-protein-xray-crystallography.htm?srsltid=AfmBOoqfYUrI0ym9WmKuTUnvRiRUgx78CykbSCZcWymezG4Q-0pbCBLl]
- 32. How cryo‐electron microscopy and X‐ray crystallography ... [https://pmc.ncbi.nlm.nih.gov/articles/PMC5192981/]
- 33. Introduction to protein crystallization - PMC - PubMed Central [https://pmc.ncbi.nlm.nih.gov/articles/PMC3943105/]
- 34. PREDICTION OF PROTEIN CRYSTALLIZATION OUTCOME ... [https://pmc.ncbi.nlm.nih.gov/articles/PMC2957526/]
- 35. Protein Crystallization for X-ray Crystallography - PMC [https://pmc.ncbi.nlm.nih.gov/articles/PMC3182643/]
- 36. Protein Crystallography | Discovery Research Platform for ... [https://biology.ed.ac.uk/drp/structural-biology-core/protein-crystallography]
- 37. Video: Protein Crystallization for X-ray Crystallography [https://www.jove.com/v/2285/protein-crystallization-for-x-ray-crystallography]
- 38. Guide to Automated Protein Crystallization [https://formulatrix.com/life-science-automation-blog/automated-protein-crystallization-formulatrix/]
- 39. Scalable fabrication of an array-type fixed-target device for ... [https://www.nature.com/articles/s41598-024-83341-3]
- 40. (IUCr) A simple vapor-diffusion method enables protein ... [https://journals.iucr.org/paper?nj5304]
- 41. Using AlphaFold and Symmetrical Docking to Predict ... [https://pubmed.ncbi.nlm.nih.gov/40401365/]
- 42. X-ray sources [https://www.ruppweb.org/Xray/x-ray_sources.html]
- 43. SC-XRD Sources [https://www.bruker.com/en/products-and-solutions/diffractometers-and-x-ray-microscopes/single-crystal-x-ray-diffractometers/sc-xrd-components/sources.html]
- 44. Single Crystal X-ray Diffraction [https://rigaku.com/products/crystallography/x-ray-diffraction]
- 45. SC-XRD Detectors [https://www.bruker.com/en/products-and-solutions/diffractometers-and-x-ray-microscopes/single-crystal-x-ray-diffractometers/sc-xrd-components/detectors.html]
- 46. Chemical X-Ray Crystallography [https://www.dectris.com/x-ray-techniques/chemical-x-ray-crystallography/]
- 47. X-ray Crystallography [https://www.protoxrd.com/x-ray-crystallography/x-ray-crystallography-overview]
- 48. Completion of partial structures using Patterson maps with ... [https://arxiv.org/html/2511.10440v1]
- 49. Mapping protein dynamics at high spatial resolution with ... [https://www.nature.com/articles/s41557-023-01329-4]
- 50. Learn: Guide to Understanding PDB Data: Crystallographic Data [https://pdb101.rcsb.org/learn/guide-to-understanding-pdb-data/crystallographic-data]
- 51. Protein crystallography for aspiring crystallographers or how ... [https://pmc.ncbi.nlm.nih.gov/articles/PMC4080831/]
- 52. The current role and evolution of X-ray crystallography in ... [https://pmc.ncbi.nlm.nih.gov/articles/PMC10620067/]
- 53. Fragment- and structure-based drug discovery for developing ... [https://pmc.ncbi.nlm.nih.gov/articles/PMC8666131/]
- 54. Methods for Determining Atomic Structures - PDB-101 [https://pdb101.rcsb.org/learn/guide-to-understanding-pdb-data/methods-for-determining-structure]
- 55. XRD Explained: Principles, Analysis & Applications [https://www.technologynetworks.com/analysis/articles/x-ray-diffraction-xrd-xrd-principle-xrd-analysis-and-applications-404260]
- 56. 2.3: Protein Structural Determination [https://chem.libretexts.org/Courses/University_of_Arkansas_Little_Rock/CHEM_4320_5320%3A_Biochemistry_1/02%3A__Protein_Structure/2.3%3A_Protein_Structural_Determination]
- 57. Practical 03: Introduction to protein structure [https://biophys.uni-saarland.de/courses/comp-mol-bio/pract03/]
- 58. How Fragment-Based Drug Screening Is Like the 'Tetris' of ... [https://www.pfizer.com/news/articles/how-fragment-based-drug-screening-%E2%80%98tetris%E2%80%99-drug-design]
- 59. Determining Protein Structures Using X-Ray Crystallography [https://pubmed.ncbi.nlm.nih.gov/38656501/]
- 60. Solid/liquid interface induced protein crystallization [https://www.sciencedirect.com/science/article/abs/pii/S096089742500018X]
- 61. Protein crystallization: Eluding the bottleneck of X-ray ... [https://www.aimspress.com/article/id/1622]
- 62. Common Problems in Protein X-ray Crystallography and ... [https://www.creative-biostructure.com/resource-common-problems-protein-xray-crystallography.htm?srsltid=AfmBOoq8UaE-BEk3u8NNba1tf3ZK-aVjLBbxlo9-nuZHZ82s9Ga8Fbjj]
- 63. High-resolution protein modeling through Cryo-EM and AI ... [https://www.frontiersin.org/journals/molecular-biosciences/articles/10.3389/fmolb.2025.1688455/full]
- 64. for Data Structure Determination - PMC Collection Crystallographic [https://pmc.ncbi.nlm.nih.gov/articles/PMC7670882/]
- 65. strategies and processing | Mathematical... Data collection [https://fiveable.me/mathematical-crystallography/unit-10/data-collection-strategies-processing/study-guide/Xx8PqBA58OCJaXo7]
- 66. Cryo- crystallography and Data Collection [https://people.mbi.ucla.edu/sawaya/m230d/Data/data.html]
- 67. Comparison Of Structural Techniques: X - ray , NMR... | Peak Proteins [https://peakproteins.com/a-comparison-of-the-structural-techniques-used-at-sygnature-discovery-x-ray-crystallography-nmr-and-cryo-em/]
- 68. Understanding Radiation Damage in Cryo-Electron M [https://www.jeolusa.com/NEWS-EVENTS/Blog/understanding-radiation-damage-cryo-electron-microscopy]
- 69. Room-Temperature protein Crystallography In Drug Design [https://www.saromics.com/room-temperature-crystallography/]
- 70. Radiation damage effects at four specimen temperatures from ... [https://pmc.ncbi.nlm.nih.gov/articles/PMC2826528/]
- 71. X-Ray Crystallography - an overview [https://www.sciencedirect.com/topics/materials-science/x-ray-crystallography]
- 72. Preparing for successful protein crystallization experiments [https://journals.iucr.org/paper?oq5003]
- 73. Macromolecular Crystallography 2026 - CSHL Meetings [https://meetings.cshl.edu/courses.aspx?course=C-CRYS]
- 74. Introduction to phasing - PMC [https://pmc.ncbi.nlm.nih.gov/articles/PMC2852296/]
- 75. Experimental phasing opportunities for macromolecular ... [https://www.nature.com/articles/s42004-023-01014-0]
- 76. Crystallography Technique: Experimental phasing [https://rigaku.com/products/crystallography/techniques/experimental-phasing-method]
- 77. Single-wavelength anomalous diffraction [https://en.wikipedia.org/wiki/Single-wavelength_anomalous_diffraction]
- 78. X-Ray Crystallography - Direct methods [http://my.yetnet.ch/dergutemensch/crystallography/anomalousdispersion.htm]
- 79. Preparing for successful protein crystallization experiments [https://journals.iucr.org/f/issues/2025/07/00/oq5003/]
- 80. Validation of ligands in macromolecular structures determined ... [https://pmc.ncbi.nlm.nih.gov/articles/PMC5947763/]
- 81. A Beginner's Guide to Protein Crystallography [https://www.creative-biostructure.com/protein-crystallography-452.htm?srsltid=AfmBOor9e5nWEVD9C5N7KyN9Wxzcs8Yowmpy43IPurO8j8LvFBXg5dxV]
- 82. Better models by discarding data? - IUCr Journals [https://journals.iucr.org/d/issues/2013/07/00/ba5192/]
- 83. Data-driven challenges and opportunities in crystallography [https://pmc.ncbi.nlm.nih.gov/articles/PMC7289006/]
- 84. X-ray crystallography: Assessment and validation of protein ... [https://pmc.ncbi.nlm.nih.gov/articles/PMC3138648/]
- 85. Validation and Quality Assessment of X-ray Protein Structures [https://www.proteinstructures.com/protein-structure-validation/]
- 86. Real Space Refinement of Crystal Structures with ... [https://www.sciencedirect.com/science/article/pii/S0969212611003650]
- 87. Structure Validation and Quality [https://www.rcsb.org/docs/additional-resources/structure-validation-and-quality]
- 88. Protein Structure Determination by X-ray Crystallography [https://www.molecularcloud.org/p/protein-structure-determination-by-x-ray-crystallography]
- 89. X-ray Tutorial [https://www.helmholtz-berlin.de/bessy-mx-tutorial]
- 90. Comparison of X-ray Crystallography, NMR and EM [https://www.creative-biostructure.com/comparison-of-crystallography-nmr-and-em_6.htm?srsltid=AfmBOormappyr37RAmEJ1tTYfaNJ_en7xo4a5yAdeCp43miuKsuXpGO4]
- 91. Specialty grand challenges in theoretical modeling, ... [https://www.frontiersin.org/journals/chemical-biology/articles/10.3389/fchbi.2025.1635423/full]
- 92. Cryo Electron Microscopy: Principle, Strengths, Limitations ... [https://www.technologynetworks.com/analysis/articles/cryo-electron-microscopy-principle-strengths-limitations-and-applications-377080]
- 93. Comparing Analytical Techniques for Structural Biology [https://www.nanoimagingservices.com/about/blog/unraveling-the-mysteries-of-the-molecular-world-structural-biology-techniques]
- 94. RCSB PDB: Homepage [https://www.rcsb.org/]
- 95. RCSB PDB Newsletter: Summer 2025 [https://cdn.rcsb.org/rcsb-pdb/general_information/news_publications/newsletters/2025q3/home.html]
- 96. Validation of Structures in the Protein Data Bank - PMC [https://pmc.ncbi.nlm.nih.gov/articles/PMC5718880/]
- 97. Structure [https://www.rcsb.org/docs/exploring-a-3d-structure/structure]
- 98. Molecular Graphics Programs - PDB-101 [https://pdb101.rcsb.org/learn/guide-to-understanding-pdb-data/molecular-graphics-programs]
- 99. How AI Revolutionized Protein Science, but Didn't End It [https://www.quantamagazine.org/how-ai-revolutionized-protein-science-but-didnt-end-it-20240626/]
- 100. The X-ray crystallography phase problem solved thanks to AlphaFold ... [https://pubmed.ncbi.nlm.nih.gov/35362474/]
- 101. Nobel-Winning AlphaFold 2 and RosettaFold : Cracking the Protein... [https://bcrf.biochem.wisc.edu/2024/12/19/nobel-winning-alphafold2-and-rosettafold-cracking-the-protein-folding-mystery/]
- 102. Multistate and functional protein design using ... [https://www.nature.com/articles/s41587-024-02395-w]
- 103. What’s Hot in : Protein Structure Prediction using AI | Eureka blog [https://www.criver.com/eureka/whats-hot-2025-protein-structure-prediction-using-ai]
- 104. LightRoseTTA: High‐Efficient and Accurate Protein Structure ... [https://pmc.ncbi.nlm.nih.gov/articles/PMC12097069/]
- 105. Room-temperature X-ray fragment screening with serial ... [https://www.nature.com/articles/s41467-025-64918-6]
- 106. AlphaFold predictions are valuable hypotheses and ... [https://www.nature.com/articles/s41592-023-02087-4]
- 107. Comparison of X-ray Crystallography, NMR and EM [https://www.creative-biostructure.com/comparison-of-crystallography-nmr-and-em_6.htm?srsltid=AfmBOopoYZmOV9vyXp-MPwMOEMK_EwOFNjRCrLChbJJHegplxKrBMJHt]
- 108. Experimentally-Driven Protein Structure Modeling - PMC [https://pmc.ncbi.nlm.nih.gov/articles/PMC7214187/]
- 109. X-ray crystallography over the past decade for novel drug ... [https://pmc.ncbi.nlm.nih.gov/articles/PMC4655606/]
- 110. Crystallographic Technique - an overview [https://www.sciencedirect.com/topics/biochemistry-genetics-and-molecular-biology/crystallographic-technique]
- 111. The Role of X-Ray Crystallography in Data Science [https://dscnextconference.com/the-role-of-x-ray-crystallography-in-data-science/]