Protein X-Ray Crystallography: Principles, Methods, and Applications in Drug Discovery
This article provides a comprehensive guide to protein X-ray crystallography, tailored for researchers, scientists, and drug development professionals.
Protein X-Ray Crystallography: Principles, Methods, and Applications in Drug Discovery
Abstract
This article provides a comprehensive guide to protein X-ray crystallography, tailored for researchers, scientists, and drug development professionals. It covers the foundational principles of the technique, from protein crystallization and the phase problem to data collection. The scope extends to detailed methodological workflows and key applications in structure-based drug design and fragment-based discovery. Furthermore, the article addresses common challenges like growing high-quality crystals and mitigating radiation damage, offering practical troubleshooting and optimization strategies. Finally, it outlines the critical process of structure validation and compares crystallographic data with insights from other methods like NMR, providing a holistic view for critical evaluation of macromolecular structures.
The Foundation of Structural Biology: Core Principles of Protein X-Ray Crystallography
In the field of structural biology, X-ray crystallography remains a cornerstone technique, responsible for determining over 85% of the macromolecular structures in the Protein Data Bank (PDB) [1]. The process, however, is entirely dependent on the availability of high-quality crystals, a step that is frequently described as the primary bottleneck in structure determination [2]. This technical guide details the foundational principles and practical methodologies for protein crystallization, framed within the broader context of basic protein X-ray crystallography research. The process of crystallization is, at its core, a controlled precipitation event. It requires the delicate manipulation of a protein solution into a supersaturated state where molecules can spontaneously arrange into a periodic, three-dimensional lattice [1] [2]. Success hinges on a deep understanding of both the biochemical nature of the protein sample and the physical chemistry of crystal nucleation and growth. The following sections provide an in-depth examination of the critical parameters, standard protocols, and key reagents that researchers must master to successfully transition from a purified protein solution to a diffraction-ready crystal.
Fundamental Principles of Protein Crystallization
The Crystallization Phase Diagram
The journey from a soluble protein to a crystal is best understood through the lens of a phase diagram, which maps the protein's behavior under varying concentrations of both protein and precipitant [3] [2]. The diagram is divided into distinct zones:
- Undersaturated Zone: Here, the protein concentration is below its solubility limit. The solution is stable, and no nucleation or crystal growth can occur [2].
- Metastable Zone: In this region, the solution is supersaturated, but the energy barrier for spontaneous nucleation is high. While pre-existing nuclei can grow, new nucleation events are unlikely [2].
- Labile or Nucleation Zone: This zone represents a higher level of supersaturation where the solution is unstable and the probability of spontaneous nucleation is highest. This is the target zone for initial crystal formation [3] [2].
- Precipitation Zone: At very high supersaturation, the protein precipitates out of solution in a disordered, amorphous form, preventing the ordered assembly required for crystal growth [3].
The objective of all crystallization methods is to guide the protein solution from the undersaturated zone into the labile zone to initiate nucleation, and then to maintain conditions in the metastable zone to allow for controlled crystal growth [2].
Key Biochemical Requirements for Crystallization
The quality of the starting protein sample is the single most critical factor for successful crystallization. The following requirements are essential:
- High Purity: Samples must be highly homogeneous, typically >95% pure, as impurities can disrupt the orderly packing of molecules into a crystal lattice [3] [1].
- Structural Homogeneity: The protein must exist in a single, stable conformational state. Sources of heterogeneity include flexible regions, oligomerization, misfolded populations, and post-translational modifications like glycosylation [1].
- Sample Stability: Crystals can take days to months to nucleate and grow. The protein must remain stable and soluble throughout this period. Techniques like differential scanning fluorimetry can be used to identify optimal buffer conditions, pH, and ligands that enhance stability [1].
- Monodispersity: The protein solution should be monodisperse, meaning it consists of uniform particles without aggregation. Techniques such as dynamic light scattering (DLS) and size-exclusion chromatography (SEC) are used to assess this property [1].
Table: Key Biochemical Properties for Successful Crystallization
| Property | Target | Common Assessment Methods |
|---|---|---|
| Purity | >95% | SDS-PAGE, Mass Spectrometry |
| Structural Homogeneity | Single Conformational State | SEC-MALS, Analytical Ultracentrifugation |
| Stability | Stable for days to months | Differential Scanning Fluorimetry, Circular Dichroism |
| Solubility/Monodispersity | Monodisperse, no aggregation | Dynamic Light Scattering, Size-Exclusion Chromatography |
Core Crystallization Methodologies
Several experimental techniques are employed to achieve the controlled supersaturation required for crystallization. The following are the most widely used protocols in structural biology laboratories.
Vapor Diffusion (Hanging and Sitting Drop)
Vapor diffusion is the most extensively used crystallization method [2]. The principle involves placing a small drop containing a mixture of protein and precipitant solutions in a sealed chamber with a larger reservoir of precipitant solution. Water vapor diffuses from the drop towards the reservoir until the osmolarity of the drop and the reservoir are equal. This slowly concentrates both the protein and the precipitant, ideally driving the solution into the nucleation zone of the phase diagram [3].
Hanging Drop Procedure [3]:
- Fill the wells of a 24-well tray with 500 µL of precipitant solution (reservoir).
- Create a silicone grease ring around the edge of each well.
- Place a clean cover slide on a stable surface.
- Pipette 1-2 µL of concentrated protein solution onto the center of the cover slide.
- Add an equal volume of reservoir solution directly to the protein drop, carefully avoiding bubble formation.
- Gently flip the cover slide and place it over the well, pressing down to form a seal with the grease.
- Place the tray on a shock-absorbing material in a constant-temperature incubator (commonly 20°C) and avoid disturbance.
- Check for crystals regularly over days to months, documenting the results.
Sitting Drop Procedure: The procedure is nearly identical, except the protein-precipitant mixture is dispensed onto a small shelf or bridge that sits above the reservoir solution. The well is then sealed with transparent tape instead of a cover slide and grease [3].
Batch Crystallization under Oil
The batch method relies on bringing the protein directly into the nucleation zone by mixing it with an appropriate amount of precipitant [3]. This is typically performed under a paraffin or mineral oil layer to prevent evaporation of water from the drop [3] [2].
Microbatch Procedure [3]:
- Air-spray a new 96-well microbatch tray to remove dust.
- Fill the wells with paraffin oil to a height of about 3 mm.
- Load 1 µL of concentrated protein solution directly to the bottom of an oil-filled well.
- Load 1 µL of precipitant solution into the same well, ensuring it sinks and fuses with the protein droplet.
- Move to the next well until the tray is complete.
- Follow the same incubation and monitoring procedures as for vapor diffusion.
Advanced and Emerging Techniques
- Liquid-Liquid Diffusion: Also known as counter-diffusion, this technique involves injecting protein and precipitant on opposite sides of a closed channel (e.g., a capillary). The components gradually mix via diffusion, creating a gradient of conditions that can sample the phase diagram and promote crystal growth [2].
- Serial Crystallography: This method, often performed at room temperature, involves merging diffraction data from thousands of microcrystals. It is particularly valuable for capturing protein conformations at near-physiological temperatures and for time-resolved studies [4].
The Scientist's Toolkit: Essential Reagents and Materials
Successful crystallization requires careful selection of reagents that modulate protein solubility and promote lattice formation.
Table: Key Research Reagent Solutions for Protein Crystallization
| Reagent Category | Function | Common Examples |
|---|---|---|
| Precipitants | To reduce protein solubility and drive the solution toward supersaturation [2]. | Polyethylene glycol (PEG) 3350, Ammonium sulfate, Sodium chloride, 2-methyl-2,4-pentanediol (MPD) [3] [2] |
| Buffers | To control the pH of the crystallization condition, typically within 1-2 pH units of the protein's pI [1] [2]. | HEPES, Tris hydrochloride, Sodium cacodylate, MES, Sodium acetate [2] |
| Salts | To enhance stability at lower concentrations and compete for water molecules at higher concentrations (salting-out) [1]. | Ammonium sulfate, Sodium chloride, various metal salts [1] |
| Additives | To promote protein stability, solubility, or specific crystal contacts [2]. | Substrates/ligands, metal ions, detergents (for membrane proteins), reducing agents [1] [2] |
| Reducing Agents | To maintain cysteine residues in a reduced state and prevent disulfide-mediated aggregation [1]. | DTT, TCEP (noted for its long solution half-life) [1] |
Optimization and Screening Strategies
Given the empirical nature of crystallization, a systematic approach to screening and optimization is crucial.
- Initial Screening: Sparse matrix incomplete factorial screens are commonly used for initial trials. These screens, available commercially, are biased toward conditions that have been successful for other macromolecules and efficiently sample a wide range of precipitants, salts, and pH levels [3] [5].
- Construct Optimization: If a protein proves difficult to crystallize, the protein itself may be modified. This involves using bioinformatics tools and limited proteolysis to design constructs that remove flexible regions, thereby reducing conformational heterogeneity and improving crystallization propensity [1] [2].
- Iterative Optimization: Modern software platforms, such as ROCK MAKER, can automate the optimization process. For example, Iterative Screen Optimization (ISO) automatically adjusts precipitant concentrations in successive rounds of experiments based on user scores from previous trials, systematically driving conditions toward the nucleation zone [6].
The path from a purified protein to a diffraction-quality crystal is a complex and often challenging endeavor. It demands a rigorous approach to protein biochemistry, a solid understanding of the physical principles of crystallization, and meticulous execution of experimental protocols. While the process remains partly empirical, the strategies outlined in this guide—emphasizing sample quality, systematic screening, and iterative optimization—provide a robust framework for success. Mastering this critical first step of crystallization unlocks the power of X-ray crystallography, enabling researchers to visualize biological macromolecules at atomic resolution and profoundly advancing our understanding of cellular function and drug discovery.
Workflow and Data Analysis Diagrams
Crystallization Workflow
Phase Diagram Zones
X-ray diffraction (XRD) is a powerful non-destructive analytical technique that has revolutionized our understanding of crystalline materials, from simple inorganic compounds to complex biological macromolecules [7]. At its core, XRD exploits the wave nature of X-rays, which have wavelengths (typically 0.1-10 nm) comparable to the interatomic spacing in crystals [7]. When X-rays interact with a crystalline sample, they scatter from the electrons around atoms in the crystal lattice. While most scattered X-rays interfere destructively and cancel each other out, in specific directions determined by the crystal's internal structure, they interfere constructively and reinforce one another, producing detectable diffraction patterns [8]. This phenomenon provides unparalleled insights into the atomic and molecular structure of materials, enabling researchers to determine the precise arrangement of atoms within a crystal [7].
The technique is particularly valuable in structural biology, where it has been instrumental in determining the structures of proteins, nucleic acids, and other biological macromolecules [9]. The diffraction pattern generated during an XRD experiment serves as a unique "fingerprint" for material identification and structural analysis [7]. Unlike many other analytical techniques, XRD is non-destructive, meaning the sample remains intact after analysis, allowing for further investigation if needed [10]. For protein crystallography specifically, XRD provides both qualitative and quantitative information about crystal structure, phase identification, lattice parameters, and molecular geometry [7] [8].
Theoretical Foundation: Bragg's Law and the Diffraction Condition
The fundamental principle governing X-ray diffraction is Bragg's Law, formulated by William Lawrence Bragg in 1913 [7]. This elegant mathematical relationship describes the precise conditions under which constructive interference of X-rays occurs from parallel crystal planes.
Mathematical Formulation
Bragg's Law is expressed by the equation:
nλ = 2d sinθ
Where:
- n = order of diffraction (integer: 1, 2, 3...)
- λ = wavelength of the incident X-ray radiation
- d = interplanar spacing, the perpendicular distance between parallel crystal planes
- θ = Bragg angle, the angle between the incident X-ray beam and the crystal plane [7] [11]
This condition must be satisfied for a diffraction peak to be observed. The path difference between X-rays scattered from adjacent parallel crystal planes must equal an integer multiple of the X-ray wavelength for constructive interference to occur [8].
Physical Interpretation
In a crystalline material, atoms are arranged in a regular, repeating pattern forming various sets of parallel planes with characteristic interplanar spacings (d-spacings) [10]. When monochromatic X-rays strike these planes, each atom acts as a scattering center, emitting secondary X-rays with the same frequency as the incident beam [7]. Bragg's Law essentially treats diffraction as a "reflection" of X-rays from these atomic planes, but only at specific angles where the path length difference between waves reflected from successive planes results in constructive interference [8] [12].
The relationship shows that larger interplanar spacings (d) produce diffraction peaks at smaller angles (θ), while smaller spacings produce peaks at larger angles [12]. This inverse relationship enables researchers to calculate unknown interplanar spacings by measuring diffraction angles, forming the basis for crystal structure determination [7].
Table: Key Parameters in Bragg's Law and Their Significance
| Parameter | Symbol | Significance in XRD | Typical Values/Units |
|---|---|---|---|
| Wavelength | λ | Determines resolution capability; defines scale of observable structures | ~1.54 Å (Cu Kα) [7] |
| Interplanar Spacing | d | Reveals distances between atomic planes in crystal | 0.5 - 20 Å [12] |
| Bragg Angle | θ | Angle between incident beam and crystal plane; measured during experiment | 5° - 80° (2θ) [11] |
| Diffraction Order | n | Integer representing harmonic order of diffraction | 1, 2, 3... [7] |
Instrumentation and Data Collection Methods
Modern X-ray diffraction instruments, known as diffractometers, are sophisticated systems designed to precisely control and measure the diffraction phenomenon [7]. While configurations vary depending on the specific application, all diffractometers share fundamental components that work in coordination to produce reliable diffraction data [12].
Core Components of an X-Ray Diffractometer
A typical X-ray diffractometer consists of several essential components:
X-ray Source: Generates monochromatic X-rays through electron bombardment of a metal target. The most common sources use copper (Cu Kα, λ = 1.5418 Å) or molybdenum (Mo Kα, λ = 0.71 Å) targets [7]. Copper radiation is ideal for most routine analyses, while molybdenum radiation is preferred for samples containing heavy elements or when higher resolution is needed [7]. Modern sources include X-ray tubes, rotating anode generators, microfocus tubes, and synchrotron facilities [12].
Incident Beam Optics: Various optical elements condition the X-ray beam, including Soller slits for controlling beam divergence, monochromators for wavelength selection, and focusing mirrors for beam concentration [7].
Sample Stage: Holds the specimen and allows precise positioning and rotation during measurement. For protein crystallography, samples are typically mounted in nylon loops or on glass fibers and maintained at controlled temperatures (often cryogenic) to minimize radiation damage [7] [11].
Detector System: Records the diffracted X-rays and converts them into digital data. Modern diffractometers employ position-sensitive detectors (PSDs) or area detectors that simultaneously collect data over a range of angles, significantly reducing measurement time while maintaining high resolution [7].
Goniometer: The precision mechanical system controlling angular relationships between X-ray source, sample, and detector. Modern goniometers achieve angular accuracy better than 0.001° [7].
Data Collection Geometries
Different experimental approaches are employed based on sample characteristics and research objectives:
Table: Comparison of XRD Data Collection Methods
| Method | Sample Type | Pattern Characteristics | Primary Applications | Advantages/Limitations |
|---|---|---|---|---|
| Single Crystal XRD [7] [8] | Large, well-ordered single crystal | Defined spots on detector | Complete structural determination; absolute configuration | Advantage: Highest information content; complete 3D structure Limitation: Requires large, high-quality crystals |
| Powder XRD [7] [12] | Microcrystalline powder | Concentric rings (Debye rings) | Phase identification; quantitative analysis; crystallite size | Advantage: Simple sample preparation; fast analysis Limitation: Peak overlap; lower information content |
| Fiber Diffraction [12] | Partially oriented fibers | Arcs or partial rings | Helical structures; DNA; fibrous proteins | Advantage: Handles partially ordered materials Limitation: Limited orientation information |
| Grazing Incidence XRD [12] | Thin films, surfaces | Elongated streaks | Surface structure; thin film characterization | Advantage: Surface-sensitive; minimal substrate interference Limitation: Specialized geometry required |
Protein Crystallography: Special Considerations and Techniques
Protein X-ray crystallography presents unique challenges compared to small molecule crystallography, primarily due to the complexity, flexibility, and fragility of biological macromolecules [13]. Proteins are large, often containing thousands of atoms, with delicate structures that can be easily damaged by X-ray radiation [13].
Sample Preparation and Optimization
The quality of protein crystals directly determines the success and resolution of an XRD experiment. Several specialized techniques have been developed for protein sample preparation:
Crystal Growth: Protein crystallization typically requires testing hundreds or thousands of conditions to find the optimal combination of pH, precipitant concentration, temperature, and additives that promote ordered crystal formation [9]. This process has been revolutionized by high-throughput robotic screening systems [13].
Cryocooling: To mitigate radiation damage during data collection, protein crystals are typically flash-cooled to cryogenic temperatures (around 100 K) using liquid nitrogen [13]. This requires cryoprotectants to prevent ice formation that could damage the crystal lattice.
Crystal Mounting: Protein crystals are extremely fragile and typically manipulated using specialized loops or micro-tools [11]. They are then mounted on a goniometer that allows precise rotation in the X-ray beam [7].
Advanced Methodologies in Protein XRD
Recent technological advances have addressed many challenges in protein crystallography:
Serial Crystallography (SX): This approach has revolutionized structural biology by enabling data collection from micro-to-nano-sized crystals [13]. Instead of collecting a complete dataset from a single large crystal, SX combines diffraction patterns from thousands of microcrystals, each exposed to X-rays only once [13]. This includes:
- Serial Femtosecond Crystallography (SFX): Performed at X-ray free-electron lasers (XFELs) using the "diffraction before destruction" principle, where ultra-bright femtosecond X-ray pulses capture diffraction patterns before the crystal is destroyed [13].
- Serial Millisecond Crystallography (SMX): Conducted at synchrotron sources with longer exposure times [13].
Time-Resolved Crystallography: This technique captures structural changes in proteins during biochemical reactions, creating "molecular movies" of biological processes [13]. Reactions can be initiated by light (for light-activated proteins) or by rapid mixing of substrates with enzyme crystals (Mix-and-Inject Serial Crystallography, MISC) [13].
Sample Delivery Systems: Various methods have been developed to efficiently deliver microcrystals to the X-ray beam in serial crystallography:
Data Analysis and Interpretation Workflow
The transformation of raw diffraction data into an atomic model involves a multi-step computational process with rigorous validation at each stage. The workflow can be visualized as follows:
Key Steps in Structure Determination
Data Reduction and Processing: Raw diffraction images are processed to determine the crystal orientation (indexing), integrate spot intensities, and scale measurements from different images [7]. This step yields a list of structure factor amplitudes (but not phases) for each reflection [8].
Phase Problem Solution: The critical challenge in crystallography is that diffraction patterns contain information about the amplitude but not the phase of structure factors [8]. Several approaches address this:
Electron Density Map Interpretation: The phased structure factors are used to calculate an electron density map, which is interpreted by building an atomic model that fits the observed density [8] [14]. Modern software tools facilitate this process through automated model building algorithms [7].
Refinement and Validation: The initial model is iteratively refined to improve agreement with the experimental data while maintaining stereochemical合理性 [12]. The final model is validated using various metrics including R-factors, Ramachandran plots, and real-space correlation coefficients [14].
Table: Key Metrics in Protein Structure Validation
| Validation Metric | Purpose | Ideal Values |
|---|---|---|
| R-factor/R-free [14] | Measures agreement between model and experimental data | R-free < 0.20 (high resolution) |
| Ramachandran Plot [14] | Assesses protein backbone torsion angles | >98% in favored regions |
| Root-Mean-Square Deviation (RMSD) [14] | Evaluates bond lengths and angles | Bond lengths: <0.02 Å Bond angles: <2° |
| Clashscore [14] | Identifies steric conflicts between atoms | <10 (low clashes) |
| Real-Space Correlation Coefficient [14] | Measures local fit to electron density | >0.8 (well-defined regions) |
Research Reagent Solutions for Protein XRD
Successful protein X-ray crystallography requires specialized reagents and materials at each stage of the process. The following table outlines essential solutions and their applications:
Table: Essential Research Reagents and Materials for Protein X-Ray Crystallography
| Reagent/Material | Application Stage | Function/Purpose | Examples/Specifications |
|---|---|---|---|
| Crystallization Screening Kits [9] | Crystal Growth | Initial condition screening | Sparse matrix screens; PEG/Ion screens; Grid screens |
| Cryoprotectants [13] | Sample Preparation | Prevent ice formation during cryocooling | Glycerol, ethylene glycol, sucrose, paraffin oil |
| Heavy Atom Compounds [14] | Experimental Phasing | Provide anomalous scattering for phase determination | Platinum, gold, mercury, selenium derivatives |
| Crystal Mounting Loops [11] | Sample Mounting | Secure fragile crystals during data collection | Nylon, litholoops; various sizes (50-500 μm) |
| Synchrotron Beam Time [12] [13] | Data Collection | High-intensity X-ray source | Sector 22-ID at APS; Beamline 8.3.1 at ALS |
| Structure Solution Software [7] | Data Processing | Data analysis, phasing, refinement | Phenix, CCP4, HKL-3000, SHELX, Coot |
| Liquid Injection Systems [13] | Serial Crystallography | Deliver crystal streams to X-ray beam | Gas Dynamic Virtual Nozzle (GDVN); Viscous extruders |
Applications in Drug Development and Metallodrug Research
X-ray crystallography plays a crucial role in modern drug development, particularly in structure-based drug design and understanding metallodrug mechanisms [14]. The technique provides atomic-level insights that are invaluable for rational drug optimization.
Protein-Metallodrug Interactions
The interaction between metal-based therapeutic compounds and their protein targets is a particularly important application of XRD in pharmaceutical research [14]. Protein metalation—the process by which a metal compound reacts with a protein to form a metal/protein adduct—underlies many biological events and therapeutic mechanisms [14]. X-ray crystallography has been used to characterize adducts formed between proteins and platinum (e.g., cisplatin), gold, ruthenium, rhodium, iridium, copper, manganese, and vanadium-based drugs [14].
These studies reveal precise metal coordination sites within protein structures, such as:
- Cisplatin fragments binding to His15 of hen egg-white lysozyme (HEWL) [14]
- Platinum binding to His105 and His119 side chains of bovine pancreatic ribonuclease (RNase A) [14]
- Cisplatin interaction with Cy
In protein X-ray crystallography, the phase problem represents the fundamental challenge that researchers must overcome to determine accurate three-dimensional macromolecular structures. While X-ray diffraction experiments readily yield the amplitudes of structure factors, the crucial phase information is lost during measurement, making direct reconstruction of electron density maps impossible. This technical guide provides an in-depth examination of contemporary phasing methodologies, including molecular replacement, experimental phasing via anomalous scattering, and emerging computational approaches. Designed for structural biologists and drug development professionals, this review synthesizes current technical protocols, quantitative comparisons of method efficacy, and visualization of core workflows essential for successful structure determination in basic and applied research contexts.
The phase problem constitutes the primary bottleneck in protein structure determination via X-ray crystallography. When X-rays scatter from a protein crystal, the detector records only the intensities of the diffracted waves, which provide the amplitudes of the structure factors (denoted as |Fₕₖₗ|), but fails to capture their phase relationships (denoted as αₕₖₗ) [15] [16]. This measurement incompleteness arises because X-ray frequencies (~10¹⁸ Hz) are too high for direct phase measurement [17]. Since both amplitude and phase are required to compute an electron density map through Fourier synthesis, this loss of phase information creates a fundamental reconstruction challenge [18] [19].
The critical importance of phases stems from their dominant role in defining structural features. As illustrated in Figure 1, phases carry substantially more structural information than amplitudes alone [16]. When electron density is calculated using correct phases, the atomic structure emerges clearly, whereas incorrect phases produce unrecognizable or misleading density. This sensitivity underlies why an estimated ~40% of crystallography projects encounter significant phasing difficulties, particularly for novel proteins lacking homologous structures [17]. Solving the phase problem is thus a prerequisite for obtaining accurate atomic models that enable rational drug design, enzyme mechanism elucidation, and understanding of biological function at the molecular level.
Theoretical Framework
Mathematical Foundation
The electron density ρ(xyz) at any point within the crystal unit cell is calculated through the Fourier transform:
$$ρ(xyz) = \frac{1}{V} \sum{h} \sum{k} \sum{l} |F{hkl}| e^{iα_{hkl}} e^{-2πi(hx+ky+lz)}$$
where V is the unit cell volume, |Fₕₖₗ| represents the structure factor amplitude, and αₕₖₗ is the phase angle for each reflection index hkl [16]. The measured intensity Iₕₖₗ in the diffraction pattern is proportional to the square of the amplitude (|Fₕₖₗ|²), enabling straightforward amplitude derivation but leaving the phase term undetermined.
The Patterson function provides an alternative representation that does not require phase information:
$$P(uvw) = \frac{1}{V} \sum{h} \sum{k} \sum{l} |F{hkl}|^2 e^{-2πi(hu+kv+lw)}$$
This function, computable directly from diffraction intensities, generates a map of interatomic vectors within the crystal [20]. While Patterson maps contain all necessary information for structure solution, their interpretation is challenging for proteins due to the high number of overlapping peaks (approximately n² for n atoms) [20].
Historical Context and Significance
The phase problem has been intrinsically linked to crystallography since the field's inception. The pioneering work of Perutz, Kendrew, Blow, and Crick developed early solutions through isomorphous replacement, enabling the first protein structures to be determined [16]. Over decades, crystallography has produced over 200,000 deposited structures in the Protein Data Bank, with nearly 10,000 added annually [13] [18], each requiring some solution to the phase problem. Despite technical advances, phasing remains the crucial step that transforms diffraction data into biological insight, particularly for structure-based drug design where accurate atomic positions determine binding site characterization and ligand optimization strategies.
Methodologies for Solving the Phase Problem
Molecular Replacement
Molecular replacement (MR) leverages prior structural knowledge to generate initial phase estimates. When a structurally similar model is available (typically >25% sequence identity and <2.0 Å Cα root-mean-square deviation) [16], its coordinates can be positioned within the unknown crystal's unit cell to calculate theoretical structure factors, including phases.
The MR workflow, depicted in Figure 2, involves two sequential searches:
- Rotation function: The model is rotated to match the orientation of molecules in the target crystal, typically analyzed using Patterson correlation methods [16].
- Translation function: The correctly oriented model is translated to its proper position within the unit cell by examining vectors between symmetry-related molecules [16].
Recent advances have significantly expanded MR applicability through machine learning-predicted models from AlphaFold and RoseTTAFold, which can provide adequate search models even without experimental structures of homologs [17]. However, MR remains ineffective for low-homology proteins or highly flexible regions where model inaccuracies introduce phase bias.
Figure 2: Molecular replacement workflow utilizing known structural information.
Experimental Phasing Methods
Experimental phasing techniques derive phase information empirically by introducing heavy atoms into protein crystals and measuring their differential scattering effects. These methods remain essential for de novo structure determination.
Anomalous Scattering
Anomalous scattering exploits the wavelength-dependent absorption and re-emission of X-rays by specific elements, causing phase shifts that enable phase determination [21] [15]. Key implementations include:
- Single-wavelength anomalous diffraction (SAD): Uses a single X-ray wavelength to measure anomalous differences from incorporated heavy atoms [16].
- Multi-wavelength anomalous diffraction (MAD): Collects data at multiple wavelengths near the absorption edge of anomalous scatterers to optimize phasing power [15].
Selenium-methionine (Se-Met) labeling has become the dominant anomalous scattering approach, contributing to over 70% of de novo structures in the PDB [17]. By biosynthetically incorporating selenium into methionine residues, proteins generate sufficient anomalous signal without requiring additional heavy-atom soaking.
Isomorphous Replacement
Multiple isomorphous replacement (MIR) involves creating heavy-atom derivatives by soaking native crystals in solutions containing electron-dense atoms (e.g., mercury, platinum, or uranium compounds) [16]. The key requirement is isomorphism - the protein structure and crystal packing must remain unchanged aside from the added heavy atoms. By comparing diffraction intensities between native and derivative crystals, the heavy-atom positions can be determined and used to derive phase information [21] [16].
Table 1: Comparison of Major Experimental Phasing Methods
| Method | Key Requirement | Typical Atoms Used | Primary Application | Key Advantage |
|---|---|---|---|---|
| SAD | Anomalous scatterers | Se (met), S, Hg, Pt | De novo phasing | Single dataset sufficient |
| MAD | Tunable X-ray source | Se, lanthanides | De novo phasing | Enhanced phasing power |
| MIR | Isomorphous derivatives | Hg, Pt, U, Au | De novo phasing | No special equipment |
| SIRAS | Isomorphous derivative + anomalous signal | Hg, Pt | De novo phasing | Combines MIR & anomalous |
Direct Methods and Density Modification
For small molecules diffracting to atomic resolution (<1.2 Å), direct methods can resolve phases using probabilistic relationships between structure factor amplitudes [15] [16]. These methods apply positivity and atomicity constraints (atoms as discrete scatterers) to establish phase relationships through the tangent formula:
$$\tan(αh) = \frac{\sum{h'} |E{h'}E{h-h'}| \sin(α{h'}+α{h-h'})}{\sum{h'} |E{h'}E{h-h'}| \cos(α{h'}+α_{h-h'})}$$
where E represents normalized structure factors [16]. While rarely applicable to macromolecules due to resolution limitations, direct methods are routinely used to locate heavy atoms in experimental phasing [16].
Density modification techniques improve initial phases by incorporating prior knowledge about electron density distributions:
- Solvent flattening: Exploits the uniform electron density of disordered solvent regions [15] [16]
- Histogram matching: Adjusts density statistics to match expected distributions [15]
- Non-crystallographic symmetry averaging: Applies known molecular symmetry constraints [15]
These approaches are particularly powerful in combination with experimental phasing, often enabling structure solution from marginal initial phase information.
Experimental Protocols
Selenomethionine SAD Phasing
Protocol Objective: Obtain experimental phases for a novel protein structure using selenomethionine incorporation and single-wavelength anomalous diffraction.
Materials and Reagents:
- Expression System: Methionine auxotroph E. coli strain or mammalian expression system
- Selenomethionine: L-selenomethionine for metabolic labeling
- Crystallization Reagents: Sparse-matrix screening kits optimized for the target protein
- Cryoprotectants: Glycerol, ethylene glycol, or other cryoprotective solutions
Procedure:
- Protein Expression and Purification:
- Grow expression host in minimal media supplemented with L-selenomethionine (50-100 mg/L)
- Induce protein expression at optimal temperature for soluble folding
- Purify using affinity chromatography followed by size exclusion chromatography
- Verify selenium incorporation by mass spectrometry
Crystallization:
- Concentrate Se-Met protein to 5-20 mg/mL
- Screen crystallization conditions using vapor diffusion methods
- Optimize crystal growth for size (>50 μm) and morphology
Data Collection:
- Flash-cool crystal in liquid nitrogen with appropriate cryoprotectant
- Collect single-wavelength dataset at the selenium absorption peak (~12.66 keV)
- Collect high-completeness dataset with redundant measurements for accurate anomalous signal
- Ensure maximum resolution better than 3.0 Å for interpretable maps
Structure Solution:
- Process data to obtain intensities and anomalous differences
- Locate selenium positions using direct methods (SHELXD or HySS)
- Calculate experimental phases and perform density modification
- Build atomic model into improved electron density
Technical Considerations: Radiation damage is a significant concern at synchrotron sources. Collect inverse-beam data or use multiple crystals to minimize decay. For membrane proteins, consider lipidic cubic phase crystallization with Se-Met labeling [17].
Molecular Replacement with Predicted Models
Protocol Objective: Solve protein structure using AlphaFold-predicted models as molecular replacement search models.
Materials and Software:
- AlphaFold Model: Predicted structure from AlphaFold Protein Structure Database or custom prediction
- MR Software: Phaser, Molrep, or MR-Rosetta
- Model Preparation Tools: CHAINSAW or Sculptor for model editing
Procedure:
- Model Preparation:
- Download or generate AlphaFold model for target protein
- Remove low-confidence regions (pLDDT < 70)
- Split multi-domain proteins into individual domains if necessary
- Convert model to search format compatible with MR software
Molecular Replacement:
- Perform rotation function search with trimmed model
- Execute translation function with top rotation solutions
- Assess solutions by log-likelihood gain and translation function Z-scores
- Combine multiple domains if protein contains distinct folded regions
Phase Improvement:
- Calculate initial phases from positioned model
- Apply automated model building (ARP/wARP or Buccaneer)
- Iteratively refine model against experimental data
- Validate final model geometry and fit to electron density
Technical Considerations: AlphaFold models may contain topological errors in challenging regions. Use composite omit maps to validate areas with potential model bias and consider manual rebuilding for discrepant regions.
Table 2: Essential Research Reagents and Solutions for Crystallographic Phasing
| Reagent/Solution | Function | Application Context |
|---|---|---|
| L-selenomethionine | Anomalous scatterer | SAD/MAD phasing |
| Heavy-atom compounds (HgAc₂, K₂PtCl₄, UO₂Ac₂) | Isomorphous replacement | MIR/SIRAS phasing |
| Crystallization screens (sparse-matrix) | Crystal formation | Initial crystal growth |
| Cryoprotectants (glycerol, ethylene glycol) | Crystal preservation | Cryo-crystallography |
| Lipidic cubic phase materials | Membrane protein stabilization | Membrane protein crystallography |
Emerging Approaches and Future Directions
Machine Learning and Deep Learning
Recent advances in deep learning have demonstrated potential for directly solving the phase problem. Convolutional neural networks can predict electron density maps from Patterson maps, effectively learning the transformation between autocorrelation and density functions [20]. Specific architectures include:
- CrysFormer: Uses Patterson maps and attention mechanisms to infer atomic coordinates directly from diffraction data [17]
- 3D convolutional networks: Process Patterson maps to output electron density estimates, trained on known structures from the PDB [20]
These approaches represent a paradigm shift from traditional phasing, potentially enabling direct structure solution without heavy atoms or homologous models. Current limitations include resolution dependencies and training dataset requirements, but rapid progress suggests increasing applicability to challenging phasing problems.
XFEL and Serial Crystallography
X-ray free-electron lasers (XFELs) enable serial femtosecond crystallography using the "diffraction-before-destruction" principle [13]. By collecting diffraction from microcrystals before radiation damage occurs, XFELs expand the range of phasing possibilities:
- De novo phasing from native sulfur-SAD: Enhanced anomalous signal from native sulfurs due to reduced radiation damage [13]
- Time-resolved phasing: Tracking structural changes during biochemical reactions [13]
- Reduced sample consumption: Modern sample delivery methods require as little as 450 ng of protein for complete datasets [13]
The integration of XFEL capabilities with traditional phasing methods continues to expand the boundaries of soluble and membrane protein structure determination.
Figure 3: Relationship between major phasing methodologies and their applications.
Solving the phase problem remains the pivotal step in transforming X-ray diffraction data into biologically meaningful protein structures. While traditional methods like molecular replacement and experimental phasing continue to evolve with improved algorithms and instrumentation, emerging approaches leveraging machine learning and XFEL technology promise to expand the frontiers of structural biology. The choice of phasing strategy depends critically on available resources, protein characteristics, and project goals. For researchers engaged in drug development and functional studies, understanding these methodologies enables informed experimental design and maximizes the likelihood of successful structure determination. As structural biology continues to integrate hybrid approaches and computational advances, the phase problem—while still central—becomes increasingly tractable for ever more challenging biological systems.
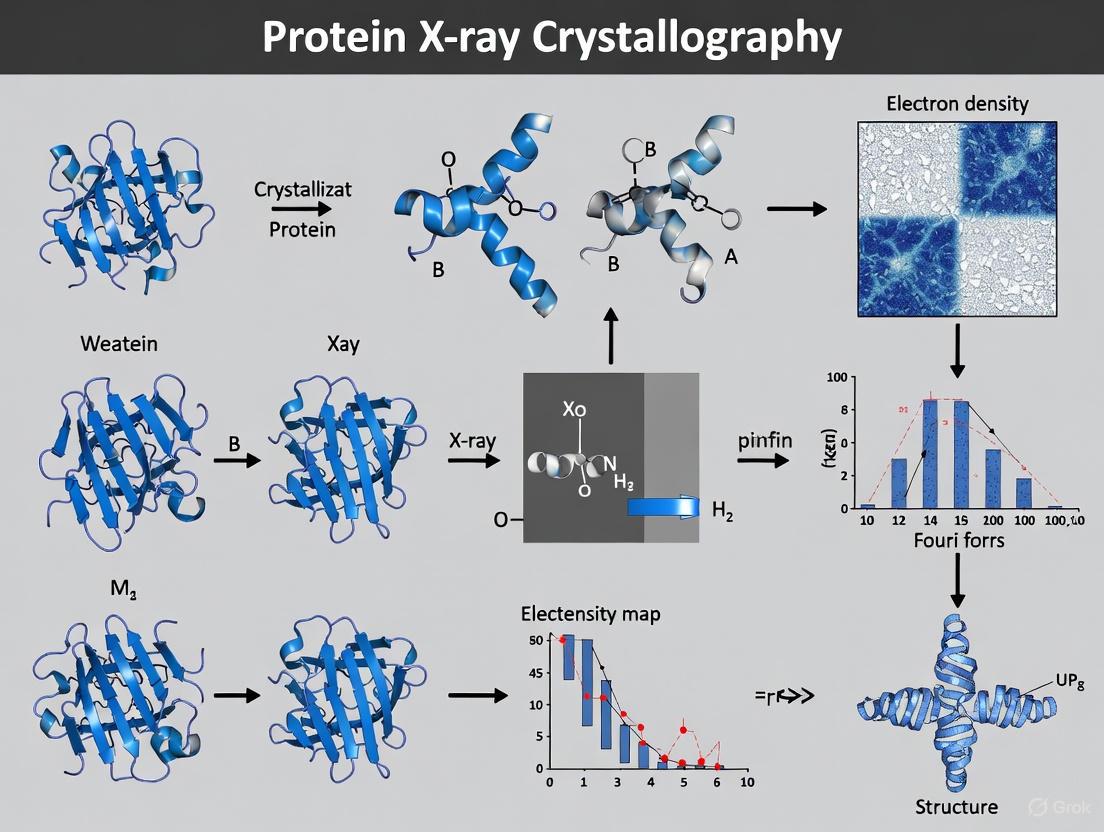
Within the framework of basic principles of protein X-ray crystallography research, the process of transforming experimental X-ray diffraction data into an accurate atomic model represents a critical pathway to understanding biological function at the molecular level. This technique has been foundational, enabling high-resolution structural determination of a plethora of biomolecules and playing a key role in areas such as structure-based drug design and the elucidation of enzyme mechanisms [13] [19]. The core aim of X-ray crystallography is to obtain a three-dimensional molecular structure from a crystal by analyzing the diffraction patterns produced when a crystal is exposed to an X-ray beam [19]. The journey from data to model hinges on solving the phase problem, a fundamental challenge that must be overcome to calculate electron density maps and ultimately build the atomic structure of the protein under investigation. This guide details the technical workflow, from the initial diffraction data to the refined structural model, providing a comprehensive resource for researchers and drug development professionals.
The Experimental Foundation: Data Collection
The process begins with the growth of a high-quality protein crystal. A purified sample at high concentration is crystallised, often using vapour diffusion methods, and the resulting crystals must be of a sufficient size (typically a minimum of 0.1 mm) to diffract effectively [19]. Serial crystallography (SX), which uses microcrystals, has revolutionized the field by enabling studies of previously intractable targets, though it requires specialized sample delivery methods such as fixed-targets or liquid injection to manage significant sample consumption [13].
During data collection, the crystal is mounted in an X-ray beam, either from a laboratory source or a much more intense synchrotron, and rotated to capture diffraction from all possible crystal lattice planes [19]. The primary output is a set of diffraction images, where the positions of the spots indicate the geometry of the crystal lattice, and their intensities are the key data used for structure determination [19]. A critical quality metric is the resolution of the data, which determines the level of atomic detail visible; a resolution of 3 Å or better is generally required to distinguish amino acid side chains [19].
Table 1: Key Data Collection Parameters and Their Impact on Structure Determination
| Parameter | Description | Typical Requirements/Impact |
|---|---|---|
| Resolution | The finest level of detail observable in the data. | ≤ 3 Å to resolve side chains; ≤ 1.5 Å for atomic detail. |
| Unit Cell | The fundamental repeating unit of the crystal. | Determined from spot spacing; defines crystal system. |
| Space Group | The symmetry of the crystal lattice. | Determined from spot symmetry; 65 possible groups for proteins. |
| Completeness | The fraction of possible diffraction data collected. | Should be >95% for a robust dataset. |
| Redundancy (Multiplicity) | The average number of times each unique reflection is measured. | Higher redundancy improves data quality and statistical accuracy. |
The Core Computational Challenge: The Phase Problem
Once the intensities of the diffraction spots are measured and processed, they are used to calculate the structure factor amplitudes (|F|). Each structure factor has both an amplitude and a phase, and together they are used to compute the electron density map of the crystal via a Fourier transform [19]. The central challenge, known as the "phase problem," is that while the amplitudes can be directly measured from the spot intensities, the phase information is lost in the experiment. Since accurate phases are essential for producing an interpretable electron density map, several computational and experimental methods have been developed to recover them.
Methods for Solving the Phase Problem
- Molecular Replacement (MR): This is the most common method when a structurally similar model is already available. The known model is oriented and positioned within the unit cell of the unknown structure, and its calculated phases provide an initial estimate to start the process [19].
- Experimental Phasing: For novel structures with no known homolog, experimental methods are required. These include:
- Isomorphous Replacement: Involves binding heavy atoms (e.g., mercury, platinum) to the protein without disturbing the crystal lattice. The differences in diffraction intensity between native and derivative crystals allow for phasing.
- Anomalous Dispersion: Utilizes the anomalous scattering signal from atoms like selenium (incorporated via selenomethionine) or heavy metals when using X-rays of a specific wavelength. This method is particularly powerful and is the basis for Single-wavelength Anomalous Dispersion (SAD) or Multi-wavelength Anomalous Dispersion (MAD) phasing.
The following workflow diagram illustrates the pathway from a protein sample to an initial electron density map, highlighting the critical phasing step.
From Electron Density to Atomic Model
Calculating and Interpreting the Electron Density Map
With both structure factor amplitudes and estimated phases in hand, the three-dimensional electron density map, ρ(xyz), is calculated using the following fundamental equation of crystallography:
ρ(xyz) = 1/V Σh Σk Σl |F(hkl)| eiφ(hkl) e-2πi(hx+ky+lz)
Where:
- ρ(xyz) is the electron density at point (x,y,z) in the unit cell.
- V is the volume of the unit cell.
- |F(hkl)| is the structure factor amplitude for reflection hkl.
- φ(hkl) is the phase for reflection hkl.
- The triple summation is over all measured reflections (h,k,l) [19].
The quality of this initial map is often improved through a process of density modification, which uses prior chemical knowledge (e.g., that density should be flat in the solvent region) to refine the phases and yield a clearer, more interpretable map.
Model Building and Refinement
The improved electron density map is used as a guide to build the atomic model. Researchers use software to fit the known protein sequence into the electron density, placing atoms for the main chain and side chains. This initial model is then refined against the original diffraction data in an iterative cycle.
Refinement is the process of adjusting the atomic model (atomic coordinates and atomic displacement parameters) to best fit the observed diffraction data (|Fobs|) while respecting known stereochemical constraints. The fit is quantified by R-factors (R and Rfree). Modern approaches within quantum crystallography, such as Hirshfeld Atom Refinement (HAR), are now becoming more accessible. These methods use more physically realistic non-spherical atoms, allowing for extremely accurate structure determination, including hydrogen atom positions, with the same precision as neutron diffraction [22].
Table 2: Key Software and Algorithms in Structure Solution
| Software/Algorithm | Primary Function | Technical Application |
|---|---|---|
| HAR (Hirshfeld Atom Refinement) | Quantum crystallographic refinement. | Determines accurate hydrogen atom positions and anisotropic displacement parameters using aspherical atoms [22]. |
| XD | Multipole model refinement. | Used for experimental charge-density determination via multipole modelling [22]. |
| XCW (X-ray Constrained Wavefunction) Fitting | Quantum crystallographic refinement. | Fits a wavefunction to the X-ray diffraction data to derive electron densities and chemical bonding information [22]. |
| Diffusion Generative Modeling | AI-powered structure solution. | Machine learning technique that augments low-information nanocrystal diffraction data to solve previously intractable structures [23]. |
The following diagram summarizes the iterative process of model building and refinement, leading to the final deposited structure.
The Scientist's Toolkit: Essential Research Reagents and Materials
The following table details key reagents, materials, and software solutions essential for conducting protein X-ray crystallography experiments.
Table 3: Essential Research Reagents and Solutions for Protein Crystallography
| Item | Function / Purpose | Technical Context |
|---|---|---|
| Crystal Screen Kits | Sparse matrix screens for initial crystallization condition screening. | Commercial solutions covering a wide range of precipitants, buffers, pH, and salts to identify initial crystallization hits [19]. |
| Cryoprotectants | Protect crystals from ice formation during flash-cooling. | Solutions like glycerol or ethylene glycol are used to cryoprotect crystals before flash-freezing in liquid N₂ for data collection at 100 K [19]. |
| Heavy Atom Derivatives | reagents for experimental phasing. | Compounds containing atoms like Hg, Pt, Au, or Lu used for isomorphous replacement or anomalous dispersion phasing (e.g., K₂PtCl₄, EMTS) [19]. |
| Selenomethionine | Anomalous scatterer for phasing. | Used in metabolic labeling of proteins to incorporate Se atoms for SAD/MAD phasing without altering protein structure. |
| Lithium Chloride (LiChroprep) | Purification and homogenization. | Used in column chromatography for final purification and homogenization of the protein sample prior to crystallization [24]. |
| HAR & XD Software | Software for advanced quantum crystallographic refinement. | Enable accurate refinement of hydrogen positions and experimental electron density analysis beyond the independent atom model [22]. |
From Theory to Therapy: Methodological Workflow and Drug Discovery Applications
Within the broader principles of protein X-ray crystallography research, the technique stands as a foundational pillar for understanding the three-dimensional structure of biological macromolecules. This method is responsible for determining approximately 85-90% of the structures deposited in the Protein Data Bank (PDB), making it the most dominant technique in structural biology [25] [26]. The power of X-ray crystallography lies in its ability to provide an atomic-resolution model, which is indispensable for inferring protein function, understanding enzyme mechanisms, guiding site-directed mutagenesis, and facilitating structure-based drug design [19] [26]. This guide details the comprehensive, multi-step workflow required to transition from a heterogeneous protein sample to a refined, validated atomic model, a process that is often described as both a science and an art [18].
The Protein Crystallography Workflow
The journey to a refined protein structure is a linear and sequential process, where the success of each stage is a prerequisite for the next. The entire pipeline can be visualized as a series of interdependent steps, from gene to final model.
The following diagram maps the entire pathway from protein purification to a refined model, highlighting the key stages and their relationships.
Step 1: Protein Production and Purification
The initial and crucial stage of the workflow is obtaining a pure, homogeneous, and stable sample of the protein of interest. The quality of the final structural model is fundamentally constrained by the quality of the protein sample at this stage.
Protein Purification Metrics and Targets
A successful purification must meet specific quantitative and qualitative benchmarks, summarized in the table below.
Table 1: Key Benchmarks for Protein Purification prior to Crystallization
| Parameter | Ideal Target | Importance for Crystallization |
|---|---|---|
| Purity | >95% (ideally >99%) [25] | Impurities disrupt the ordered lattice formation necessary for crystal growth [25]. |
| Concentration | 5 - 50 mg/mL (often 10-20 mg/mL) [3] [18] | A high concentration is required to achieve supersaturation, the driving force for crystallization. |
| Homogeneity | Monodisperse in solution [25] | Ensures all molecules are chemically and conformationally identical, allowing for a regular crystal lattice. |
| Stability | Maintains folded state and monodispersity over time. | The protein must remain intact and non-aggregated during the often slow crystallization process. |
Detailed Purification Protocol
The standard approach involves a combination of chromatographic techniques to achieve the required homogeneity.
- Protein Production: The gene encoding the protein is cloned into an expression plasmid, which is then used to transform a host system like Escherichia coli. Protein expression is induced, and cells are lysed to release the contents [18].
- Affinity Chromatography: This is typically the first purification step. The target protein is engineered with a specific tag (e.g., His-tag). As the cell lysate passes over a chromatography column with immobilized metal ions or other binding partners, the tagged protein binds specifically, while impurities are washed away. The pure protein is then eluted [25].
- Further Purification (Polishing): To achieve the high purity required, one or more additional steps are often necessary:
- Ion-Exchange Chromatography: Separates proteins based on their surface charge [25].
- Size-Exclusion Chromatography (SEC): Separates proteins according to their size and hydrodynamic radius. SEC is also a key analytical method for confirming the monodispersity and oligomeric state of the purified sample [25].
- Concentration and Buffer Exchange: The purified protein is concentrated using centrifugal filters and exchanged into a suitable, non-crystallizing buffer for the next stage. The final concentration is determined by measuring absorbance at 280 nm using the protein's extinction coefficient [3].
Step 2: Protein Crystallization
Crystallization is widely considered the major bottleneck in protein crystallography [3] [19]. The objective is to bring the protein solution to a state of supersaturation slowly and controllably, prompting the molecules to come out of solution and form a highly ordered, three-dimensional crystal lattice rather than an amorphous precipitate [3] [19].
The Crystallization Phase Diagram
Understanding the phase diagram is key to navigating the crystallization process, as it guides the selection of conditions to reach the nucleation zone.
Detailed Crystallization Protocols
The most common method for initial screening is vapor diffusion, which can be set up in two configurations.
Hanging Drop Vapor Diffusion [3]:
- A reservoir well is filled with 500 μL of a precipitant solution.
- A silicone grease ring is applied around the rim of the well.
- A cover slide is cleaned, and a drop (typically 1-2 μL) of the concentrated protein solution is mixed with an equal volume of the precipitant solution on the slide.
- The cover slide is carefully flipped and sealed over the reservoir, creating a closed chamber.
- The drop is initially at a lower concentration than the reservoir. Water vapor diffuses from the drop to the reservoir over hours to days, slowly concentrating both the protein and the precipitant in the drop until equilibrium is reached. This slow concentration increase ideally guides the solution into the nucleation zone of the phase diagram.
Sitting Drop Vapor Diffusion: The principle is identical, but the protein-precipitant mixture is dispensed onto a small shelf or post, and the well is sealed with transparent tape instead of a cover slide [3].
Microbatch Crystallization under Oil: An alternative method where 1 μL of protein solution is directly mixed with 1 μL of precipitant solution under a layer of paraffin oil. The oil prevents evaporation of the drop, and crystallization occurs without vapor diffusion [3].
Common Precipitants and Screening
Initial screening uses commercially available "sparse matrix" screens, which contain 96 different conditions that sample a wide range of precipitants, salts, buffers, and pH values [19]. The most common precipitants are polyethylene glycol (PEG) of various molecular weights and ammonium sulfate, which together account for about 60% of successful crystallization conditions [3].
Step 3: Crystal Harvesting and Data Collection
Once a crystal of adequate size (typically > 0.1 mm in the longest dimension) has grown, it must be prepared for X-ray exposure [19].
Crystal Harvesting and Cryocooling Protocol
- Cryoprotection: Protein crystals are typically ~50% solvent by volume and are highly sensitive to radiation damage. To mitigate this, crystals are cryocooled to ~100 K in a stream of liquid nitrogen. The crystal is first transferred for a few seconds into a solution identical to its mother liquor but with an added cryoprotectant (e.g., 20-25% glycerol or ethylene glycol) to prevent the formation of destructive ice crystals upon freezing [19].
- Mounting: The cryoprotected crystal is fished from the drop using a small nylon or plastic loop. The loop, with the crystal suspended in a thin film of solution, is then rapidly vitrified by plunging it into liquid nitrogen [19].
- X-ray Source and Detector: The frozen crystal is placed on a goniometer, which allows for precise rotation in the X-ray beam. Data can be collected using an in-house laboratory source (e.g., rotating anode) or, more commonly for high-quality data, at a synchrotron facility, which provides extremely intense, tunable X-rays [19] [27]. The diffracted X-rays are recorded on detectors such as hybrid photon-counting (HPC) detectors [27].
Step 4: Data Processing, Phasing, and Model Building
This stage transitions from experimental work to computational analysis, transforming the raw diffraction images into an atomic model.
Data Processing and Reduction Protocol
- Indexing and Integration: The series of diffraction images (see figure below) is processed by specialized software (e.g., XDS, DIALS, HKL-2000). The software indexes the pattern to determine the crystal's unit cell dimensions (a, b, c, α, β, γ) and space group. It then integrates the images to measure the intensity of each reflected X-ray beam (reflection) [19] [27].
- Data Quality Assessment: The integrated data are scaled and merged to produce a final set of structure factors. Key metrics for assessing data quality are summarized in the table below.
Table 2: Key Metrics for Assessing X-ray Diffraction Data Quality
| Metric | Ideal Target | Interpretation |
|---|---|---|
| Resolution | As high as possible (e.g., <2.0 Å) | The minimum interplanar spacing (d) resolved. Higher resolution (lower number) allows for clearer atomic detail. A carbon-carbon bond is ~1.5 Å [19]. |
| Completeness | >95% (>99% for low resolution) | The fraction of possible reflections that were actually measured [27]. |
| Rmerge / Rmerge | <10% (lower is better) | A measure of the agreement between multiple measurements of the same reflection. Critical for assessing the signal-to-noise ratio [27]. |
| I/σ(I) | >2.0 (at high resolution) | The average intensity of a reflection divided by its uncertainty. A measure of the signal-to-noise ratio. |
| Multiplicity | As high as feasible (e.g., 3-10) | The average number of times each unique reflection was measured. High redundancy improves the accuracy of the final merged intensity [27]. |
The Phase Problem and Molecular Replacement Protocol
The measured intensities give the amplitude of the structure factor, but the phase information is lost in the diffraction experiment. This is known as the "phase problem." The most common method to solve it is Molecular Replacement (MR) [25].
- Search Model Preparation: A previously solved structure of a homologous protein is used as a search model. This model is often modified to match the target sequence as closely as possible.
- Rotation and Translation Functions: Computational algorithms perform a six-dimensional search to find the correct orientation (rotation function) and position (translation function) of the search model within the unit cell of the target crystal.
- Phasing: Once correctly placed, the search model provides an initial set of phases. These phases are combined with the experimental amplitudes to calculate an initial electron density map [25].
Model Building, Refinement, and Validation Protocol
- Model Building: The initial electron density map is often of poor quality. Using programs like Coot, the researcher fits the amino acid sequence of the target protein into the electron density, correcting the model to match the data [28].
- Refinement: The atomic model is iteratively improved against the diffraction data using refinement programs (e.g., REFMAC, phenix.refine). This is a cyclic process of adjusting atomic coordinates and temperature factors (B-factors) to minimize the difference between the observed data (Fobs) and the data calculated from the model (Fcalc). The progress is tracked by the R-work and R-free factors. R-free is calculated using a small subset of reflections not used in refinement and is a crucial indicator of model quality and lack of overfitting [27].
- Validation: The final model is rigorously checked for geometric and stereochemical correctness (e.g., using MolProbity). This includes analyzing bond lengths, angles, rotamer outliers, and Ramachandran plot outliers to ensure the model is both chemically reasonable and fits the experimental data [26].
The Scientist's Toolkit: Essential Research Reagents and Materials
A successful crystallography project relies on a suite of specialized reagents, equipment, and software.
Table 3: Essential Toolkit for Protein Crystallography
| Category | Item / Technique | Function / Purpose |
|---|---|---|
| Purification | Affinity Chromatography (e.g., His-tag) | Primary capture and purification step [25]. |
| Ion-Exchange Chromatography | Polishing step; separates by charge [25]. | |
| Size-Exclusion Chromatography (SEC) | Polishing step; separates by size; assesses monodispersity [25]. | |
| Crystallization | Sparse Matrix Screens (e.g., from Hampton Research) | Initial condition screening using incomplete factorial design [3] [19]. |
| 24-well Hanging/Sitting Drop Trays | Plates for setting up vapor diffusion experiments [3]. | |
| Liquid Handling Robot (e.g., Mosquito) | Automates dispensing of nanoliter-volume crystallization drops for high-throughput screening [29] [28]. | |
| Data Collection | Synchrotron Beamline | Intense X-ray source for high-quality, rapid data collection [25] [27]. |
| Cryostream (Liquid N2) | Maintains crystal at ~100 K to minimize radiation damage [19]. | |
| CCD or Hybrid Photon-Counting (HPC) Detector | Records diffraction images with high sensitivity and speed [19] [27]. | |
| Software | CCP4 Suite | Comprehensive collection of programs for data processing, phasing, refinement, and analysis [28]. |
| Phenix | Software platform for automated structure determination [28]. | |
| Coot | Interactive tool for model building, rebuilding, and validation [28]. | |
| PyMOL | Molecular graphics system for visualization and figure generation [28]. |
Identifying and Validating Drug Targets through 3D Structure
The process of drug discovery has been revolutionized by the ability to visualize biological macromolecules at atomic resolution. Among the techniques available for structure determination, X-ray crystallography has been the most prolific, providing approximately 85% of all protein structures in the Protein Data Bank (PDB) [26] [30]. This guide details how the three-dimensional structures of potential drug targets, determined primarily through X-ray crystallography, are identified and validated in modern drug development pipelines. The foundational principle is that knowing the precise atomic arrangement of a target protein enables researchers to understand its function and design molecules that can modulate that function with high specificity [31].
The critical importance of this approach stems from its direct impact on understanding disease mechanisms and therapeutic intervention. By analyzing crystal structures of protein-ligand complexes, researchers can study specific interactions between a drug candidate and its target at the atomic level, enabling rational design and optimization of therapeutic compounds [31]. This structural perspective is particularly valuable for tackling increasingly challenging targets such as G-protein coupled receptors, ion channels, and other macromolecules with complex mechanisms [13] [32].
Fundamental Principles of Protein X-Ray Crystallography
Protein X-ray crystallography relies on several key principles that enable the determination of atomic structures. When a crystal is exposed to an X-ray beam, the regular arrangement of molecules within the crystal diffracts the X-rays, producing a characteristic pattern of spots [33] [30]. The fundamental relationship governing this diffraction is Bragg's Law: (nλ = 2d sinθ), where (λ) is the wavelength of the X-rays, (d) is the spacing between atomic planes in the crystal, (θ) is the angle of incidence, and (n) is an integer [33]. This relationship allows researchers to calculate the dimensions of the unit cell from the diffraction pattern.
The intensity of these diffraction spots is measured and used to calculate an electron density map, which is then interpreted to build an atomic model of the protein [30]. However, a major challenge in this process is the "phase problem" – while the intensities of the diffraction spots can be measured directly, the phase information is lost during data collection. This missing information must be determined through specialized methods such as molecular replacement or experimental techniques like multi-wavelength anomalous dispersion to reconstruct the electron density map [30].
The entire process, from protein purification to structure determination, requires highly specialized equipment and reagents. The table below summarizes key components of the modern crystallographer's toolkit.
Table 1: Essential Research Reagents and Tools for Protein Crystallography
| Tool Category | Specific Examples | Function in Research |
|---|---|---|
| Instrumentation | X-ray Diffractometers, Microfluidic Systems, Incubators & Temperature Control Devices [34] | Generate X-rays, control crystal growth conditions, and maintain crystal stability during data collection |
| Consumables | Crystallization Reagents, Microplates, Screens & Buffers, Cryoprotectants [34] | Create optimized chemical environments for protein crystallization and crystal cryopreservation |
| Software & Services | Crystallography Data Analysis Software, AI-Based Structure Prediction Tools, Custom Crystallization Services [34] | Process diffraction data, build atomic models, predict crystallization conditions, and provide expert services |
Recent advances in serial crystallography have transformed the field, particularly for studying reaction mechanisms. This approach uses microcrystals and either synchrotron or X-ray free-electron laser (XFEL) sources to collect data from thousands of crystals, enabling studies of previously inaccessible targets [13]. The method of serial femtosecond crystallography (SFX) at XFELs utilizes the "diffraction before destruction" concept, where ultra-bright femtosecond X-ray pulses capture diffraction patterns before the sample is destroyed, opening new possibilities for time-resolved studies [13] [30].
Experimental Workflow for Structure Determination
The journey from a potential drug target to a validated three-dimensional structure follows a multi-step experimental pathway, with each stage being critical to the success of the overall process.
Sample Preparation and Crystallization
The initial and often most challenging phase involves producing high-quality protein samples suitable for crystallization. This begins with protein purification to obtain homogeneous, stable protein solutions [26]. The purified protein is then subjected to crystallization trials, where thousands of chemical conditions are screened to identify those that promote the formation of well-ordered crystals [26] [30]. This process has been significantly accelerated through automation and high-throughput approaches, which are now supported by specialized companies and core facilities [34].
Data Collection and Processing
Once suitable crystals are obtained, they are exposed to intense X-ray beams at synchrotron facilities. The rotation method is most commonly employed, where the crystal is continuously rotated while being exposed to X-rays, and diffraction images are captured on area detectors [35]. The resulting diffraction patterns are then processed through specialized software packages such as Mosflm, HKL-2000, XDS, or DIALS [35]. Key steps in processing include autoindexing to determine crystal orientation and unit cell parameters, integration to measure spot intensities, and scaling to put all measurements on a common scale [35].
Structure Solution and Refinement
The processed diffraction data are used to solve the crystal structure through molecular replacement (if a related structure exists) or experimental phasing methods (for novel folds) [30]. An initial atomic model is built into the experimental electron density map and undergoes iterative cycles of refinement to improve the agreement between the model and the experimental data [30]. The final refined model represents the atomic structure of the protein, which is then deposited in the public Protein Data Bank for the scientific community to access [30].
Analytical Methods for Structure-Based Drug Discovery
Once a high-quality structure is obtained, it becomes a powerful tool for drug discovery through various analytical approaches.
Binding Site Identification and Analysis
The first analytical step typically involves identifying and characterizing potential binding sites on the protein surface. Ligand-binding pockets are often located in concave surface regions and can be identified through computational analysis of surface geometry and physicochemical properties. Critical analysis includes assessing the druggability of these sites – evaluating whether a binding pocket possesses the necessary properties to bind drug-like molecules with high affinity and specificity [31].
Structure-Based Drug Design
With a characterized binding site, researchers can employ several structure-based strategies for drug design. Molecular docking computationally screens small molecules for their predicted binding affinity and orientation within the target site. Structure-activity relationship (SAR) analysis uses structures of multiple ligand complexes to understand how chemical modifications affect binding, guiding iterative compound optimization [31]. Additionally, de novo drug design builds novel chemical entities directly within the constraints of the binding pocket.
Advanced Applications: Time-Resolved Studies
Beyond static structures, advanced techniques like time-resolved crystallography can capture proteins in action, providing unprecedented insights into functional mechanisms. A notable example is Electric-field stimulated time-resolved X-ray crystallography (EFX), which has been used to visualize ion conduction through potassium channels in real-time [32]. Such "molecular movies" offer direct observation of dynamic processes that are fundamental to protein function, enabling more sophisticated drug design strategies that target specific conformational states [32].
Structure Validation and Quality Assessment
Before a protein structure can be confidently used for drug discovery applications, it must undergo rigorous validation to assess its reliability. The quality assessment should be factored into any structural analysis, as it indicates which parts of the 3D structure are determined with high confidence and which parts should not be relied upon [36].
Table 2: Key Validation Metrics for X-ray Crystallography Structures
| Quality Measure | Description | Interpretation Guidelines |
|---|---|---|
| Resolution | Measure of detail visible in the experimental data; lower values indicate better resolution [36] | <1.5 Å: Very high quality; 1.5-2.5 Å: High quality; 2.5-3.5 Å: Medium quality; >3.5 Å: Low quality [36] |
| R-factor & R-free | R-factor measures agreement between model and experimental data; R-free is calculated against a subset of data not used in refinement [36] | Lower values indicate better agreement (typically 0.15-0.25); Large difference between R-factor and R-free may indicate over-fitting [36] |
| Real Space Correlation Coefficient (RSCC) | Measures how well atomic coordinates match experimental electron density for each residue [36] | Values close to 1.0 indicate excellent fit; Residues with RSCC in lowest 1% should not be trusted [36] |
| Ramachandran Plot | Assesses the stereochemical quality of protein backbone torsion angles [36] | High-quality structures have >98% of residues in favored and allowed regions [36] |
Validation reports are available for all structures in the PDB, generated according to recommendations from expert Validation Task Forces [36]. These reports provide an executive summary image of key quality indicators to help non-experts assess structure reliability [36]. Particular attention should be paid to regions of the structure that will interact with potential drug compounds, ensuring that the electron density support and geometric quality are sufficient for informed drug design decisions.
Future Directions and Emerging Technologies
The field of structure-based drug discovery continues to evolve rapidly, with several emerging technologies poised to enhance its impact. Serial crystallography methods are addressing the challenge of sample consumption, with recent approaches reducing protein requirements from grams to micrograms, making previously intractable targets accessible [13]. The convergence of artificial intelligence with structural biology is creating new opportunities, as demonstrated by AlphaFold2 and RoseTTAFold for protein structure prediction [36] [37]. These computational advances are particularly valuable for studying disordered proteins and characterizing conformational ensembles that represent significant challenges for traditional structural methods [37].
The market for protein crystallization reflects these technological shifts, with projections showing growth from $1.62 billion in 2024 to $2.8 billion by 2029, driven by rising demand for protein-based drug development and advancements in protein-ligand interaction research [34]. This growth is accompanied by increased integration of AI-based structure prediction tools and automated crystallization platforms, further accelerating the structure determination pipeline [34].
The future of structural biology in drug discovery will likely involve increased integration of computational and experimental approaches, creating a virtuous cycle where computational predictions inform experimental design and experimental results refine computational models [32]. This synergy promises to expand the scope of drug discovery to more challenging targets and enable the development of more precise and effective therapeutics.
Structure-Based Drug Design (SBDD) represents a cornerstone of modern rational drug discovery, enabling researchers to design molecules for specific protein targets by leveraging detailed atomic-level insights. This approach fundamentally relies on the knowledge of the three-dimensional structure of a biological target, typically obtained through techniques such as X-ray crystallography and cryo-electron microscopy (cryo-EM). The primary advantage of SBDD lies in its ability to visualize the precise interactions between a drug candidate and its target, moving drug discovery from a largely empirical process to a rational, structure-guided endeavor [38]. Within the broader context of protein X-ray crystallography research, SBDD serves as a critical application that translates static structural snapshots into dynamic drug development pipelines, ultimately guiding the optimization of lead compounds to improve their potency, selectivity, and pharmacokinetic properties [39].
The iterative process of SBDD fits seamlessly within a larger drug discovery program. It begins with the identification of a target structure, often from public databases like the Protein Data Bank (PDB), and proceeds through cycles of virtual screening, hit identification, and lead optimization [38]. In the lead optimization phase, which is a primary focus of this whitepaper, initial hit compounds with moderate affinity (e.g., IC50 in the 10–100 µM range) are systematically refined into leads with high affinity (IC50 = 10–100 nM) and improved drug-like properties [38]. This refinement is guided by atomic-level structural data, which reveals how modifications to the chemical structure of a lead compound will affect its binding interactions and overall efficacy.
Core Principles of SBDD in Lead Optimization
From Structural Data to Binding Interactions
The foundation of lead optimization in SBDD is the detailed analysis of the non-covalent interactions between a lead compound and its target binding pocket. These interactions include:
- Hydrogen bonding with key amino acid residues.
- Hydrophobic interactions with non-polar regions.
- Electrostatic and van der Waals forces.
- π-π stacking with aromatic residues [38] [40].
Understanding these interactions allows medicinal chemists to make informed decisions. For example, adding a specific functional group to form a new hydrogen bond can enhance binding affinity, while modifying a hydrophobic moiety might improve selectivity by avoiding off-target interactions. The complementarity between the ligand and the protein pocket—often described in terms of surface complementarity and the stability of the bound conformation—is a critical determinant of success [38].
The Critical Role of X-ray Crystallography
Protein X-ray crystallography provides the experimental backbone for SBDD. It enables the determination of target structures, often at resolutions sufficient to identify individual atoms and water molecules within the binding site. Recent advancements, such as serial crystallography (SX) conducted at synchrotrons and X-ray free-electron lasers (XFELs), are pushing the boundaries of what is possible. These techniques allow the study of smaller microcrystals and can even capture protein dynamics through time-resolved studies, providing "molecular movies" of proteins in action [13] [32].
For lead optimization, the structure of the initial hit bound to the target (a co-crystal structure) is particularly valuable. It validates the predicted binding mode and highlights which interactions are most critical to maintain or improve. As one review notes, visualizing the hit molecule in complex with the target allows researchers to assess the "goodness of fit, formation of key hydrogen bonds or hydrophobic interactions, [and] surface complementarity" [38]. This structural information directly informs the design of analog compounds for subsequent optimization cycles.
Computational Methodologies and Workflows
The SBDD process is underpinned by a suite of computational methodologies that facilitate the identification and optimization of lead compounds.
The SBDD Workflow
The following diagram illustrates the core, iterative workflow of Structure-Based Drug Design, from target preparation to lead candidate identification:
Key Software and Tools for SBDD
A variety of docking and scoring software packages are available, each with unique strengths regarding flexibility handling, scoring algorithms, and computational efficiency [38].
Table 1: Key Software Tools for Structure-Based Drug Design
| Software | Key Features | Applicability in Lead Optimization |
|---|---|---|
| DOCK 6 [38] | Docks small molecules, includes solvent effects, uses incremental construction. | Useful for initial virtual screening and analyzing binding poses. |
| AutoDock [38] | Uses an interaction grid and simulated annealing; available free of charge. | Good for modeling ligand flexibility and estimating binding energies. |
| GOLD [38] | Uses genetic algorithms; allows partial protein flexibility. | Effective for modeling induced-fit effects during binding. |
| Glide [38] | Performs exhaustive conformational, orientational, and positional search. | High-accuracy docking for ranking potential leads. |
| CMD-GEN [41] | AI-based framework using coarse-grained pharmacophore points and diffusion models. | Generates novel, drug-like molecules tailored to a pocket; excels in selective inhibitor design. |
| CIDD Framework [40] | Combines 3D-SBDD models with Large Language Models (LLMs) to refine molecules. | Enhances drug-likeness and reasonability of AI-generated candidates post-docking. |
The Emergence of AI in Molecular Generation
Traditional SBDD often relies on screening existing compound libraries. A paradigm shift is underway with the advent of deep generative models, which can design novel molecules directly within the constraints of a target binding pocket. Frameworks like CMD-GEN decompose this complex problem into a hierarchical process: first sampling coarse-grained pharmacophore points from the pocket, then generating the chemical structure, and finally aligning the conformation [41]. This approach bridges protein-ligand complexes with drug-like molecules more effectively.
However, advanced 3D-SBDD models can sometimes produce molecules with favorable docking scores but poor drug-like qualities, due to unrealistic substructures [40]. The Collaborative Intelligence Drug Design (CIDD) framework addresses this by integrating the structural precision of 3D-SBDD models with the extensive chemical knowledge of Large Language Models (LLMs). The LLM-powered modules analyze interactions, propose modifications to enhance drug-likeness, and reflect on prior designs, leading to a significant improvement in the success ratio for generating viable drug candidates [40].
Experimental Protocols in Structural Biology
Sample Preparation and Data Collection for X-ray Crystallography
The quality of structural data is paramount for successful SBDD. The following protocol outlines the key steps for obtaining a protein-ligand complex structure.
Protocol: Determining a Protein-Ligand Complex Structure via X-ray Crystallography
Protein Purification and Crystallization:
- Purify the target protein to homogeneity using standard techniques (e.g., affinity chromatography, size-exclusion chromatography).
- Crystallize the protein using vapor diffusion or microbatch methods under pre-optimized conditions. For ligand soaking, crystals are typically grown first.
- Soaking or Co-crystallization: Introduce the lead compound by either:
Crystal Harvesting and Cryo-cooling:
- For data collection at synchrotrons, crystals are usually cryo-cooled with liquid nitrogen to minimize radiation damage.
- Use a cryoprotectant solution (e.g., glycerol, ethylene glycol) before flash-cooling [13].
X-ray Data Collection:
- Mount the crystal on a goniometer in the path of an X-ray beam.
- At a synchrotron beamline, collect a complete dataset by rotating the crystal and recording diffraction images.
- Serial Crystallography (SX) Alternative: For small or difficult-to-crystallize proteins, SX methods can be used. This involves flowing a stream of microcrystals (in a liquid jet or on a fixed target) across the beam and collecting diffraction from each crystal as it passes [13].
Data Processing, Structure Solution, and Refinement:
- Index, integrate, and scale the diffraction data using software like XDS, DIALS, or HKL-2000.
- Solve the phase problem (e.g., by molecular replacement using a known homologous structure).
- Iteratively refine the atomic model of the protein-ligand complex against the diffraction data using programs like Phenix or Refmac. The ligand structure and parameters are incorporated during this stage [38] [42].
Advanced Time-Resolved Techniques
Beyond static structures, techniques like time-resolved serial femtosecond crystallography (TR-SFX) at XFELs and electric-field stimulated XRD (EFX) at synchrotrons are enabling researchers to capture structural changes in real-time. These "molecular movies" provide unprecedented insights into reaction mechanisms, such as light-induced changes in photoreceptors or ion conduction through channels, which can inform the design of drugs that target specific functional states [32] [43].
Practical Applications and Case Studies
Selective Inhibitor Design
A major challenge in drug discovery is designing inhibitors that selectively target one protein over closely related family members to minimize side effects. The CMD-GEN framework has demonstrated success in this area. In a case study on PARP1 and PARP2, key targets in cancer therapy, the model was used to generate selective inhibitors. The framework's ability to sample and match pharmacophore point clouds specific to each target's binding pocket allowed for the design of molecules that preferentially bind to one over the other. This was followed by wet-lab validation, confirming the model's potential for tackling specialized design challenges [41].
Integrating Complementary Biophysical Techniques
While X-ray crystallography provides atomic-level structural details, it often yields a time- and space-averaged structure. Combining crystallography with other techniques provides a more holistic view of drug-target interactions. For instance, studying metallodrug/protein interactions often involves:
- Mass Spectrometry (ESI-MS): To identify the stoichiometry of metal-containing fragments bound to the protein and characterize binding in solution, complementing the crystallographic data [14].
- Computational Methods (MD, DFT): To model the dynamics of the interaction and calculate electronic properties, helping to rationalize ambiguous crystallographic data [14].
This multi-technique approach is crucial for understanding the reactivity, fate, and stability of metal/protein adducts, which is vital for developing new therapeutic strategies based on metallodrugs [14].
The Scientist's Toolkit: Essential Research Reagents and Materials
The execution of SBDD and associated structural biology research relies on a suite of specialized reagents, instruments, and software.
Table 2: Key Research Reagent Solutions for SBDD and Structural Biology
| Category / Item | Specific Examples | Function / Application |
|---|---|---|
| Commercial Compound Libraries | ZINC Database [38] | Source of commercially available compounds for virtual screening. |
| Crystallization Instruments | mosquito Xtal3, dragonfly [42] | Automated liquid handling robots for setting up nanoliter-volume crystallization trials with high reproducibility. |
| Synchrotron Data Collection | BioCARS at Advanced Photon Source [32] | Provides access to high-intensity X-ray beams for collecting high-resolution diffraction data. |
| Crystallography Consumables | Crystallization plates, screens & buffers, cryoprotectants [34] | Essential materials for conducting and optimizing protein crystallization experiments. |
| Crystallography Software & Services | Cryo-EM structure determination, custom crystallization services [42], Crystallography data analysis software (e.g., Phenix, CCP4) [34] | Specialized services and software for solving and analyzing structural data. |
| AI-Based Structure Prediction | CMD-GEN [41], CIDD Framework [40], AlphaFold2 | AI tools for generating novel drug candidates or predicting protein structures to inform docking. |
Market and Future Perspectives
The protein crystallization market, a key enabler of SBDD, is projected to grow significantly from $1.62 billion in 2024 to $2.8 billion by 2029 (a CAGR of 11.5%) [34]. This growth is driven by the rising demand for protein-based drug development and chronic disease treatments. Key trends shaping the future of SBDD include:
- Integration of AI and Automation: The use of AI-based structure prediction tools and automated crystallization platforms is increasing efficiency [34].
- Reduction in Sample Consumption: Advances in serial crystallography and microfluidic sample delivery have reduced the amount of protein required for a full dataset from grams to micrograms, enabling the study of more challenging biological targets [13].
- Focus on Dynamics: Techniques like time-resolved crystallography are shifting the paradigm from static snapshots to dynamic observations, which will be integrated with computational models to enhance protein engineering and drug design [32].
Fragment-Based Drug Discovery (FBDD) has established itself as a powerful and complementary approach to traditional high-throughput screening (HTS) in modern drug development pipelines. Unlike HTS, which screens large libraries of drug-like molecules, FBDD involves screening smaller, less complex molecular fragments that exhibit low affinity but highly efficient binding to protein targets [44]. These fragments, despite their weak binding characteristics (typically in the micromolar to millimolar range), display more 'atom-efficient' binding interactions than larger molecules and can serve as superior starting points for subsequent optimization campaigns [44]. This approach has proven particularly valuable for targeting challenging therapeutic areas, including protein-protein interactions and allosteric sites, which were long considered "undruggable" using conventional methods [44].
The fundamental premise of FBDD rests on the superior chemical space sampling efficiency of small fragment libraries. Since the number of possible molecules increases exponentially with molecular size, small fragment libraries comprising 1,000-2,000 compounds allow for proportionately greater coverage of chemical space compared with larger HTS libraries containing millions of larger molecules [44] [45]. This efficient sampling, combined with the fact that fragments are more likely to form optimal interactions without steric clashes, enables identification of quality starting points for drug discovery programs against even the most challenging targets [44]. The impact of FBDD is evidenced by the successful development of multiple FDA-approved drugs, including vemurafenib, venetoclax, erdafitinib, sotorasib, and asciminib, which have addressed previously intractable therapeutic targets [44] [45].
Protein X-Ray Crystallography: The Structural Foundation of FBDD
Fundamental Principles of Protein Crystallography
Protein X-ray crystallography provides the critical structural foundation that enables FBDD by visualizing atomic-level interactions between fragments and their protein targets. This technique allows researchers to determine the three-dimensional positions of each atom in a protein, providing invaluable insights for structure-based drug design [18]. The methodology begins with protein crystallization, which remains the primary bottleneck in structure determination. When suitable crystals are obtained, they are exposed to X-rays, and the resulting diffraction patterns are collected and processed to calculate electron density maps, into which atomic models are built and refined [46].
The physical basis for X-ray diffraction is described by Bragg's Law, formulated by William Lawrence Bragg and William Henry Bragg in 1913, which explains how X-rays interact with crystal lattices to produce diffraction patterns [47] [18]. This fundamental relationship is expressed mathematically as:
nλ = 2d sinθ
Where n is an integer representing the order of reflection, λ is the wavelength of the incident X-ray beam, d is the spacing between atomic planes in the crystal, and θ is the angle of incidence [47] [18]. When this condition is satisfied, X-rays scattered from different crystal planes interfere constructively, producing detectable diffraction spots that contain structural information about the molecule [47].
Resolution and Data Quality in Structural Determination
The resolution of X-ray data represents the primary experimental parameter determining the final quality of a protein structure [46]. Resolution depends on the number of diffraction spots collected during data acquisition, with more spots providing finer details in the calculated electron density map. The practical implications of resolution ranges include:
- Low resolution (5 Å and below): Only the overall protein shape is distinguishable; α-helices appear as rods, but detailed model building is not possible.
- Medium resolution (3.5-2.5 Å): Side chains become distinguishable, and water molecules can be built into the structure at better than 2.8 Å resolution.
- Atomic resolution (2.4 Å or better): The model-building process becomes straightforward, and numerous solvent molecules can be identified and positioned accurately [46].
For FBDD applications, high-resolution structures (typically better than 2.5 Å) are essential to precisely visualize the binding modes of small fragments and guide their optimization into more potent drug candidates [46].
FBDD Workflow and Methodologies
Fragment Library Design and Characteristics
The success of FBDD campaigns depends critically on the quality of the fragment library screened. Well-designed libraries maximize chemical diversity while maintaining appropriate physicochemical properties [44]. Traditional fragment library design has followed the "Rule of Three" (Ro3), a set of guidelines analogous to Lipinski's Rule of Five for drug-like molecules, though modern libraries often include compounds that strategically violate these rules [44].
Table 1: Fragment Library Design Guidelines - Rule of Three
| Property | Traditional Rule of Three | Modern Considerations |
|---|---|---|
| Molecular Weight | ≤ 300 Da | Often flexible, may exceed for specific targets |
| Hydrogen Bond Donors | ≤ 3 | Generally maintained |
| Hydrogen Bond Acceptors | ≤ 3 | Frequently violated |
| Calculated LogP | ≤ 3 | Generally maintained |
| Rotatable Bonds | ≤ 3 | Often considered |
| Polar Surface Area | ≤ 60 Ų | Often considered |
Contemporary fragment libraries have evolved beyond strict Ro3 compliance to address limitations in early libraries, which tended toward high planarity and potential solubility issues [44]. Current best practices in library design incorporate:
- Enhanced 3D character through increased fraction of sp³-hybridized carbon atoms
- Improved chemical diversity covering broader pharmacophore space
- Specialized fragments including covalent binders, natural product-derived fragments, and target-class focused sets
- Optimized physicochemical properties ensuring adequate solubility for screening at high concentrations [44]
Commercial fragment libraries are available from multiple vendors, though many research institutions develop bespoke collections supplemented with in-house synthesized compounds to access unique chemical space [44].
Fragment Screening and Hit Identification Technologies
Fragment screening requires specialized biophysical techniques capable of detecting the weak binding (typically in the μm–mm range) that characterizes fragment interactions [44] [45]. Unlike HTS, which primarily relies on biochemical assays, FBDD employs orthogonal biophysical methods to reliably identify and validate fragment hits.
Table 2: Key Fragment Screening Technologies in FBDD
| Technique | Detection Principle | Key Applications in FBDD | Key Considerations |
|---|---|---|---|
| X-ray Crystallography | Direct visualization of fragment binding in electron density | Structure-based identification of binding modes and optimization vectors | Requires high-quality crystals; provides atomic-resolution structural data |
| Nuclear Magnetic Resonance (NMR) | Chemical shift perturbations or signal attenuation upon binding | Detection of weak binding; mapping binding sites | Requires stable, soluble protein; various experiment types (protein-observed, ligand-observed) |
| Surface Plasmon Resonance (SPR) | Measurement of binding-induced changes in refractive index | Label-free determination of binding kinetics and affinity | Requires target immobilization; provides kinetic parameters (kₐ, kḍ) |
| Thermal Shift Assay (TSA) | Measurement of protein thermal stabilization upon ligand binding | High-throughput screening of fragment libraries | Lower information content; often used as primary screen |
| Microscale Thermophoresis (MST) | Tracking of fluorescence changes due to temperature-induced directed movement | Solution-based binding affinity measurements | Low sample consumption; applicable to diverse target classes |
| Isothermal Titration Calorimetry (ITC) | Measurement of heat changes upon binding | Full thermodynamic characterization of interactions | Higher sample requirements; provides ΔH, ΔS, and Kḍ |
The workflow typically employs a cascade approach, starting with higher-throughput methods like TSA or ligand-observed NMR as primary screens, followed by orthogonal validation using SPR or protein-observed NMR, with X-ray crystallography providing the critical structural insights for optimization [45].
Experimental Protocol: Fragment Screening via X-ray Crystallography
The following detailed methodology outlines a standard protocol for fragment screening using X-ray crystallography, which serves as a cornerstone technique in FBDD:
Protein Production and Crystallization:
- Protein Expression and Purification: The gene encoding the target protein is cloned into an appropriate expression vector and expressed in a suitable system (most commonly E. coli or insect cells). The protein is purified to high homogeneity (>95%) using affinity chromatography followed by size-exclusion chromatography [18].
- Crystallization: Concentrated protein solution (typically 5-20 mg/mL) is subjected to crystallization trials using the drop diffusion method. A microliter of protein solution is mixed with an equal volume of precipitant solution and equilibrated against a reservoir containing precipitant. Crystals form as the drop slowly equilibrates to the reservoir concentration, causing the protein to precipitate in an ordered lattice [18].
- Crystal Optimization: Initial crystallization hits are optimized through systematic variation of parameters including pH, precipitant concentration, temperature, and additives to obtain diffraction-quality crystals.
Fragment Soaking and Data Collection:
- Fragment Preparation: A library of fragments is prepared as concentrated solutions (typically 100-500 mM in DMSO) to enable screening at high concentrations despite weak affinities.
- Crystal Soaking: Native protein crystals are transferred to a stabilizing solution containing the fragment at high concentration (usually 1-10 mM) for a defined period (hours to days) to allow fragment binding.
- Cryoprotection and Flash-Cooling: Soaked crystals are transferred to a cryoprotectant solution (e.g., mother liquor supplemented with 20-25% glycerol) and flash-cooled in liquid nitrogen for data collection.
- X-ray Data Collection: Flash-cooled crystals are mounted on a diffractometer at a synchrotron source. A complete dataset is collected by rotating the crystal through a series of angles in the X-ray beam while recording diffraction patterns [46].
- Data Processing: Diffraction images are processed using specialized software to determine unit cell parameters, space group, and integrated intensities, followed by merging and scaling to produce a final dataset of structure factors.
Structure Solution and Analysis:
- Molecular Replacement: The structure is solved using molecular replacement with the apo protein structure as a search model.
- Electron Density Map Calculation: σA-weighted 2mFₒ-DFₒ and mFₒ-DFₒ difference Fourier maps are calculated to visualize bound fragments.
- Model Building and Refinement: Fragment molecules are built into unambiguous difference density and the structure is refined through iterative cycles of manual rebuilding and computational refinement.
- Hit Validation: Fragments making specific, well-ordered interactions with the target are identified as hits for further optimization.
Fragment to Lead Optimization Strategies
Once validated fragment hits are identified, several strategic approaches are employed to optimize them into lead compounds with improved potency and drug-like properties.
Fragment Growing
The most common optimization strategy, fragment growing involves systematically adding functional groups to the initial fragment to increase complementary interactions with the target protein [45]. Structure-based design is crucial for this approach, as X-ray crystallography provides the blueprint for identifying regions of the binding site that can accommodate additional substituents while maintaining favorable interactions. This strategy benefits from the efficient binding character of the initial fragment, with the goal of improving affinity without significant entropy loss.
Fragment Linking
When two fragments bind to adjacent pockets within the same binding site, fragment linking involves connecting them with an appropriate linker to create a single molecule with enhanced affinity [45]. The theoretical advantage of this approach is the potential for additive binding energies, though practical challenges include entropic penalties and conformational strain introduced by the linker. Successful implementation requires precise structural information to guide linker design and maintain optimal fragment positioning.
Fragment Merging
When screening reveals multiple overlapping fragments binding to the same site, fragment merging combines structural features from these hits into a single optimized compound [45]. This approach integrates the most favorable interactions from each fragment while eliminating redundant elements, potentially resulting in novel chemotypes with improved properties compared to any individual fragment.
FBDD Success Stories and Clinical Impact
The impact of FBDD is demonstrated by the growing list of approved drugs developed through this approach, particularly against targets previously considered undruggable [44] [45].
Table 3: FDA-Approved Drugs Developed via FBDD
| Drug Name | Primary Target | Therapeutic Area | Year Approved | Key Significance |
|---|---|---|---|---|
| Vemurafenib | BRAF V600E mutant | Oncology (Melanoma) | 2011 | First FBDD-derived drug; targets specific BRAF mutation |
| Pexidartinib | CSF-1R, KIT | Oncology (Tenosynovial Giant Cell Tumor) | 2015 | Demonstrates FBDD applicability to kinase targets |
| Venetoclax | BCL-2 | Oncology (CLL) | 2016 | First approved drug targeting BCL-2 protein-protein interaction |
| Erdafitinib | FGFR | Oncology (Urothelial Carcinoma) | 2019 | Targets fibroblast growth factor receptor family |
| Sotorasib | KRAS G12C mutant | Oncology (NSCLC) | 2021 | Breakthrough for previously "undruggable" KRAS oncogene |
| Asciminib | BCR-ABL1 | Oncology (CML) | 2021 | First allosteric BCR-ABL1 inhibitor; addresses resistance |
| Berotralstat | Plasma Kallikrein | Hereditary Angioedema | 2020 | Demonstrates FBDD applicability to serine proteases |
| Capivasertib | AKT kinase | Oncology (Breast Cancer) | 2023 | Highlights continued pipeline of FBDD-derived drugs |
These success stories highlight the particular strength of FBDD in addressing challenging target classes, with protein-protein interactions and mutant oncogenes representing notable areas of impact [44] [45]. The allosteric inhibitor asciminib exemplifies how FBDD can identify novel binding sites that enable targeting of proteins with historically difficult-to-drug active sites [44].
The Scientist's Toolkit: Essential Research Reagents and Materials
Successful implementation of FBDD requires specialized reagents, materials, and instrumentation. The following table details key resources essential for FBDD campaigns.
Table 4: Essential Research Reagents and Materials for FBDD
| Reagent/Material | Function/Application | Key Considerations |
|---|---|---|
| Fragment Libraries | Diverse collection of small molecules for screening | Typically 1,000-2,000 compounds; optimized for chemical diversity and physicochemical properties |
| Crystallization Screening Kits | Initial identification of protein crystallization conditions | Commercial screens available (e.g., Hampton Research, Molecular Dimensions) covering diverse chemical space |
| Cryoprotectants | Protect crystals during flash-cooling for data collection | Glycerol, ethylene glycol, sucrose, or various cryoprotectant cocktails |
| Crystal Mounting Tools | Manipulation of fragile protein crystals | Micro-loops, magnetic caps, and specialized tools for crystal handling |
| High-Purity Protein Expression Systems | Production of recombinant target protein | E. coli, insect cell, or mammalian expression systems with appropriate purification tags |
| Biophysical Screening Instrumentation | Detection of fragment binding | SPR, NMR, ITC, MST, or thermal shift instruments for binding assays |
| Synchrotron Access | High-intensity X-ray source for data collection | Essential for obtaining high-resolution diffraction data; beamtime allocated via proposal systems |
Integrated Workflow Visualization
The following diagram illustrates the integrated workflow for FBDD, highlighting the cyclical nature of screening and optimization that is central to this approach.
FBDD Workflow from Screening to Lead Compound
Emerging Trends and Future Directions
The FBDD field continues to evolve with several emerging trends shaping its future application. Covalent fragment libraries are gaining prominence, enabling targeting of non-catalytic cysteine residues and other nucleophilic amino acids [44] [48]. Advanced computational methods, including free energy perturbation calculations and machine learning approaches, are being integrated to prioritize fragments and predict optimization trajectories [44]. The application of FBDD is expanding beyond traditional soluble proteins to challenging target classes including membrane proteins, RNA targets, and molecular glues [48].
Technological advancements in structural biology are further empowering FBDD. Cryo-electron microscopy (cryo-EM) is increasingly applied to targets resistant to crystallization, while microcrystal electron diffraction and serial crystallography at X-ray free electron lasers are pushing the boundaries of structural resolution with smaller crystals [48]. These developments, combined with more sophisticated library design and screening technologies, ensure that FBDD will remain a cornerstone approach for addressing the most challenging targets in drug discovery.
The continued success of FBDD is reflected in market analyses, which project the fragment-based drug discovery market to grow from US$1.1 billion in 2024 to US$3.2 billion by 2035, representing a compound annual growth rate of 10.6% [48]. This growth underscores the increasing adoption of FBDD across academic institutions, biotech companies, and pharmaceutical organizations worldwide.
Overcoming Drug Resistance by Analyzing Mutant Protein Structures
The emergence of drug-resistant mutant proteins represents a critical challenge in treating diseases ranging from bacterial infections to cancers. Understanding the structural basis of this resistance is paramount for designing next-generation therapeutics. X-ray crystallography provides the atomic-resolution detail necessary to visualize how specific mutations alter drug-binding sites, protein dynamics, and molecular interactions. By comparing the three-dimensional structures of wild-type and mutant proteins, researchers can identify the precise steric, electrostatic, and conformational changes that undermine drug efficacy. This guide details the fundamental principles of protein X-ray crystallography and the advanced serial crystallography methodologies that are revolutionizing our ability to combat drug resistance. The integration of these structural insights with computational predictions enables a rational approach to drug design, ensuring that new compounds can overcome or bypass common resistance mechanisms.
Fundamental Principles of Protein X-Ray Crystallography
Protein X-ray crystallography is a powerful technique for determining the high-resolution, three-dimensional structures of biological molecules, enabling the visualization of proteins at the atomic level [49]. The core principle involves purifying the protein of interest, crystallizing it, and then exposing the crystal to an X-ray beam. The regular arrangement of molecules within the crystal causes the X-rays to diffract in a predictable pattern. By measuring the angles and intensities of these diffracted beams, one can calculate an electron density map through a mathematical process known as a Fourier transform. This map is then used to build and refine an atomic model of the protein [19] [49].
For studies on drug resistance, this technique is indispensable. It allows researchers to solve the structures of mutant proteins—such as a kinase with a mutated active site that no longer binds an inhibitor—and compare them directly to the wild-type structure. This comparison can reveal whether a mutation directly occludes the drug-binding pocket, induces allosteric changes, or alters the protein's conformational dynamics, each of which necessitates a different design strategy for future drugs.
Key Technical Concepts and Terminology
- Crystal Lattice and Unit Cell: A protein crystal is composed of a repeating, ordered array of molecules. The smallest repeating unit is the unit cell, the dimensions and symmetry of which determine the crystal system (e.g., monoclinic, orthorhombic) [19].
- Diffraction Pattern: When X-rays interact with the crystal, they produce a regular pattern of spots, known as reflections. The position of each spot provides information about the unit cell, while its intensity is related to the structure factor amplitude [49].
- The Phase Problem: A central challenge in crystallography is that the relative phases of the diffracted waves are lost during measurement, yet are required to compute the electron density map. This "phase problem" can be solved by methods such as molecular replacement (using a known similar structure as a starting model) or anomalous scattering (using heavy atoms incorporated into the crystal) [49].
- Resolution: This critical parameter, measured in Angstroms (Å), describes the level of detail visible in the final electron density map. Higher resolution (e.g., 1.5 Å) allows for the clear distinction of individual atoms, while lower resolution (e.g., 3.5 Å) may only show the path of the protein backbone. A resolution of approximately 3 Å is sufficient to identify the outlines of amino acid side chains [19].
Advanced Methodologies for Studying Protein Dynamics and Resistance
Traditional crystallography often provides static snapshots of protein structures. However, understanding drug resistance frequently requires insight into protein dynamics and the structural changes that occur during function. Time-resolved serial crystallography has emerged as a powerful method to capture these molecular movies [13] [32].
Serial Crystallography at XFELs and Synchrotrons
Serial crystallography (SX) involves rapidly flowing a stream of microcrystals across an X-ray beam, collecting a single diffraction pattern from each crystal before it is destroyed by the intense radiation [13]. This "diffraction-before-destruction" approach, pioneered at X-ray free-electron lasers (XFELs), is particularly useful for studying radiation-sensitive samples and for conducting time-resolved studies [13]. The method has since been adapted for use at modern synchrotrons, where it is known as serial millisecond crystallography (SMX) [13]. For resistance studies, SX enables the investigation of mutant proteins that may be difficult to grow into large, single crystals, as it relies on showers of microcrystals.
Time-Resolved Studies of Reaction Mechanisms
Time-resolved serial femtosecond crystallography (TR-SFX) can be used to visualize structural changes in proteins on timescales from femtoseconds to seconds [13]. Two primary methods are employed:
- Optical Pump-Probe: Used for light-activated proteins (e.g., photosensitive receptors), where a laser pulse initiates a reaction that is then probed by an X-ray pulse after a precisely controlled delay [13].
- Mix-and-Inject Serial Crystallography (MISC): This technique is ideal for studying enzyme-substrate interactions. Crystals are mixed with a substrate or inhibitor just before X-ray exposure, allowing researchers to trap and visualize short-lived intermediate states [13]. For mutant proteins, MISC can directly reveal how a mutation alters the pathway of catalysis or inhibitor binding, providing a mechanistic explanation for resistance.
A related technique, electric-field stimulated X-ray crystallography (EFX), has been used to study ion channels by applying an electric field to trigger conduction, successfully capturing the dynamics of a potassium channel in action [32]. This demonstrates the potential for studying conformational changes in membrane proteins, a class that includes many drug targets.
Sample Delivery Methods for Serial Crystallography
A critical aspect of SX is the efficient delivery of microcrystals to the X-ray beam. The choice of delivery method significantly impacts sample consumption, which is a major concern for precious macromolecular samples [13]. The main approaches are compared in the table below.
Table 1: Sample Delivery Methods in Serial Crystallography
| Method | Principle | Advantages | Limitations | Typical Sample Consumption |
|---|---|---|---|---|
| Liquid Injection | A slurry of crystals is jetted as a continuous liquid stream or droplets into the X-ray beam [13]. | High data collection rates; suitable for time-resolved mixing experiments [13]. | High sample waste, as most crystals never interact with an X-ray pulse [13]. | Early experiments required grams of protein; modern versions are more efficient [13]. |
| Fixed-Target | Crystals are deposited and immobilized on a solid, X-ray transparent chip, which is rastered through the beam [13]. | Minimal sample waste; crystals can be pre-screened; compatible with slow data collection [13]. | Lower data collection speed compared to high-speed jets; potential for background scattering from the chip [13]. | Highly efficient, requiring microgram amounts of protein [13]. |
| High-Viscosity Extrusion | Crystals are suspended in a viscous matrix (e.g., lipidic cubic phase) and extruded as a slow-moving stream [13]. | Redes flow rate and sample consumption; ideal for membrane proteins [13]. | Can be more challenging to handle and load than liquid samples [13]. | Significantly lower than traditional liquid jets [13]. |
The theoretical minimum sample consumption for a complete SX dataset is remarkably low. Assuming 10,000 indexed diffraction patterns are needed, and using microcrystals of 4 µm³ with a protein concentration of ~700 mg/mL, an ideal experiment could require as little as 450 ng of protein [13]. While practical challenges remain, this theoretical value highlights the potential for these methods to be applied to a wide range of biologically and medically relevant proteins, including those prone to drug resistance.
Experimental Protocols for Structural Analysis of Mutant Proteins
Protein Production, Purification, and Crystallization
The initial step involves obtaining a pure, homogeneous sample of the wild-type or mutant protein.
- Gene Cloning and Mutagenesis: The gene encoding the protein of interest is cloned into an appropriate expression vector. Site-directed mutagenesis is used to introduce the specific resistance mutation(s).
- Protein Expression and Purification: The vector is expressed in a host system (e.g., E. coli, insect cells). The protein is then purified using chromatographic techniques such as affinity, ion-exchange, and size-exclusion chromatography to achieve high purity and homogeneity [19].
- Crystallization: The purified protein is concentrated and subjected to crystallization trials. The most common method is vapor diffusion (hanging or sitting drop) [19] [49]. In this setup, a small drop containing the protein and a precipitant solution is equilibrated against a larger reservoir of precipitant. Water vapor diffuses from the drop to the reservoir, slowly increasing the concentration of both protein and precipitant, which can lead to the formation of ordered crystals. Initial conditions are typically screened using commercially available sparse matrix screens [19]. For mutant proteins, crystallization conditions may need to be re-optimized.
X-Ray Diffraction Data Collection
Once diffraction-quality crystals are obtained, they are prepared for data collection.
- Crystal Mounting: A single crystal is harvested and cryo-cooled in a stream of liquid nitrogen at ~100 K to mitigate radiation damage [19] [50]. The crystal is mounted on a goniometer, which allows for precise rotation in the X-ray beam [50].
- Alignment and Screening: The crystal is centered in the X-ray beam using a microscope and the goniometer controls. A test diffraction image is collected to assess crystal quality and diffraction resolution [50].
- Data Collection Strategy: The crystal is rotated through a series of angles while the detector records hundreds of diffraction images. The strategy is planned to ensure complete coverage of reciprocal space, with the required rotation range depending on the crystal's symmetry [19]. For a low-symmetry monoclinic crystal, data may need to be collected through 180° [19].
Table 2: Key Equipment for X-Ray Crystallography
| Equipment / Reagent | Function in the Experiment |
|---|---|
| Synchrotron X-ray Source | Provides an extremely intense, tunable X-ray beam for high-resolution data collection, especially for challenging samples [19]. |
| Cryostream Cooler (Cryojet) | Maintains the crystal at cryogenic temperatures (e.g., 100 K) during data collection to reduce radiation damage [50]. |
| Goniometer | A precision motor that holds the crystal and allows it to be rotated in the X-ray beam to all necessary orientations [50]. |
| CCD Detector or Imaging Plate | Measures the intensities and positions of the diffracted X-rays to form the diffraction pattern [19]. |
| Crystallization Screens | Pre-formulated solutions of various precipitants, salts, and buffers used to identify initial conditions for protein crystallization [19]. |
Data Processing, Model Building, and Refinement
The raw diffraction data must be processed to produce a structural model.
- Data Processing (Indexing, Integration, Scaling): The diffraction images are processed to determine the unit cell parameters and crystal symmetry (indexing), to measure the intensity of each reflection (integration), and to merge data from all images into a single dataset (scaling) [49]. The quality of the data is often reported as an R-factor (Rmerge), which measures the agreement between multiple measurements of the same reflection [49].
- Phasing and Electron Density Map Calculation: As noted in Section 2.1, the phase problem must be solved. For a mutant protein, molecular replacement is typically used, where a previously solved structure of the wild-type protein serves as a starting phasing model [49].
- Model Building and Refinement: An atomic model is built into the experimental electron density map. The initial model is then refined by adjusting atomic positions and other parameters to best fit the observed diffraction data. The quality of the final model is assessed by an R-factor and a free R-factor (Rfree), the latter calculated from a subset of reflections not used in refinement to prevent overfitting [49].
The following workflow diagram summarizes the entire process from gene to structure.
Integrating AI and Computational Predictions with Experimental Data
While AI-based protein structure prediction tools like AlphaFold have represented a breakthrough, they face inherent limitations in capturing the full dynamic reality of proteins, especially concerning conformational changes and the effects of mutations at functional sites [51]. These models are trained on experimentally determined structures from databases, which may not fully represent the thermodynamic environment governing protein conformation [51].
Therefore, the most powerful approach is a synergistic one. Computational predictions can provide excellent starting models for molecular replacement in crystallography. More importantly, when experimental structures of mutant proteins are solved, they can be used to validate and refine computational models of drug binding and resistance. This creates a virtuous cycle: experimental structures ground truth the computational models, and the improved models can then more accurately predict the structural impact of new, uncharacterized mutations, guiding which mutants to prioritize for experimental analysis.
The fight against drug resistance hinges on a deep, structural understanding of its mechanisms. Protein X-ray crystallography, particularly through the advanced methods of serial and time-resolved crystallography, provides the necessary toolkit to visualize resistance at the atomic level. By elucidating the precise structural alterations caused by mutations, researchers can move beyond static snapshots to dynamic molecular movies of protein function and dysfunction. This detailed knowledge, especially when integrated with and used to validate computational models, enables the rational design of drugs that are less susceptible to resistance—whether through tighter binding, the targeting of alternative sites, or the engagement of conformational states that mutations cannot easily disrupt. As these structural techniques continue to advance, becoming more efficient and accessible, they promise to accelerate the development of robust therapeutics that stay ahead of evolving pathogens and diseases.
Navigating Technical Challenges: Troubleshooting and Optimization Strategies
Protein X-ray crystallography is a cornerstone technique in structural biology, enabling researchers to visualize the three-dimensional arrangement of atoms within a biological macromolecule. This detailed structural information is crucial for understanding fundamental biological processes, elucidating enzyme mechanisms, and most importantly, facilitating structure-based drug design for therapeutic development [52] [53]. The process relies on analyzing the diffraction patterns generated when X-rays interact with a protein crystal's ordered lattice [13]. The quality and resolution of the final structural model are fundamentally limited by the size, order, and diffraction quality of the protein crystals used for data collection [53].
The journey to a solved protein structure begins lon g before X-ray exposure with the critical challenge of protein crystallization. This process involves transitioning purified protein molecules from a soluble state into a highly ordered, three-dimensional crystalline lattice. Despite technological advancements in X-ray sources (such as synchrotrons and X-ray free-electron lasers) and data collection methods, obtaining high-quality crystals remains a significant bottleneck that can delay research projects for months or even years [54]. This guide examines the principles, strategies, and recent advancements in protein crystal growth, providing researchers with a systematic framework to overcome this persistent hurdle in structural biology.
Fundamental Principles of Protein Crystallization
Protein crystallization differs significantly from small molecule crystallization due to the complex nature of biological macromolecules. Proteins are large, flexible molecules with heterogeneous surfaces, making the formation of a periodic lattice energetically challenging. The process occurs in a series of phases beginning with protein purification and culminating in crystal formation, each requiring careful optimization.
The Crystallization Process
Crystallization occurs when a protein solution becomes supersaturated, creating a thermodynamically favorable environment for molecules to organize into a crystal lattice rather than remaining in solution or precipitating in a disordered manner. The process navigates a narrow path between undersaturation (where crystals dissolve) and excessive supersaturation (which leads to amorphous precipitation). The objective is to achieve a metastable supersaturated state where nucleation and crystal growth can proceed in a controlled manner [53].
Several key variables influence this process:
- Protein Purity and Stability: Homogeneous, monodisperse protein samples with confirmed structural integrity are essential.
- Solution Conditions: Parameters including pH, temperature, ionic strength, and specific additives significantly impact crystallization.
- Precipitant Type and Concentration: Precipitants drive the solution toward supersaturation by excluding water from the protein's solvation shell.
- Protein Concentration: Optimal concentration balances sufficient material for crystal growth against the risk of promiscuous aggregation.
Crystallization Techniques
The vapor diffusion method, particularly in sitting-drop or hanging-drop formats, represents the most widely employed approach in high-throughput crystallization screens. In this system, a small droplet containing a mixture of protein and precipitant solutions is equilibrated against a larger reservoir containing a higher concentration of precipitant. As water vapor diffuses from the droplet to the reservoir, both protein and precipitant concentrations gradually increase, slowly driving the solution toward supersaturation and enabling controlled crystal nucleation and growth [53].
Key Challenges in Protein Crystal Growth
Despite established methodologies, numerous challenges persist in obtaining diffraction-quality crystals, particularly for complex biological targets such as membrane proteins, flexible enzymes, and large macromolecular complexes.
Sample Preparation Challenges
The initial hurdle begins with protein production and purification. Many biologically significant proteins, especially membrane proteins, are difficult to express in heterologous systems and often require optimization of expression constructs [55] [53]. These proteins may contain flexible regions that impede ordered crystal packing, and their extraction from native membranes frequently necessitates detergents or membrane mimetics that can interfere with crystal contacts [55]. Even with successful expression and purification, proteins must maintain structural homogeneity and conformational stability throughout the crystallization process, as microheterogeneity in sample preparation often manifests as crystallization failure or poor crystal quality.
Crystallization Optimization Challenges
The parameter space for crystallization conditions is astronomically large, encompassing countless combinations of precipitants, additives, pH values, and temperatures. Navigating this multidimensional optimization problem represents a significant practical challenge [53]. Furthermore, the physical processes of nucleation and crystal growth require separate optimization—conditions that promote abundant nucleation often generate numerous small crystals, while optimal crystal growth may require fewer nucleation sites to form larger, better-ordered specimens. Additionally, radiation damage during X-ray data collection remains a concern, though cryo-cooling techniques have significantly mitigated this issue [52].
Strategic Approaches for Growing High-Quality Crystals
Successful crystal growth requires a systematic approach that addresses both the biochemical properties of the target protein and the physical chemistry of the crystallization process.
Protein Engineering and Construct Design
A strategic approach to protein engineering can dramatically improve crystallization success. Researchers can design multiple genetic constructs targeting different domains or truncating flexible terminal regions, systematically identifying variants with enhanced crystallization propensity [53]. For challenging targets, introducing stabilizing mutations or engineering surface residues to enhance crystal contacts may improve lattice formation. Additionally, incorporating fusion partners such as T4 lysozyme or other highly soluble, crystallizable proteins can improve expression and provide rigid modules that facilitate crystal packing.
High-Throughput Screening and Optimization
Modern crystallization pipelines employ high-throughput technologies to efficiently explore crystallization condition space. Automated liquid handling systems can rapidly set up thousands of crystallization trials using nanoliter-scale droplets, conserving precious protein samples while maximizing the number of conditions tested [53]. These initiatives are supported by automated imaging systems that continuously monitor crystal growth, enabling timely identification of promising leads and intervention for optimization. The initial screening identifies "hits" or conditions that show some crystalline material, which then serve as starting points for systematic optimization through fine-tuning of parameters around the original hit condition.
Table 1: Key Parameters for Crystal Optimization
| Parameter Category | Specific Variables | Optimization Approach |
|---|---|---|
| Chemical Environment | Precipitant concentrationpHIonic strengthAdditives | Fine-gradient screens around initial hitsSystematic pH variation ±0.5 unitsAdjustment of salt concentrationsIncorporation of small molecules |
| Physical Conditions | TemperatureProtein:precipitant ratioDrop volume | Testing multiple temperatures (4°C, 20°C)Varying ratios in microseed matrix screeningScaling up from nano- to microliter volumes |
| Nucleation Control | Seeding typeNucleation density | Macro-, micro-, or matrix seedingDilution series for microseeding |
Advanced Seeding Techniques
Seeding strategies represent powerful approaches to control the nucleation process and improve crystal quality. These techniques introduce pre-formed crystalline material into new crystallization trials, bypassing the stochastic primary nucleation phase. Macroseeding involves transferring a single crystal between solutions to continue growth, while microseeding utilizes crushed crystal fragments to initiate growth in new droplets. Matrix screening combines seeding with systematic condition variation to identify optimal growth environments for specific crystal nuclei [53].
The following diagram illustrates the strategic workflow for optimizing high-quality protein crystals, integrating screening and advanced techniques:
Specialized Approaches for Challenging Proteins
Membrane proteins present unique challenges that require specialized approaches. Using lipidic cubic phase (LCP) crystallization creates a membrane-mimetic environment that maintains protein stability and can yield high-resolution structures [55]. For proteins prone to aggregation or conformational heterogeneity, incorporating ligands, antibodies, or binding partners can stabilize specific conformations and create new crystal contacts. When traditional crystallization fails, serial crystallography approaches at XFELs or synchrotrons can utilize microcrystal slurries, significantly reducing crystal size requirements [13].
The Scientist's Toolkit: Essential Research Reagents and Materials
Successful protein crystallization requires careful selection of reagents and materials throughout the process. The following table details key components of the protein crystallography toolkit:
Table 2: Essential Research Reagent Solutions for Protein Crystallization
| Reagent Category | Specific Examples | Function and Application |
|---|---|---|
| Precipitants | Polyethylene glycol (PEG) of various weightsAmmonium sulfate2-Methyl-2,4-pentanediol (MPD) | Exclude water from protein solvation shellDrive solution toward supersaturationDifferent types promote various crystal packings |
| Buffer Systems | HEPES, Tris, phosphate buffers across pH rangeBis-Tris propane, MES | Maintain precise pH controlOptimize protonation states of surface residues |
| Salts and Ions | Sodium chloride, magnesium chloride, lithium sulfateVarious divalent cations | Modulate ionic strength and electrostatic interactionsMay serve as cofactors for catalytic activity |
| Additives | Small molecules (alcohols, sugars)Detergents (for membrane proteins)Reducing agents (DTT, TCEP) | Fine-tune solution properties and crystal contactsMaintain solubility of hydrophobic proteinsPrevent oxidation of cysteine residues |
| Biological Modifiers | Ligands, substrates, inhibitorsMonoclonal antibody fragments | Stabilize specific conformational statesCreate new crystal contacts via fusion partners |
Quantitative Analysis of Crystal Quality and Sample Consumption
Evaluating crystallization success requires both qualitative assessment of crystal morphology and quantitative analysis of diffraction properties. Modern serial crystallography approaches have dramatically reduced sample requirements, making structural studies feasible for targets that only produce microcrystals.
Table 3: Sample Consumption Metrics in Serial Crystallography
| Method | Crystal Size Range | Typical Sample Consumption | Data Collection Requirements |
|---|---|---|---|
| Traditional Crystallography | >100 μm | Single crystal | Rotation series from one crystal |
| Synchrotron SMX | 5-50 μm | 1-10 mg | ~10,000 patterns from crystal slurry |
| XFEL SFX | 0.2-10 μm | 0.1-1 mg | ~10,000 patterns from liquid jet |
| Fixed-Target Approaches | 1-20 μm | <0.1 mg | Crystal raster scanning on chip |
The theoretical minimum sample requirement for a complete dataset is approximately 450 ng of protein, assuming 4×4×4 μm microcrystals at 700 mg/mL protein concentration and 10,000 indexed patterns [13]. This calculation provides researchers with a benchmark for evaluating the efficiency of their crystallization and data collection strategies. Recent advances in fixed-target sample delivery and high-viscosity extruders have progressively reduced sample consumption, making structural biology more accessible for challenging protein targets [13].
The field of protein crystallography continues to evolve with emerging technologies that address persistent challenges. The integration of artificial intelligence and machine learning approaches shows promise for predicting crystallization conditions and optimizing constructive design [56] [54]. Advanced light sources, particularly X-ray free-electron lasers (XFELs), enable data collection from increasingly smaller crystals through the "diffraction before destruction" approach [13]. Furthermore, the integration of computational structure prediction tools like AlphaFold provides powerful models for molecular replacement, potentially reducing the phase problem challenge in structure determination [52].
While growing high-quality protein crystals remains a significant hurdle in structural biology, the systematic application of the strategies outlined in this guide—from careful construct design through advanced seeding techniques—can dramatically improve success rates. As methods continue to advance, the integration of experimental and computational approaches promises to make high-resolution structure determination increasingly accessible, ultimately accelerating drug discovery and expanding our understanding of biological systems at the molecular level.
The determination of three-dimensional macromolecular structures is fundamental to understanding biological function and advancing drug discovery. A pivotal challenge in this field, particularly in X-ray crystallography, is the phase problem. In a crystallographic experiment, the diffraction pattern yields the amplitudes of the structure factors but loses their phases [57]. Since both amplitudes and phases are required to compute an electron density map and determine atomic positions via a Fourier transform, this loss constitutes the core of the phase problem: (\rho(xyz) = \frac{1}{V} \sum{h} \sum{k} \sum_{l} |F(hkl)| e^{i\phi(hkl)} e^{-2\pi i(hx + ky + lz)}), where (V) is the unit cell volume, (|F(hkl)|) are the measured amplitudes, and (\phi(hkl)) are the missing phases [57]. Overcoming this problem is a prerequisite for visualizing and modeling the atomic structure of biological macromolecules, from small proteins to large complexes like the ribosome [58] [59].
The field of structural biology was born from the struggle to solve this problem, with Max Perutz taking 22 years to determine the hemoglobin structure [59]. Today, while technological advances have dramatically accelerated the process, the phase problem remains a central focus of methodological development. This guide synthesizes the foundational experimental approaches with the latest computational and artificial intelligence (AI) strategies that are revolutionizing how we solve macromolecular structures, framing this progress within the basic principles of protein X-ray crystallography research [58] [52] [57].
Foundational Experimental Phasing Methods
Experimental phasing methods rely on introducing heavy atoms into the protein crystal to create measurable differences in diffraction intensities. These methods have been instrumental in determining ab initio structures for which no prior model exists.
Multiple/Single Anomalous Dispersion (MAD/SAD)
Multiple Anomalous Dispersion (MAD) and Single Anomalous Dispersion (SAD) exploit the anomalous scattering signal from specific incorporated atoms, such as selenium (via seleno-methionine), to calculate experimental phases [59]. The MAD method involves collecting diffraction data at multiple X-ray wavelengths around the absorption edge of the anomalous scatterer, while SAD requires data from only a single wavelength, simplifying the experiment [59]. The introduction of seleno-methionine labeling marked a significant improvement in phasing efficiency [52]. The anomalous signal enables the determination of the substructure of heavy atoms, whose phases can then be extended to the entire macromolecule.
Molecular Replacement (MR)
Molecular Replacement (MR) is currently the most prevalent method for solving the phase problem, applicable when a structurally similar model is available [59]. MR uses this known model to provide starting phases. The process involves orienting and positioning the search model within the unit cell of the unknown structure, followed by rigorous refinement and manual intervention to improve the model's fit to the experimental electron density map [59]. A significant challenge in MR is managing model bias, where the final model is overly influenced by the initial search model. Techniques such as solvent flattening and the use of non-crystallographic symmetry (NCS)—when multiple copies of the molecule exist in the asymmetric unit—can help minimize this bias and improve phase quality [59].
Table 1: Core Experimental Phasing Methods in Crystallography
| Method | Key Principle | Primary Requirement | Key Advantage | Common Challenge |
|---|---|---|---|---|
| Molecular Replacement (MR) | Uses phases from a known homologous structure [59] | A previously solved, similar protein structure | Fast and straightforward if a good model exists [59] | Model bias can propagate into the new structure [59] |
| MAD (Multiple Anomalous Dispersion) | Uses anomalous scattering at multiple wavelengths [59] | Incorporation of anomalous scatterers (e.g., Se-Met) | High accuracy from a single crystal | Requires tunable X-ray source (e.g., synchrotron) |
| SAD (Single Anomalous Dispersion) | Uses anomalous scattering at a single wavelength [59] | Incorporation of anomalous scatterers (e.g., Se-Met) | Simpler data collection than MAD; only one wavelength needed [59] | Phase ambiguity that must be resolved |
| MIR (Multiple Isomorphous Replacement) | Uses intensity changes from heavy-atom derivatives [59] | Soaking crystals with heavy-atom compounds (e.g., Hg, Pt) | Does not require a tunable X-ray source | Requires multiple isomorphous crystals; use of toxic metals [59] |
The following workflow outlines the pivotal decision points in selecting a primary phasing strategy, leading to the iterative process of model building, refinement, and validation that is central to modern crystallography.
The Scientist's Toolkit: Essential Reagents and Materials
Successful structure determination relies on a suite of specialized reagents and materials. The following table details key solutions used in modern crystallography, particularly for experimental phasing.
Table 2: Key Research Reagent Solutions for Crystallographic Phasing
| Reagent/Material | Function in Phasing | Application Protocol |
|---|---|---|
| Seleno-Methionine | Biosynthetically incorporated to provide anomalous scatterers for MAD/SAD phasing [59]. | Protein is expressed in methionine-deficient media supplemented with seleno-methionine; incorporated Se atoms provide a strong anomalous signal. |
| Heavy Atom Soaks | Used in MIR to create isomorphous derivatives by covalently binding to protein surfaces [59]. | Native crystals are briefly soaked in a cryo-protectant solution containing heavy-atom salts (e.g., mercury, platinum). |
| Halide Soaks (Quick-Soak) | Provides a rapid and less toxic alternative to traditional heavy atoms for experimental phasing [59]. | Crystals are briefly soaked in a solution containing high concentrations of bromide or iodide ions. |
| Lipidic Cubic Phase (LCP) | A membrane-like matrix for growing and stabilizing crystals of membrane proteins (e.g., GPCRs) [58]. | Protein and lipid are mixed to form a cubic phase; small crystals grow within this membrane-like environment. |
| Direct Electron Detectors | Critical cryo-EM hardware that enables high-resolution reconstruction by providing high signal-to-noise movies [58]. | Used during cryo-EM grid imaging; allows for motion correction and counting of individual electrons. |
The Rise of Computational and AI-Driven Approaches
Computational power has transformed crystallography, enabling sophisticated ab initio algorithms and, most recently, the integration of artificial intelligence.
Traditional Computational Algorithms
Modern ab initio phasing approaches operate by iteratively applying physical constraints in both direct (real) and reciprocal space. Algorithms like charge-flipping use trial phase sets to generate electron density maps, which are then modified to be physically plausible—for instance, by setting negative densities to positive values [57]. These dual-space methods are highly effective and, given sufficient computational resources, can solve a structure in seconds when atomic-resolution data is available [57]. They are implemented in widely used software packages such as SHELXT and SIR2014 [57].
The Machine Learning Revolution
The latest frontier in solving the phase problem involves machine learning (ML). A significant bottleneck for pure ML approaches is scalability; the number of reflections in a dataset grows with the cube of the unit cell dimensions, making training complex for large structures [57]. Furthermore, for general non-centrosymmetric crystals, phasing is a continuous regression problem (phases from 0 to 2π), which is more complex than the binary classification problem of centrosymmetric crystals [57].
A promising hybrid strategy, termed "phase seeding," has been proposed to bridge established methods and ML [57]. This approach does not require an ML algorithm to solve the entire phase problem. Instead, it needs to provide only a small subset (e.g., 10%) of the strongest reflections, with their phases correctly binned into a few broad angular regions (e.g., the quadrants 0, π/2, π, 3π/2) [57]. These approximate "phase seeds" can then be fed into traditional electron-density modification and phase-extension procedures to solve the structure efficiently, showing particular promise for larger, more complex crystals [57]. This method effectively transforms a challenging regression problem into a more tractable classification task for the ML model.
The relationship between data resolution, methodological approach, and the potential for AI integration is a critical consideration in planning a structure solution strategy, as visualized below.
Integrative Structural Biology and Future Perspectives
The field is moving toward integrative structural biology, which combines data from multiple techniques—such as X-ray crystallography, cryo-EM, NMR, and small-angle X-ray scattering (SAXS)—to build comprehensive models of complex and dynamic macromolecular assemblies [58] [52]. This is crucial for studying targets like membrane proteins and proteins with intrinsically disordered regions, which constitute 30%-40% of the eukaryotic proteome and are poorly represented by single, static crystal structures [52].
The success of AI systems like AlphaFold in predicting protein structures from sequence has created new opportunities [58] [52]. While these predicted models are not a direct solution to the crystallographic phase problem, they serve as excellent search models for Molecular Replacement, potentially streamlining the path to an experimental structure [58]. The ultimate goal is a seamless integration of predictive computational models with experimental data, paving the way for a deeper, more dynamic understanding of protein function and accelerating structure-based drug design for targets like viral proteases and GPCRs [58] [52].
Mitigating Radiation Damage in Data Collection
Radiation damage is a fundamental challenge in protein X-ray crystallography, inherent to the use of ionizing radiation for diffraction experiments. When X-rays interact with a crystalline sample, energy is deposited, leading to both global and specific damage that degrades data quality and can introduce biological misinterpretations [60]. This damage is particularly critical at modern, high-intensity X-ray sources like synchrotrons and X-ray free-electron lasers (XFELs), where even crystals held at cryogenic temperatures are not immune [13] [60]. Mitigating these effects is essential for obtaining robust, high-resolution structures, especially for biologically and medically relevant proteins where sample quantity is often limited [13]. This guide outlines the core principles, quantitative metrics, and practical strategies for managing radiation damage within the broader context of protein crystallography research.
Fundamental Principles and Quantification of Radiation Damage
Mechanisms and Symptoms of Damage
Radiation damage in macromolecular crystals manifests in two primary forms: global and specific damage [61] [60].
- Global Damage: This refers to the overall decay of diffraction quality. Observable symptoms include a loss of high-resolution reflection intensities, an increase in the unit-cell volume, and rising values for metrics like R-meas and atomic B-factors [60]. Global damage effectively limits the total useful data that can be collected from a single crystal.
- Specific Damage: This involves the discrete, radiation-induced breakdown of chemical bonds within the protein structure. Common manifestations include the disruption of disulfide bonds, the decarboxylation of glutamate and aspartate side chains, and the reduction of metal centers [60]. These specific changes can alter the electron density map, potentially leading to incorrect biological conclusions about the protein's functional structure.
The primary mechanism underlying this damage is the ionizing effect of X-rays, which generates secondary electrons and reactive radical species within the crystal. These products then propagate throughout the crystal lattice, breaking chemical bonds and disrupting order [60].
The Dose Concept and Experimental Lifespan
The fundamental metric for quantifying and predicting radiation damage is absorbed dose, measured in Grays (Gy, defined as J/kg) [61]. For protein crystals, doses are typically on the order of MegaGrays (MGy) [60]. The concept of "lifedose" – the total dose a crystal can endure before data quality becomes unacceptable – is a more useful measure than a simple timeline, as it is directly proportional to the incident X-ray fluence (photons µm⁻²) and largely independent of the beam's time structure [61].
A critical finding for cryo-cooled (∼100 K) crystals is that the global damage rate is remarkably consistent across different protein samples once normalized to dose [61]. This allows for general predictions of crystal lifetime. A commonly cited practical limit is that a crystal can tolerate an absorbed dose of approximately 30 MGy before significant specific damage manifests, and about 43 MGy before diffraction intensity halves at 2 Å resolution [61].
Table 1: Key Quantitative Metrics for Radiation Damage
| Metric | Typical Value/Calculation | Significance |
|---|---|---|
| Absorbed Dose | 1 MGy = 1 × 10⁶ J/kg | SI unit for energy absorbed per mass; the fundamental driver of radiation damage [61]. |
| Dose Ratio (k_dose) | ~2000 photons µm⁻² Gy⁻¹ (for 1 Å X-rays, metal-free crystal) | Converts incident fluence to absorbed dose; depends on X-ray wavelength and sample composition [61]. |
| Practical Dose Limit | ~30 MGy | Approximate dose before significant specific damage is observed in a cryo-cooled crystal [61]. |
| Theoretical Half-Dose | ~43 MGy | Dose at which diffraction intensity at 2 Å resolution is halved [61]. |
| Cryo-Cooling Benefit | Factor of ~70 increase in dose tolerance | Comparison of crystal lifetime at 100 K versus room temperature [60]. |
Core Mitigation Strategies and Methodologies
Cryo-Cooling
The most universally adopted strategy for mitigating radiation damage is cryo-cooling, where crystals are rapidly frozen and maintained at cryogenic temperatures (typically around 100 K) during data collection [60].
- Experimental Protocol: A standard protocol involves several key steps. First, a crystal is harvested and transferred into a cryoprotectant solution to prevent ice formation. It is then mounted on a nylon loop and flash-cooled by plunging into a cryogen, such as liquid nitrogen. Finally, the crystal is maintained at a stable cryogenic temperature in a stream of cooled nitrogen gas during X-ray exposure [60].
- Mechanism of Action: At cryogenic temperatures, the diffusion of radical species generated by X-ray irradiation is dramatically reduced. This limits the propagation of damage through the crystal lattice, thereby preserving diffraction quality for a much longer period [60].
- Advantages and Disadvantages: The primary advantage is the significant (∼70x) increase in crystal lifetime, enabling more complete data collection from a single crystal and reducing the total protein required for a project. Disadvantages include the potential for increased mosaic spread, the time required to optimize cryoprotection protocols, and the possible introduction of cryo-artifacts in the protein structure [60] [62].
Advanced Sample Delivery: Serial Crystallography
Serial crystallography (SX), developed initially at XFELs and now also used at synchrotrons, represents a paradigm shift in data collection. It involves serially exposing a stream of microcrystals to the X-ray beam, with each crystal diffracting only once in a "diffract-before-destroy" manner [13]. This approach is particularly powerful for mitigating damage, as it entirely avoids the accumulation of dose in a single crystal.
- Liquid Injection: This method involves jetting a stream of crystal slurry, suspended in a liquid carrier, across the X-ray beam. While effective, early implementations were characterized by high sample consumption, as the crystal-loaded liquid flowing between X-ray pulses was wasted [13].
- Fixed-Target Methods: In this approach, crystals are arrayed on a solid, X-ray transparent chip. The chip is then rastered through the beam, exposing each crystal position once. Fixed-target systems drastically reduce sample consumption and background scattering, as there is no continuous flow of liquid [13] [62].
- Hybrid Methods: Emerging methods combine aspects of both, such as high-viscosity extruders (HVE) that deliver crystals in a thick, slow-moving matrix like lipidic cubic phase (LCP), reducing flow and waste [13].
- Sample Consumption: The drive to study precious biological samples has fueled innovations in reducing sample needs. The theoretical minimum sample consumption for a complete SX dataset (requiring ~10,000 indexed patterns from 4 µm crystals) is estimated to be as low as 450 ng of protein, a target that modern methods are approaching [13].
Table 2: Comparison of Serial Crystallography Delivery Methods
| Method | Principle | Advantages | Limitations | Typical Sample Consumption |
|---|---|---|---|---|
| Liquid Injection | Crystal slurry jetted as liquid stream. | Fast crystal replenishment; suitable for time-resolved studies. | High sample waste; requires high crystal density [13]. | Early experiments: grams of protein; Modern: milligrams [13]. |
| Fixed-Target | Crystals pre-loaded on solid chip. | Very low sample waste; no flow required. | Potential for crystal harvesting bias; chip background scattering [13] [62]. | Micrograms of protein [13] [62]. |
| High-Viscosity Extrusion | Crystals embedded in viscous matrix. | Reduced flow and convection; ideal for membrane proteins in LCP. | Higher pressure required for extrusion; potential for clogging [13]. | Significantly lower than liquid injection [13]. |
Data Collection Strategy and Dose Management
Beyond sample preparation, the data collection strategy itself is critical for managing damage.
- Dose Monitoring and Limiting Exposure: The first step is to calculate the dose being delivered to the crystal. This requires knowing the beam flux (photons s⁻¹), beam size at the crystal (µm²), and exposure time. Tools like RADDOSE can provide accurate dose estimations, factoring in crystal composition and X-ray wavelength [61]. The total exposure should be planned to stay within the practical dose limits (e.g., 30 MGy).
- Discontinuous X-ray Irradiation: A more advanced strategy involves introducing short, X-ray-free "dark" periods during data collection. The rationale is that this may allow for the recombination of radical species, potentially slowing the progression of damage. However, the efficacy of this method is an active area of research, as some studies suggest "dark progression" of damage may continue after the beam is off [63].
The Scientist's Toolkit: Essential Reagents and Materials
Table 3: Key Research Reagent Solutions for Mitigating Radiation Damage
| Reagent / Material | Function / Application | Key Considerations |
|---|---|---|
| Cryoprotectants (e.g., glycerol, ethylene glycol, sucrose) | Prevents destructive ice formation within and around the crystal during flash-cooling [60]. | Concentration must be optimized for each protein crystal to avoid crystal cracking or disorder. |
| Crystal Mounting Loops (Nylon, Kapton, Microfabricated) | Provides physical support for the crystal during cryo-cooling and data collection [60]. | Loop size should match crystal; material should minimize background scattering. |
| RADDOSE Software | Calculates the absorbed dose by a crystal during an experiment based on beam parameters and crystal composition [61]. | Essential for quantitative dose management and reproducible data collection strategies. |
| High-Viscosity Matrices (e.g., LCP) | Acts as a carrier medium for microcrystals in high-viscosity extrusion and some fixed-target methods, reducing sample waste [13]. | Particularly useful for membrane proteins; requires specialized handling equipment. |
| Radioprotectants (e.g., ascorbate, sodium nitrate) | Chemical compounds that scavenge free radicals generated by X-ray irradiation, thereby reducing the rate of specific damage [61]. | Must be tested for compatibility with the protein and crystallization condition; effectiveness can vary. |
| Fixed-Target Chips (e.g., silicon, polymer) | Microfabricated devices with wells or patterns to hold thousands of crystals for low-consumption serial data collection [13] [62]. | Chip material must have low X-ray background; chip design affects loading efficiency and background. |
Protein X-ray crystallography remains a cornerstone technique in structural biology, providing atomic-resolution insights that are crucial for understanding molecular function and guiding drug discovery. While the basic principles of growing crystals and determining structures are well-established, advancing the technique to study more challenging biological systems requires a suite of sophisticated methods. Among these, cryo-cooling, controlled dehydration, and seeding techniques have become indispensable tools in the modern crystallographer's arsenal. This guide explores these advanced methodologies within the broader context of protein crystallography research, providing technical details, current protocols, and practical considerations for researchers and drug development professionals. The continuous evolution of these techniques, including their integration with emerging technologies like serial crystallography and artificial intelligence, is expanding the frontiers of what can be studied structurally [13] [4].
Core Technical Principles
Cryo-Cooling in Modern Crystallography
Cryo-cooling (cryocrystallography) involves rapidly freezing protein crystals to cryogenic temperatures (typically around -170°C) before X-ray data collection. This practice serves two critical functions: mitigating radiation damage by reducing radical diffusion, and preserving crystal order for the duration of data collection. The process requires careful protocol optimization as the transition to low temperature can induce structural stresses and non-physiological conformations. Recent systematic comparisons have revealed that while cryo-cooling remains the standard for most macromolecular crystallography experiments, it can sometimes mask physiologically relevant protein and ligand conformations observable at room temperature [4].
The cryo-protection process alters osmotic pressure in crystal samples, similar to dehydration, potentially changing structure and packing. Successful cryo-cooling requires identifying suitable cryoprotectants – compounds that suppress ice formation when substituted for water in and around crystals. Common cryoprotectants include glycerol, ethylene glycol, sucrose, and low-molecular-weight polyethylene glycols. The choice and concentration depend on the original crystallization condition and must be optimized empirically to balance protection against ice formation with potential damage to crystal lattice order.
Crystal Dehydration: Methods and Effects
Crystal dehydration encompasses any process that removes available water molecules from the crystal lattice, fundamentally altering the hydration shell surrounding protein molecules [64] [65]. This physical process significantly impacts crystal diffraction properties through two primary mechanisms:
- Vapor Equilibrium Modification: Altering the water vapor pressure of air surrounding samples, causing water in crystallization buffer and crystal solvent channels to equilibrate with the environment. Techniques range from simple air exposure to sophisticated humidity control devices [64].
- Chemical Equilibrium Modification: Adding compounds that directly bond to water molecules in the crystallization buffer, reducing water availability for protein interactions. This approach often uses salts, precipitants, or alcohols and may involve solution replacement via pipetting or dialysis [64].
The concept of Relative Humidity (RH) is central to controlled dehydration experiments. RH represents the relative amount of water vapor in a given volume of air, expressed as a percentage of saturation humidity. In closed systems, standard salt solutions provide reliable RH calibration (e.g., saturated LiCl ≈ 11% RH, NaCl ≈ 75% RH at 20°C) [64]. The European Synchrotron Radiation Facility provides online tools to estimate RH values for various solutions, incorporating both theoretical and empirical data for improved accuracy.
Dehydration induces measurable physical changes in crystals, frequently improving diffraction quality by extending resolution limits and reducing mosaicity [66]. In some cases, dehydration triggers space group transitions – changes in the symmetrical arrangement of molecules within the crystal lattice. For example, controlled dehydration of glucose isomerase crystals transitioned from space group I222 to P222, while xylanase GH11 (TsaGH11) crystals changed from tetragonal to orthorhombic upon air dehydration [65]. These transitions alter protein-protein interfaces within the crystal lattice, potentially revealing alternative protein conformations and flexibility not observable in hydrated forms [65].
Seeding Techniques and Applications
The term "seeding" in crystallography encompasses distinct methodologies with different applications:
Phase Seeding: A recently developed computational phasing method that integrates artificial intelligence with established ab initio techniques [67]. Rather than presenting a complete AI-based phasing solution, phase seeding uses machine learning to generate approximate phase values for a subset of intense reflections (a "phase seed"). These discretized phase values – transformed from a continuous regression problem to a multi-class classification task – serve as starting points for conventional phase extension and electron density modification procedures [57] [67].
Microseeding in Crystal Growth: A practical laboratory technique used to improve crystal quality and reproducibility by introducing pre-formed crystalline nuclei (seeds) into protein solutions. While not explicitly detailed in the search results, this traditional method remains valuable for overcoming nucleation barriers with challenging proteins.
Table 1: Quantitative Effects of Controlled Dehydration on Representative Protein Crystals
| Protein | Initial Space Group | Final Space Group | Resolution Change | Key Observation |
|---|---|---|---|---|
| DsbG | Not specified | Not specified | 10 Å → 2 Å | "Spectacular improvement" from streaky to high-resolution diffraction [66] |
| Glucose Isomerase | I222 | P222 | Not specified | Transition induced by humidity reduction from 96% to 85% RH [65] |
| Cytomegalovirus IE1 | P21 | P43 | Not specified | Altered intrinsic flexibility after transition [65] |
| TsaGH11 | P43212 | Orthorhombic | Comparable maintained | Revealed multiple conformations in substrate-binding cleft [65] |
Advanced Applications and Integrated Approaches
Serial Crystallography at Room Temperature
Serial crystallography (SX), initially developed for X-ray free-electron lasers (XFELs) and later adapted to synchrotrons, has revolutionized data collection by spreading X-ray exposure across thousands of microcrystals. This approach is particularly valuable for room-temperature studies that capture protein structures under near-physiological conditions [4]. Recent advancements have demonstrated that SX enables high-throughput fragment screening at room temperature with resolutions comparable to cryogenic methods [4] [68].
The HiPhaX instrument at PETRA III exemplifies specialized infrastructure for these studies, featuring microporous fixed-target sample holders with 12 compartments for different protein/ligand complexes and precise environmental control (7-40°C, 20-100% RH) [4]. This system facilitates on-chip crystallization and high-throughput data collection while minimizing sample consumption. Comparative studies between room temperature (296 K) and cryogenic (100 K) fragment screening revealed that while overall fewer binders were detected at room temperature, the identified binding modes were consistent between temperatures [4]. Crucially, room-temperature data collection uncovered a previously unobserved conformational state in the active site of Fosfomycin-resistance protein A, highlighting the potential for discovering physiologically relevant states invisible in cryo-structures [68].
Sample Delivery and Consumption Optimization
A significant challenge in serial crystallography has been the substantial sample consumption required for complete data sets. Early serial femtosecond crystallography (SFX) experiments needed "millions to billions" of crystals and grams of purified protein [13]. Recent methodological advances have dramatically reduced these requirements through three primary delivery systems:
- Fixed-Target Approaches: Crystals are deposited on stationary supports and raster-scanned through the X-ray beam, minimizing sample waste between exposures [13] [69].
- Liquid Injection Methods: Crystal slurries are continuously injected as liquid streams or encapsulated in droplets, with recent innovations reducing flow rates and volumes [13].
- Hybrid Methods: Combining elements of both fixed-target and injection approaches to optimize efficiency [13].
The theoretical minimum sample requirement for a complete SX dataset is approximately 450 ng of protein, assuming 10,000 indexed patterns, microcrystal dimensions of 4×4×4 μm, and a protein concentration of ~700 mg/mL in the crystal [13]. While practical implementations still exceed this ideal, the gap continues to narrow with technological improvements. Efficient sample delivery is particularly critical for time-resolved studies, where data must be collected at multiple time points after reaction initiation [70] [13].
Table 2: Sample Consumption in Serial Crystallography Delivery Methods
| Delivery Method | Key Features | Advantages | Sample Consumption Considerations |
|---|---|---|---|
| Fixed-Target | Crystals loaded on chip or membrane | Minimal sample waste between exposures; compatible with high-viscosity samples | Consumption primarily determined by crystal density and coverage |
| Liquid Injection | Continuous stream of crystal suspension | Rapid crystal replenishment; suitable for mix-and-inject time-resolved studies | Significant sample loss between X-ray pulses |
| High-Viscosity Extrusion | Crystal suspension in viscous matrix | Reduced flow rates and sample consumption; improved crystal stability | Requires special handling and extrusion equipment |
| Droplet-Based Injection | Encapsulated crystals in immiscible carrier | Reduced sample consumption through segmented flow | Additional complexity in droplet generation |
Time-Resolved Crystallography
Time-resolved serial crystallography enables the visualization of structural changes during biochemical reactions, creating "molecular movies" of enzymatic mechanisms [70] [13]. Two primary initiation methods dominate the field:
- Optical Pumping: Using laser pulses to activate light-sensitive proteins like photosystems or rhodopsins, suitable for ultrafast timescales (femtoseconds to milliseconds) [13].
- Mix-and-Inject (MISC): Rapidly mixing substrate solutions with protein crystals to initiate reactions, typically accessing millisecond to second timescales [70] [13].
Recent instrumentation developments have dramatically improved the efficiency of mix-and-inject approaches. New systems enable rapid reaction initiation by mixing crystals with substrate/ligand solution followed by thermal quenching without pre-cooling perturbations, achieving time resolution in the single-millisecond range [70]. This methodology has been successfully applied to study binding events, such as N-acetylglucosamine to lysozyme, using just one crystal per time point from 8 ms to 2 s [70]. The simplicity, robustness, and low cost of these approaches make them suitable for routine laboratory use and high-throughput screening of diverse ligand solutions.
Experimental Protocols
Controlled Dehydration Procedure
The following protocol outlines a vapor equilibrium-based dehydration approach for macromolecular crystals, adaptable to both soluble and membrane proteins:
Materials Required:
- Humidity control device (e.g., HC1b or FMS) or sealed container with salt solutions
- RH calibration standards (saturated salt solutions)
- Capillary mounting tools or micro-meshes
- Microscope for visual monitoring
Procedure:
- Initial Assessment: Characterize native crystal diffraction quality at current hydration state. Collect reference dataset if possible.
- Mounting: Transfer crystal to capillary or micro-mesh while maintaining native hydration environment.
- RH Calibration: Prepare saturated salt solutions corresponding to target RH values (e.g., 90-98% for initial gentle dehydration).
- Equilibration: Expose mounted crystal to controlled RH environment, starting with small decrements (2-5% RH reduction).
- Monitoring: Visually inspect crystal for cracks or disorder after each equilibration period (typically 15-60 minutes).
- Diffraction Testing: Test diffraction quality after each significant RH change, checking for resolution improvement or space group changes.
- Optimization: Iterate RH adjustment until optimal diffraction is achieved or detrimental effects appear.
- Data Collection: Proceed with full data collection at optimal dehydration state, either at room temperature or after cryo-cooling.
For chemical dehydration approaches, gradually increase the concentration of dehydrating agents (e.g., salts, PEGs) in the crystal solution through sequential transfer or vapor diffusion, monitoring effects similarly.
Room-Temperature Serial Crystallography Screening
This protocol describes fixed-target room-temperature fragment screening using the HiPhaX approach [4]:
Materials Required:
- Microporous fixed-target sample holders with multiple compartments
- 3D-printed crystallization chambers
- Fragment library solutions
- High-humidity glove box (>95% RH)
- Roadrunner-type sample delivery system with environmental control
Procedure:
- On-Chip Crystallization:
- Mix protein and crystallization solutions directly in sample holder compartments using sitting-drop vapor diffusion.
- Incubate until crystals reach optimal size (typically 1-3 weeks).
Fragment Soaking:
- Remove crystallization solution by blotting through microporous membranes.
- Add fragment solutions to crystals in compartments by pipetting.
- Incubate for 24 hours to allow binding.
Sample Preparation:
- Remove excess liquid by blotting through membranes.
- Slide protective covers over sample holders to maintain humidity.
- Perform all manipulations in high-humidity glove box to prevent dehydration.
Data Collection:
- Mount sample holders in Roadrunner delivery system.
- Set environmental controls to desired temperature (296 K) and humidity (98% RH).
- Collect serial diffraction data from thousands of crystals in random orientation.
Data Processing:
- Index and integrate individual diffraction patterns.
- Merge data into complete datasets for each fragment condition.
- Refine structures and analyze ligand binding.
This protocol enables high-throughput screening under near-physiological conditions while minimizing radiation damage through dose fraction across many crystals.
Data Analysis and Interpretation
Recognizing Dehydration Effects in Diffraction Data
Crystal dehydration manifests in several measurable parameters in diffraction data:
- Unit Cell Contraction: Most crystals exhibit reduced unit cell volumes upon dehydration, though the magnitude varies significantly between proteins [65].
- Space Group Changes: Non-isomorphism between native and dehydrated crystals may indicate space group transitions, detectable through systematic absences and symmetry analysis [65].
- Resolution Improvement: Often the primary goal, evidenced by stronger high-resolution diffraction spots and extended resolution limits [66].
- Mosaicity Changes: Typically reduced mosaicity indicates improved crystal order, though excessive dehydration can increase mosaicity.
The TsaGH11 case study demonstrated that dehydration-induced space group transitions can reveal conformational diversity not observed in native crystals, particularly in flexible regions like substrate-binding clefts [65]. Comparing electron density maps between hydrated and dehydrated states can identify these alternative conformations, providing insights into molecular flexibility and function.
Comparing Cryo versus Room-Temperature Structures
Systematic comparisons between cryogenic and room-temperature datasets reveal consistent trends:
- Unit Cell Volume: Generally larger at room temperature, reflecting thermal expansion [4].
- Ligand Binding: Fewer binders typically detected at room temperature, though binding modes are generally consistent when observed at both temperatures [4].
- Protein Conformational States: Room-temperature structures more frequently capture alternative conformations, particularly in flexible active site regions [4] [68].
- Resolution: Modern serial methods achieve comparable resolution at both temperatures, though conventional single-crystal data collection typically shows better resolution at cryogenic temperatures due to reduced radiation damage [4].
When planning experiments, researchers should consider these trade-offs: cryo-cooling for maximum resolution and reduced radiation damage versus room-temperature studies for physiological relevance and conformational diversity.
Research Reagent Solutions
Table 3: Essential Materials for Advanced Crystallography Techniques
| Reagent/Material | Function/Application | Technical Considerations |
|---|---|---|
| Humidity Control Device (HC1b/FMS) | Precise regulation of crystal hydration during data collection | Enables controlled dehydration experiments with X-ray feedback [64] |
| Microporous Fixed-Target Chips | Sample support for serial crystallography | Enables high-throughput screening with minimal sample consumption [4] |
| Cryoprotectants (Glycerol, Ethylene Glycol) | Suppress ice formation during cryo-cooling | Concentration must be optimized for each crystal type [64] |
| Saturated Salt Solutions | RH calibration standards for dehydration experiments | LiCl (11% RH), NaCl (75% RH), KCl (86% RH) at 20°C [64] |
| High-Viscosity Carriers (LCP, Grease) | Matrix for viscous extrusion serial crystallography | Redumes sample flow rate and consumption [13] |
| Microseeding Tools | Introduce nucleation sites for improved crystal growth | Requires optimization of seed concentration and preparation |
Workflow and Decision Pathways
Crystallography Method Selection Workflow
Advanced techniques in protein crystallography, including controlled dehydration, cryo-cooling, and modern seeding approaches, have dramatically expanded the structural information accessible to researchers. The integration of these methods with serial crystallography platforms enables studies under physiologically relevant conditions while managing radiation damage. As these methodologies continue to evolve alongside emerging technologies like artificial intelligence for phase determination [57] [67], they will further empower researchers to tackle increasingly challenging biological systems. The ongoing development of sophisticated sample environments, miniaturized delivery systems, and automated data collection pipelines promises to make these advanced techniques more accessible, ultimately accelerating progress in structural biology and drug discovery.
Utilizing AI and Automation for Crystallization Screening
Protein X-ray crystallography remains a cornerstone technique in structural biology and drug discovery, providing atomic-resolution insights into protein structures that are indispensable for rational drug design. The initial and often most critical step in this process is protein crystallization, a procedure historically known for its low throughput, high sample consumption, and significant time investment. This whitepaper explores the transformative impact of Artificial Intelligence (AI) and automation technologies on crystallization screening. By integrating these advancements, researchers can overcome traditional bottlenecks, enhancing the efficiency, success rate, and overall throughput of crystal structure determination within modern drug development pipelines.
The Foundational Role of Crystallization in Structural Biology
The process of protein crystallography begins with the production of a pure, stable, and homogeneous protein sample. This is followed by the crucial crystallization phase, where proteins are coaxed into forming a highly ordered, three-dimensional lattice under carefully controlled conditions. The quality of these crystals directly dictates the success of subsequent X-ray diffraction experiments [53].
Traditional screening workflows involve testing thousands of chemical conditions to find the precise parameters that promote crystal growth, typically using vapor diffusion methods [53]. This process has been notoriously labor-intensive and subjective. A 2021 study highlighted a significant challenge: when seven crystallographers were asked to score the same 1,200 crystallization trial images, they unanimously agreed on only about 50% of the images. Even for images containing crystals, the unanimous agreement rate was a mere 41% [71]. This high degree of variability in manual scoring underscored the urgent need for more consistent and scalable solutions.
Advancements in AI for Automated Crystal Scoring
A major innovation in addressing the scoring bottleneck is the development of AI-based image analysis systems. These deep learning models are trained on vast and diverse datasets of crystallization trial images, enabling them to classify outcomes with accuracy that rivals or surpasses human experts.
Performance Comparison of AI Scoring Systems
Quantitative studies demonstrate the superior performance of next-generation AI models. The following table compares two such systems, MARCO and Sherlock, on a diverse dataset of 6,662 images [71]:
| Performance Metric | MARCO | Sherlock |
|---|---|---|
| Overall Accuracy | 66.96% | 81.27% |
| Crystal Recall | 45.36% | 71.38% |
| Crystal Precision | 36.80% | 73.87% |
Source: Formulatrix (2024) [71]
Key Definitions:
- Overall Accuracy: The percentage of all images (with and without crystals) that were correctly classified.
- Crystal Recall: The percentage of actual crystals that the model correctly identified as crystals (minimizing false negatives).
- Crystal Precision: The percentage of images the model labeled as crystals that actually contained crystals (minimizing false positives).
The data shows that Sherlock significantly outperforms MARCO, particularly in correctly identifying true crystals (Recall) and in reducing false positives (Precision). This level of accuracy ensures that researchers can reliably focus their efforts on the most promising conditions.
Workflow Integration of Automated Scoring
AI scoring integrates into a streamlined, high-throughput workflow, as visualized below. This automation minimizes human bias and fatigue, allowing for continuous, objective analysis and rapid decision-making.
Automated and High-Throughput Experimental Platforms
Automation in crystallization screening extends beyond image analysis to encompass the entire physical workflow. Modern structural biology laboratories are equipped with automated pipetting stations and imaging systems capable of setting up and monitoring over 2,000 crystallization conditions per day [53]. This high-throughput capability is essential for rapidly exploring a wide matrix of parameters with minimal manual intervention.
These automated systems are often integrated with Laboratory Information Management Systems (LIMS), such as Rock Maker, which track every experimental condition and its outcome, creating a rich, searchable database that further refines screening strategies over time [71].
Impact on Advanced Crystallography Methods
The synergy of AI and automation is particularly impactful for cutting-edge crystallography methods that demand immense experimental throughput.
Serial Crystallography and Sample Consumption
Serial crystallography (SX), conducted at synchrotrons or X-ray free-electron lasers (XFELs), has revolutionized structural biology by enabling studies of previously intractable protein targets and allowing for time-resolved analysis of reaction mechanisms [13]. However, a primary challenge of SX has been its enormous appetite for sample material, as it requires thousands of microcrystals to assemble a complete dataset [13].
Advanced automation and microfluidics have directly addressed this issue. The following table summarizes how modern sample delivery methods have drastically reduced sample requirements:
| Sample Delivery Method | Key Features | Impact on Sample Consumption |
|---|---|---|
| Liquid Injection | Continuous jet of crystal slurry into the X-ray beam. | Early methods consumed grams of protein; now reduced to microgram levels [13]. |
| Fixed-Target Chips | Microfluidic chips with thousands of wells; crystals are grown or deposited on the chip. | Significantly reduces waste by precisely positioning crystals [13] [72]. |
| High-Viscosity Extruders | Extrusion of crystal slurry in a viscous, non-fluidic medium (e.g., lipidic cubic phase). | Slows crystal flow, reducing sample consumption and background noise [13]. |
These technological leaps have theoretically reduced the ideal sample requirement for a full SX dataset to as little as ~450 nanograms of protein for a small enzyme [13]. The workflow for a fixed-target serial crystallography experiment, which enables this high efficiency, is illustrated below.
Fragment Screening and Drug Discovery
In drug discovery, fragment-based screening uses X-ray crystallography to identify very small, low-affinity molecules ("fragments") that bind to a protein target. This requires determining structures for hundreds or thousands of protein-fragment complexes, a task perfectly suited for an automated, high-throughput workflow [72] [73].
Recent advances now allow for fully automated fragment screening at room temperature using fixed-target serial synchrotron crystallography (SSX). A 2025 study on the Fosfomycin-resistance protein A (FosA) demonstrated that this approach yields data of comparable resolution to traditional cryogenic methods while capturing a previously unobserved, physiologically relevant conformational state of the active site [72]. This highlights a key benefit of automated room-temperature studies: the potential to reveal protein dynamics and ligand interactions that are "frozen out" in cryo-cooled crystals.
The Scientist's Toolkit: Essential Research Reagents and Materials
The successful implementation of an AI-driven crystallization screening platform relies on a suite of specialized reagents and instruments.
| Tool / Reagent | Function in Screening |
|---|---|
| High-Throughput Crystallization Plates | Miniaturized plates (e.g., 96-well or 1536-well format) that enable testing of thousands of conditions with minimal protein sample consumption [53]. |
| Commercial Sparse Matrix Screens | Pre-formulated suites of crystallization conditions (e.g., from Hampton Research, Jena Bioscience) providing a broad initial search of chemical space [53]. |
| Fragment Libraries | Curated collections of 100-1000 small, soluble compounds with high ligand efficiency, used for identifying initial hits in structure-based drug discovery [72] [73]. |
| Microporous Fixed-Target Sample Holders | Specialized chips for fixed-target serial crystallography that allow for on-chip crystal growth, ligand soaking, and low-background X-ray data collection [72]. |
| Rock Maker LIMS | A Laboratory Information Management System that tracks all experimental parameters and outcomes, integrating with automated imagers and AI scorers for a seamless workflow [71]. |
| Sherlock / MARCO AI Software | Pretrained neural network models for automated, unbiased classification of crystallization trial images, directly integrated into the analysis pipeline [71]. |
The integration of AI and automation has fundamentally transformed protein crystallization screening from a manual, artisanal process into a robust, data-driven, and industrialized operation. AI-powered image scoring has overcome critical bottlenecks in consistency and throughput, while automated liquid handling and experimental platforms have dramatically increased the scale and efficiency of screening campaigns. These advancements directly enable powerful methods like serial crystallography and high-throughput fragment screening, which are central to modern drug discovery efforts. As these technologies continue to evolve, they will further accelerate the pace of structural biology, providing researchers and drug development professionals with deeper and more dynamic insights into protein function and interaction.
Assessing Structure Quality: Validation, Quality Control, and Cross-Technique Comparisons
In protein X-ray crystallography, three-dimensional molecular models are derived from experimental diffraction data obtained from protein crystals [46] [19]. These models are fundamental to advancing biological knowledge and facilitating structure-based drug design [74] [75]. However, these structures are not direct observations but are interpretative models built to best fit the experimental data [74]. Consequently, assessing the reliability and precision of these models is paramount.
The quality of a crystallographic model is not determined by a single parameter but by a combination of complementary metrics [76]. The three primary metrics used to assess quality are the resolution of the diffraction data, the R-factor (and its related R-free value), and the B-factors (also known as atomic displacement parameters) [76]. Understanding these metrics is essential for researchers and drug development professionals to critically evaluate structural models, identify potential limitations, and make informed decisions when utilizing these structures for downstream applications, such as virtual screening and lead compound optimization [74].
Core Quality Metrics Explained
Resolution
Definition and Physical Basis
Resolution, measured in Angstroms (Å), is the most fundamental indicator of the detail obtainable from a crystallographic experiment [46] [76]. It refers to the smallest distance between two planes in a crystal lattice that can be resolved as distinct features in the diffraction pattern [46]. According to Bragg's Law (nλ = 2d sinθ), a smaller d (the interplanar spacing) corresponds to a higher diffraction angle (θ), meaning that high-resolution data requires measuring diffraction spots at wider angles [46]. The collection of more diffraction spots with finer interplanar distances results in an electron density map with finer detail, allowing for more precise atomic placement [46].
Interpretation and Impact on Model Quality
The resolution of the data directly dictates the interpretative power of the electron density map. The table below summarizes the general characteristics of protein structures at different resolution ranges.
Table 1: Interpretation of Resolution Ranges in Protein Crystallography
| Resolution Range (Å) | Classification | Structural Details Observable |
|---|---|---|
| ≤ 1.2 | Atomic Resolution | Individual atoms; precise bond lengths and angles; many solvent molecules identifiable [46] [76]. |
| 1.2 – 2.4 | High/Atomic Resolution | Well-defined side-chain conformations; clear density for water molecules; model building is straightforward [46]. |
| 2.5 – 3.5 | Medium Resolution | Polypeptide chain can be traced; side chains may be discernible but not well-defined; some bound water molecules may be visible [46] [76]. |
| > 3.5 | Low Resolution | Overall shape and secondary structure elements (e.g., alpha-helices as rods) are visible; atomic details are obscured [76]. |
Higher-resolution structures typically have lower coordinate error, meaning the atomic positions are more accurate and precise [76]. As shown in the electron density examples, a tryptophan side chain at 1.15 Å resolution shows distinct density for each atom, whereas at 3.0 Å, the density is a fused blob, making accurate atomic placement impossible [76].
R-factors
R-work and its Significance
The R-factor, also known as the R-work or residual factor, quantifies the agreement between the crystallographic model and the experimental X-ray diffraction data [77]. It is defined by the equation:
$$R = \frac{\sum{||F{obs}| - |F{calc}||}}{\sum{|F_{obs}|}}$$
where $F{obs}$ is the observed structure factor amplitude (derived from the measured intensity of diffraction spots) and $F{calc}$ is the structure factor amplitude calculated from the atomic model [77]. In essence, it measures the average disagreement between the experimental observations and the ideal values predicted by the model. A value of zero indicates perfect agreement, while lower values generally indicate a better fit of the model to the data [77]. For protein structures, R-work values typically range from 14% to 25%, which is considerably higher than the 4-5% typical for small-molecule structures due to factors like crystal disorder and internal molecular flexibility [76].
R-free: A Guard Against Overfitting
R-free is a crucial cross-validation tool computed in exactly the same way as R-work, but it uses a small subset of the diffraction data (typically 5-10%) that was excluded from the refinement process [77] [78]. Because this "test set" of reflections was not used to adjust the atomic model, R-free provides an unbiased measure of the model's quality [77] [78]. During refinement, if R-work decreases but R-free increases or remains stagnant, it is a strong indicator of overfitting—where the model is becoming overly complex to fit the noise in the refinement data rather than the true underlying structure [78]. A well-refined structure will have R-work and R-free values that are close together, typically within 2-5 percentage points of each other [77] [79].
B-factors
Definition and Interpretation
B-factors, or atomic displacement parameters (ADPs), model the smearing of atomic electron density due to atomic vibration or positional disorder within the crystal [78]. A low B-factor indicates an atom is well-ordered and occupies a single, precise position. A high B-factor suggests an atom is dynamic, occupies multiple conformations (static disorder), or is located in a region of the structure that is poorly defined by the electron density [78] [76]. B-factors have units of Ų and typically average around 20-30 Ų for well-ordered atoms in a protein structure at room temperature. Values exceeding 80 Ų often indicate high flexibility or disorder.
Modeling Anisotropy and Advanced Treatments
The simplest model is an isotropic B-factor, which assumes uniform displacement in all directions, represented as a sphere [78]. At higher resolutions (typically better than ~1.5 Å), it may be justifiable to use anisotropic B-factors, which model displacement as an ellipsoid using six parameters per atom, providing a more accurate description of directional motion [78]. Furthermore, the translation/libration/screw (TLS) formalism can be used to model the correlated motion of groups of atoms (e.g., a protein domain) as a rigid body [78]. The choice of the optimal displacement model (isotropic, anisotropic, or TLS) should be validated statistically for each structure based on the resolution and data quality, rather than relying on a simple rule of thumb [78].
Methodological Workflow and Interdependence of Metrics
The process of determining a protein structure and assessing its quality is a multi-stage workflow. The following diagram illustrates the key experimental and computational steps, highlighting the stages where the core quality metrics are derived and utilized.
Diagram 1: Crystallographic workflow showing how key quality metrics are generated and used during structure determination. R-work, R-free, and B-factors are critical outputs of the refinement process and are rigorously checked during validation.
Experimental Protocols for Data Collection and Validation
High-Resolution Data Collection at a Synchrotron
- Crystal Preparation: A protein crystal is harvested and flash-cooled in a stream of liquid nitrogen at approximately 100 K to mitigate radiation damage [46] [19].
- Beamline Setup: The frozen crystal is mounted robotically onto a goniometer on a synchrotron beamline. The intense, focused X-ray beam is collimated to a diameter matching the crystal size (e.g., 0.1-0.3 mm) [46] [19] [75].
- Data Collection Strategy: The crystal is rotated in the beam through a predetermined arc (e.g., 0.1-1.0° per image) while a high-speed detector, such as a CCD or pixel array, records the diffraction images. At modern beamlines, a complete dataset can be collected in seconds to minutes [46] [75].
- Data Processing: The diffraction images are processed using software packages (e.g., XDS, HKL-2000, MOSFLM). This step involves indexing the spots, integrating their intensities, and merging data from multiple images to produce a set of structure factors ($F_{obs}$) and the final resolution of the dataset [46] [19].
Structure Refinement and R-free Monitoring Protocol
- Initial Model and Test Set: Before refinement begins, a randomly selected subset of reflections (e.g., 5%) is flagged as the test set for R-free calculation. These reflections are never used in any parameter optimization [77] [78].
- Cyclical Refinement: Refinement is an iterative process using software like Phenix or Refmac. Each cycle typically involves:
- Coordinate Refinement: Adjusting atomic positions ($x, y, z$) to better fit the electron density map.
- B-factor Refinement: Adjusting atomic displacement parameters.
- Manual Model Rebuilding: Using visualization software (e.g., Coot) to correct errors in the model based on the electron density.
- Validation Check: After each refinement cycle, both R-work and R-free are calculated. A successful cycle results in a decrease in both values. If R-free increases, it signals potential overfitting, and the model or refinement strategy must be re-evaluated [78].
Model Validation Protocol
- Sterochemical Quality Check: The geometry of the model (bond lengths, bond angles, torsion angles) is checked against established ideal values from small-molecule structures. The Ramachandran plot is analyzed to ensure the majority of protein backbone torsion angles fall in sterically allowed regions [76].
- Validation Against Experimental Data: The fit of the model to the electron density is scrutinized. Regions with poor density or high B-factors are inspected for possible errors in modeling [74] [76].
- Cross-Validation with R-free: The final R-free value is a primary indicator of the model's predictive power and freedom from bias [77] [78].
The Scientist's Toolkit: Essential Research Reagents and Materials
Table 2: Key Reagents and Materials for Protein X-ray Crystallography
| Item | Function/Description |
|---|---|
| Purified Protein Sample | Homogeneous, soluble protein at high concentration (> 5 mg/mL) is the starting material for crystallization trials [19]. |
| Crystallization Screens | Commercial sparse-matrix kits containing 50-100+ different conditions varying in precipitant (e.g., PEG, salt), buffer, and pH to identify initial crystal hits [19]. |
| Cryoprotectants | Chemicals (e.g., glycerol, ethylene glycol) added to the crystal mother liquor before flash-cooling to prevent ice formation and crystal damage [46]. |
| Synchrotron Beamline | A facility providing a high-intensity, tunable X-ray source, high-precision goniometer, and sensitive detector for data collection [46] [75]. |
| Crystallography Software Suites | Integrated software for data processing (e.g., XDS), phasing (e.g., PHASER), model building (e.g., Coot), and refinement (e.g., Phenix, Refmac) [46]. |
Resolution, R-factors, and B-factors are indispensable, interconnected metrics that provide a comprehensive picture of the quality and reliability of a protein crystal structure. Resolution defines the potential information content, R-factors (particularly R-free) quantify the model's agreement with the experimental data and its freedom from bias, and B-factors provide insights into local flexibility and disorder. A robust structure is one where these metrics are consistent: high resolution supports a low R-free and well-defined B-factors. Critical evaluation of these parameters, in conjunction with geometric validation, is essential for researchers to accurately interpret structural models and confidently apply them in functional studies and drug discovery campaigns [74] [76].
In the field of protein X-ray crystallography, determining the atomic coordinates of a structure is only the first step. Rigorous validation of the model's geometry is paramount to ensure the structure is not only consistent with the experimental data but also adheres to the fundamental principles of stereochemistry. Biological macromolecules, though large and complex, are governed by the same rules of chemical bonding derived from small-molecule crystallography [80]. However, a significant challenge arises from the fact that the vast majority of macromolecular structures are determined from data sets where the number of experimental observations is insufficient to refine all model parameters independently. Consequently, the refinement process almost universally relies on the application of stereochemical restraints to guide the model towards geometrically plausible solutions [80]. Validation, therefore, serves as an independent check to verify how well the final model conforms to these established structural principles.
This technical guide focuses on two cornerstone concepts in geometric validation: the analysis of backbone conformation via the Ramachandran plot and the assessment of local geometry through stereochemical checks of bond lengths, angles, and atomic clashes. These validation metrics are essential because distortions can indicate localized errors in model building or a general over-interpretation of low-resolution data. For researchers and drug development professionals, a validated model is a reliable foundation for understanding biological function, analyzing protein-ligand interactions, and structure-based drug design.
Fundamental Principles of Protein Stereochemistry
Stereochemical Restraints and Target Values
During the refinement of a protein crystal structure, the geometric parameters of the model, such as bond lengths and angles, are restrained to ideal values based on high-fidelity structural data. These target values are compiled in stereochemical restraint libraries, such as the widely used Engh and Huber library [80]. The refinement algorithm is tasked with minimizing the disagreement with the experimental X-ray data while simultaneously minimizing the deviation from these ideal stereochemistry targets.
The agreement with these targets is typically quantified using root-mean-square deviations (rmsd). For a well-refined, medium-to-high resolution structure, the expected rmsd for bond lengths is approximately 0.02 Å, reflecting the standard uncertainty of the targets themselves. For bond angles, the expected rmsd typically falls between 0.5° and 2.0° [80]. A significant deviation from these values, such as a bond length rmsd exceeding ~0.03 Å, may indicate underlying problems with the model. Conversely, an excessively low rmsd might suggest an over-restrained and overly idealized model that does not fully reflect the experimental data.
The Ramachandran Plot: A Map of Backbone Conformation
The Ramachandran plot is among the most central and powerful tools for validating the backbone conformation of a protein structure [81] [82]. It is a two-dimensional plot that visualizes the dihedral angles phi (φ) and psi (ψ) for each amino acid residue in the protein (except the first and last). These angles define the rotations around the N-Cα and Cα-C bonds, respectively, and their values dictate the folding of the polypeptide backbone [83].
The plot is divided into regions that are sterically allowed and disallowed based on calculations from well-defined small molecule structures. The allowed regions correspond to conformations where atoms in the backbone do not experience steric clashes [81] [83]. The distribution of residues in these regions provides a rapid assessment of the model's stereochemical quality:
- Favored Regions: These areas contain the most sterically and energetically preferred (φ, ψ) combinations. For a high-quality model, over 98% of residues are expected to fall within the most favored regions [80].
- Allowed Regions: These areas are less favorable but still permitted without significant steric hindrance.
- Disallowed Regions/Outliers: Residues falling in these regions have conformations that involve steric collisions between atoms. Their presence often signals a potential error in the model's backbone trace, though they can sometimes represent genuine, functionally important strained conformations [83].
It is crucial to note that glycine and proline are special cases. Glycine, having only a hydrogen atom as its side chain, possesses greater conformational freedom and can occupy regions of the plot that are disallowed for other residues. Proline, with its cyclic side chain bonded to the backbone nitrogen, has a restricted φ angle, placing it in a specific area of the plot [83].
Table 1: Standard Stereochemical Target Values and Tolerance Ranges in Protein Model Refinement
| Geometric Parameter | Target Value / Expected Range | Typical Rmsd in a Good Model | Significance |
|---|---|---|---|
| Bond Lengths | Based on Engh & Huber libraries [80] | ~0.02 Å | Deviation > ~0.03 Å may indicate model problems. |
| Bond Angles | Based on Engh & Huber libraries [80] | 0.5° - 2.0° | High values suggest geometric strain or refinement issues. |
| Peptide Torsion Angle (ω) | ~180° (trans) or ~0° (cis) [80] | Not typically restrained | Significant deviation (>20-30°) is highly suspicious. |
| Ramachandran Outliers | Residues in disallowed regions [83] | < 2% of non-glycine/proline residues [80] | High percentage indicates potential backbone tracing errors. |
Key Validation Metrics and Tools
A comprehensive validation protocol extends beyond the Ramachandran plot to evaluate other critical aspects of the model's geometry.
Sidechain Conformation and Atomic Clashes
- Sidechain Outliers (Rotamers): Similar to the protein backbone, amino acid side chains tend to adopt specific, energetically favorable conformations known as rotamers. Validation tools compare the side chain dihedral angles in the model to libraries of preferred rotamers derived from high-quality structures. A high percentage of sidechain outliers can indicate modeling errors, particularly at lower resolutions where the experimental data provides less constraint [83].
- Clashscore: This metric quantifies the number of severe steric overlaps, or atomic clashes, within the model. It is calculated as the number of clashes per 1000 atoms and provides a single number summarizing the overall physical plausibility of the atomic packing. A lower Clashscore is always better, and a high value suggests significant problems with the model's geometry throughout the structure [83].
Several software tools and online resources are available to the scientific community for performing these stereochemical checks. Many of these are integrated into the deposition pipeline of the Protein Data Bank (PDB).
Table 2: Key Software Tools for Stereochemical Validation of Protein Structures
| Tool / Resource | Primary Function | Key Features | Access |
|---|---|---|---|
| MolProbity [84] | All-atom structure validation | Integrates Ramachandran plot, rotamer, and Clashscore analysis; provides overall quality score. | Web server |
| PROCHECK [84] | Stereochemical quality analysis | Detailed Ramachandran plot analysis and overall structure G-factor. | Standalone / Web server |
| WHAT_CHECK [84] | Protein structure verification | Derived from WHAT IF program; performs extensive stereochemical checks. | Standalone |
| RCSB PDB Validation | PDB-integrated validation | Provides validation reports for all PDB entries, including Ramachandran outliers and Clashscore. | Web resource |
| PDB Validation Slider | Visualizing validation metrics | Allows users to visualize validation data, such as Ramachandran outliers, directly on the 3D structure. | Web resource [83] |
Experimental Protocols for Structure Validation
Standard Workflow for Post-Refinement Validation
The following protocol outlines the standard methodology for validating a protein crystal structure after the refinement process is complete.
Procedure:
- Generate Validation Report: Input the final, refined coordinate file (in PDB format) into a comprehensive validation system such as MolProbity [84] [83].
- Analyze the Ramachandran Plot:
- Examine the plot for all non-glycine/non-proline residues. Note the percentage of residues in favored, allowed, and disallowed regions.
- For a high-quality model, aim for >98% of residues in the most favored regions and <0.2% outliers [80].
- Investigate every outlier. Load the model and the corresponding electron density map (e.g., a 2mFo-DFc map) in a molecular graphics program (e.g., Coot). Verify that the electron density unambiguously supports the unusual (φ, ψ) conformation. If the density is weak, consider rebuilding the region.
- Check Sidechain Rotamers:
- Review the list of rotamer outliers. For each outlier, inspect the electron density to confirm the side chain's placement. Rebuild if necessary.
- Assess the Clashscore:
- Note the overall Clashscore. A value below the average for the structure's resolution indicates good atomic packing.
- Examine specific, severe clashes identified by the tool and rectify them through further refinement or manual rebuilding.
- Verify Other Geometric Parameters:
- Check the rmsd of bond lengths and angles against the expected values (see Table 1). Significant deviations may require adjusting restraint weights during refinement.
- Check the planarity of peptide bonds (ω angle). Deviations greater than 20° from 180° (or 0° for cis-peptides) should be scrutinized and require strong electron density support [80].
Interpreting Outliers and Electron Density
A critical aspect of validation is the interpretation of outliers. While a high number of Ramachandran or rotamer outliers often indicates poor model quality, some may be biologically meaningful. Functionally important regions, such as enzyme active sites, can exhibit strained conformations that are critical for activity [83]. The key is to require strong experimental support. An outlier must be clearly defined in the electron density map; otherwise, it is more likely to be a modeling error than a genuine feature.
Diagram 1: Structure Validation and Iterative Refinement Workflow
Table 3: Essential Resources for Protein Crystallography and Model Validation
| Resource / Reagent | Category | Function / Application |
|---|---|---|
| Engh & Huber Restraint Libraries [80] | Software/Database | Provides target values for bond lengths and angles used during refinement and validation. |
| MolProbity [84] [83] | Software | Integrated system for all-atom contact analysis and stereochemical validation (Ramachandran, rotamers, clashes). |
| PROCHECK [84] | Software | Validates stereochemical quality of protein structures, providing detailed Ramachandran plot analysis. |
| Coot | Software | Molecular graphics tool for model building, manipulation, and inspection of electron density maps. |
| PDB Validation Server [84] | Web Resource | Provides automated validation reports during deposition to the Protein Data Bank. |
| High-Purity Protein Sample | Biochemical Reagent | The starting material for crystallization. Purity and homogeneity are critical for growing diffraction-quality crystals. |
| Crystallization Screening Kits | Biochemical Reagent | Commercial kits containing diverse chemical conditions to identify initial crystallization hits for a protein target. |
The Critical Role of Validation in Drug Discovery
In the context of drug discovery, a structurally validated model is not an academic exercise but a business-critical asset. The rational drug design cycle relies heavily on accurate three-dimensional structures of pharmacological targets, often in complex with small-molecule inhibitors [85]. The use of X-ray crystallography has expanded from determining single target structures to being a core technology in Fragment-Based Drug Discovery (FBDD), where it is used to screen low-molecular-weight compounds and provide detailed structural information on weak-binding interactions [85].
The reliability of these structures is paramount. A model with unvalidated geometry, such as unexplained Ramachandran outliers or severe atomic clashes in the active site, can mislead medicinal chemists during optimization efforts. For instance, an incorrect protein backbone conformation could result in a flawed understanding of hydrogen-bonding networks, leading to the synthesis of compounds with poor affinity. Therefore, rigorous stereochemical validation ensures that the "molecular map" used to guide drug design is accurate, thereby de-risking the discovery pipeline and increasing the likelihood of developing successful clinical candidates.
Protein X-ray crystallography remains a cornerstone of structural biology, providing atomic-resolution insights that drive drug discovery and mechanistic understanding of biological processes. The accuracy and reliability of these atomic models are paramount, making structure validation an indispensable step in the structure determination pipeline. This technical guide details the use of two critical validation resources: MolProbity, an all-atom contact analysis tool, and the wwPDB validation reports, the official standard for structures deposited in the Protein Data Bank. We provide a comprehensive overview of their methodologies, key metrics, and interpretation guidelines, framed within the rigorous context of protein crystallography research. The guide is designed to equip structural biologists and drug development professionals with the knowledge to critically assess the quality of their models, thereby ensuring the integrity of structural data used in downstream applications.
The determination of a protein structure via X-ray crystallography is a complex process involving crystallization, data collection, phasing, model building, and refinement. Each stage introduces potential sources of error, which can manifest as inaccuracies in the final atomic model. Structure validation is the process of assessing the geometric and stereochemical correctness of a molecular model against established empirical and physical rules. It serves as a critical quality control check, identifying potential errors before a structure is utilized for further research, publication, or deposition in the Protein Data Bank (PDB) [86] [87].
The worldwide PDB (wwPDB) mandates validation for all deposited structures to maintain the high quality of the public repository. The resulting validation reports provide a standardized assessment of model quality, data quality, and the fit between the model and the experimental data [86] [88]. Complementary to this, MolProbity offers a powerful, all-atom contact analysis system that provides robust diagnostics for steric clashes, rotamer outliers, and Ramachandran plot conformity, often guiding the final stages of model improvement [86] [84] [87]. For researchers, proficiency with these tools is not optional; it is a fundamental skill essential for producing reliable and impactful structural science.
The MolProbity System
MolProbity is a structure-validation web service that provides comprehensive all-atom contact analysis. Its core philosophy is to add explicit hydrogen atoms and use modern, high-resolution crystal structures to define updated geometrical criteria, thereby enabling a more sensitive diagnosis of problem areas in a protein model [86] [84] [87].
Key Methodologies and Metrics
MolProbity's analysis is built on several key methodologies, each targeting a specific aspect of model quality:
All-Atom Contact Analysis: This is MolProbity's hallmark feature. The algorithm calculates the overlaps between all atoms, including hydrogens, which are added in optimal positions. The results are summarized in a clashscore, which is defined as the number of serious steric overlaps (≥ 0.4 Å) per 1000 atoms [86] [87]. A lower clashscore indicates a model with fewer steric strains.
Ramachandran Plot Analysis: This evaluates the backbone torsion angles (phi and psi) of each residue against a preferred distribution derived from high-quality structures. Residues are categorized as falling in favored, allowed, generously allowed, or outlier regions. A high-quality model should have >98% of its residues in the favored region and, ideally, 0% outliers [86] [87].
Rotamer Analysis: The tool assesses the chi-angle combinations of side chains to identify those in unlikely (outlier) conformations. This analysis uses a updated library of rotamer distributions from high-resolution data to flag side chains that could be modeled in a more optimal conformation [86] [84].
MolProbity Score: This composite score integrates the clashscore, Ramachandran plot, and rotamer evaluations into a single value. The MolProbity score is calibrated to represent the percentage of residues in a model that have a problem, meaning a lower score is better. It provides a convenient single-number summary of model quality [87].
Experimental Protocol for Using MolProbity
The typical workflow for validating a structure with MolProbity is straightforward:
- Input Preparation: Prepare your protein structure in PDB format. Ensure the file includes connectivity records (CONECT) if non-standard ligands are present.
- Submission: Access the MolProbity web service (via the RCSB PDB or its host institution's website). Upload your PDB file or provide a PDB ID.
- Analysis Execution: The server will automatically run its suite of validation checks. This process typically takes a few minutes.
- Interpretation of Results: Review the generated report, which includes:
- A summary page with key statistics (MolProbity score, clashscore, Ramachandran plot statistics, and rotamer outliers).
- Detailed tables and interactive graphics for outliers.
- Visualizations in molecular graphics programs like UCSC ChimeraX to guide manual model correction [86].
Table 1: Key Validation Metrics from MolProbity and Their Target Values for a High-Quality Model.
| Metric | Description | Ideal Value for a High-Resolution Structure |
|---|---|---|
| MolProbity Score | Composite score combining clash, rotamer, and Ramachandran data | ≤ 1.0 (≈ 100th percentile) |
| Clashscore | Number of serious atom overlaps per 1000 atoms | ≤ 5 (≈ 100th percentile) |
| Ramachandran Favored | % of residues in most favorable phi/psi regions | > 98% |
| Ramachandran Outliers | % of residues in disallowed phi/psi regions | 0% |
| Rotamer Outliers | % of side chains in unlikely conformations | < 1% |
| Cβ Deviation | Deviation of Cβ atom from its ideal position | > 0.25 Å suggests a problem |
Diagram 1: The MolProbity analysis workflow. The process begins with adding hydrogen atoms, proceeds through multiple parallel validation checks, and integrates the results into a final composite score and report.
The wwPDB Validation Report
The wwPDB validation report is the official document generated during the deposition process to the Protein Data Bank. It provides a comprehensive assessment of the deposited structure, evaluating both the quality of the experimental data and the constructed model. Its purpose is to ensure that all entries in the PDB meet a consistent standard of quality [86] [88].
Report Structure and Key Components
The report is structured into several key sections, providing a layered overview of the structure's quality:
- Overview and Executive Summary: This section provides a succinct summary of the entry's content and key quality indicators. It is designed to quickly alert depositors to any serious issues with the structure [88].
- Model Quality Assessment: For atomic models derived from X-ray crystallography, this section heavily relies on MolProbity analysis. It reports on bond length and angle deviations from ideal geometry (both as RMS Z-scores), chirality errors, sidechain planarity, and the suite of MolProbity metrics (clashscore, Ramachandran, and rotamer) [86] [88].
- Data Quality Assessment: This part evaluates the quality of the experimental X-ray diffraction data. Key metrics include the Rwork/Rfree values, the completeness of the data, and the signal-to-noise ratio (I/σ(I)) at various resolution shells. The report also checks for issues like twinning or anisotropy in the diffraction data.
- Fit to Data Used for Modeling: This section assesses how well the final atomic model explains the experimental X-ray data. The key metric here is the real-space correlation coefficient (RSCC) and real-space R-value (RSR) for individual atoms and residues, which helps identify regions where the model may poorly fit the electron density [86].
Protocol for Accessing and Interpreting the Report
- Deposition: The report is generated automatically during the structure deposition process to the PDB. Depositors receive a private link to the report.
- Pre-Deposition Validation: Researchers can use the OneDep system or stand-alone Validation-pack software to run the wwPDB validation pipeline on their structure before formal deposition, allowing them to identify and correct issues proactively [86].
- Interpreting the Results: For each metric, the report provides the calculated value and a percentile ranking compared to all X-ray structures of similar resolution in the PDB. A percentile of 100 is the best possible score. Depositors should aim for metrics that fall within the "Better" or "Expected" ranges, as defined by the report's color-coding (typically green and yellow). Any metric in the "Outlier" range (typically red) warrants investigation and potential model correction.
Table 2: Key Metrics in a wwPDB Validation Report for an X-ray Structure.
| Metric Category | Specific Metric | Interpretation and Target |
|---|---|---|
| Model Geometry | RMSD Bonds | RMS Z-score should be close to 1.0. |
| RMSD Angles | RMS Z-score should be close to 1.0. | |
| Ramachandran Outliers | Target is 0%. >0.5% may need review. | |
| Clashscore | Lower is better. Aim for <5-10, depending on resolution. | |
| Data & Model Fit | Rwork / Rfree | Should be close, with Rfree not >5% above Rwork. |
| Real-space Correlation (RSCC) | Value of 1.0 is perfect fit. <0.8 suggests poor density fit. | |
| Overall Quality | Overall Score Percentile | A composite score; higher percentile is better. |
Integrated Validation Workflow for a Crystallography Project
A robust validation strategy integrates both MolProbity and the wwPDB protocols throughout the final stages of structure determination, rather than treating them as a final box-ticking exercise. The following workflow is recommended for researchers.
Diagram 2: The iterative model improvement cycle. Validation is used to identify problems, which are fixed manually and through refinement, followed by re-validation until model quality is satisfactory.
- Iterative Model Improvement: After initial refinement, run MolProbity to identify the most pressing issues—severe clashes, Ramachandran outliers, and rotamer outliers. Use model-building software like Coot to manually correct these issues [89]. This is followed by cycles of refinement and re-validation until all major issues are resolved.
- Pre-Deposition Check: Before finalizing the structure, run the full wwPDB validation-pack to generate a report identical to the one that will be created upon deposition. This allows for a final review and correction of any remaining outliers, particularly those related to the fit of the model to the electron density map (RSCC/RSR).
- Deposition and Final Report Analysis: Submit the structure to the PDB. Carefully review the final validation report provided by the wwPDB. Be prepared to explain any outliers in the "Annotation" section of the deposition, providing a justification based on biological reality or experimental evidence.
Table 3: Key Software and Resources for Structure Validation and Refinement.
| Resource Name | Type | Primary Function in Validation |
|---|---|---|
| MolProbity [84] | Web Service / Standalone | All-atom contact analysis, clashscore, Ramachandran, and rotamer validation. |
| wwPDB Validation Server [86] | Web Service | Official pre-deposition and deposition validation report generation. |
| Coot [89] | Software | Interactive model building, fitting, and correction of validation outliers. |
| PHENIX [89] | Software Suite | Comprehensive structure solution and refinement, often integrated with MolProbity. |
| REFMAC [89] | Software | Macromolecular refinement program within the CCP4 suite. |
| Validation-pack [86] | Software | Stand-alone version of the wwPDB validation pipeline for local use. |
| UCSF ChimeraX [86] | Software | Molecular visualization, often used to view and interpret MolProbity results. |
| PROMOTIF | Algorithm | Analyzes protein structural motifs and backbone geometry [86]. |
Within structural biology, two experimental techniques stand as pillars for determining the three-dimensional structures of proteins at atomic resolution: X-ray crystallography and Nuclear Magnetic Resonance (NMR) spectroscopy [90]. Together, these methods are responsible for the vast majority of structures deposited in the Protein Data Bank (PDB). However, they probe the structure of biological macromolecules under fundamentally different conditions. X-ray crystallography typically provides a detailed snapshot of a protein in the solid state (crystalline environment), while NMR spectroscopy elucidates the structure and dynamics of proteins in solution or near-physiological conditions [90]. This fundamental difference in the phase of the sample—solid state versus solution—is critical as it can influence the conformational details of the resulting structure. The choice between these techniques often depends on the biological question being asked, the nature of the protein under investigation, and the resources available. This guide provides a systematic comparison of these two powerful methods, framed within the basic principles of protein X-ray crystallography research, to aid researchers, scientists, and drug development professionals in selecting and interpreting structural data.
Fundamental Principles and Methodologies
X-ray Crystallography: Principles of Solid-State Analysis
X-ray crystallography is currently the most favoured technique for structure determination of proteins and biological macromolecules [19]. The fundamental aim is to obtain a three-dimensional molecular structure from a crystal [19]. The technique is based on the diffraction of X-rays by the electron clouds of atoms within a crystalline lattice [91]. When a crystal is exposed to a collimated beam of X-rays, the rays interact with the electrons, leading to constructive and destructive interference that produces a detectable diffraction pattern [91]. The relationship between the diffraction pattern and the crystal structure is described by Bragg's Law: nλ = 2d sinθ, where λ is the wavelength of the incident X-rays, d is the distance between crystal planes, θ is the angle of incidence, and n is an integer [18] [91]. The intensities of the diffracted beams are measured to determine the "structure factors," from which a map of the electron density can be calculated [19]. This electron density map is then used to build an atomic model of the protein, which is iteratively refined to fit the experimental data [19] [91].
NMR Spectroscopy: Principles of Solution-State Analysis
Protein NMR spectroscopy, in contrast, studies proteins in their native-like solution state [90]. The technique is based on the absorption of radiofrequency radiation by atomic nuclei with a non-zero spin (such as ^1^H, ^13^C, ^15^N) when placed in a strong magnetic field [92] [93]. The core principle involves exploiting the chemical shift and scalar coupling of nuclei, which are sensitive to the local chemical environment, to obtain information about interatomic distances and dihedral angles [93]. Unlike crystallography, which directly visualizes electron density, NMR derives structures by calculating three-dimensional models that satisfy a set of experimental distance and angle constraints [90]. A key advantage of NMR is its ability to study protein dynamics and conformational changes over a wide range of timescales, providing a more holistic view of protein behavior in solution [92] [93].
Experimental Protocols and Workflows
X-ray Crystallography Workflow
The process of X-ray crystallography involves a multi-step, often labor-intensive protocol [19] [18] [91].
Protein Production and Crystallization
The initial step requires a reliable source of protein and a purification protocol that yields high-quality, homogeneous, soluble material at high concentration (typically >10 mg/mL) [19] [18]. The growth of protein crystals of sufficient quality is widely considered the rate-limiting step in most protein crystallographic work [19]. The principle of crystallization is to take a concentrated protein solution and induce it to come out of solution slowly enough to form an ordered crystal lattice rather than an amorphous precipitate [19]. This is typically achieved through vapor diffusion methods (sitting or hanging drop), where a drop containing a mixture of protein and precipitant solution is equilibrated against a reservoir with a higher concentration of precipitant [19] [18]. The process involves screening numerous variables including precipitant type and concentration, buffer, pH, protein concentration, and temperature [19]. For diffraction analysis, crystals usually need to be a minimum of 0.1 mm in their longest dimension [19].
Data Collection and Processing
The crystal is mounted on a goniometer and exposed to a collimated, monochromatic X-ray beam [19]. X-rays can be generated from a laboratory source (e.g., copper anode) or from the much more intense synchrotron storage ring [19]. The resulting diffraction pattern is captured by a detector, with modern experiments typically using Charge-Coupled Device (CCD) detectors or pixel array detectors for rapid readout [19]. The diffraction pattern is processed to determine the unit cell dimensions (the repeating unit in the crystal) and the space group (the crystal's packing symmetry) [19]. The unit cell is defined by three lengths (a, b, c) and three angles (α, β, γ), and its size and shape determine the crystal system (triclinic, monoclinic, orthorhombic, etc.) [19].
Phasing, Model Building, and Refinement
A critical challenge in crystallography is the "phase problem"—the loss of phase information in the diffraction pattern [91]. Phasing can be solved by methods such as Molecular Replacement (using a known homologous structure), or experimental techniques like Multi-wavelength Anomalous Dispersion (MAD) or Single-wavelength Anomalous Dispersion (SAD), which utilize the anomalous scattering from incorporated heavy atoms or selenomethionine [91]. Once initial phases are obtained, an electron density map is calculated, and a molecular model is built into it [19]. This model is then iteratively refined against the diffraction data to improve the fit while ensuring the model adopts a thermodynamically favored conformation [19].
NMR Spectroscopy Workflow
The protocol for determining a protein structure by NMR spectroscopy involves a distinct set of steps focused on extracting structural constraints from spectral data [92] [93].
Sample Preparation and Data Acquisition
NMR requires a highly purified, soluble protein sample, typically at concentrations of 0.5-1 mM (or ~0.2-1 mg/mL for a 20 kDa protein) in a volume of 300-500 µL [93]. A key aspect of sample preparation for proteins is isotopic labeling with ^15^N and ^13^C, which is essential for the multi-dimensional experiments required to resolve and assign signals for all atoms [93]. Data acquisition involves recording a series of multidimensional NMR experiments (e.g., ^15^N-HSQC, ^13^C-HSQC, HNCA, CBCA(CO)NH, HNCACB, NOESY) that provide information on through-bond correlations for establishing connectivity and through-space correlations (Nuclear Overhauser Effects, NOEs) for determining distances [93].
Spectral Analysis and Structure Calculation
The complex process of resonance assignment involves systematically analyzing the multidimensional spectra to assign specific peaks to individual atoms in the protein sequence [93]. Once assignments are complete, structural constraints are extracted. The most important constraints are NOE-derived distances, which provide information on atoms that are close in space (typically <5-6 Å) [93]. Additional constraints include J-coupling constants (for dihedral angles) and residual dipolar couplings (for long-range orientational information) [93]. These constraints are used as input for computational structure calculation algorithms, which generate an ensemble of structures that all satisfy the experimental constraints [90]. The quality of the structure is assessed by the deviation from experimental constraints and the root-mean-square deviation (RMSD) among the members of the ensemble [90].
Comparative Analysis of Structural Output
Quantitative Comparison of NMR and Crystal Structures
A systematic comparison of a non-redundant dataset containing 109 NMR–X-ray structure pairs of nearly identical proteins revealed insightful trends [90].
Table 1: Systematic Quantitative Comparison of X-ray and NMR Structures [90]
| Comparison Metric | Typical Observation | Biological Implication |
|---|---|---|
| Global RMSD | Ranges from ~1.5 Å to ~2.5 Å | Structures are generally similar but show measurable differences. |
| Secondary Structure Element Match | Beta-strands match better than helices and loops. | The core fold is well-preserved; loops are more flexible. |
| Residue-Specific Variation | Hydrophobic residues are more similar than hydrophilic. | The hydrophobic core is structurally conserved; surface is variable. |
| Side Chain Conformations | Buried side chains seldom adopt different orientations. | The protein interior is rigid and similar in both environments. |
| Solvent Accessibility Correlation | Modest correlation (coefficient = 0.462) with conformational variability. | Factors beyond solvent exposure influence structural differences. |
Key Technical Differences and Their Implications
The following table summarizes the core methodological differences and their consequences for the resulting structural models.
Table 2: Core Methodological Differences Between X-ray Crystallography and NMR Spectroscopy
| Aspect | X-ray Crystallography | NMR Spectroscopy |
|---|---|---|
| Sample State | Solid (crystal) | Solution (aqueous buffer) |
| Sample Requirement | Single crystal (>0.1 mm) | ~0.3-0.5 mL, 0.5-1 mM concentration [93] |
| Probed Property | Electron density | Chemical shift, J-coupling, NOE |
| Primary Output | Single, static model | Ensemble of models (e.g., 20 structures) |
| Key Limiting Step | Crystallization [19] | Resonance assignment & data analysis [93] |
| Size Limit | Virtually unlimited (viruses, ribosomes) | Typically < ~50-100 kDa for structure determination [93] |
| Dynamic Information | Limited (requires time-resolved methods) [32] | Inherent (timescales from ps to s) [93] |
| Typical Resolution | Atomic (0.8 - 3.0 Å) | Atomic, but precision lower than high-res X-ray |
The Scientist's Toolkit: Essential Research Reagents and Materials
Successful structure determination, regardless of the method, relies on a suite of essential reagents and materials.
Table 3: Essential Research Reagent Solutions for Structural Biology
| Reagent / Material | Function | Application in X-ray | Application in NMR |
|---|---|---|---|
| Expression Vectors | High-yield protein production in host systems (E. coli, insect cells). | Mandatory for mg quantities needed for crystallization. | Mandatory for mg quantities, often with isotopic labeling. |
| Affinity Chromatography Resins | Initial purification step (e.g., Ni-NTA for His-tagged proteins). | Standard use in protein purification protocol [18]. | Standard use in protein purification protocol. |
| Crystallization Screening Kits | Sparse-matrix screens to identify initial crystallization conditions [19]. | Essential for finding initial crystal hits. | Not applicable. |
| Cryoprotectants (e.g., glycerol) | Protect crystals from ice formation during flash-cooling in liquid N₂ [19]. | Used in most modern data collection protocols. | Not applicable. |
| Isotopically Labeled Nutrients (^15N-NH₄Cl, ^13C-glucose) | Incorporate NMR-active isotopes into protein during expression. | Not required for most experiments. | Essential for multi-dimensional NMR of proteins > ~10 kDa [93]. |
| Deuterated Solvent (D₂O) | Reduces solvent proton signal in NMR experiments. | Not applicable. | Used for locking and shimming the magnet; required for observing exchangeable protons. |
Advanced and Hybrid Techniques
Time-Resolved Crystallography
Traditional crystallography provides static snapshots. However, time-resolved X-ray crystallography has been developed to capture proteins in action, creating "molecular movies" [32]. One advanced technique is Electric-field stimulated time-resolved X-ray crystallography (EFX), which uses an electrical field to trigger conformational changes in a crystal, with rapid X-ray data collection capturing intermediate states [32]. This has been successfully used to visualize ion conduction in a potassium channel in real-time [32].
Serial Crystallography
A major advancement is Serial Crystallography (SX), which uses microcrystals and involves continuously replenishing crystals in the X-ray beam [13]. At X-ray Free-Electron Lasers (XFELs), this is called Serial Femtosecond Crystallography (SFX), which uses ultra-bright femtosecond pulses to collect diffraction patterns before the crystal is destroyed by radiation damage [13]. Similar methods at synchrotrons are termed Serial Millisecond Crystallography (SMX) [13]. Sample delivery is a key focus, with methods including liquid jets and fixed-target chips aimed at reducing the massive sample consumption that was initially a barrier for these techniques [13].
Hybrid Approaches for Challenging Systems
For systems that are recalcitrant to forming large, well-ordered crystals, powder X-ray diffraction can be used, albeit with less straightforward data analysis. In such cases, the synergy with solid-state NMR and computational methods like periodic DFT calculations can be essential for solving the structure [94]. This multi-technique strategy represents the future for tackling structures of increasing complexity.
X-ray crystallography and NMR spectroscopy are complementary, rather than competing, techniques in the structural biologist's arsenal. X-ray crystallography excels at providing highly detailed, atomic-resolution structures of large complexes and proteins that can be crystallized, and it dominates the PDB in terms of the number of deposited structures [91]. Its primary limitation is the need for crystals and the potential for crystal packing forces to influence the observed conformation. NMR spectroscopy offers the unique ability to study protein structures and dynamics in a native-like solution environment, revealing conformational ensembles and functional motions, but it is generally constrained by the size of the protein and the complexity of data analysis [90] [93].
The systematic comparison shows that while the global folds determined by both methods are generally consistent, local differences do exist, particularly for surface loops and side chains [90]. These differences should not be viewed as errors but as meaningful reflections of the protein's behavior in different environments. The choice between techniques should be guided by the biological problem. For drug discovery, crystallography is often preferred for obtaining precise ligand-binding modes. For understanding intrinsic flexibility and mechanisms reliant on dynamics, NMR is unparalleled. The future of structural biology lies not in choosing one method over the other, but in integrating data from both—along with emerging techniques like cryo-EM and computational modeling—to build a comprehensive, dynamic understanding of protein function.
The field of structural biology has been transformed by the "resolution revolution" in cryo-electron microscopy (cryo-EM), enabling the determination of macromolecular structures at near-atomic resolution [95] [96]. Despite these advances, a single technique rarely provides a complete understanding of complex biological processes. Integration of multiple structural approaches has emerged as a powerful paradigm for obtaining comprehensive insights, particularly through combining the high-resolution capabilities of cryo-EM with the solution-state properties measured by small-angle X-ray scattering (SAXS) [97] [98] [99].
This technical guide explores the synergistic relationship between cryo-EM and SAXS, framed within the foundational context of protein X-ray crystallography research. While crystallography provides exquisitely detailed atomic coordinates, it requires crystallization and captures molecules in a static, crystalline environment [19] [58]. Cryo-EM bypasses the crystallization bottleneck but involves sample blotting and vitrification that can potentially induce conformational changes [99]. SAXS serves as a crucial bridge, offering validation that structures determined by cryo-EM represent the native solution state while providing unique information about flexibility and dynamics that complements high-resolution methods [98] [100].
Foundational Principles of Cryo-EM and SAXS
Cryo-Electron Microscopy: Technical Framework
Single-particle cryo-EM has emerged as a leading structural biology technique capable of determining macromolecular structures at near-atomic resolution without crystallization [95] [96]. The methodology involves:
- Sample Vitrification: Rapid plunging of samples into liquid ethane creates vitreous ice that preserves native macromolecular structures [95] [101].
- Image Acquisition: High-energy electrons interact with the electrostatic potential of frozen-hydrated specimens, producing 2D projection images [97].
- 3D Reconstruction: Computational algorithms process thousands of particle images to reconstruct a 3D Coulomb potential density map [95] [99].
Recent breakthroughs in direct electron detector technology have dramatically improved signal-to-noise ratios, enabling correction of beam-induced motion and unlocking near-atomic resolution for previously intractable targets [58]. The technique excels particularly for large macromolecular complexes, membrane proteins, and intrinsically flexible assemblies that prove challenging for crystallographic approaches [95] [58].
Small-Angle X-Ray Scattering: Solution-State Analysis
SAXS provides low-resolution structural information about macromolecules in solution under physiologically relevant conditions [98] [100]. The technique involves:
- Data Collection: Measuring the elastic scattering of X-rays at small angles (typically 0.1-5°) from biomolecules in solution [97] [100].
- Information Content: The resulting scattering curve I(q) depends on the shape and size of the scattering particle, where q is the momentum transfer vector [97] [99].
- Key Parameters: The pair-distance distribution function P(r) provides information about the maximum particle dimension (Dmax) and overall shape [97].
SAXS offers particular advantages for studying dynamic processes, conformational changes, and transient complexes that may be disrupted by crystallization or EM sample preparation [98]. The technique requires minimal sample preparation and enables high-throughput screening of multiple constructs or conditions [100].
Table 1: Technical Comparison of Cryo-EM and SAXS
| Parameter | Cryo-EM | SAXS |
|---|---|---|
| Resolution | Near-atomic to intermediate (1.5-10 Å) | Low (nanometer scale) |
| Sample State | Vitrified solution on grids | Native solution in capillary/cuvette |
| Sample Volume | 3-5 µL [101] | 10-50 µL [100] |
| Sample Concentration | 0.1-5 mg/mL [101] | 0.5-5 mg/mL [100] |
| Data Collection Time | Hours to days | Seconds to minutes |
| Information Gained | 3D Coulomb potential map | 1D scattering profile, P(r) function |
| Molecular Weight Range | >50 kDa (optimal) | 10 kDa - 100 MDa |
| Key Strengths | Atomic details, heterogeneity analysis | Solution state, dynamics, flexibility |
Synergistic Integration: Technical Complementarity
Resolution and Environment Bridge
The fundamental complementarity between cryo-EM and SAXS stems from their respective strengths in resolution and environmental context. Cryo-EM provides detailed three-dimensional structural information but involves potential perturbations during sample preparation, including adsorption to air-water interfaces, blotting forces, and vitrification [99]. SAXS captures macromolecules in their native solution environment but yields only low-resolution, one-dimensional information [98].
Integration of these techniques creates a powerful validation pipeline where SAXS confirms that cryo-EM structures represent physiological conformations [99]. The AUSAXS software package enables automated validation of EM maps using solution SAXS data without requiring atomic model building, allowing early-stage screening of cryo-EM reconstructions [99]. This approach uses a variable threshold cutoff value to generate dummy-atom models from EM maps, then calculates expected scattering curves for comparison with experimental SAXS data [99].
Addressing Flexibility and Dynamics
Many biologically essential macromolecules, particularly RNAs and multidomain proteins, exhibit significant flexibility that complicates high-resolution structure determination [101] [98]. SAXS excels at characterizing such dynamic systems through:
- Flexibility Analysis: Detecting conformational heterogeneity and ensemble distributions [98].
- Time-Resolved Studies: Capturing structural transitions in response to environmental changes or ligand binding [100].
- Stability Assessment: Screening constructs for optimal stability and monodispersity before cryo-EM analysis [98].
Cryo-EM complements these insights by potentially resolving multiple discrete conformations through advanced computational classification, though continuous flexibility remains challenging [95] [58]. For large non-coding RNAs, which are notably more flexible than proteins, SAXS provides essential information about solution behavior that guides and validates cryo-EM structural studies [101].
Practical Integration Methodologies
Experimental Workflows for Combined Analysis
Two primary experimental frameworks have emerged for integrating cryo-EM and SAXS:
Parallel Analysis Workflow:
SAXS-EM Integration Workflow
SEC-SAXS to Cryo-EM Pipeline: Size-exclusion chromatography coupled SAXS (SEC-SAXS) represents a particularly powerful approach for cryo-EM sample validation [98]. This method:
- Separates heterogeneous samples immediately before SAXS measurement
- Ensures analysis of monodisperse fractions
- Identifies optimal conditions for cryo-EM grid preparation
- Validates that cryo-EM structures represent the major solution population [98] [99]
SEC-SAXS has proven invaluable for characterizing challenging systems including flexible ribonucleoproteins, dynamic complexes, and multi-domain proteins with inherent conformational heterogeneity [101] [98].
Computational Integration Approaches
SAXS-Based EM Map Validation: The AUSAXS method enables quantitative validation through several computational steps [99]:
- Model Generation: Convert EM maps to dummy-atom models using threshold cutoffs
- Hydration Shell Addition: Simulate solvent layers around the molecular surface
- Scattering Calculation: Compute theoretical SAXS profiles using the Debye equation
- Goodness-of-Fit Assessment: Compare theoretical and experimental data using χ² statistics
This approach identifies the optimal threshold value that best represents the solution structure, providing a crucial quality metric for EM maps [99].
Abel Transform Correlation Method: For data compatibility assessment before full reconstruction, the Abel transform relates the 2D correlation of EM images to SAXS data [97]. This method:
- Works without image alignment or 3D reconstruction
- Uses translation-invariance of correlation functions
- Enables rapid verification that SAXS and EM data correspond to the same structure [97]
Table 2: Research Reagent Solutions for Integrated Structural Biology
| Reagent/Resource | Function | Application Context |
|---|---|---|
| Microfluidic Chips | Automated mixing and spray deposition | Time-resolved cryo-EM (trCryo-EM) [95] |
| SEC Columns | Size-based separation of complexes | SEC-SAXS for sample homogeneity [98] |
| Vitrification Systems | Rapid plunging for vitreous ice formation | Cryo-EM grid preparation [95] [101] |
| Direct Electron Detectors | High-sensitivity electron detection | High-resolution cryo-EM data collection [58] |
| Synchrotron Beamlines | High-intensity X-ray sources | SAXS data collection with millisecond resolution [100] |
| Hydration Layer Models | Explicit solvent representation | SAXS profile calculation from EM maps [99] |
Applications in Challenging Biological Systems
Large Non-Coding RNAs and Ribonucleoproteins
Large non-coding RNAs represent particularly challenging targets for structural biology due to their flexibility and limited structural stability [101]. While cryo-EM has determined numerous ribonucleoprotein structures, protein-free RNA structures remain significantly underrepresented, with only 160 determined by cryo-EM compared to 25,892 protein and protein-nucleic acid structures [101].
Integrated cryo-EM/SAXS approaches have enabled structural characterization of group II intron ribozymes in multiple folding states [101]. SAXS provides essential information about solution conformation and dynamics that guides cryo-EM grid preparation and validates resulting structures. The technique is particularly valuable for identifying biochemical conditions that promote conformational homogeneity while maintaining biological activity [101].
Membrane Proteins and Dynamic Complexes
Membrane proteins and highly dynamic complexes often resist crystallization or adopt non-physiological conformations in crystalline environments [58]. Cryo-EM has revolutionized membrane protein structural biology, while SAXS provides critical validation of solution behavior and detergent compatibility [98] [58].
Time-resolved SAXS (TR-SAXS) can capture large-scale conformational changes in response to ligands or environmental stimuli, providing functional context for cryo-EM snapshots [100]. This combination has proven particularly powerful for studying:
- G protein-coupled receptors (GPCRs) in multiple signaling states
- Ion channel gating mechanisms
- Membrane transporter cycles [98] [58]
Pharmaceutical and Nanostructure Applications
In drug development, SAXS and cryo-EM provide complementary insights for characterizing therapeutic nanostructures including [98]:
- Liposomes and Lipid Nanoparticles (LNPs): SAXS determines bilayer thickness, vesicle size, and internal organization, while cryo-EM visualizes structural details
- Protein-Drug Conjugates: SAXS monitors solution behavior and stability, while cryo-EM reveals binding sites and conformational impacts
- Antibody Therapeutics: SAXS assesses solution properties and aggregation state, informing cryo-EM grid preparation
The combination enables comprehensive structural characterization from early discovery through formulation and quality control [98].
Technical Protocols and Best Practices
Integrated Sample Preparation Protocol
RNA Structural Characterization (Adapted from [101]):
Native Purification:
- Transcribe RNA under native conditions using T7 polymerase
- Remove template DNA with Turbo DNase and proteins with proteinase K
- Buffer exchange into cryo-EM compatible buffer (e.g., 10 mM MgCl₂, 5 mM Na-MES pH 6.5)
Biophysical Characterization:
- Perform SEC-MALLS to assess monodispersity
- Conduct mass photometry to verify oligomeric state
- Collect SAXS data to evaluate solution conformation
Grid Preparation Optimization:
- Test multiple blot conditions (time, force) to optimize ice thickness
- Screen sample concentrations (0.1-2 μM for RNAs)
- Use glow-discharged carbon films for improved adhesion
Cross-Validation:
- Compare SAXS profiles from solution samples and grid supernatants
- Validate cryo-EM maps against SAXS data using AUSAXS [99]
- Iterate preparation conditions until solution and vitrified structures converge
SAXS-EM Data Compatibility Assessment
Abel Transform Method (Adapted from [97]):
SAXS Data Processing:
- Calculate pair-distance distribution function P(r) from scattering data I(q)
- Determine maximum dimension Dmax and radius of gyration Rg
EM Image Analysis:
- Compute 2D correlation functions of raw EM images
- Average correlation functions across image dataset
Compatibility Verification:
- Apply Abel transform to relate EM correlation functions to SAXS data
- Assess consistency through statistical comparison
- Flag potential discrepancies before proceeding with full 3D reconstruction
SAXS Validation of EM Maps
The integration of cryo-EM and SAXS represents a growing trend in structural biology toward hybrid methodologies that leverage complementary strengths [95] [98] [99]. Future developments will likely include:
- Increased Automation: Streamlined pipelines for simultaneous data collection and analysis
- Time-Resolved Correlations: Microfluidic devices enabling matched time-resolved cryo-EM and SAXS studies [95]
- Machine Learning Integration: AI-driven methods for extracting maximum information from complementary datasets [58]
- Standardized Validation Metrics: Community-wide adoption of SAXS validation as a routine quality control for EM maps [99]
For researchers schooled in protein X-ray crystallography, integrating cryo-EM and SAXS provides a powerful extended toolkit that addresses fundamental limitations of crystalline samples while building upon crystallography's rich history of high-resolution structure determination [96] [19] [58]. The complementary nature of these techniques enables a more complete understanding of macromolecular structure and dynamics, ultimately advancing drug discovery and fundamental biological knowledge [98] [58].
Conclusion
Protein X-ray crystallography remains an indispensable tool in structural biology, providing the atomic-resolution details that underpin modern drug discovery and mechanistic studies. Its power is harnessed through a rigorous workflow, from overcoming the practical challenge of crystallization to solving the fundamental phase problem. The resulting structures are only as valuable as their quality, necessitating stringent validation against experimental data and ideal geometry. When combined with insights from complementary techniques like NMR and Cryo-EM, crystallographic data offers a more complete understanding of protein structure and dynamics. Future directions point toward increased integration with computational predictions like AlphaFold, the use of X-ray free-electron lasers (XFELs) to study dynamic processes, and an ever-greater role in designing the next generation of therapeutics to combat complex diseases.
References
- 1. Preparing for successful protein crystallization experiments [https://pmc.ncbi.nlm.nih.gov/articles/PMC12210191/]
- 2. Protein crystallization: Eluding the bottleneck of X-ray crystallography - PMC [https://pmc.ncbi.nlm.nih.gov/articles/PMC5645037/]
- 3. Protein Crystallization for X-ray Crystallography - PMC [https://pmc.ncbi.nlm.nih.gov/articles/PMC3182643/]
- 4. Room-temperature X-ray fragment screening with serial ... [https://www.nature.com/articles/s41467-025-64918-6]
- 5. Efficiency analysis of sampling protocols used in protein ... [https://www.sciencedirect.com/science/article/abs/pii/S002202480101154X]
- 6. Protein Crystallization Software - ROCK MAKER® [https://formulatrix.com/protein-crystallization-systems/rock-maker-protein-crystallization-software/]
- 7. XRD Explained: Principles, Analysis & Applications [https://www.technologynetworks.com/analysis/articles/x-ray-diffraction-xrd-xrd-principle-xrd-analysis-and-applications-404260]
- 8. X-Ray Diffraction Basics | Chemical Instrumentation Facility [https://www.cif.iastate.edu/services/acide/xrd-tutorial/xrd]
- 9. X-ray crystallography - Latest research and news [https://www.nature.com/subjects/x-ray-crystallography]
- 10. X-ray Diffraction: Principles, Applications of XRD Analysis [https://gnr.it/blog/x-ray-diffraction-principles-techniques-and-applications-of-xrd-analysis/]
- 11. Principles and Techniques of X-Ray Diffraction (XRD) [https://universallab.org/blog/principles_and_techniques_of_x_ray_diffraction]
- 12. XRD Basics [https://www.physics.upenn.edu/~heiney/datasqueeze/basics.html]
- 13. Sample delivery methods for protein X-ray crystallography ... [https://www.nature.com/articles/s41467-025-65173-5]
- 14. Investigation of metallodrug/protein interaction by X-ray ... [https://pubs.rsc.org/en/content/articlehtml/2025/qi/d4qi03277b]
- 15. Phase problem [https://en.wikipedia.org/wiki/Phase_problem]
- 16. Introduction to phasing - PMC [https://pmc.ncbi.nlm.nih.gov/articles/PMC2852296/]
- 17. Common Problems in Protein X-ray Crystallography and ... [https://www.creative-biostructure.com/resource-common-problems-protein-xray-crystallography.htm?srsltid=AfmBOookuuwJD1m933vfQpdP5gnWxxBFcHVM_gnXYhk8CKgz2PfdJ5ME]
- 18. X-ray Protein Crystallography [https://phys.libretexts.org/Courses/University_of_California_Davis/Biophysics_200A%3A_Current_Techniques_in_Biophysics/X-ray_Protein_Crystallography]
- 19. x Ray crystallography - PMC - PubMed Central - NIH [https://pmc.ncbi.nlm.nih.gov/articles/PMC1186895/]
- 20. A deep learning solution for crystallographic structure ... [https://pmc.ncbi.nlm.nih.gov/articles/PMC10324481/]
- 21. Crystallography Technique: Experimental phasing [https://rigaku.com/products/crystallography/techniques/experimental-phasing-method]
- 22. A quantum crystallographic protocol for general use [https://www.nature.com/articles/s41598-025-96400-0]
- 23. AI Learns to Uncover the Hidden Atomic Structure of Crystals [https://www.engineering.columbia.edu/about/news/ai-learns-uncover-hidden-atomic-structure-crystals]
- 24. (IUCr) X-ray electron density analysis of chemical bonding in ... [https://journals.iucr.org/m/issues/2025/06/00/fc5084/]
- 25. A Beginner's Guide to Protein Crystallography [https://www.creative-biostructure.com/protein-crystallography-452.htm?srsltid=AfmBOopUrFVqaQKB9XgYffGuvPk7BVs1MbT503qN3mDPtaihhg-5y6cP]
- 26. Protein Structure Analysis and Validation with X-Ray ... [https://pubmed.ncbi.nlm.nih.gov/33128762/]
- 27. Collection of X-ray diffraction data from macromolecular crystals [https://pmc.ncbi.nlm.nih.gov/articles/PMC5557013/]
- 28. Protein Crystallography | Discovery Research Platform for ... [https://biology.ed.ac.uk/drp/structural-biology-core/protein-crystallography]
- 29. X-ray crystallography - Structural Biology Core [https://www.mayo.edu/research/core-resources/structural-biology-core/services/x-ray-crystallography]
- 30. Methods for Determining Atomic Structures - PDB-101 [https://pdb101.rcsb.org/learn/guide-to-understanding-pdb-data/methods-for-determining-structure]
- 31. X-ray crystallography in drug discovery [https://pubmed.ncbi.nlm.nih.gov/20694684/]
- 32. New x-ray technology captures proteins in motion [https://biologicalsciences.uchicago.edu/news/new-x-ray-technology-captures-proteins-motion]
- 33. X-ray Crystallography [https://chem.libretexts.org/Bookshelves/Analytical_Chemistry/Supplemental_Modules_(Analytical_Chemistry)/Instrumentation_and_Analysis/Diffraction_Scattering_Techniques/X-ray_Crystallography]
- 34. Protein Crystallization Market Report 2025: Projected $2.8 [https://www.globenewswire.com/news-release/2025/06/24/3104062/28124/en/Protein-Crystallization-Market-Report-2025-Projected-2-8-Billion-Growth-by-2029.html]
- 35. X-ray data processing - PMC - PubMed Central [https://pmc.ncbi.nlm.nih.gov/articles/PMC5629563/]
- 36. Assessing the Quality of 3D Structures [https://www.rcsb.org/docs/general-help/assessing-the-quality-of-3d-structures]
- 37. Experimentally-Driven Protein Structure Modeling - PMC [https://pmc.ncbi.nlm.nih.gov/articles/PMC7214187/]
- 38. Structure-Based Functional Design of Drugs: From Target ... [https://pmc.ncbi.nlm.nih.gov/articles/PMC3644978/]
- 39. Structure-based molecular modeling in SAR analysis and ... [https://www.sciencedirect.com/science/article/pii/S2001037021000696]
- 40. Pushing the boundaries of Structure-Based Drug Design ... [https://arxiv.org/html/2503.01376v1]
- 41. A structure-based framework for selective inhibitor design ... [https://www.nature.com/articles/s42003-025-07840-3]
- 42. May 2025 Newsletter - Helix Biostructures [https://www.helixbiostructures.com/news/may-2025-newsletter]
- 43. Serial-femtosecond crystallography reveals how a ... - PubMed [https://pubmed.ncbi.nlm.nih.gov/40435264/]
- 44. Fragment‐based drug discovery—the importance of high ... [https://pmc.ncbi.nlm.nih.gov/articles/PMC9627785/]
- 45. Bibliometrics Analysis and Knowledge Mapping of Fragment ... [https://pmc.ncbi.nlm.nih.gov/articles/PMC12106911/]
- 46. Protein X-ray Crystallography: Principles of the Technique [https://www.proteinstructures.com/protein-crystallography-basics/]
- 47. Bragg's law [https://en.wikipedia.org/wiki/Bragg%27s_law]
- 48. Fragment Based Drug Discovery Market [https://www.transparencymarketresearch.com/fragment-based-drug-discovery-market.html]
- 49. X-ray Crystallography [https://www.creativebiomart.net/resource/principle-protocol-x-ray-crystallography-393.htm]
- 50. Protein XRD Protocols - X-ray Diffraction Data Collection [https://sites.google.com/colgate.edu/xrd-protocols/home/x-ray-diffraction-data-collection]
- 51. Critical assessment of AI-based protein structure prediction [https://www.sciencedirect.com/science/article/pii/S2950363925000353]
- 52. Specialty grand challenges in theoretical modeling, ... [https://www.frontiersin.org/journals/chemical-biology/articles/10.3389/fchbi.2025.1635423/full]
- 53. X-ray Crystallography [https://selvita.com/drug-discovery/small-molecules/expertise-areas/protein-sciences/x-ray-crystallography]
- 54. Opportunities and Challenges in Protein Crystallography [https://www.mdpi.com/journal/molecules/special_issues/VW8HUP1L23]
- 55. Hurdles and advancements in experimental membrane ... [https://pubmed.ncbi.nlm.nih.gov/41027549/]
- 56. Interpretable X-ray diffraction spectra analysis using ... [https://www.nature.com/articles/s41524-025-01743-x]
- 57. Phase seeding may provide a gateway to structure solution by ... [https://journals.iucr.org/a/issues/2025/04/00/me6332/]
- 58. High-resolution protein modeling through Cryo-EM and AI [https://pmc.ncbi.nlm.nih.gov/articles/PMC12590954/]
- 59. The young person's guide to the PDB - PMC [https://pmc.ncbi.nlm.nih.gov/articles/PMC5610703/]
- 60. (IUCr) Radiation damage in macromolecular crystallography [https://journals.iucr.org/paper?ba5150]
- 61. A beginner's guide to radiation damage - PMC - PubMed Central [https://pmc.ncbi.nlm.nih.gov/articles/PMC2651760/]
- 62. Room-temperature X-ray fragment screening with serial ... [https://pubmed.ncbi.nlm.nih.gov/41083451/]
- 63. Investigating discontinuous X-ray irradiation as a damage ... [https://pubs.rsc.org/en/content/articlelanding/2025/cp/d5cp00089k]
- 64. Crystal Dehydration in Membrane Protein Crystallography [https://pmc.ncbi.nlm.nih.gov/articles/PMC6126552/]
- 65. Dehydration-Induced Space Group Transition Triggers ... [https://www.mdpi.com/2073-4352/15/8/674]
- 66. Dehydration Converts DsbG Crystal Diffraction from Low to ... [https://www.sciencedirect.com/science/article/pii/S0969212603000054]
- 67. The phase-seeding method for solving non ... [https://pmc.ncbi.nlm.nih.gov/articles/PMC12053495/]
- 68. DESY scientists advance drug development with room- ... [https://desy.de/desy_latest_news/2025/hiphax/index_eng.html]
- 69. Sample delivery methods for protein X-ray crystallography ... [https://pubmed.ncbi.nlm.nih.gov/41203635/]
- 70. Instrumentation and methods for efficient time-resolved X-ray ... [https://pubmed.ncbi.nlm.nih.gov/40277177/]
- 71. AI-Based Crystal Scoring: Enhancing Crystallization Results [https://formulatrix.com/advancements-in-automated-scoring-of-crystallization-experiments-by-formulatrix/]
- 72. Room-temperature X-ray fragment screening with serial ... [https://pmc.ncbi.nlm.nih.gov/articles/PMC12518807/]
- 73. Protein Crystallography Services [https://www.saromics.com/x-ray-crystallography-services/]
- 74. The future of crystallography in drug discovery - PMC - NIH [https://pmc.ncbi.nlm.nih.gov/articles/PMC4106240/]
- 75. A comprehensive approach to X-ray crystallography for ... [https://www.sciencedirect.com/science/article/pii/S1740674920300214]
- 76. Quality of X-ray Structures [https://proteinstructures.com/experimental/structure-quality/]
- 77. R-factor (crystallography) - Wikipedia [https://en.wikipedia.org/wiki/R-factor_(crystallography)]
- 78. To B or not to B: a question of resolution? - PMC [https://pmc.ncbi.nlm.nih.gov/articles/PMC3322606/]
- 79. The R-factor gap in macromolecular crystallography: an untapped potential for insights on accurate structures - PMC [https://pmc.ncbi.nlm.nih.gov/articles/PMC4282448/]
- 80. Stereochemistry and Validation of Macromolecular Structures [https://pmc.ncbi.nlm.nih.gov/articles/PMC5560084/]
- 81. A fresh look at the Ramachandran plot and the occurrence of ... [https://pmc.ncbi.nlm.nih.gov/articles/PMC3061398/]
- 82. Revisiting the Ramachandran plot based on statistical ... [https://www.sciencedirect.com/science/article/abs/pii/S1047847723000023]
- 83. Analysing and evaluating macromolecular models [https://www.ebi.ac.uk/training/online/courses/analysing-evaluating-macromolecular-models/global-quality-assessment/key-global-validation-metrics/metrics-based-on-stereochemistry/]
- 84. Structure Validation and Quality [https://www.rcsb.org/docs/additional-resources/structure-validation-and-quality]
- 85. Protein X-ray Crystallography and Drug Discovery [https://www.mdpi.com/1420-3049/25/5/1030]
- 86. User guide to the wwPDB EM validation reports [http://www.wwpdb.org/validation/2017/EMValidationReportHelp]
- 87. Protein structure validation by generalized linear model ... [https://pmc.ncbi.nlm.nih.gov/articles/PMC3324767/]
- 88. PDB-IHM Validation Report [https://pdb-ihm.org/validation_help.html]
- 89. Crystallography Software [https://www.rcsb.org/docs/additional-resources/crystallography-software]
- 90. Systematic Comparison of Crystal and NMR Protein ... [https://pmc.ncbi.nlm.nih.gov/articles/PMC3032220/]
- 91. Comparison of X-ray Crystallography, NMR and EM [https://www.creative-biostructure.com/comparison-of-crystallography-nmr-and-em_6.htm?srsltid=AfmBOooV-w4-cPSDod840Ipdy7Nv0fJ5QCFHSCN4ONlTlqG8aeJDOu71]
- 92. Protein NMR Spectroscopy - 2nd Edition [https://shop.elsevier.com/books/protein-nmr-spectroscopy/cavanagh/978-0-12-164491-8]
- 93. Protein NMR Spectroscopy [https://www.sciencedirect.com/book/9780121644918/protein-nmr-spectroscopy]
- 94. analysis of powder X-ray diffraction data, guided by solid ... [https://www.sciencedirect.com/org/science/article/pii/S2041652017004187]
- 95. Integrative approaches in cryogenic electron microscopy [https://pmc.ncbi.nlm.nih.gov/articles/PMC7829201/]
- 96. X-rays in the Cryo-EM Era: Structural Biology's Dynamic Future [https://pmc.ncbi.nlm.nih.gov/articles/PMC5999524/]
- 97. Cross-Validation of Data Compatibility Between Small ... [https://pmc.ncbi.nlm.nih.gov/articles/PMC5220572/]
- 98. White Paper: Small-Angle X-ray Scattering (SAXS) [https://www.helixbiostructures.com/white-paper/small-angle-x-ray-scattering-saxs-applications-in-protein-rna-dna-and-nanostructure-analysis]
- 99. Validation of electron-microscopy maps using solution ... [https://journals.iucr.org/paper?wan5003]
- 100. Solution X-ray Scattering (SAXS) [https://www.berstructuralbioportal.org/solution-x-ray-scattering-saxs/]
- 101. Cryo-specimen preparation and imaging of highly-structured ... [https://bmcmethods.biomedcentral.com/articles/10.1186/s44330-025-00045-4]