Rapid Antigen Tests vs. RT-PCR: A Comprehensive 2025 Performance Analysis for Clinical Research
This article provides a systematic evaluation of the comparative diagnostic performance of SARS-CoV-2 rapid antigen tests (RATs) and real-time reverse transcription polymerase chain reaction (RT-PCR).
Rapid Antigen Tests vs. RT-PCR: A Comprehensive 2025 Performance Analysis for Clinical Research
Abstract
This article provides a systematic evaluation of the comparative diagnostic performance of SARS-CoV-2 rapid antigen tests (RATs) and real-time reverse transcription polymerase chain reaction (RT-PCR). For researchers and drug development professionals, we synthesize current evidence on RAT sensitivity, specificity, and predictive values across different viral loads, variants, and clinical scenarios. The analysis covers foundational principles, methodological applications in real-world settings, strategies for troubleshooting performance limitations, and validation through manufacturer-independent studies. Evidence confirms that while RATs offer operational advantages of speed and accessibility, their significantly lower sensitivity compared to the RT-PCR gold standard necessitates a context-dependent application, particularly in low-prevalence settings or for early infection detection.
Understanding the Core Technologies: Principles and Performance Benchmarks of Antigen and Molecular Tests
The accurate and timely detection of pathogenic agents represents a cornerstone in the effective management and control of infectious diseases. The COVID-19 pandemic, caused by the novel coronavirus SARS-CoV-2, has underscored the critical importance of reliable diagnostic tools for containing disease spread and guiding clinical interventions. Two principal laboratory diagnostic methodologies have emerged as pivotal technologies: antigen detection via immunoassay and nucleic acid amplification via reverse transcription-polymerase chain reaction (RT-PCR). These techniques operate on fundamentally different biological principles, offering distinct advantages and limitations in sensitivity, specificity, turnaround time, and operational requirements.
This comparative analysis examines the fundamental mechanisms underlying these diagnostic approaches, evaluates their performance characteristics based on recent clinical studies, and discusses their appropriate applications within clinical and public health contexts. The objective is to provide researchers, scientists, and drug development professionals with a comprehensive, evidence-based guide for test selection and implementation within their specific operational frameworks and diagnostic objectives.
Fundamental Mechanisms and Technical Principles
Antigen Detection via Immunoassay
Antigen detection assays are designed to identify the presence of specific viral proteins, typically the nucleocapsid (N) or spike (S) proteins of SARS-CoV-2. The core principle relies on antibody-antigen interactions, where labeled antibodies bind specifically to target viral antigens present in clinical specimens.
Key Mechanism Steps:
- Sample Preparation: Nasopharyngeal or nasal swab samples are collected and placed in viral transport media or specific extraction buffers. The sample may be treated to disrupt viral particles and release internal antigens.
- Antigen-Antibody Binding: The prepared sample is applied to a test platform containing immobilized capture antibodies specific to SARS-CoV-2 antigens. If viral antigens are present, they form complexes with the capture antibodies.
- Signal Generation and Detection: A labeled detection antibody (conjugated to enzymes, fluorescent tags, or colored particles) binds to the captured antigen, forming a "sandwich" complex. Unbound components are washed away. The signal is generated through:
- Chromogenic substrates that produce visible lines (lateral flow assays)
- Chemiluminescence where enzyme-substrate reactions emit light (CLIA)
- Electrochemiluminescence where electrochemical reactions trigger light emission (ECLIA)
Technical Variations:
- Lateral Flow Immunoassays (LFIA): Simple, rapid tests providing visual results within 15-30 minutes, suitable for point-of-care settings [1].
- Automated Immunoassays: Utilize chemiluminescence (CLIA) or electrochemiluminescence (ECLIA) technology on automated platforms (e.g., Lumipulse, VITROS, Elecsys), offering semi-quantitative results with enhanced sensitivity and throughput in laboratory settings [2] [3] [4].
Nucleic Acid Detection via RT-PCR
Reverse Transcription-Polymerase Chain Reaction (RT-PCR) represents the gold standard for molecular detection of SARS-CoV-2, targeting specific sequences of the viral RNA genome through enzymatic amplification.
Key Mechanism Steps:
- Viral RNA Extraction: Viral particles in the specimen are lysed, and viral RNA is purified from other sample components using magnetic bead or column-based extraction methods to remove potential inhibitors.
- Reverse Transcription: The single-stranded RNA genome is reverse transcribed into complementary DNA (cDNA) using reverse transcriptase enzymes.
- Target Amplification: The cDNA undergoes exponential amplification through repeated temperature cycles (denaturation, annealing, extension) in the presence of:
- Sequence-specific primers that flank the target region (e.g., N, E, RdRp, ORF1ab genes)
- Fluorogenic probes (TaqMan) that bind specifically to the target sequence and emit fluorescence upon cleavage
- Real-Time Detection: Fluorescence intensity is measured after each amplification cycle. The cycle threshold (Ct) value is determined as the number of cycles required for the signal to exceed a background threshold, providing an inverse correlation with viral load [1] [5].
Technical Variations:
- Conventional RT-PCR: Requires post-amplification processing and detection.
- Real-Time RT-PCR (qRT-PCR): Enables simultaneous amplification and detection, providing quantitative results and reduced contamination risk.
- Automated NAAT Systems: Integrated platforms (e.g., Xpert Xpress, FilmArray) that streamline extraction, amplification, and detection in self-contained cartridges, reducing hands-on time and operational complexity [5].
Comparative Performance Analysis
Clinical evaluations across diverse populations and settings have demonstrated significant differences in the diagnostic performance of antigen and RT-PCR assays.
Table 1: Overall Diagnostic Performance of Antigen Tests Versus RT-PCR
| Study & Platform | Sensitivity (%) | Specificity (%) | Sample Size (N) | Population |
|---|---|---|---|---|
| Standard Q Ag Test [1] | 98.33 | 98.73 | 454 | Symptomatic & asymptomatic |
| VITROS CLIA [2] | 73.47 | 100.00 | 148 | Symptomatic & asymptomatic |
| Zydus RAT [6] | 75.17 | 98.89 | 329 | Symptomatic & asymptomatic |
| Roche Elecsys ECLIA [4] | 72.40 | 95.00 | 170 | Suspected COVID-19 |
| Quidel Sofia FIA [7] | 72.10 (Symptomatic) 60.50 (Asymptomatic) | 98.70 (Symptomatic) 99.50 (Asymptomatic) | 2,039 | Hospital admissions |
| PCL Saliva RAT [8] | 67.00 | 75.00 | 320 | Suspected COVID-19 |
RT-PCR consistently demonstrates superior analytical sensitivity, capable of detecting minute quantities of viral RNA (as low as 100 copies/μL) [4]. In contrast, antigen tests exhibit substantially variable sensitivity (56-98%) but generally maintain high specificity (93-100%) when compared to the RT-PCR gold standard [9] [1].
Impact of Viral Load on Test Performance
The diagnostic sensitivity of antigen tests demonstrates a strong inverse correlation with cycle threshold (Ct) values, serving as a proxy for viral load.
Table 2: Antigen Test Sensitivity Stratified by RT-PCR Ct Values
| Ct Value Range | Viral Load Category | Antigen Test Sensitivity (%) | Study Reference |
|---|---|---|---|
| ≤25 | High | 94.3-97.6 | [2] [3] |
| 21-25 | High-Intermediate | 63.0-72.8 | [2] [8] |
| 26-30 | Low-Intermediate | 2.9-70.8 | [8] [4] |
| >30 | Low | 2.9-47.2 | [3] [4] |
This relationship underscores a critical performance characteristic: antigen tests demonstrate optimal sensitivity during the acute phase of infection when viral loads are highest, typically within the first 5-7 days of symptom onset [9] [7]. One study noted that antigen test sensitivity decreased from 74% to 60% within 24 hours of symptom onset, contrasting with maintained RT-PCR sensitivity during this period [9].
Impact of Symptom Status
Symptomatic individuals generally present with higher viral loads, resulting in enhanced antigen test performance compared to asymptomatic carriers.
Table 3: Performance Comparison Between Symptomatic and Asymptomatic Individuals
| Performance Metric | Symptomatic Patients | Asymptomatic Patients | Study Reference |
|---|---|---|---|
| Antigen Test Sensitivity | 72.1% | 60.5% | [7] |
| False Negative Rate | 27.9% | 39.5% | [7] |
| PPV at 70% Prevalence | 86.36% | - | [8] |
The Quidel Sofia antigen test demonstrated 72.1% sensitivity in symptomatic patients compared to 60.5% in asymptomatic individuals [7]. This performance differential highlights the significant challenge antigen tests face in detecting pre-symptomatic and asymptomatic infections, which typically feature lower viral loads.
Methodological Approaches in Comparative Studies
Standardized Evaluation Protocols
Robust comparative studies follow standardized methodologies to ensure valid performance assessments:
Sample Collection and Handling:
- Paired nasopharyngeal swabs collected simultaneously from each participant
- Swabs placed in viral transport media and stored at 2-8°C if processed within 24-72 hours
- For antigen testing: Direct application of swab or VTM to test device
- For RT-PCR: RNA extraction from VTM using automated or manual systems [1] [6]
Testing Procedures:
- Antigen Tests: Performed according to manufacturer instructions, with results interpreted within specified timeframes (typically 15-30 minutes)
- RT-PCR: Extracted RNA amplified using approved kits with Ct value thresholds (generally <35-40 cycles) defining positivity [6] [5]
Data Analysis:
- Calculation of sensitivity, specificity, positive predictive value (PPV), and negative predictive value (NPV) with 95% confidence intervals
- Statistical analysis using MedCalc, SPSS, or R software
- Correlation analysis between antigen levels and Ct values using Pearson's correlation coefficients [2] [3]
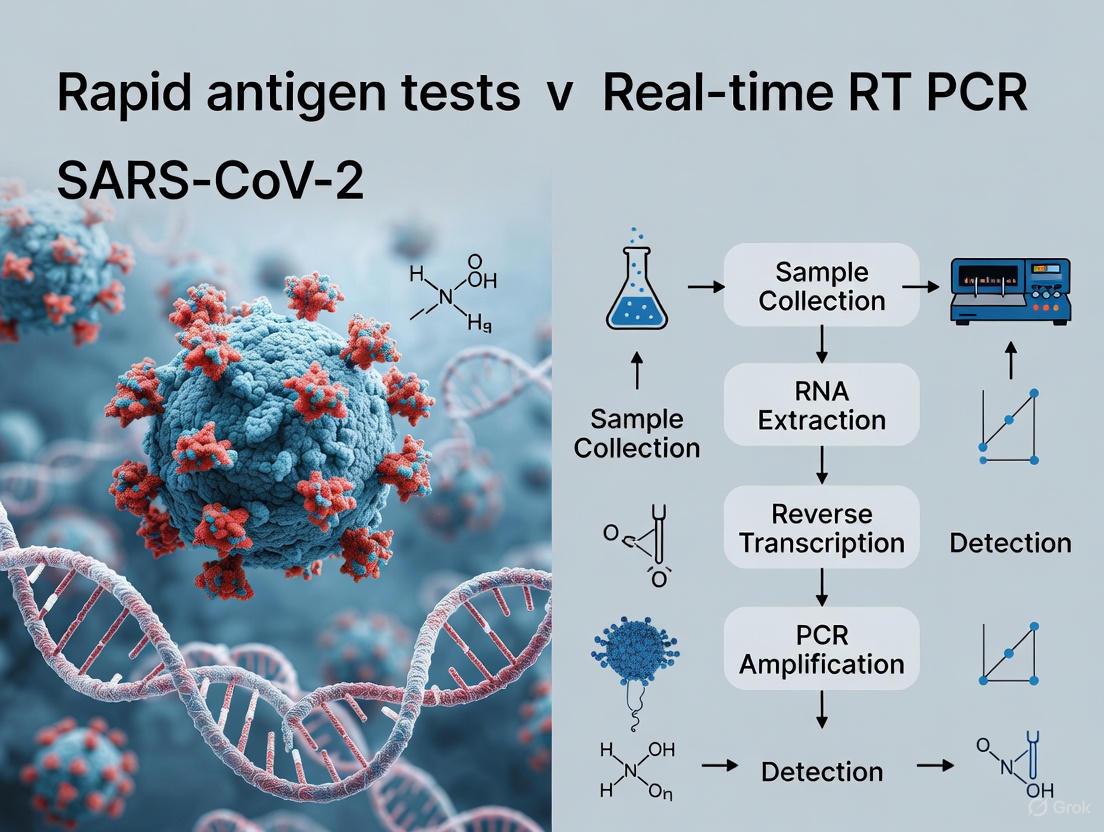
Experimental Workflow
The following diagram illustrates the typical methodological workflow for comparative studies evaluating antigen and molecular assays:
Mechanistic Basis for Performance Differences
Fundamental Detection Principles
The performance disparities between antigen detection and nucleic acid amplification methods originate from their fundamental operational mechanisms:
Antigen Detection Limitations:
- Threshold Requirement: Requires sufficient viral protein concentrations (typically >10^4-10^5 copies/mL) to generate detectable signal
- No Amplification: Lacks target amplification capability, limiting detectability to higher viral loads
- Epitope Dependency: Dependent on antibody affinity and specificity; potential cross-reactivity or variant escape
- Protein Stability: Affected by protein degradation during transport or storage
Molecular Detection Advantages:
- Target Amplification: Exponential amplification (theoretically 2^n) enables detection of single RNA molecules
- Signal Amplification: Fluorogenic probes enhance detection sensitivity
- Target Conservation: Multiple target genes (N, E, RdRp, ORF1ab) reduce variant escape risk
- RNA Stability: RNA generally more stable than proteins in clinical specimens
Relationship Between Viral Load and Detection Probability
The following diagram illustrates the mechanistic relationship between viral load and detection probability for both methods:
The Scientist's Toolkit: Essential Research Reagents and Platforms
Table 4: Key Research Reagents and Platforms for SARS-CoV-2 Detection
| Category | Specific Examples | Primary Function | Performance Characteristics |
|---|---|---|---|
| Rapid Antigen Tests | Standard Q COVID-19 Ag Test (SD Biosensor) | Qualitative detection of nucleocapsid antigen | Sensitivity: 98.3%, Specificity: 98.7% [1] |
| Zydus Cadila RAT | Lateral flow immunoassay for N protein | Sensitivity: 75.2%, Specificity: 98.9% [6] | |
| Automated Antigen Systems | VITROS SARS-CoV-2 Ag Test (CLIA) | Chemiluminescent immunoassay | Sensitivity: 94.3% (Ct≤25), 73.5% (overall) [2] |
| Lumipulse SARS-CoV-2 Ag Test (CLEIA) | Chemiluminescent enzyme immunoassay | Sensitivity: 92.3%, strong inverse correlation with Ct (r=-0.93) [5] [3] | |
| Elecsys SARS-CoV-2 Ag (ECLIA) | Electrochemiluminescence immunoassay | Sensitivity: 72.4%, Specificity: 95% [4] | |
| RNA Extraction Kits | MagLEAD 12gC (PSS) MagMax Viral/Pathogen (Thermo Fisher) HighPure Complete (Roche) | Viral RNA purification from clinical specimens | Essential for RT-PCR sensitivity; automated platforms reduce processing time [1] [5] |
| RT-PCR Assays | Allplex 2019-nCoV Assay (Seegene) TaqPath COVID-19 RT-PCR (Thermo Fisher) RealStar SARS-CoV-2 RT-PCR (Altona) | Multiplex real-time RT-PCR detection | Target multiple genes (E, RdRP, N, S); Ct<35-40 for positivity [1] [6] |
| Automated NAAT Systems | Xpert Xpress SARS-CoV-2 (Cepheid) FilmArray Respiratory Panel (bioMérieux) | Integrated sample-to-answer NAAT testing | Sensitivity: 98-99%, Specificity: 100%, rapid turnaround (45min) [5] |
The comparative analysis of antigen detection immunoassays and nucleic acid amplification via RT-PCR reveals complementary diagnostic profiles with distinct advantages for specific applications. RT-PCR maintains its position as the gold standard for diagnostic sensitivity, capable of detecting low viral loads throughout the infection cycle, making it indispensable for confirmatory testing, asymptomatic screening, and situations requiring maximal sensitivity.
Antigen-based immunoassays offer distinct advantages in settings requiring rapid results, point-of-care testing, and high-throughput screening, particularly during the acute phase of infection when viral loads are highest. The strong correlation between antigen test sensitivity and viral load creates a valuable public health tool, as positive results frequently correlate with transmissible infections.
The optimal diagnostic strategy incorporates both methodologies within a structured testing algorithm that leverages their complementary strengths. This integrated approach enables effective pandemic control through rapid identification of potentially infectious individuals while maintaining the sensitivity required for comprehensive case detection and confirmation. Future developments in both technologies will likely focus on enhancing sensitivity of rapid tests while reducing complexity and turnaround time for molecular methods, further blurring the performance boundaries between these fundamental detection mechanisms.
The accurate and timely detection of severe acute respiratory syndrome coronavirus 2 (SARS-CoV-2) has been a cornerstone of the global response to the COVID-19 pandemic. Among the various diagnostic tools developed, real-time reverse transcription-polymerase chain reaction (RT-PCR) has emerged as the undisputed gold standard. This guide provides a comprehensive comparison of RT-PCR against rapid antigen tests, presenting experimental data and methodological protocols to elucidate the technical foundations of RT-PCR's superior performance for researchers, scientists, and drug development professionals. While antigen tests offer advantages in speed and convenience, the analytical validity of RT-PCR remains unmatched for sensitive and specific detection of SARS-CoV-2, particularly in cases with low viral loads or asymptomatic presentations.
Performance Comparison: RT-PCR vs. Rapid Antigen Tests
Table 1: Diagnostic Performance Metrics of RT-PCR vs. Rapid Antigen Tests (RATs)
| Test Characteristic | RT-PCR | Rapid Antigen Tests | References |
|---|---|---|---|
| Overall Sensitivity | 95.2% (95% CI: 86.7–98.3%) | 56.2% (95% CI: 29.5–79.8%) | [10] |
| Overall Specificity | 98.9% (95% CI: 97.3–99.5%) | 99.5% (95% CI: 98.1–99.9%) | [10] |
| Sensitivity in Asymptomatic Individuals | Gold Standard | 35.8% – 48.1% | [11] [10] |
| Detection Limit | ~4-6 copies/reaction (RT-ddPCR) | N/A | [12] |
| Impact of Viral Load (Ct Value) | Reliable across a wide range | Sensitivity drops significantly at Ct >25 and falls to 27-32% at Ct >30 | [13] [11] |
Table 2: Performance Variation of Antigen Tests with Viral Load
| Cycle Threshold (Ct) Value | Approximate Viral Load | RAT Sensitivity | Study |
|---|---|---|---|
| Ct < 25 | High | 95% – 100% | [13] [11] |
| Ct 25 - <30 | Moderate | ~95% | [11] |
| Ct 30 - <35 | Low | 44.8% | [11] |
| Ct ≥ 35 | Very Low | 22.2% | [11] |
The data consistently demonstrates the superior sensitivity of RT-PCR. A Cochrane review confirmed that molecular tests like RT-PCR have an average sensitivity of 95.2%, drastically outperforming antigen tests, which have an average sensitivity of 56.2% [10]. This performance gap widens in asymptomatic individuals, where antigen test sensitivity can be as low as 35.8% to 48.1%, making them unreliable for screening populations without symptoms [11] [10]. The defining factor for this disparity is viral load. Antigen tests are only reliable when the viral load is high, typically during the symptomatic phase. As the cycle threshold (Ct) value increases (indicating lower viral load), the sensitivity of antigen tests plummets to as low as 22.2% [11].
Key Experimental Protocols
Understanding the experimental methodologies is crucial for interpreting performance data. Below are outlines of standard protocols for RT-PCR and rapid antigen test evaluations.
RT-PCR Methodology for SARS-CoV-2 Detection
Protocol 1: Standard RT-PCR Workflow for SARS-CoV-2
- 1. Sample Collection: Nasopharyngeal or nasal swabs are collected from patients and placed in universal viral transport medium [13] [12].
- 2. RNA Extraction: Viral RNA is extracted from the samples using commercial kits, such as the Zymo Quick Viral RNA Kit or the RNeasy Mini Kit (Qiagen). This purifies and concentrates the nucleic acids for amplification [13] [12].
- 3. Reverse Transcription-Polymerase Chain Reaction (RT-PCR):
- The extracted RNA is added to a master mix containing reverse transcriptase, primers, probes, nucleotides, and buffer.
- Reverse Transcription: The single-stranded RNA genome is transcribed into complementary DNA (cDNA).
- Real-Time Amplification: The cDNA is amplified through ~40 cycles of PCR. TaqMan probes labeled with a fluorophore and quencher bind to the target sequence. The fluorescence released during amplification is measured in real-time [13].
- 4. Result Interpretation: The cycle threshold (Ct) is determined. A positive result is indicated when the fluorescence exceeds a predetermined threshold within a certain number of cycles (e.g., <40) [13].
Advanced molecular methods like Droplet Digital RT-PCR (RT-ddPCR) offer absolute quantification without a standard curve and demonstrate even higher sensitivity for low viral loads. This method partitions the sample into thousands of droplets, performs PCR on each, and counts the positive droplets to absolutely quantify the target nucleic acid [12].
Rapid Antigen Test Evaluation Protocol
Protocol 2: Evaluating Rapid Antigen Test (RAT) Performance vs. RT-PCR
- 1. Study Design: A cross-sectional study is conducted where participants provide nasopharyngeal samples [13] [14].
- 2. Simultaneous Testing: The same sample or duplicate samples are tested simultaneously using the RAT and the reference standard RT-PCR.
- 3. Antigen Test Procedure: The sample is applied to the test cartridge, which contains labeled antibodies that bind to the SARS-CoV-2 nucleocapsid (N) protein. This complex migrates along the strip and is captured at the test line, producing a visual or digital signal within 10-30 minutes [11] [10].
- 4. Data Analysis: Diagnostic parameters are calculated using RT-PCR as the reference standard:
- Sensitivity = (True Positives / (True Positives + False Negatives)) × 100
- Specificity = (True Negatives / (True Negatives + False Positives)) × 100
- Positive and Negative Predictive Values (PPV, NPV) are also calculated, which are influenced by disease prevalence [14].
Research Reagent Solutions
Table 3: Essential Research Reagents for SARS-CoV-2 RT-PCR
| Reagent / Kit | Function | Example Product(s) |
|---|---|---|
| Viral RNA Extraction Kit | Purifies and concentrates viral RNA from clinical samples. | Zymo Quick Viral RNA Kit, RNeasy Mini Kit (Qiagen) [13] [12] |
| One-Step RT-PCR Master Mix | Contains enzymes, dNTPs, and buffer for combined reverse transcription and PCR amplification. | Allplex 2019-nCoV Assay (Seegene), LabTurbo Multiplex RT-PCR Kit [13] [15] |
| SARS-CoV-2 Primers and Probes | Target-specific oligonucleotides for gene amplification and detection. Common targets include N, S, E, and ORF1ab genes. | Custom synthesized (e.g., Shanghai Sangon) [12] |
| Positive Control RNA | Quantified SARS-CoV-2 RNA used for assay validation, standard curve generation, and determining the limit of detection (LOD). | SARS-CoV-2 Pseudovirus Quantification Reference Material (Fantasiabio) [12] |
| Digital PCR Reagents | For absolute quantification of viral load without a standard curve. | One-Step RT-ddPCR Advanced Kit for Probes (Bio-Rad) [12] |
Discussion and Clinical Implications
The experimental data unequivocally establishes RT-PCR as the gold standard due to its high sensitivity and specificity, driven by its ability to amplify tiny amounts of viral genetic material. While rapid antigen tests are useful for quickly identifying individuals with high viral loads (and thus likely high transmissibility) in specific settings, their variable and often low sensitivity, particularly in asymptomatic cases, is a major limitation [16] [10]. A negative antigen test cannot rule out infection, especially when the clinical pretest probability is high.
The choice of diagnostic method must be aligned with the testing objective. RT-PCR is indispensable for confirmatory diagnosis, surveillance of emerging variants, and detection in low-prevalence or asymptomatic populations. Antigen tests, with their speed and lower cost, find utility in rapid screening and triage scenarios where immediate results are critical, albeit with an understanding of their higher risk of false negatives.
In the landscape of SARS-CoV-2 diagnostics, RT-PCR remains the benchmark for accuracy. Its robust experimental methodology, high analytical sensitivity, and specificity provide reliable results across diverse clinical scenarios. Rapid antigen tests serve as a complementary tool but are hampered by significantly variable sensitivity, especially in low viral load situations. For researchers and clinicians, the evidence affirms that RT-PCR is the definitive choice when diagnostic accuracy is paramount, forming the foundation for effective clinical management, public health surveillance, and ongoing research into the virus and its variants.
The evaluation of any diagnostic test, including those for respiratory pathogens like SARS-CoV-2 and respiratory syncytial virus (RSV), relies on a standardized set of performance metrics compared against a reference standard. Sensitivity measures the test's ability to correctly identify infected individuals (true positive rate), while specificity measures its ability to correctly identify non-infected individuals (true negative rate). Positive Predictive Value (PPV) indicates the probability that a positive test result truly indicates infection, and Negative Predictive Value (NPV) indicates the probability that a negative test result truly indicates no infection. Accuracy represents the overall proportion of correct test results among all tests performed.
These metrics are particularly crucial when comparing different testing methodologies, such as rapid antigen tests and real-time reverse transcription polymerase chain reaction (RT-PCR) assays. RT-PCR, with its ability to detect minute quantities of viral RNA, is widely considered the gold standard for detecting active SARS-CoV-2 infection due to its high analytical sensitivity and specificity. In contrast, rapid antigen tests (RATs) detect viral proteins and offer advantages in speed, cost, and deployment but may differ in their performance characteristics. Understanding these metrics allows researchers and clinicians to appropriately select, implement, and interpret tests based on the specific clinical or public health context.
Comparative Performance Data: Rapid Antigen Tests vs. RT-PCR
Extensive research has directly compared the performance of rapid antigen tests and RT-PCR across various populations and settings. The tables below summarize key findings from multiple studies investigating tests for SARS-CoV-2 and RSV.
Table 1: Performance of SARS-CoV-2 Rapid Antigen Tests Compared to RT-PCR
| Study Population & Context | Sensitivity (%) | Specificity (%) | PPV (%) | NPV (%) | Reference |
|---|---|---|---|---|---|
| General symptomatic & asymptomatic (n=4,881) | 56.0 | 93.0 | Not reported | Not reported | [9] |
| Asymptomatic university students (n=692) | 63.5 (Overall); 35.0 (Asymptomatic) | 100.0 | 100.0 | Not reported | [17] |
| Asymptomatic individuals in Chile (n=842) | 69.9 | 99.6 | 94.4 | 97.2 | [18] |
| Symptomatic outpatients (n=928) | 87.4 (Overall); 96.5 (VL≥10⁶ copies/mL) | 100.0 | 100.0 | Not reported | [19] |
| Suspected cases & contacts in Thailand (n=454) | 98.3 | 98.7 | Not reported | Not reported | [1] |
| Evaluation of 18 different RATs | Varies by test | Varies by test | Varies by test | Varies by test | [20] |
Table 2: Performance of Respiratory Syncytial Virus (RSV) Rapid Antigen Test Compared to Reference Methods
| Reference Method | Study Population | Sensitivity (%) | Specificity (%) | PPV (%) | NPV (%) | Reference |
|---|---|---|---|---|---|---|
| Multiplex RT-PCR (n=557) | Pediatric | 46.4 | 99.3 | 95.6 | 84.7 | [21] |
| RT-qPCR (n=311) | Pediatric | 72.2 | 97.0 | 90.0 | 91.0 | [21] |
| Virus Culture (n=270) | Pediatric | 81.7 | 98.7 | 97.9 | 87.9 | [21] |
| RT-PCR & Virus Isolation (n=521) | Pediatric (<5 years) | 79.0 | 98.0 | 97.0 | 88.0 | [22] |
The data reveals that the sensitivity of rapid antigen tests is highly dependent on viral load. For SARS-CoV-2, when the viral load is high (often corresponding to a cycle threshold (Ct) value <25 in RT-PCR), the sensitivity of RATs can exceed 95% and even reach 100% in some studies [23] [19]. However, overall sensitivity is significantly lower in asymptomatic populations, who tend to have lower viral loads [18] [17]. Specificity is consistently high across most studies, meaning false positives are rare. For RSV, the BinaxNOW test showed variable but generally moderate sensitivity, which was lower in older children and when co-infections with other respiratory viruses were present [21].
Key Experimental Protocols and Methodologies
The comparative data presented are derived from rigorous experimental protocols. A typical study design for evaluating a rapid antigen test against the gold standard RT-PCR involves the following key steps, also summarized in the workflow below.
Participant Recruitment and Sample Collection
Studies typically enroll a cohort of participants that may include symptomatic individuals, asymptomatic contacts of confirmed cases, or pre-operative patients to ensure a spectrum of viral loads [18] [1] [19]. Ethical approval and informed consent are mandatory. From each participant, paired samples are collected concurrently. The most common procedure involves a healthcare professional collecting two nasopharyngeal swabs. One swab is used immediately for the rapid antigen test, and the other is placed in viral transport medium (VTM) for RT-PCR analysis. Some study designs also include a self-collected saliva sample under supervision to evaluate an alternative sampling method for PCR [19].
Test Execution and Analysis
The rapid antigen test is performed on-site according to the manufacturer's instructions, often by staff blinded to the eventual PCR result. The result (positive or negative) is typically read visually within 15-30 minutes and recorded [18] [19]. The second swab in VTM is transported to a laboratory under refrigerated conditions. RNA is then extracted using automated platforms (e.g., MagLEAD 12gC, MagnaPureLC) and subjected to RT-PCR using approved kits (e.g., Allplex 2019-nCoV Assay, GenomeCov19 Detection Kit) [18] [1]. A sample is considered positive if the cycle threshold (Ct) value is below a predefined cutoff (usually Ct<40). Data analysis is performed by comparing the RAT results to the RT-PCR reference standard to calculate sensitivity, specificity, PPV, and NPV. Discrepant results (e.g., false negatives) are often further investigated by examining the Ct values, where a higher Ct indicates a lower viral load [9] [18].
The Scientist's Toolkit: Essential Research Reagents and Materials
Table 3: Key Reagents and Materials for Diagnostic Test Comparison Studies
| Item | Function/Description | Example Products/Catalogs |
|---|---|---|
| Nasopharyngeal Swabs | Sample collection from the nasopharynx. | Sterile, synthetic fiber swabs. |
| Viral Transport Medium (VTM) | Preserves viral integrity during transport. | Hanks' Balanced Salt Solution with supplements. |
| Rapid Antigen Test Kits | For on-site, qualitative detection of viral antigens. | SD Biosensor Standard Q, Abbott Panbio, BinaxNOW [18] [17] [1]. |
| RNA Extraction Kit | Isolates viral nucleic acid from specimens. | MagLEAD 12gC kit, MagnaPure LC Total NA Isolation Kit [18] [22]. |
| RT-PCR Master Mix | Amplifies and detects viral RNA sequences. | Allplex 2019-nCoV Assay, COVITECH one-step RT-PCR kit [1] [24]. |
| Positive & Negative Controls | Validate test performance and reagent integrity. | Provided with commercial kits or sourced externally. |
The comparative analysis of diagnostic tests relies on a firm understanding of key performance metrics. The body of evidence demonstrates that while RT-PCR remains the gold standard for sensitivity, rapid antigen tests offer an excellent tool for specific applications, particularly when a rapid turnaround time is critical for public health interventions. Their performance is optimal in symptomatic individuals and those with high viral loads, who are also most likely to be contagious. The choice between these diagnostic methodologies should be guided by the specific context, including the prevalence of disease, the resources available, and the intended use of the test results—whether for individual patient diagnosis or broad community surveillance.
The accurate and timely detection of SARS-CoV-2 infection has been a cornerstone of the global response to the COVID-19 pandemic. While real-time reverse transcription-polymerase chain reaction (RT-PCR) remains the gold standard for diagnostic confirmation, Rapid Antigen Tests (RATs) have emerged as a vital tool for mass screening and rapid case identification due to their quick turnaround time, lower cost, and operational simplicity [25] [6]. This guide objectively compares the performance of RATs against RT-PCR, aggregating data from multiple meta-analyses and clinical studies to provide researchers, scientists, and drug development professionals with a comprehensive overview of their diagnostic accuracy. The focus is on presenting consolidated quantitative data on sensitivity and specificity, detailing the experimental methodologies that generate this evidence, and identifying key factors influencing test performance.
Aggregated findings from meta-analyses and cross-sectional studies provide a high-level overview of RAT performance against the RT-PCR gold standard. The following table synthesizes key metrics from multiple studies, illustrating the range of observed performance.
Table 1: Aggregated Performance Metrics of Rapid Antigen Tests vs. RT-PCR
| Study / Meta-Analysis | Sensitivity (95% CI) | Specificity (95% CI) | Positive Predictive Value (PPV) | Negative Predictive Value (NPV) | Number of Studies / Samples |
|---|---|---|---|---|---|
| Systematic Review & Meta-Analysis (2022) [25] | 69% (68-70) | 99% (99-99) | Not specified | Not specified | 60 studies |
| Cross-Sectional Study, Brazil (2025) [26] | 59% (56-62) | 99% (98-99) | 97% | 78% | 2,882 samples |
| Hospital-Based Study, India (2023) [27] | 85.3% | 99.5% | Not specified | Not specified | 1,000 samples |
| Prospective Study, Greece (2023) [28] | 96.1% (91.1-98.7) | 100% (99.4-100.0) | 100% | 99.2% | 782 samples |
| Retrospective Study, Singapore (2024) [29] | 84.6% (83.3-85.7) | 99.4% (99.1-99.6) | Not specified | Not specified | 8,620 encounters |
The data reveals a range of sensitivities, from 59% to 96.1%, while specificity remains consistently high (≥99% in most studies) [25] [26] [27]. This variation underscores that while a negative RAT result may sometimes require confirmation, a positive result is highly reliable for identifying SARS-CoV-2 infection. The meta-analysis of 60 studies consolidates this view, showing a pooled sensitivity of 69% and a pooled specificity of 99% [25].
Detailed Experimental Protocols
The performance data presented above are derived from rigorous comparative studies. The following workflow outlines the standard methodology for a head-to-head comparison of RAT and RT-PCR.
The core components of these experimental protocols are detailed below.
Participant Recruitment and Sample Collection
Studies typically enroll participants presenting with symptoms suggestive of COVID-19 or those identified as contacts of confirmed cases [26] [6] [28]. For each participant, two nasopharyngeal swabs are collected simultaneously by trained healthcare personnel. The use of paired swabs from the same individual at the same time is critical for a direct, head-to-head comparison of the two testing methods, eliminating variability that could arise from sampling at different times or from different anatomical sites [6] [28].
Index Test: Rapid Antigen Test (RAT)
One swab is immediately tested at the point-of-care using the specified RAT kit, which operates on a lateral flow immunoassay principle. These tests are designed to detect the presence of SARS-CoV-2 nucleocapsid protein. The test procedure involves placing the swab into an extraction buffer tube, mixing it, and then applying a few drops of the solution to the test device. Results are interpreted visually within 15-30 minutes, as per the manufacturer's instructions [27] [6] [28]. The entire process is performed without the need for complex laboratory equipment.
Reference Standard: Real-Time RT-PCR
The second swab is placed in Viral Transport Medium (VTM) and transported to a laboratory under a controlled cold chain (typically 4°C) [27] [6]. Viral RNA is extracted using automated, magnetic bead-based nucleic acid extraction systems [6] [30]. The RT-PCR reaction targets at least two SARS-CoV-2 genes (commonly the E, N, RdRp, or ORF1ab genes) [27] [30]. A sample is considered positive if the amplification curve crosses the threshold for one or more targets within a pre-defined cycle threshold (Ct), usually below 35-40 cycles [27] [6]. The Ct value serves as a semi-quantitative proxy for viral load, with a lower Ct indicating a higher viral load [26] [30].
Statistical Analysis
The results are compiled into a 2x2 contingency table to calculate performance metrics:
- Sensitivity: Proportion of RT-PCR-positive cases that are correctly identified by the RAT (True Positives / [True Positives + False Negatives]).
- Specificity: Proportion of RT-PCR-negative cases that are correctly identified by the RAT (True Negatives / [True Negatives + False Positives]).
- Positive Predictive Value (PPV): Probability that a person with a positive RAT result is truly infected.
- Negative Predictive Value (NPV): Probability that a person with a negative RAT result is truly not infected. These measures, along with 95% confidence intervals, are calculated to quantify diagnostic accuracy [25] [26] [6].
Factors Influencing Test Performance
The diagnostic accuracy of RATs is not uniform but is influenced by several biological and technical factors. Understanding these is crucial for the correct interpretation of test results and for guiding test development.
Table 2: Key Factors Affecting Rapid Antigen Test Performance
| Factor | Impact on Sensitivity | Evidence |
|---|---|---|
| Viral Load | Strongly positive correlation with higher viral load (lower Ct value). | Sensitivity was 90.85% for Cq<20 vs. 5.59% for Cq≥33 [26]. |
| Time Since Symptom Onset | Highest sensitivity in early infection (first 5-7 days). | Sensitivity decreased when testing ≥6 days from symptom onset [29]. |
| SARS-CoV-2 Variant | Minimal impact for major Omicron sublineages. | No significant difference in performance between BA.2, BA.5, and XBB.1 [29]. |
| Previous Infection | Potentially lower sensitivity in reinfections. | Reinfection cases had higher odds of RAT-negative/RT-PCR-positive results [29]. |
| Test Manufacturer | Performance varies between brands and kits. | Significant differences found between two widely used test kits in Brazil [26]. |
The relationship between these factors and the testing process is illustrated below.
The Scientist's Toolkit: Essential Research Reagents and Materials
The following table details key materials and reagents essential for conducting rigorous evaluations of SARS-CoV-2 diagnostic tests.
Table 3: Essential Research Materials for Diagnostic Test Evaluation
| Item | Function/Description | Example Brands/Types |
|---|---|---|
| Nasopharyngeal Swabs | Collecting patient samples from the nasopharynx. | Dacron or polyester flocked swabs [27]. |
| Viral Transport Medium (VTM) | Preserving viral integrity during sample transport. | Commercially available VTM or Eswab [6] [30]. |
| Rapid Antigen Test Kits | Index test for detecting SARS-CoV-2 nucleocapsid protein. | Panbio, BinaxNOW, Flowflex, Standard Q, Zydus Cadila [25] [29] [6]. |
| RNA Extraction Kits | Isolating viral RNA from VTM samples for RT-PCR. | Magnetic bead-based kits (e.g., MagMax) [26] [6] [30]. |
| RT-PCR Assays/Kits | Gold standard test for detecting SARS-CoV-2 RNA. | TaqPath COVID-19 Combo Kit, CDC 2019-nCoV RT-PCR Panel, Argene SARS-CoV-2 R-Gene [6] [28] [30]. |
| Positive Control Material | Ensuring the RT-PCR assay is functioning correctly. | Provided with commercial kits or sourced from organizations like the Pasteur Institute [30]. |
Rapid Antigen Tests are a highly specific and invaluable tool for the rapid identification of SARS-CoV-2, particularly in settings with high transmission or limited resources. Their primary limitation is variable and often modest sensitivity, which is strongly linked to viral load. Consequently, a negative RAT result may require confirmation with RT-PCR in individuals highly suspected of having COVID-19, especially those who are symptomatic or have a known exposure. For researchers and public health officials, these findings support the use of RATs as a screening tool for infectious individuals, who typically harbor high viral loads, while underscoring the importance of understanding the factors that modulate their performance to optimize testing strategies.
Rapid Antigen Tests (RATs) have become a cornerstone in the management of the COVID-19 pandemic, offering rapid turnaround times and point-of-care usability. However, their diagnostic sensitivity is not uniform and is profoundly influenced by the viral load present in a patient sample, most commonly quantified through the Cycle Threshold (Ct) value derived from reverse transcription polymerase chain reaction (RT-PCR) testing. This review synthesizes evidence from clinical studies and meta-analyses to delineate the direct correlation between Ct values and RAT sensitivity. We demonstrate that RATs achieve high sensitivity (often >95%) in samples with low Ct values (high viral load), making them excellent tools for identifying infectious individuals. The article also provides a detailed overview of standard experimental protocols for evaluating RAT performance and offers visual tools and reagent references to support ongoing research and development in the field of rapid diagnostics.
The cycle threshold (Ct) value is a semi-quantitative measure derived from real-time RT-PCR assays, representing the number of amplification cycles required for a target gene's signal to cross a predefined detection threshold [31]. It exhibits an inverse logarithmic relationship with viral load; a lower Ct value indicates a higher quantity of viral RNA in the sample [31]. For example, a Ct value of 20 signifies a substantially higher viral load than a Ct value of 30.
While RT-PCR is exquisitely sensitive for detecting viral RNA, the detection of viral antigens via RATs requires a sufficient concentration of proteins, such as the nucleocapsid (N) protein, to generate a visible signal on a lateral flow assay [32]. This fundamental difference explains why the sensitivity of RATs is not a fixed value but is intrinsically linked to the viral load present in the sample. Individuals with high viral loads are not only more likely to test positive on a RAT but are also considered to be at the highest risk of transmitting the virus to others [33] [34]. Thus, understanding the interplay between Ct values and RAT sensitivity is critical for deploying these tests effectively in public health strategies and for interpreting their results in a clinical and research context.
Quantitative Data: The Correlation Between Ct Values and RAT Sensitivity
A substantial body of evidence confirms a strong, direct correlation between viral load (as indicated by Ct value) and the sensitivity of Rapid Antigen Tests. The relationship is consistently demonstrated across multiple studies and meta-analyses, which show RAT sensitivity peaks in samples with high viral loads and declines sharply as viral load decreases.
Table 1: Summary of RAT Sensitivity Across Different Ct Value Ranges
| Ct Value Range | Viral Load Category | Reported RAT Sensitivity | Source / Study Context |
|---|---|---|---|
| < 20 | Very High | 97.9% (95% CI: 96.9–98.9%) | Systematic Review & Meta-Analysis [34] |
| < 25 | High | 90.6% (95% CI: 88.3–93.0%) | Systematic Review & Meta-Analysis [34] |
| 91.67% | Boson RAT Evaluation (for Ct ≥30) [32] | ||
| 21-25 | Intermediate | 63% | PCL Spit RAT Study [8] |
| ≥ 25 | Low | 54.4% (95% CI: 47.3–61.5%) | Systematic Review & Meta-Analysis [34] |
| 26-30 | Low | 22% | PCL Spit RAT Study [8] |
| ≥ 30 | Very Low | 18.7% (95% CI: 13.9–23.4%) | Systematic Review & Meta-Analysis [34] |
This quantitative relationship underscores a key performance characteristic of RATs: they are exceptionally good at identifying individuals who are most likely to be infectious. Research has shown that the mean Ct value for true positive RAT results is significantly lower (mean Ct ~22.2) than that for false negative results (mean Ct ~30.4) [34]. This indicates that false negatives predominantly occur in samples with lower viral loads, where the risk of transmission is also likely reduced.
Experimental Protocols for Evaluating RAT Performance
To generate the data presented above, researchers adhere to rigorous experimental designs that compare the performance of RATs against the gold standard, RT-PCR. The following outlines the key methodological components of such studies.
Subject Selection and Sample Collection
Studies typically enroll a cohort of participants that includes both symptomatic and asymptomatic individuals suspected of SARS-CoV-2 infection [32] [8]. Informed consent is obtained, and paired samples are collected from each participant. The standard procedure involves:
- Sample Type: Collection of nasopharyngeal (NP), anterior nasal/mid-turbinate (AN/MT), or oropharyngeal swabs [32] [34]. Some studies also evaluate saliva samples [8].
- Paired Sampling: For direct comparison, two swabs are collected from the same individual at the same time. One swab is placed in Viral Transport Media (VTM) for RT-PCR analysis, and the other is used for the rapid antigen test immediately or placed in a specific buffer provided with the RAT kit [35].
Laboratory Methods: RT-PCR and Antigen Testing
RT-PCR Protocol
- RNA Extraction: Viral RNA is extracted from the VTM sample using commercial kits, such as the QIAamp Viral RNA Mini kit, often on automated platforms [32] [31].
- Amplification and Detection: The extracted RNA is amplified using real-time PCR kits targeting specific SARS-CoV-2 genes (e.g., E, N, RdRP). The process involves reverse transcription followed by 40-50 amplification cycles [32] [8]. The Ct value for each sample is recorded. A sample is considered positive if the Ct value is below a validated cutoff (e.g., <36 or <40, depending on the kit) [31] [8].
- Quality Control: Internal controls are included to monitor for PCR inhibition and ensure successful RNA extraction [32].
Rapid Antigen Test Protocol
- Test Execution: The second swab is processed according to the manufacturer's Instructions for Use (IFU). This typically involves placing the swab in an extraction buffer, rotating it to release the antigen, and then dispensing drops of the solution onto the test device [32] [1].
- Result Interpretation: Results are read visually after 15-20 minutes. The appearance of both control and test lines indicates a positive result. The tests are often performed blinded to the RT-PCR result to avoid bias [32].
- Data Analysis: The results are compiled into a 2x2 contingency table to calculate sensitivity, specificity, positive predictive value (PPV), and negative predictive value (NPV) against the RT-PCR reference standard [8] [35].
The following diagram illustrates the workflow of a typical comparative accuracy study.
The Scientist's Toolkit: Key Research Reagent Solutions
The evaluation of RAT performance and the study of viral load dynamics rely on a suite of specific reagents and kits. The table below details essential materials and their functions in this field of research.
Table 2: Essential Research Reagents and Kits for SARS-CoV-2 Detection Studies
| Reagent / Kit Name | Primary Function | Research Application |
|---|---|---|
| QIAamp Viral RNA Mini Kit (Qiagen) | Viral RNA extraction from swab samples | Prepares purified RNA for downstream RT-PCR analysis [32] [36] |
| Allplex 2019-nCoV Assay (Seegene) | Multiplex real-time RT-PCR | Detects multiple SARS-CoV-2 genes (E, N, RdRP) and provides Ct values [1] |
| SacACE SARS-CoV-2 Test Kit | Real-time RT-PCR | Gold standard comparison for RAT evaluations, targeting E and N genes [32] |
| Standard Q COVID-19 Ag Test (SD Biosensor) | Rapid antigen detection | Lateral flow immunoassay for detecting SARS-CoV-2 nucleocapsid protein [1] [36] |
| Panbio COVID-19 Ag Test (Abbott) | Rapid antigen detection | Lateral flow immunoassay commonly evaluated in comparative studies [36] |
| Boson Rapid SARS-CoV-2 Antigen Test Card | Rapid antigen detection | A RAT evaluated for self-testing with high reported accuracy [32] |
| Viral Transport Media (VTM) | Preservation of specimen integrity | Maintains virus viability and nucleic acid integrity during sample transport [31] |
Discussion and Clinical Relevance
The inverse relationship between Ct values and RAT sensitivity has profound implications for public health strategy and clinical practice. The primary strength of RATs lies in their ability to rapidly identify individuals with high viral loads, who are most likely to be infectious. This makes them invaluable tools for mass screening in high-transmission settings, such as outbreaks, and for informing immediate isolation decisions [33] [34].
However, the lower sensitivity in individuals with high Ct values (low viral loads) is a critical limitation. This is particularly relevant for testing asymptomatic individuals, who may have lower viral loads on average, or for testing later in the course of illness when viral loads are declining [37] [34]. Therefore, a negative RAT result should not be used as a definitive rule-out in all scenarios, especially when clinical suspicion is high. Understanding this performance characteristic prevents the misinterpretation of results and guides the appropriate use of confirmatory RT-PCR testing.
Furthermore, the Ct value itself has demonstrated clinical prognostic value. Studies have shown that patients with lower Ct values (higher viral loads) were significantly more likely to require prescription drug therapy for COVID-19 than those with higher Ct values [31]. This highlights the potential utility of quantitative viral load assessment in patient management and risk stratification.
In the comparative performance analysis of rapid antigen tests versus RT-PCR, viral load, as quantified by Ct value, emerges as the paramount factor determining RAT sensitivity. The collective evidence demonstrates that RATs fulfill a specific and crucial niche: the efficient detection of highly infectious individuals. Their performance is optimized when viral loads are high (Ct values < 25), with sensitivity exceeding 90% in this range. Researchers and clinicians must therefore interpret RAT results within the context of viral load dynamics. Future developments in rapid diagnostics should focus on enhancing sensitivity without compromising speed and accessibility, potentially through improved antibody affinity or novel detection technologies. For now, a clear understanding of the critical role of viral load ensures that RATs can be deployed and interpreted effectively within a comprehensive diagnostic and public health framework.
Strategic Deployment in Research and Clinical Practice: Contextual Test Selection
The comparative analysis of Severe Acute Respiratory Syndrome Coronavirus 2 (SARS-CoV-2) detection methods reveals a complex performance landscape where Rapid Antigen Diagnostic Tests (Ag-RDTs) and real-time reverse transcription polymerase chain reaction (RT-PCR) serve complementary roles. While RT-PCR remains the gold standard for diagnostic sensitivity due to its ability to detect minute viral RNA quantities, extensive research demonstrates that Ag-RDTs provide substantial value in specific use cases where speed, cost, and operational simplicity are paramount. The strategic deployment of each technology must be informed by their documented performance characteristics across different viral loads, patient populations, and operational environments.
Recent multi-study analyses indicate that Ag-RDTs achieve optimal sensitivity (approaching 100%) in patients with high viral loads, typically corresponding to RT-PCR cycle threshold (Ct) values below 25 [23] [38] [8]. This high viral load state frequently correlates with peak transmissibility, positioning Ag-RDTs as valuable tools for identifying infectious individuals during the most contagious phase of infection. The performance differential between these methodologies narrows significantly in symptomatic individuals and during early infection when viral concentrations are highest, supporting the targeted application of Ag-RDTs for rapid triage and mass screening initiatives.
Comparative Performance Data Analysis
Comprehensive Performance Metrics Across Studies
Table 1: Diagnostic Performance of Ag-RDTs Versus RT-PCR Across Multiple Studies
| Study & Setting | Samples (n) | Overall Sensitivity | Overall Specificity | Sensitivity at Ct<25 | Sensitivity at Ct>30 |
|---|---|---|---|---|---|
| Lahore, Pakistan (2024) [8] | 320 | 67.0% | 75.0% | 100% | 22.0% |
| Mali, Africa (2023) [38] | 390 | 57.1-61.9% | 94.1-95.8% | Not specified | Not specified |
| Comparative Study (2024) [23] | 268 | 76.5-80.3% | 96.8-97.3% | 100% | 27.3-31.8% |
| Resource-Limited RDT (2021) [39] | 80 | 87.5% | 100% | Not specified | Not specified |
The aggregated data reveals a consistent performance pattern across diverse geographical settings and study designs. Ag-RDTs demonstrate strong specificity (generally >90%), ensuring false positives remain low [23] [38] [39]. However, sensitivity shows considerable variation, heavily dependent on viral load as approximated by RT-PCR Ct values. This fundamental relationship between viral concentration and detection capability underpins the strategic deployment recommendations for Ag-RDTs in specific use cases.
Variant-Specific Performance
Table 2: Ag-RDT Sensitivity by SARS-CoV-2 Variant
| Variant | FIA Sensitivity | LFIA Sensitivity | Study |
|---|---|---|---|
| Alpha | 78.9% | 69.2% | [23] |
| Delta | 72.2% | 83.3% | [23] |
| Omicron | 100% | 100% | [23] |
Variant-specific performance data indicates that Ag-RDTs maintain effectiveness across variants of concern, with particularly strong performance against the Omicron variant [23]. This consistent detection capability supports the ongoing utility of Ag-RDTs despite viral evolution, though continuous monitoring remains necessary as new variants emerge.
Experimental Protocols and Methodologies
Standardized Comparative Evaluation Protocol
The foundational methodology for comparing Ag-RDT and RT-PCR performance follows a standardized approach employed across multiple studies [23] [38] [8]:
Sample Collection: Simultaneous collection of nasopharyngeal, anterior nasal, or oropharyngeal swabs from participants. Swabs are placed in viral transport medium for RT-PCR analysis or directly applied to Ag-RDT devices according to manufacturer specifications.
RT-PCR Reference Testing: RNA extraction using commercial kits (e.g., Qiagen QIAamp Viral RNA mini kit). RT-PCR amplification using approved platforms (e.g., Bosphore Novel Coronavirus Detection Kit v4) with Ct value cut-offs typically set at ≤33-36 for positive classification [38] [8]. Target genes include nucleocapsid (N), envelope (E), and RNA-dependent RNA polymerase (RdRp).
Ag-RDT Execution: Direct application of swab samples or swab extracts to lateral flow immunoassay (LFIA) or fluorescence immunoassay (FIA) devices. Visual or instrumental reading at 15-30 minutes following manufacturer guidelines.
Viral Load Quantification: Ct values from RT-PCR serve as proxy for viral load. Stratification of samples by Ct ranges (<20, 21-25, 26-30, >30) enables correlation of Ag-RDT sensitivity with viral concentration.
Statistical Analysis: Calculation of sensitivity, specificity, positive predictive value (PPV), negative predictive value (NPV), and overall accuracy with 95% confidence intervals. Cohen's kappa coefficient determination to assess agreement between methods.
Specialized Protocol for Resource-Limited Settings
Studies focused on resource-limited environments implement modified protocols to address operational constraints [38] [39]:
Point-of-Care Adaptation: Training of healthcare workers or laboratory personnel without specialized molecular biology expertise to perform Ag-RDTs and interpret results visually.
Sample Processing Simplification: Anterior nasal swabs instead of nasopharyngeal swabs to improve patient tolerance and simplify collection. Direct application of swabs to extraction buffer without intermediate processing steps.
Decentralized Testing Model: Evaluation of Ag-RDT performance at primary health centers without reliable cold chain infrastructure. Assessment of stability under variable temperature and humidity conditions.
Control Measures: Incorporation of positive and negative control swabs to verify test integrity in challenging environments.
High-Value Application Domains
Mass Screening Initiatives
Ag-RDTs provide distinct advantages in mass screening scenarios where testing throughput, speed, and frequency outweigh the need for maximum sensitivity [23] [39]. The 15-30 minute time-to-result enables immediate action, while the minimal infrastructure requirements facilitate deployment in non-traditional testing venues such as workplaces, schools, and community centers.
The operational characteristics of Ag-RDTs align with the epidemiological understanding that individuals with high viral loads (Ct<25) drive the majority of transmission events [23]. By reliably identifying these highly infectious individuals, Ag-RDT-based screening programs can effectively interrupt transmission chains despite reduced sensitivity in low viral load cases. The cost-benefit analysis favors frequent Ag-RDT screening over infrequent RT-PCR testing for outbreak containment.
Resource-Limited Settings
In environments with constrained laboratory infrastructure, reagent supply chain challenges, or limited technical expertise, Ag-RDTs offer a pragmatic diagnostic solution [38] [39]. Studies in Mali demonstrated that although Ag-RDT sensitivity (57.1-61.9%) was lower than optimal, the tests still provided substantial value in triaging symptomatic patients and monitoring known positive cases during treatment [38].
The minimal equipment requirements (no electricity, temperature control, or sophisticated instrumentation) and ease of training make Ag-RDTs particularly suitable for remote or underserved regions. The operational model proposed for these settings often incorporates Ag-RDTs as frontline tests with RT-PCR confirmation reserved for negative results in high-probability cases, thereby optimizing resource allocation [39].
Rapid Triage Scenarios
In clinical settings where immediate disposition decisions are required, Ag-RDTs enable effective patient triage based on infectious status [23] [40]. Emergency departments, urgent care facilities, and preoperative screening programs benefit from the rapid exclusion of high viral load SARS-CoV-2 infections, permitting appropriate infection control measures.
The high specificity of Ag-RDTs (>90% across most studies) ensures that positive results can be acted upon with high confidence, facilitating immediate isolation precautions [23] [38]. The superior sensitivity of Ag-RDTs in symptomatic versus asymptomatic patients (80.25% vs 73.68% for FIA) further supports their application in triaging individuals with clinical manifestations consistent with COVID-19 [23].
The Scientist's Toolkit: Research Reagent Solutions
Table 3: Essential Research Materials for Comparative Test Evaluation
| Reagent/Kit | Manufacturer/Provider | Primary Function | Application Notes |
|---|---|---|---|
| ARGENE SARS-CoV-2-R-GENE | BioMérieux | RT-PCR detection of SARS-CoV-2 | Targets N and E genes; used as reference standard [38] |
| Bosphore Novel Coronavirus Detection Kit v4 | Anatolia Turkiye | RT-PCR amplification | Ct value cut-off of 36 for positivity determination [8] |
| GF-1 Viral Nucleic Acid Extraction Kit | Vivantis | RNA extraction from swab samples | Compatible with various viral transport media [8] |
| PCL Spit Rapid Antigen Test | PCL (Germany) | SARS-CoV-2 nucleocapsid detection | Saliva-based; used in Pakistan study [8] |
| Standard Q COVID-19 Ag | SD Biosensor | Lateral flow antigen detection | Evaluated in Mali study; 94.1% specificity [38] |
| Realy Tech COVID-19 Ag | Hangzhou Realy Tech | Fluorescent immunoassay | Higher sensitivity in asymptomatic cases [23] |
| Viral Transport Medium | Various | Sample preservation and transport | Maintains viral integrity during transport [38] |
| Recombinant SARS-CoV-2 Nucleocapsid | Bio-Techne | Positive control for assay validation | Sf21 (baculovirus)-derived; Met1-Ala419 [39] |
The comprehensive analysis of Ag-RDT versus RT-PCR performance supports a nuanced implementation strategy based on specific use case requirements rather than a one-size-fits-all approach. Ag-RDTs deliver maximum value in scenarios prioritizing speed, accessibility, and operational simplicity, particularly when targeting individuals with high viral loads who represent the greatest transmission risk. The documented performance characteristics—high specificity, excellent detection capability at Ct values <25, and minimal infrastructure requirements—position Ag-RDTs as indispensable tools for mass screening, resource-limited settings, and rapid triage applications.
RT-PCR maintains its essential role in confirmatory testing, asymptomatic screening, and situations demanding maximum diagnostic sensitivity. The strategic integration of both technologies within a coherent public health framework—leveraging their complementary strengths—represents the optimal approach to SARS-CoV-2 detection and outbreak control. Future development efforts should focus on enhancing Ag-RDT sensitivity without compromising their operational advantages, particularly for use in low-prevalence settings and asymptomatic screening programs.
The comparative performance of SARS-CoV-2 Rapid Antigen Tests (RATs) versus real-time reverse transcription polymerase chain reaction (RT-PCR) has been a critical area of research throughout the COVID-19 pandemic. While both methods aim to detect active infection, their fundamental differences in technology, sensitivity, and operational characteristics lead to varying performance across different patient populations. A key factor influencing test accuracy is the patient's symptom status, with numerous studies demonstrating significantly different performance in symptomatic versus asymptomatic individuals. This review synthesizes evidence from multiple clinical studies to provide a structured comparison of test performance across these distinct populations, offering researchers and clinicians a data-driven foundation for test selection and interpretation in both diagnostic and screening contexts.
Table 1: Summary of RAT Performance in Symptomatic vs. Asymptomatic Populations
| Study Population & Setting | Sample Size | Sensitivity (%) | Specificity (%) | PPV (%) | NPV (%) | Reference |
|---|---|---|---|---|---|---|
| Symptomatic Individuals | ||||||
| University Campuses, Wisconsin | 227 | 80.0 | 98.9 | 94.1 | 95.9 | [41] |
| Hospital Patients, Ethiopia | 200* | 95.0 | 97.0 | N/R | N/R | [42] |
| Various Settings, India | 329 | 75.2 | 98.9 | 98.3 | 82.8 | [6] |
| Asymptomatic Individuals | ||||||
| University Campuses, Wisconsin | 871 | 41.2 | 98.4 | 33.3 | 98.8 | [41] |
| Community Screening, Chile | 842 | 69.9 | 99.6 | 94.4 | 97.2 | [18] |
| Hospital/Community, India | 329 | Lower in asymptomatic* | 98.9 | 98.3 | 82.8 | [6] |
| Note: PPV = Positive Predictive Value; NPV = Negative Predictive Value; N/R = Not Reported. *This study included a mixed population; the sensitivity was notably higher in symptomatic versus asymptomatic participants, though a precise split was not provided in the abstract. The Ethiopian study primarily focused on confirmed COVID-19 patients, and while symptom status is not detailed in the abstract, the high sensitivity suggests a cohort with a high viral load. |
Table 2: Impact of Viral Load (Cycle Threshold Values) on RAT Sensitivity
| RT-PCR Cycle Threshold (Ct) Value Range | Viral Load Category | RAT Sensitivity (%) | Study Context |
|---|---|---|---|
| ≤ 20 | High | 100.0 | Lahore, Pakistan [8] |
| 21 - 25 | Intermediate | 63.0 | Lahore, Pakistan [8] |
| > 26 | Low | 22.0 - 36.1 | Lahore, Pakistan [8], Iquique, Chile [18] |
Experimental Insights and Methodologies
Key Comparative Study Designs
The data presented in the summary tables are derived from rigorous comparative studies. A typical protocol involved collecting paired nasopharyngeal swabs from each participant. One swab was tested immediately using a RAT, often at the point of care, while the second swab was placed in viral transport media (VTM) and transported under refrigeration (typically 4°C) to a laboratory for RNA extraction and RT-PCR analysis [18] [6]. For example, the study in Chile with 842 asymptomatic individuals used the SD Biosensor RAT and compared it with RT-PCR using the GenomeCov19 Detection Kit, with a cycle threshold (Ct) value ≤ 40 considered positive [18]. This parallel testing design allows for a direct head-to-head comparison of the two methods, using RT-PCR as the reference standard.
The Relationship Between Viral Load, Symptoms, and Test Sensitivity
A consistent finding across studies is the inverse correlation between RT-PCR Ct values and RAT sensitivity. The Ct value represents the number of amplification cycles required for the viral RNA to reach a detectable level; a lower Ct value indicates a higher viral load [43]. Research from Pakistan clearly demonstrated this relationship, showing RAT sensitivity was 100% for samples with Ct ≤ 20, but dropped to 22% for samples with Ct > 26 [8]. This is a critical factor explaining the performance difference between symptomatic and asymptomatic populations. Symptomatic individuals typically have higher viral loads and lower Ct values, making them more likely to be detected by RATs, which require a substantial amount of viral protein to generate a positive signal [10] [41]. Asymptomatic individuals often have lower viral loads, leading to a higher rate of false-negative RAT results despite a positive RT-PCR.
Diagram 1: The relationship between symptom status, viral load, and resulting Rapid Antigen Test (RAT) performance. Symptomatic status is frequently associated with higher viral loads, leading to higher RAT sensitivity.
Implications for Test Interpretation and Public Health Strategy
The documented performance differences have profound implications for how test results are interpreted and how testing is deployed in public health strategy. The pretest probability of infection—influenced by symptom status, known exposures, and community prevalence—is a crucial factor in interpreting a RAT result [10] [44]. For a symptomatic individual or a close contact of a confirmed case (high pretest probability), a negative RAT result should be viewed with caution, and confirmatory RT-PCR testing is often recommended [10] [41]. Conversely, a positive RAT in an asymptomatic person with no known exposures (low pretest probability) may also require RT-PCR confirmation due to the lower positive predictive value in this group [44] [41]. These considerations are vital for researchers designing surveillance studies and for health officials allocating limited testing resources, as RATs offer advantages in speed and cost for mass screening, despite their lower sensitivity in asymptomatic carriers [18] [6].
Essential Research Reagents and Materials
Table 3: Key Reagents and Kits for SARS-CoV-2 Test Performance Research
| Item Name | Function/Application | Example Manufacturers/Catalog |
|---|---|---|
| Viral Transport Media (VTM) | Preserves specimen integrity during transport for RT-PCR. | HiMedia [6] |
| RNA Extraction Kits | Isolates viral RNA from nasopharyngeal swabs for RT-PCR. | Mag-Bind Viral DNA/RNA 96 Kit (Omega Bio-Tek), Mag Max Viral/Pathogen Kit (Thermo Fisher) [18] [6] |
| RT-PCR Master Mixes | Detects and amplifies specific SARS-CoV-2 gene targets. | GenomeCov19 Detection Kit (ABM), TaqPath COVID-19 RT-PCR Kit (Thermo Fisher), Bosphore Novel Coronavirus Detection Kit [18] [8] [6] |
| Rapid Antigen Test Kits | For point-of-care detection of SARS-CoV-2 nucleocapsid protein. | SD Biosensor Standard Q, Zydus Cadila RAT, PCL Spit Rapid Antigen Test, Sofia SARS Antigen FIA (Quidel) [18] [6] [41] |
| Positive Control Material | Validates RT-PCR assay performance and standard curve generation. | 2019-nCoV N Positive Control (IDT) [45] |
Substantial and consistent evidence confirms that the performance of SARS-CoV-2 Rapid Antigen Tests is markedly different in symptomatic versus asymptomatic populations. The significantly higher sensitivity observed in symptomatic individuals is closely tied to their correspondingly higher viral loads. While RATs offer immense value for rapid screening and are highly specific, researchers, clinicians, and public health officials must account for these performance limitations, particularly when deploying them for asymptomatic screening. The choice between RAT and RT-PCR should be guided by the testing objective: RATs are excellent for quickly identifying infectious individuals in high-prevalence or high-pretest probability settings, whereas RT-PCR remains the unrivaled gold standard for diagnostic confirmation and detection of low viral loads in surveillance or low-prevalence scenarios.
The continuous evolution of SARS-CoV-2 has presented significant challenges to COVID-19 diagnostic strategies. The emergence of the Omicron variant and its sublineages, characterized by an unprecedented number of mutations, has raised critical questions regarding the reliability of both rapid antigen tests (Ag-RDTs) and molecular methods like real-time reverse transcription polymerase chain reaction (RT-PCR). This guide provides a systematic comparison of diagnostic test performance, focusing on the differential detection of Delta and Omicron variants. We synthesize experimental data and analytical evaluations to offer researchers, scientists, and drug development professionals evidence-based insights into diagnostic shifts in the face of viral evolution, framing this within the broader thesis of Ag-RDT versus RT-PCR comparative performance.
The table below summarizes the core findings from recent studies evaluating diagnostic test performance across SARS-CoV-2 variants.
Table 1: Summary of Diagnostic Test Performance Across Variants
| Study Focus | Key Comparative Finding | Variant-Specific Performance Notes | Primary Data Source |
|---|---|---|---|
| Ag-RDT Clinical Sensitivity (Meta-Analysis) | Pooled sensitivity: 67.1% for Omicron [46]. | Performance is highly dependent on viral load; sensitivity drops significantly at Ct values >25 [46]. | Systematic review & meta-analysis of 18 studies [46]. |
| Ag-RDT vs. PCR (Serial Testing) | No statistically significant difference in Ag-RDT sensitivity between Delta and Omicron was found [47]. | Sensitivity on the same day as first positive PCR was low for both (Delta: 15.5%, Omicron: 22.1%), improving with serial testing [47]. | Prospective cohort study (n=207 PCR-positive) [47]. |
| Ag-RDT Analytical Sensitivity | Marked heterogeneity exists among different Ag-RDT brands for detecting Omicron BA.4/BA.5 [48] [49]. | Up to 443-fold higher viral load required for the worst-performing RAT vs. the best-performing one for BA.4 [48] [49]. | Retrospective lab evaluation of 10 RATs (n=171 swabs) [48] [49]. |
| RT-PCR for Variant Identification | Specific RT-PCR assays can accurately differentiate VOCs, serving as a surrogate for sequencing [50]. | Assays targeting mutations (e.g., K417N, E484-, N501Y for Omicron; L452R for Delta) showed 100% accuracy versus sequencing [50]. | Laboratory evaluation of multiplex RT-PCR on 100 positive swabs [50]. |
Comparative Performance Data: Antigen Tests vs. RT-PCR
A comprehensive meta-analysis of 18 studies concluded that the pooled sensitivity of Ag-RDTs for the Omicron variant was 0.671 (95% CI: 0.595-0.721), while specificity remained high at 1.000 (95% CI: 0.997-1.000) [46]. This confirms that while Ag-RDTs are excellent for ruling out non-infected individuals, their ability to confirm infection (sensitivity) is moderate and can be influenced by the viral variant and other factors.
Impact of Viral Load
The most critical factor affecting Ag-RDT sensitivity is viral load, inversely correlated with RT-PCR cycle threshold (Ct) values. The performance disparity between Ag-RDTs and RT-PCR becomes most apparent in samples with low to medium viral loads.
Table 2: Ag-RDT Performance Based on Viral Load (Ct Values) for Omicron
| Ct Value Range | Viral Load Category | Ag-RDT True Positive Rate Range | Study Reference |
|---|---|---|---|
| < 25 | Very High | 94.3% to 34.3% | [48] [49] |
| 25 - 30 | High / Medium | 25.6% to 0% | [48] [49] |
| > 30 | Low | Very low to negligible | [46] |
One study noted that only 7.2% of individuals who were RT-PCR-positive for less than 48 hours tested positive via Ag-RDT within a week, highlighting the lag in Ag-RDT detectability during early infection [47].
Variant-Specific Performance
While early reports suggested Ag-RDTs had lower sensitivity for Omicron, larger controlled studies offer a more nuanced view. A secondary analysis of a large prospective cohort in the U.S. found no statistically significant difference in Ag-RDT sensitivity between Delta and Omicron variants, whether tested on the same day as the first positive PCR or 48 hours later [47]. The study emphasized that serial testing improves the sensitivity of Ag-RDTs for both variants [47].
However, a major challenge is the significant heterogeneity between different Ag-RDT brands. An independent laboratory evaluation of ten commonly used tests revealed vast differences in their ability to detect Omicron BA.4 and BA.5. The 50% limit of detection (LoD50) varied considerably, requiring up to 443-fold (for BA.4) and 56-fold (for BA.5) higher RNA copy numbers for the worst-performing test compared to the best [48] [49]. This indicates that the choice of brand is a critical variable when assessing overall Ag-RDT performance against Omicron.
Experimental Protocols for Diagnostic Evaluation
Protocol for Evaluating Ag-RDT Clinical Sensitivity
Objective: To determine the clinical sensitivity and specificity of rapid antigen tests (Ag-RDTs) against SARS-CoV-2 variants in comparison to RT-PCR.
Methodology Overview: This protocol is based on a prospective longitudinal cohort study design [47].
- Study Population & Sampling: Asymptomatic or symptomatic individuals are enrolled. Participants self-collect anterior nasal swabs every 48 hours for a period of 15 days.
- Sample Processing: For each testing time point, two swabs are collected. One swab is used for the Ag-RDT immediately, following the manufacturer's instructions. The second swab is placed in viral transport medium (VTM) and shipped to a central laboratory for RT-PCR analysis.
- Reference Testing: RT-PCR is performed using a validated assay (e.g., Roche cobas SARS-CoV-2 assay). Cycle threshold (Ct) values for target genes (e.g., the E gene) are recorded as a surrogate for viral load.
- Variant Determination: Variant assignment is performed via whole-genome sequencing or variant-specific PCR on RT-PCR-positive samples. Cut-off dates based on local variant prevalence or sequencing results can be used for classification [47].
- Data Analysis: Ag-RDT results are compared to RT-PCR results for each matched sample. Sensitivity is calculated as (Number of true positives / (Number of true positives + Number of false negatives)) * 100. Analysis is stratified by variant and viral load (Ct value).
Protocol for Evaluating Ag-RDT Analytical Sensitivity (Limit of Detection)
Objective: To assess and compare the analytical sensitivity (Limit of Detection, LoD) of various Ag-RDTs for specific SARS-CoV-2 variants.
Methodology Overview: This protocol is based on a retrospective in vitro laboratory study [48] [49].
- Sample Panel Creation: A panel of characterized respiratory swab samples is created from SARS-CoV-2 RT-PCR-positive patients. Samples are selected to cover a range of viral loads (e.g., Ct values from 17 to 36) and are confirmed for their variant (e.g., BA.4, BA.5) using variant-specific PCR.
- Test Execution: A defined volume (e.g., 50 µL) of the virus-containing transport medium from each characterized sample is applied to each Ag-RDT under evaluation by trained staff, following a standardized operating procedure to minimize variability. The tests are performed in a blinded manner regarding the viral load and variant.
- Result Interpretation: After the manufacturer-specified incubation time (e.g., 15 minutes), the tests are read under consistent lighting conditions. Any visible test line, regardless of intensity, is considered positive.
- Data Analysis: The 50% limit of detection (LoD50) is determined, representing the viral load (in RNA copies per test) at which 50% of the test replicates return a positive result. The LoD50 values are compared across different Ag-RDTs and variants.
The Scientist's Toolkit: Key Research Reagents & Materials
The following table details essential materials and reagents used in the cited studies for evaluating SARS-CoV-2 diagnostic tests.
Table 3: Essential Research Materials for Diagnostic Test Evaluation
| Item / Reagent | Function / Application | Example Specifications / Notes |
|---|---|---|
| Anterior Nasal Swabs | Sample collection from study participants. | Used for both self-testing Ag-RDTs and sample collection for RT-PCR [47]. |
| Viral Transport Medium (VTM) | Preservation of virus viability and nucleic acids during transport. | Used to store swabs destined for central lab RT-PCR testing [47] [49]. |
| RNA Extraction Kits | Isolation of high-quality viral RNA from clinical samples. | e.g., QIAamp Viral RNA Kits used on QIAcube platform [50]. Critical for reliable RT-PCR results. |
| RT-PCR Master Mixes | Amplification and detection of viral RNA targets. | Contains reverse transcriptase, DNA polymerase, dNTPs, buffers. Often include probes for real-time detection [51]. |
| Variant-Specific PCR Assays | Rapid presumptive identification of SARS-CoV-2 variants. | e.g., Seegene Allplex SARS-CoV-2 Variants II Assay, Clonit COVID-19 Ultra Variant Catcher. Target key spike mutations [50]. |
| Whole Genome Sequencing Kits | Gold-standard for variant confirmation and discovery. | e.g., Amplicon-based NGS protocols (ARTIC network). Provides complete genetic information [47] [50]. |
| Characterized Clinical Samples | Well-defined sample panels for analytical evaluation. | Samples with known variant (by sequencing) and viral load (by Ct value) are essential for LoD studies [48] [49]. |
Discussion and Research Implications
The body of evidence indicates that the fundamental performance gap between Ag-RDTs and RT-PCR persists with the Omicron lineage. RT-PCR remains the more sensitive gold standard, capable of detecting infections earlier and at lower viral loads, and is readily adaptable to identify specific variants through targeted assays or sequencing [52] [51] [50]. The primary challenge for Ag-RDTs is not necessarily a universal, variant-specific failure but rather their inherent dependence on high viral loads for reliable detection, a characteristic that is exacerbated by significant performance variability between different test brands [48] [49] [53].
For researchers and public health officials, these findings underscore several critical points. First, the choice of Ag-RDT brand matters profoundly; independent performance evaluations are crucial for selecting tests used in surveillance or clinical guidance. Second, a negative Ag-RDT result should not be interpreted as absence of infection, especially in low-prevalence settings or in individuals with low viral loads. Serial testing over 48-hour intervals remains a recommended strategy to mitigate the risk of false negatives [47]. Finally, RT-PCR continues to be indispensable for situations requiring high sensitivity and for genomic surveillance efforts tracking the virus's evolution. As SARS-CoV-2 continues to mutate, ongoing, independent evaluation of both existing and new diagnostic platforms against emerging variants is paramount.
The strategic selection of diagnostic tests is a critical component of effective disease management and outbreak control. This guide provides an objective comparison between Rapid Antigen Tests (Ag-RDTs) and real-time reverse transcription polymerasease chain reaction (RT-PCR) tests, focusing on the operational logistics that influence their deployment in research and clinical settings. The comparative performance is analyzed through the lenses of turnaround time, cost-effectiveness, and technical requirements, providing researchers and drug development professionals with evidence-based data to inform diagnostic strategies. The framework is grounded in a broader thesis on the comparative performance of these diagnostic modalities, with a focus on their respective roles in pandemic preparedness and response.
Performance Metrics and Operational Parameters
Comparative Analysis of Key Performance Indicators
The fundamental differences in the technological principles of antigen and PCR tests directly translate to distinct performance and operational characteristics. Table 1 summarizes the core logistical and performance differences between the two testing modalities, highlighting the inherent trade-offs between speed and sensitivity.
Table 1: Key Operational and Performance Characteristics of RT-PCR vs. Rapid Antigen Tests
| Parameter | RT-PCR Test | Rapid Antigen Test (Ag-RDT) |
|---|---|---|
| Target Analyte | Viral RNA [54] | Viral surface proteins (antigens) [54] |
| Turnaround Time | Several hours to days (includes processing and transportation) [54] | 15-30 minutes [55] [18] |
| Approximate Cost per Test | $100 or more [54] | $10-$15 [54] |
| Sensitivity (Overall) | ≈100% (Gold standard) [54] | Variable; 49%-100% in studies [55] [26] [20] |
| Specificity | ≈100% (Gold standard) [54] | High (≥97%-99%) [55] [26] [18] |
| Technical Skill Required | High (skilled laboratory technicians) [54] | Low (can be performed by non-specialists or at home) [54] |
| Equipment Needs | Specialized, expensive laboratory equipment (thermocyclers) [55] [54] | Minimal; no equipment required [55] [54] |
| Infrastructure | Centralized laboratory [54] | Point-of-care, field use, or home [55] [54] |
| Best for Detecting | Active infection at all stages, including low viral loads [16] | Active infection with high viral load [16] [26] |
The Critical Role of Viral Load
A dominant factor influencing the sensitivity of antigen tests is the viral load in the patient sample, often inversely correlated with RT-PCR Cycle Threshold (Ct) values. Antigen test sensitivity is profoundly high when the viral load is high (Ct values < 25) but drops significantly as the viral load decreases [55] [26].
- High Viral Load (Ct < 25): One study reported antigen test sensitivity of 100% for samples with Ct < 25 [55]. Another large real-world study found agreement with RT-PCR was 90.85% for samples with Cq < 20 [26].
- Low Viral Load (Ct > 30): The same real-world study showed agreement plummeted to 5.59% for samples with Cq ≥ 33 [26]. A separate review noted that at low viral loads, antigen sensitivities can fall below 30%, meaning they may miss 7 out of 10 infections [16].
This relationship underscores that antigen tests are most reliable during the peak infectious period, which aligns with their utility in rapidly identifying individuals most likely to transmit the virus.
Experimental Data and Methodologies
Representative Experimental Protocols
The data presented in Table 1 are synthesized from multiple independent studies. The following are detailed methodologies from key publications that exemplify standard protocols for comparative performance evaluation.
Protocol for Antigen Test Evaluation (IDCM Journal)
A study comparing the mö-screen Corona Antigen Test with RT-PCR provides a standard framework for analytical performance evaluation [55].
- Study Population: 200 symptomatic patients with symptoms lasting less than a week.
- Sample Collection: Two combined oro/nasopharyngeal swabs were collected simultaneously by healthcare workers from each participant.
- Testing Procedure: One swab was transported in a viral nucleic acid transport medium (vNAT) for RT-PCR analysis. The other was sent in a sterile tube for antigen testing. The antigen test was performed according to the manufacturer's instructions, with results read within 15 minutes.
- RT-PCR Method: The Biospeedy SARS-CoV-2 RT-PCR test, which targets the N, ORF1a, and ORF1b genes, was used. RNA extraction was performed using vNat Technology, and amplification was done on a Rotor-Gene RT-PCR device. A Ct value lower than 35 was considered positive.
- Data Analysis: Sensitivity, specificity, PPV, and NPV were calculated. A semi-quantitative analysis of antigen test band intensity was performed, and its correlation with Ct values was analyzed using a Pearson correlation test.
Protocol for Large-Scale Real-World Accuracy (PMC Study)
A large cross-sectional study in Brazil offers a robust model for real-world accuracy assessment [26].
- Study Population: 2882 symptomatic individuals within the Brazilian public health system.
- Sample Collection: Two nasopharyngeal swabs were collected simultaneously.
- Testing Procedure: One swab was analyzed immediately using one of two Ag-RDT kits (TR DPP COVID-19 or IBMP TR Covid Ag kit). The other swab was stored at -80°C in Viral Transport Medium (VTM) for later RT-PCR analysis.
- RT-PCR Method: RNA was extracted using an automated system (Loccus Biotecnologia) and tested via RT-PCR on a QuantStudio 5 instrument using the CDC's diagnostic protocol.
- Data Analysis: Sensitivity, specificity, accuracy, PPV, and NPV were calculated globally and for sub-categories (e.g., by symptom days, vaccination status). Performance was also stratified by the RT-PCR Ct values of positive samples.
Signaling Pathways and Workflow Logic
The fundamental difference between the two tests lies in their detection pathway. The following diagram illustrates the core operational workflows for RT-PCR and rapid antigen tests.
Diagram 1: Diagnostic Test Workflow Comparison
The logical relationship defining the appropriate use case for each test, heavily influenced by the viral load, can be summarized as follows:
Diagram 2: Test Selection Logic
The Scientist's Toolkit: Research Reagent Solutions
The execution of the experimental protocols described above relies on a suite of specific reagents and materials. Table 2 details key research reagent solutions essential for conducting comparative evaluations of antigen and PCR tests.
Table 2: Essential Research Reagents for Diagnostic Test Comparison
| Reagent/Material | Function in Protocol | Example Specifications / Notes |
|---|---|---|
| Combined Oro/Nasopharyngeal Swabs | Sample collection from patients. | FLOQSwabs (Copan, Italy) are commonly used [55]. |
| Viral Nucleic Acid Transport (vNAT) Medium | Preserves viral RNA for RT-PCR testing during transport [55]. | Contains reagents to inactivate virus and stabilize nucleic acids. |
| Viral Transport Medium (VTM) | Preserves virus viability and nucleic acids for transport to the lab [26]. | Used for storage before RNA extraction. |
| Rapid Antigen Test Kits | For qualitative detection of SARS-CoV-2 antigens. | Kits like mö-screen (Qiagen) [55], SD Biosensor [18], TR DPP (Bio-Manguinhos) [26]. Include test cassette, buffer, and reagents. |
| RNA Extraction Kit | Isolates and purifies viral RNA from patient samples. | Kits like Mag-Bind Viral DNA/RNA 96 kit (Omega Bio-Tek), used with automated extractors (e.g., Kingfisher Flex) [26]. |
| RT-PCR Master Mix | Contains enzymes, dNTPs, and buffers for reverse transcription and DNA amplification. | GoTaq Probe 1-Step RT-qPCR System (Promega) [26]. |
| SARS-CoV-2 Primers/Probes | Specifically targets viral genes for amplification and detection in RT-PCR. | CDC protocol targets N gene, S gene, etc. [26]. |
| RT-PCR Instrument | Equipment to perform thermal cycling and fluorescent detection. | Rotor-Gene (Qiagen) [55], QuantStudio 5 (Applied Biosystems) [26]. |
The choice between RT-PCR and rapid antigen tests is not a matter of superiority but of strategic application. RT-PCR remains the gold standard for diagnostic confirmation due to its superior sensitivity, particularly in low viral load scenarios. However, rapid antigen tests offer a powerful tool for public health interventions where speed, cost, and operational simplicity are paramount. Their ability to quickly identify individuals with high viral loads, who are most infectious, makes them indispensable for outbreak control and serial testing strategies. Future research and development, potentially leveraging artificial intelligence and novel biosensors [56], will continue to enhance the performance and integration of both testing modalities in the global diagnostic landscape.
This guide provides an objective comparison of the performance characteristics of Rapid Antigen Tests (RADs) and real-time Reverse Transcription Polymerase Chain Reaction (RT-PCR) for detecting SARS-CoV-2. Aimed at researchers and drug development professionals, it synthesizes data from surveillance networks and peer-reviewed studies to evaluate these methodologies within a framework of global health guidelines.
The World Health Organization (WHO) and the U.S. Centers for Disease Control and Prevention (CDC) provide the foundational frameworks for diagnostic testing, emphasizing accurate case identification to interrupt disease transmission. The European Centre for Disease Prevention and Control (ECDC) supports this by collecting, analyzing, and sharing data on infectious diseases to guide pan-European response efforts [57]. While the principles for testing are consistent—right test, right patient, right time—the application of RADs versus RT-PCR is dictated by the specific context, including the stage of infection and the population's viral load.
The fundamental difference between these tests lies in what they detect. RT-PCR, the established gold standard, is a molecular technique that amplifies and detects viral RNA, offering high sensitivity to identify even minute quantities of the virus [9] [8]. In contrast, Rapid Antigen Tests (RADs) are immunoassays that detect the presence of viral proteins (antigens). They are designed for speed and convenience, providing results in minutes, but typically require a higher viral load in the sample to turn positive [58] [8]. This core distinction in methodology underpins all differences in their performance, cost, and ideal use cases.
Comparative Performance Data: Sensitivity, Specificity, and Viral Load
The performance of RADs is highly variable and critically dependent on viral load, which is inversely correlated with the RT-PCR Cycle Threshold (Ct) value. A lower Ct value indicates a higher viral load. The following table synthesizes performance data from multiple clinical studies.
Table 1: Comparative Performance of Rapid Antigen Tests vs. RT-PCR
| Study / Context | Overall Sensitivity | Overall Specificity | Sensitivity by Viral Load (Ct Value) | Key Findings |
|---|---|---|---|---|
| General RAD Performance (Retrospective Analysis) | 56% compared to RT-PCR [9] | 93% [9] | 74% (≤24h post-symptom onset); decreased to 60% after 24h [9] | Performance in practice is often inferior to manufacturer claims. Sensitivity decreases rapidly after symptom onset [9]. |
| PCL Spit RAD Kit (Cross-sectional Study) | 67% [8] | 75% [8] | 100% (Ct ≤20); 63% (Ct 21-25); 22% (Ct >26) [8] | Demonstrates excellent sensitivity only in high viral load cases. |
| BOSON RAD Kit (Clinical Study) | 95.27% (in symptomatic individuals) [58] | 100% [58] | 100% (Ct <26, Omicron VOC); 83.33% (Ct <34, Delta VOC) [58] | Shows high performance in symptomatic individuals and detects VOCs. |
| Dr. KSU H1N1 RT-PCR Kit (Validation Study) | 99.11% [59] | 83.78% [59] | Specificity was 100% on day 1 of symptoms, decreasing to 75% on/after day 3 [59] | Highlights that even molecular test performance can be affected by timing of sample collection. |
The data reveals a consistent trend: RADs exhibit high sensitivity (often >95%) in patients with high viral loads (typically Ct values <25-26), which are most common in the pre-symptomatic and early symptomatic phases. However, their overall sensitivity drops significantly when including patients with lower viral loads, with some studies showing averages as low as 56-67% [9] [8]. This makes them excellent tools for identifying infectious individuals but less suitable for ruling out infection entirely. Specificity is generally high, meaning a positive RAD result is a reliable indicator of infection.
Experimental Protocols and Methodologies
To critically appraise the data in comparison guides, understanding the underlying experimental protocols is essential. The following workflows outline standard procedures for evaluating RADs and the reference RT-PCR method.
Protocol for RAD Performance Evaluation
A typical cross-sectional study design is used to evaluate RADs against the RT-PCR gold standard [8].
- Sample Collection: Paired samples (e.g., nasopharyngeal and saliva) are collected from a cohort of symptomatic and/or asymptomatic individuals.
- RT-PCR Testing: The reference test is performed. This involves:
- RNA Extraction: Using a viral nucleic acid extraction kit [8].
- Amplification: Using a detection kit (e.g., Bosphore Novel Coronavirus Detection Kit) on a real-time thermal cycler. A typical protocol includes reverse transcription at 50°C for 20 minutes, Taq activation at 95°C for 10 minutes, followed by 40 cycles of denaturation (95°C for 15s) and annealing/extension (60°C for 30s) [8].
- Result Interpretation: Samples with Ct values below a predetermined threshold (e.g., 36) are considered positive.
- Rapid Antigen Testing: The RAD is performed according to the manufacturer's instructions, often involving mixing the sample with a buffer and applying it to a test strip for immunochromatographic detection [8].
- Data Analysis: A 2x2 contingency table is constructed to calculate sensitivity, specificity, and predictive values. Logistic regression analysis is often used to examine the association between RAD results and RT-PCR Ct values [8].
Standardized RT-PCR (StaRT PCR) Protocol
For a deeper understanding of PCR quantification, the Standardized Competitive RT-PCR (StaRT PCR) protocol offers a reproducible method.
- Template Mixing: A known quantity of a Competitive Template (CT) is mixed with the Native Template (NT) in a PCR reaction. The CT is nearly identical to the NT but can be distinguished after amplification [60].
- PCR Amplification: The mixture undergoes standard PCR amplification.
- Endpoint Analysis: The NT and CT band intensities are compared after gel electrophoresis. Quantification is based on the NT/CT ratio, with the most precise results (CV <3.8%) achieved when the ratio is close to 1:1 [60].
- Normalization: Transcript numbers are expressed as copies per million transcripts of a control/reference gene (e.g., β-actin), enabling relational quantification across multiple genes [60].
Mechanistic Insights and Signaling Pathways
Understanding the biological and technical principles behind each test is key to interpreting their performance differences. The following diagram illustrates the core mechanisms.
The RAD mechanism is a direct binding event. The test contains antibodies specific to SARS-CoV-2 nucleocapsid proteins. If these proteins are present in sufficient concentration, they bind to the antibody conjugates and are captured at the test line, producing a visual signal. This process does not involve amplification, hence its dependency on high viral load [58] [8].
The RT-PCR mechanism is an amplification process. It starts by converting the viral RNA into DNA. Then, through repeated heating and cooling cycles, specific primers and enzymes exponentially copy the target DNA sequence. A fluorescent probe binds to the amplified DNA, and the instrument measures the fluorescence in real-time. The Cycle Threshold (Ct) is the number of cycles required for the fluorescence to cross a threshold, serving as an inverse proxy for the initial viral load: a low Ct means high viral load was present in the sample [60] [8].
The Scientist's Toolkit: Key Research Reagents and Materials
For researchers designing validation studies or developing new assays, the following reagents and materials are critical components.
Table 2: Essential Research Reagents for SARS-CoV-2 Test Development and Validation
| Reagent / Material | Function | Example from Literature |
|---|---|---|
| Viral Nucleic Acid Extraction Kit | Purifies viral RNA from patient transport media to remove PCR inhibitors. | GF-1 Viral Nucleic Acid Extraction Kit [8] |
| Real-Time PCR Detection Kit | Contains primers, probes, and enzymes for the specific amplification and detection of SARS-CoV-2 RNA. | Bosphore Novel Coronavirus (2019-nCoV) Detection Kit v4 [8] |
| Competitive Template (CT) | Internal standard for quantitative RT-PCR; allows precise transcript quantification by competing with the native template. | Used in StaRT PCR for genes like RB, E2F1, CDKN2A [60] |
| Reference Gene Primers/Probes | Amplifies a constitutively expressed gene (e.g., β-actin) to normalize sample-to-sample variation. | β-actin (ACTB) used to express transcript numbers as "copies per million" [60] |
| Universal Viral Transport (UVT) Media | Preserves virus integrity and nucleic acids during sample transport and storage. | Used for nasopharyngeal swabs prior to RNA extraction [8] |
| Recombinant Viral Antigens | Used as positive controls and for calibrating immunoassays; essential for determining assay sensitivity. | Recombinant nucleocapsid proteins for RAD development [58] |
| Monoclonal Antibodies | Target-specific antibodies that form the core of immunoassay test lines and conjugates. | Antibodies against SARS-CoV-2 nucleocapsid protein in RADs [58] |
The comparative data clearly delineates the roles for RADs and RT-PCR in public health and clinical practice. RADs serve as powerful tools for rapid screening in high-prevalence settings and during the acute phase of infection, effectively identifying contagious individuals. Their speed, cost-effectiveness, and simplicity support their use in decentralized settings. Conversely, RT-PCR remains the indispensable reference method for confirmatory diagnosis, rule-out testing in low-prevalence scenarios, genomic surveillance, and all research applications requiring high sensitivity and quantification.
For researchers and drug developers, these findings highlight several critical areas. First, the performance of RADs against evolving Variants of Concern (VOCs) requires continuous evaluation, as mutations in viral proteins could potentially affect antibody binding [61] [58]. Second, the pursuit of novel assay formats that combine the sensitivity of molecular techniques with the speed and simplicity of RADs represents a significant innovation frontier. Finally, standardized protocols for evaluating and validating these diagnostics, incorporating tools like StaRT PCR for precise quantification, are fundamental for generating reliable, comparable data that can effectively inform public health guidelines from bodies like the WHO, CDC, and ECDC.
Addressing Performance Gaps and Enhancing Diagnostic Reliability
The comparative performance of rapid antigen tests (RATs) and real-time reverse transcription polymerase chain reaction (RT-PCR) for SARS-CoV-2 detection reveals a critical dependency on viral load, which directly impacts clinical and public health decision-making. While RT-PCR remains the gold standard for COVID-19 diagnosis due to its high sensitivity in detecting viral RNA, rapid antigen tests offer the advantages of speed, cost-effectiveness, and point-of-care application [23] [62]. However, this convenience comes with a significant limitation: RATs demonstrate substantially higher false-negative rates during phases of infection characterized by low viral load, particularly in the early pre-symptomatic and late convalescent stages [63] [64]. Understanding this relationship between viral load and test sensitivity is paramount for researchers and clinicians interpreting diagnostic results, especially when making determinations about treatment initiation, infection control measures, and public health interventions.
The fundamental technological difference between these diagnostic approaches explains their differential performance. RT-PCR assays amplify specific sequences of viral genetic material, enabling detection of even minute quantities of SARS-CoV-2 RNA [65]. In contrast, rapid antigen tests employ immunochromatographic methods to detect viral surface proteins without amplification, requiring a sufficient concentration of virions to generate a visual signal [62] [8]. This distinction becomes clinically significant when viral loads fall near the limit of detection for RATs, resulting in false-negative outcomes that can inadvertently facilitate transmission if infectious individuals prematurely discontinue isolation measures.
Performance Data: Quantitative Comparison of Detection Capabilities
Comprehensive Sensitivity Analysis Across Viral Load Ranges
Table 1: Comparative sensitivity of RT-PCR versus rapid antigen tests across different viral load ranges
| Viral Load Indicator | RT-PCR Sensitivity | Rapid Antigen Test Sensitivity | Study Reference |
|---|---|---|---|
| Ct Value ≤25 (High viral load) | ~100% | 96% (95% CI: 95-97) | [62] |
| Ct Value 21-25 | ~100% | 63% | [8] |
| Ct Value 26-30 | ~100% | 22% | [8] |
| Ct Value >30 (Low viral load) | ~100% | 31.82% (FIA), 27.27% (LFIA) | [23] |
| Symptomatic patients | ~100% | 82% (95% CI: 82-82) | [62] |
| Asymptomatic patients | ~100% | 68% (95% CI: 65-71) | [62] |
The data presented in Table 1 unequivocally demonstrates the inverse relationship between cycle threshold (Ct) values and RAT sensitivity. Ct values, which represent the number of amplification cycles required for the PCR signal to cross a detection threshold, serve as a proxy for viral load, with lower values indicating higher viral concentrations [23] [66]. The superior performance of RATs at Ct values ≤25 aligns with the period of peak infectivity, as individuals typically exhibit the highest viral loads during the symptomatic phase of infection [63] [64]. This correlation underscores the utility of RATs for identifying transmission-risk individuals despite their limitations in low viral load scenarios.
Table 2: Overall pooled performance characteristics of rapid antigen tests from systematic review
| Performance Metric | Pooled Result | Sample Type Variations | Study Characteristics |
|---|---|---|---|
| Overall Sensitivity | 70% (95% CI: 69-71) | Nasal swabs: 83% (80-86) | [62] |
| Overall Specificity | 98% (95% CI: 98-98) | Nasopharyngeal: 71% (70-72) | [62] |
| Positive Predictive Value | 86.36% (at 70% prevalence) | Throat swabs: 69% (63-75) | [8] |
| Negative Predictive Value | 50.00% (at 70% prevalence) | Saliva: 68% (59-77) | [8] |
The comprehensive meta-analysis data in Table 2 reveals how sample collection methods influence test performance. Nasal swabs consistently demonstrate higher sensitivity compared to nasopharyngeal, throat, and saliva specimens, possibly reflecting differential viral shedding patterns across respiratory tract compartments [62]. The modest negative predictive value of 50% at high disease prevalence highlights the clinical risk of false-negative results in settings with active community transmission, necessitating confirmatory RT-PCR testing when clinical suspicion remains high despite a negative RAT result [8].
Experimental Insights: Methodologies and Variant Performance
Key Study Designs and Protocols
The performance characteristics outlined in previous sections derive from rigorous comparative studies employing standardized methodologies. A 2024 comparative study evaluating RT-PCR and antigen-based rapid diagnostic tests (Ag-RDTs) utilized simultaneous testing of 268 samples for SARS-CoV-2 using RT-PCR and two Ag-RDT formats: fluorescence immunoassay (FIA) and lateral flow immunoassay (LFIA) [23]. Viral load quantification was performed with parallel variant identification using PCR-based assays, enabling correlated analysis of test performance across different viral concentrations and circulating variants [23]. This methodological approach allowed researchers to determine that both Ag-RDT formats showed strong agreement with RT-PCR (κ = 0.78-0.80) while revealing their differential sensitivity across the viral load spectrum.
Another substantial cross-sectional, single-blinded study conducted in Lahore, Pakistan, analyzed 7,580 samples collected between May 2021 and June 2022, with 320 selected samples undergoing parallel testing via RAT and RT-PCR [8]. This study employed logistic regression analysis to examine the association between RAT results and RT-PCR cycle threshold values, using the PCL Spit Rapid Antigen Test Kit to detect SARS-CoV-2 nucleocapsid protein in saliva samples [8]. The inclusion of samples with varying CT values enabled the researchers to construct a precise sensitivity profile across different viral load ranges, demonstrating the dramatic decline in RAT sensitivity as CT values increase beyond 25.
SARS-CoV-2 Variant Specificity
The continual emergence of SARS-CoV-2 variants has raised concerns regarding potential diagnostic escape due to mutations in viral proteins. Research investigating this phenomenon has yielded reassuring results for currently circulating variants. The 2024 comparative study examined variant specificity and found that both FIA and LFIA rapid tests demonstrated 100% sensitivity for detecting the Omicron variant, outperforming their detection rates for Alpha (78.85% for FIA, 69.23% for LFIA) and Delta (72.22% for FIA, 83.33% for LFIA) variants [23]. This suggests that common RAT formats maintain effectiveness against currently dominant circulating strains despite ongoing viral evolution.
Figure 1: The mechanism of rapid antigen test false negatives in low viral load conditions. Unlike RT-PCR, RATs lack an amplification step and cannot detect viral proteins below their concentration threshold.
Implications for Research and Clinical Practice
Clinical Consequences of False-Negative Results
The implications of false-negative rapid antigen tests extend beyond diagnostic accuracy to tangible clinical outcomes, particularly in vulnerable populations. A retrospective study examining influenza rapid antigen testing in pediatric patients provides an instructive parallel, revealing that false-negative RAT results led to significant delays in antiviral initiation (median turnaround time of 52.8 hours for false-negative patients versus 4 hours for RAT-positive patients) [67]. This delay was associated with substantially increased risks of severe influenza infection (OR: 6.8) and mechanical ventilation requirement (OR: 16.2), highlighting the potential clinical consequences of diagnostic false negatives in the context of viral respiratory infections [67].
Mathematical simulation studies modeling SARS-CoV-2 transmission dynamics further demonstrate the population-level implications of false-negative testing. These models indicate a continuous increase in infectious individuals over time in populations who initially tested negative, with the false-negative rate of a test and the time elapsed since testing serving as critical determinants of subsequent transmission events [68]. This underscores the importance of accounting for test limitations when implementing repeat screening protocols in high-risk settings such as healthcare institutions and congregate living facilities.
Optimal Use Cases and Testing Strategies
Despite their limitations in low viral load scenarios, rapid antigen tests retain important roles in pandemic control when deployed strategically. Their peak performance during the high viral load phase aligns with the period of greatest infectivity, making them valuable tools for identifying transmission-risk individuals [63] [64]. Experts recommend that negative RAT results in symptomatic individuals or known contacts should be followed by repeat testing after 24-48 hours or confirmatory RT-PCR testing, as a single negative RAT cannot reliably exclude infection [63] [64].
For research applications, the strategic integration of both testing modalities maximizes their respective advantages. RT-PCR remains indispensable for confirming negative RAT results in experimental settings, diagnosing infection in low-prevalence populations, and determining clearance of infection [23] [62]. Conversely, RATs offer practical advantages for serial testing protocols, monitoring infectivity in treatment studies, and conducting research in resource-limited settings where laboratory infrastructure for molecular testing is unavailable [62] [8].
Essential Research Reagent Solutions
Table 3: Key research reagents and materials for comparative test performance studies
| Reagent/Material | Primary Function | Application Notes |
|---|---|---|
| Viral Transport Medium | Preserves specimen integrity during transport/swab storage | Essential for maintaining RNA stability for RT-PCR; requires refrigeration at 2-8°C if processing exceeds 72 hours [65] |
| Universal Transport Medium | Alternative transport medium during supply shortages | Effective for specimen preservation when standard viral transport media are unavailable [65] |
| Nucleic Acid Extraction Kits | Isolate viral RNA for RT-PCR detection | GF-1 Viral Nucleic Acid Extraction Kit used in Pakistani study; extraction-free methods also available [8] |
| PCR Detection Kits | Amplify and detect viral RNA sequences | Bosphore Novel Coronavirus Detection Kit v4 targets multiple viral genes; platform selection affects sensitivity [65] [8] |
| Reference Standard Materials | Validate test performance and determine LOD | AccuPlex SARS-CoV-2 Reference material contains target sequences; in vitro transcribed RNA alternatives available [65] |
The research reagents detailed in Table 3 represent fundamental components for conducting robust diagnostic comparison studies. The selection of appropriate transport media proves critical for maintaining sample integrity, particularly when evaluating low viral load samples where degradation could significantly impact results [65]. Similarly, the choice of reference standards directly influences limit of detection (LOD) determinations, with studies utilizing either intact virus particles (better simulating clinical samples) or nucleotide sequences alone [65]. These methodological considerations substantially impact the measured performance characteristics of both RATs and RT-PCR assays.
Figure 2: Recommended testing algorithm accounting for RAT limitations in low viral load scenarios. Confirmatory testing and repeat testing strategies compensate for reduced sensitivity during early/late infection.
The comparative analysis of rapid antigen tests and RT-PCR reveals a consistent pattern of viral load-dependent performance, with RAT sensitivity declining dramatically during early and late infection phases when viral concentrations fall below the detection threshold. This fundamental limitation must guide both clinical application and research interpretation of rapid test results. For drug development professionals and researchers, these findings underscore the necessity of aligning testing methodologies with specific study objectives—utilizing RT-PCR for definitive diagnosis and clearance studies, while employing RATs for infectivity assessment and serial monitoring in high viral load scenarios. Future development of next-generation antigen tests should focus on enhancing sensitivity without sacrificing the speed and accessibility that make RATs valuable tools in pandemic control. As SARS-CoV-2 continues to evolve, ongoing evaluation of test performance against emerging variants remains essential for maintaining diagnostic accuracy across the spectrum of infection.
The rapid development and deployment of diagnostic tests were critical components of the global response to the COVID-19 pandemic. Among these, rapid antigen tests (Ag-RDTs) emerged as vital tools for mass screening and rapid case identification due to their quick turnaround time, ease of use, and cost-effectiveness [69]. However, their widespread adoption has revealed significant performance variations between different commercial brands and testing methodologies, creating a "brand variability problem" that challenges effective public health implementation. While manufacturers provide performance specifications for their tests, independent validation studies consistently reveal that real-world accuracy often differs substantially from manufacturer claims [70] [71]. This discrepancy underscores the crucial need for rigorous, manufacturer-independent evaluation to provide reliable performance data that informs evidence-based decision-making for researchers, clinicians, and public health authorities. Such independent validation is particularly important given that test performance is influenced by multiple factors beyond the test itself, including viral load, sampling methods, symptomatology, and circulating variants [23] [72] [8]. This article examines the evidence supporting independent validation of rapid antigen tests compared to the gold standard RT-PCR, providing structured comparative data and methodological frameworks essential for the scientific community.
Comparative Performance Data: Independent Studies vs. Manufacturer Claims
Independent validation studies consistently demonstrate that while rapid antigen tests generally exhibit high specificity, their sensitivity varies considerably across brands, patient populations, and testing conditions. This variability occurs despite most tests meeting minimum regulatory thresholds during manufacturer-led evaluations.
Table 1: Overall Performance of Rapid Antigen Tests Versus RT-PCR Based on Independent Meta-Analyses
| Evaluation Source | Number of Studies/Tests Analyzed | Pooled Sensitivity (95% CI) | Pooled Specificity (95% CI) | Key Contextual Factors |
|---|---|---|---|---|
| Cochrane Review (2021) [71] | 155 studies, 49 different assays | 73.0% (69.3-76.4%) - Symptomatic | 99.6% - Symptomatic | Sensitivity higher in symptomatic (73.0%) vs. asymptomatic (54.7%); highest in first week of symptoms (80.9%) |
| BMC Medicine Network Meta-Analysis (2023) [73] | 93 studies, 36 rapid antigen tests | 75.0% (70.0-79.0%) | 99.0% (98.0-99.0%) | Nasal or combined samples showed higher sensitivity than nasopharyngeal samples |
| Primary Care Validation Study (2022) [70] | 1,518 patients, Roche SARS-CoV-2 Rapid Antigen Test | 78.3% (practice setting) | 99.5% (practice setting) | Sensitivity below manufacturer's specification (96.25%) in real-world practice setting |
Table 2: Impact of Viral Load on Rapid Antigen Test Sensitivity Across Multiple Studies
| Cycle Threshold (Ct) Value Range | Viral Load Correlation | Sensitivity Range Across Studies | Clinical Implications |
|---|---|---|---|
| Ct ≤ 20 (High viral load) | Very high | 97-100% [23] [8] | Excellent detection of contagious individuals |
| Ct 21-25 (Moderate viral load) | Moderate to high | 63-83% [23] [8] | Variable detection, brand-dependent performance |
| Ct 26-30 (Low viral load) | Low | 22-31.82% [23] [8] | Poor detection, high false negative rate |
| Ct > 30 (Very low viral load) | Very low | 0-27.27% [23] [72] | Minimal detection capability |
The performance differential between manufacturer claims and independent evaluations reveals a significant validation gap. For instance, one primary care study reported a sensitivity of 78.3% for the Roche SARS-CoV-2 Rapid Antigen Test in a practice setting, notably below the manufacturer's reported sensitivity of 96.25% [70]. This pattern extends across multiple test brands, with independent meta-analyses revealing substantial variation in sensitivity (range: 69.7-93.0%) and specificity (range: 97.0-100%) across different commercial assays [23] [74] [8]. This variability underscores the limitations of relying solely on manufacturer-reported performance metrics, particularly when tests are deployed in real-world settings with diverse patient populations and operational challenges.
Key Experimental Protocols in Test Validation Studies
Independent test validation follows rigorous methodological frameworks to ensure unbiased assessment of diagnostic accuracy. The following protocols represent standard approaches used in high-quality studies comparing antigen tests with RT-PCR reference standards.
Prospective Multicenter Validation Study Design
The prospective, diagnostic accuracy study design employed in primary care settings provides particularly valuable real-world performance data. One such study conducted in 40 general practices in Germany exemplifies this approach [70]:
Participant Recruitment: Consecutive enrollment of adult patients presenting with symptoms suggestive of COVID-19, based on Robert Koch Institute guidelines for PCR testing. Between December 2020 and June 2021, researchers recruited 1,518 patients, with an average of 36.3 patients per practice.
Sample Collection and Testing: Healthcare providers collected two nasopharyngeal swabs from each patient. The first swab was used for the point-of-care antigen test (Roche SARS-CoV-2 Rapid Antigen Test), while the second swab was sent for RT-PCR analysis in one of six certified laboratories.
Test Procedure: The antigen test was performed according to the manufacturer's protocol, with results read after 15-30 minutes. If a clear positive result appeared earlier than 15 minutes, it was considered valid. The RT-PCR testing followed standard laboratory protocols with quality controls.
Data Analysis: Researchers calculated sensitivity, specificity, positive predictive value (PPV), and negative predictive value (NPV) with 95% confidence intervals using the RT-PCR result as reference. They also analyzed the relationship between cycle threshold (Ct) values and antigen test results.
Feasibility Assessment: General practitioners and medical assistants completed standardized surveys assessing the organizational effort, practical feasibility, and perceived usefulness of the rapid testing in practice workflow.
Comparative Test Performance Studies
Studies directly comparing multiple testing methodologies employ sophisticated experimental designs:
Simultaneous Testing Approach: A 2024 comparative study performed simultaneous testing of 268 samples for SARS-CoV-2 using RT-PCR and two types of antigen tests (fluorescence immunoassay-FIA and lateral flow immunoassay-LFIA) [23].
Viral Load Quantification: Researchers quantified viral load through Ct values and performed variant identification using PCR-based assays to correlate test performance with these critical variables.
Statistical Analysis: The study calculated sensitivity, specificity, PPV, NPV, and overall accuracy for each test modality. Agreement between tests was measured using Cohen's kappa coefficient (κ).
Subgroup Analysis: Performance was stratified by symptom status (asymptomatic vs. symptomatic) and by viral variant (Alpha, Delta, Omicron) to understand how these factors influence test accuracy.
Diagnostic Test Accuracy Network Meta-Analysis
The network meta-analysis approach allows for broader comparisons across multiple test types and brands [73]:
Systematic Literature Search: Comprehensive searching of electronic databases (Embase, MEDLINE, Cochrane Central) for randomized controlled trials and observational studies assessing rapid antigen or molecular tests.
Inclusion Criteria: Studies required to provide 2×2 contingency table data (true positives, false positives, true negatives, false negatives) comparing index tests against RT-PCR reference standards.
Statistical Synthesis: Employment of random-effects meta-analysis and diagnostic test accuracy network meta-analysis (DTA-NMA) to pool sensitivity and specificity estimates across studies while accounting for between-study heterogeneity.
Stratified Analyses: Investigation of how factors like sample type (nasopharyngeal, nasal, saliva), symptomatology, and specific test brands influence accuracy metrics.
Visualizing Test Validation Workflows
The Scientist's Toolkit: Research Reagent Solutions
Table 3: Essential Research Reagents and Materials for Test Validation Studies
| Reagent/Material | Function/Purpose | Examples/Specifications |
|---|---|---|
| Viral Transport Medium | Preservation of sample integrity during transport | Universal viral transport (UVT) media; 2mL volumes for nasopharyngeal swabs [70] [8] |
| RNA Extraction Kits | Isolation of high-quality viral RNA for RT-PCR | GF-1 Viral Nucleic Acid Extraction Kit; automated extraction systems [8] |
| RT-PCR Master Mixes | Enzymatic amplification of viral genetic material | Bosphore Novel Coronavirus Detection Kit; CDC DENV-1-4 Real-Time RT-PCR Assay [8] [75] |
| Rapid Antigen Test Kits | Detection of viral nucleocapsid proteins | Roche SARS-CoV-2 Rapid Antigen Test; STANDARD Q COVID-19 AG Test; PCL Spit Rapid Antigen Test Kit [70] [74] [8] |
| Reference Panels | Quality control and test standardization | Quantified laboratory-adapted DENV strains; heat-inactivated virus panels at various concentrations [75] |
Discussion and Future Directions
The collective evidence from independent studies underscores a critical reality in diagnostic test evaluation: manufacturer-reported performance specifications frequently overestimate real-world accuracy, particularly for rapid antigen tests. This "brand variability problem" has direct implications for clinical and public health decision-making. The consistently demonstrated relationship between viral load (as measured by Ct values) and antigen test sensitivity [23] [72] [8] reveals a fundamental limitation of these tests in detecting early infection, convalescent cases, and some asymptomatic carriers. However, their near-perfect specificity and high sensitivity in individuals with high viral loads make them valuable tools for identifying contagious individuals and interrupting transmission chains.
Future directions in test validation should include standardized, publicly available comparative performance data across test brands, established thresholds for clinical utility in various settings, and ongoing evaluation of test performance against emerging variants. Additionally, more research is needed on the real-world impact of test characteristics—such as the superior sensitivity of fluorescence immunoassay (FIA) compared to lateral flow immunoassay (LFIA) in asymptomatic individuals [23]—on clinical outcomes and transmission dynamics. The scientific community must advocate for transparent reporting of test performance across diverse populations and use cases, emphasizing independent validation as an essential component of evidence-based medicine and public health practice.
Independent test validation represents a cornerstone of diagnostic accuracy and public health responsiveness. As the COVID-19 experience has demonstrated, reliable performance data enables optimal test selection and application across diverse clinical and community settings. Maintaining rigorous, independent evaluation standards for diagnostic tests will remain essential for managing current and future infectious disease threats.
Serial testing protocols represent a critical methodological approach in diagnostic medicine, substantially enhancing detection sensitivity through repeated application of diagnostic assays. This comprehensive analysis examines the fundamental principles, performance characteristics, and practical implementations of serial testing across multiple medical domains, with particular emphasis on SARS-CoV-2 detection where rapid antigen tests (RAts) and real-time reverse transcription polymerase chain reaction (RT-PCR) assays constitute the primary diagnostic modalities. By synthesizing evidence from 18 commercially available RAts and their comparison to gold-standard RT-PCR methodologies, we demonstrate that strategic serial testing regimens can effectively compensate for individual test limitations, ultimately improving early detection capabilities in both clinical and community settings. The compiled data reveal that while RT-PCR maintains superior analytical sensitivity, the operational advantages of RAts—including rapid turnaround times and point-of-care applicability—render them highly valuable components within thoughtfully designed serial testing frameworks, particularly when temporal diagnostic sensitivity considerations are incorporated into testing frequency calculations.
The diagnostic accuracy of medical tests is conventionally characterized by their sensitivity and specificity, statistical measures that quantify a test's ability to correctly identify individuals with and without the condition of interest, respectively [76]. In clinical practice, however, even tests with favorable sensitivity profiles may fail to detect early-stage infections due to temporal variations in pathogen load or analyte concentration throughout the disease course. Serial testing protocols systematically address this limitation by administering repeated tests over time, thereby increasing the probability of capturing the diagnostic window during which the target marker is present at detectable levels.
The comparative performance between rapid antigen tests and RT-PCR methodologies has been extensively evaluated throughout the COVID-19 pandemic, generating substantial evidence regarding their respective roles within diagnostic algorithms [23] [1] [20]. RT-PCR assays detect viral RNA with exceptional sensitivity, often achieving limits of detection in the range of 100-1,000 RNA copies per milliliter, while RAts identify viral protein components with generally reduced but highly variable sensitivity profiles dependent on viral load [8]. This analytical distinction underpins the strategic integration of both modalities within serial testing frameworks optimized for specific clinical and public health objectives.
This review synthesizes contemporary evidence regarding serial testing protocols, with particular emphasis on their application for SARS-CoV-2 detection, while contextualizing findings within the broader paradigm of repeated testing strategies across infectious and non-communicable diseases. We present comprehensive performance comparisons, methodological considerations, and practical implementations to guide researchers, clinicians, and public health officials in optimizing testing strategies for enhanced case detection and transmission mitigation.
Fundamental Principles of Serial Testing
Diagnostic Sensitivity and Specificity in Repeated Testing
The conceptual foundation of serial testing rests upon the statistical principles governing repeated diagnostic applications. Sensitivity defines the probability that a test correctly identifies individuals with the target condition (true positive rate), while specificity represents the probability of correctly identifying those without the condition (true negative rate) [76]. In serial testing algorithms, the cumulative sensitivity across testing episodes exceeds the sensitivity of any individual test, as each administration represents an additional opportunity to detect the condition during its developmental course.
The mathematical relationship governing cumulative sensitivity in serial testing follows the formula:
P(cumulative detection) = 1 - [1 - Sensitivity]ⁿ
Where 'n' represents the number of tests administered. This probabilistic framework demonstrates that even tests with moderate individual sensitivity can achieve high cumulative detection rates when applied repeatedly across the infectious period [20].
Temporal Diagnostic Sensitivity
A critical consideration in serial testing regimen design involves the temporal dynamics of diagnostic sensitivity, particularly the relationship between time since exposure/infection and probability of detection. For SARS-CoV-2, both RT-PCR and RAts demonstrate variable sensitivity throughout the infection course, with RAts exhibiting particularly strong dependence on viral load [20].
Table 1: Temporal Sensitivity Patterns of Diagnostic Modalities for SARS-CoV-2
| Period | RT-PCR Sensitivity | Rapid Antigen Test Sensitivity | Primary Determinants |
|---|---|---|---|
| Pre-symptomatic (Days 1-3 post-exposure) | Moderate to High | Low to Moderate | Viral load increasing, potentially below antigen detection threshold |
| Early symptomatic (Days 3-7 post-exposure) | High (≈100% at Ct<30) | High (≈100% at Ct<25) | Peak viral load during this period |
| Late symptomatic (Days 7-14 post-exposure) | High but declining | Rapidly declining | Clearing infection, viral load decreasing |
| Post-symptomatic/convalescent | Variable, potentially prolonged detection | Typically negative | RNA shedding may continue without viable virus |
The temporal sensitivity profiles illustrated in Table 1 highlight the complementary nature of RT-PCR and RAts, with the former exhibiting superior early detection capability and the latter demonstrating strong correlation with infectiousness during the peak viral load phase [23] [20].
Comparative Performance of Rapid Antigen Tests and RT-PCR
Analytical Sensitivity and Viral Load Dependence
Substantial evidence confirms that the diagnostic sensitivity of RAts exhibits strong correlation with viral load, as quantified by RT-PCR cycle threshold (Ct) values. Multiple comparative studies have demonstrated that RAts achieve approximately 100% sensitivity when viral loads correspond to Ct values below 25-30, while sensitivity declines markedly at higher Ct values corresponding to lower viral concentrations [23] [1] [8].
Table 2: Comparative Performance of Rapid Antigen Tests Versus RT-PCR Across Viral Load Strata
| Ct Value Range | Viral Load Interpretation | RAT Sensitivity Range | Representative Studies |
|---|---|---|---|
| ≤20 | High | 96-100% | [1] [8] |
| 21-25 | Moderate to High | 63-95% | [23] [8] |
| 26-30 | Low to Moderate | 22-50% | [23] [8] |
| >30 | Very Low | <20% | [23] [20] |
This viral load-dependent sensitivity profile positions RAts as particularly valuable for identifying individuals with high viral shedding potential, who likely contribute disproportionately to transmission dynamics. The operational implication is that RAts effectively serve as "infectiousness proxies," while RT-PCR maintains superior capability for early infection detection during the ascending phase of viral replication [20].
Test-Specific Performance Variations
Considerable heterogeneity exists in the performance characteristics of different RAts, reflecting variations in assay design, analytical sensitivity, and target antigens. A comprehensive analysis of 18 RAts with Emergency Use Authorization from the U.S. Food and Drug Administration demonstrated substantial inter-test variability in temporal diagnostic sensitivity throughout the infection course [20].
The five most commonly employed RAts—LumiraDx, Sofia, BinaxNOW, BD Veritor, and CareStart—demonstrated distinct performance trajectories, with sensitivity ranges varying from 34% to 80% during the pre-symptomatic phase and reaching 68% to 96% at symptom onset [20]. This performance diversity underscores the importance of test-specific selection when designing serial testing protocols for particular use cases.
Experimental Evidence Supporting Serial Testing Protocols
Methodological Approaches to Serial Testing Evaluation
Research investigating serial testing efficacy has employed diverse methodological approaches, including prospective clinical trials, mathematical modeling, and real-world implementation studies. The fundamental experimental paradigm involves repeated testing of individuals over time using either a single modality or comparative modalities, with RT-PCR serving as the reference standard for infection status determination.
4.1.1 Diagnostic Accuracy Studies
Conventional diagnostic accuracy studies represent the foundational methodology for establishing test performance characteristics. These studies typically employ simultaneous testing with both index and reference tests in cross-sectional designs. For example, a Thailand-based evaluation compared the Standard Q COVID-19 Ag kit with the Allplex 2019-nCoV RT-PCR assay using 454 respiratory specimens, demonstrating 98.33% sensitivity and 98.73% specificity for the RAD when compared to the gold standard [1]. Similarly, a Pakistan study of 320 samples comparing the PCL Spit Rapid Antigen Test with RT-PCR revealed an overall sensitivity of 67% and specificity of 75%, with sensitivity varying substantially across viral load strata [8].
4.1.2 Mathematical Modeling of Serial Testing
Mathematical modeling approaches have provided critical insights into the population-level implications of serial testing strategies. These models incorporate temporal diagnostic sensitivity curves, infectivity profiles, and test frequency to estimate performance metrics such as the probability of post-quarantine transmission and the effective reproduction number during serial testing [20].
One sophisticated analytical framework evaluated 18 RAts and demonstrated that for quarantines of two days or shorter, conducting a RAts on exit from quarantine reduces onward transmission more effectively than a single RT-PCR test with a 24-hour delay, primarily due to the rapid turnaround time of RAts facilitating immediate behavior modification [20].
4.1.3 Real-World Implementation Studies
Real-world studies conducted in occupational, educational, and healthcare settings have provided practical validation of serial testing effectiveness. Data from offshore oil sites, where logistical constraints present distinct challenges, demonstrated that serial RAD testing effectively mitigated outbreaks within isolated industrial populations [20]. These implementation contexts provide critical evidence regarding the operational feasibility and effectiveness of serial testing protocols under realistic conditions with inherent resource constraints.
SARS-CoV-2 Serial Testing Experimental Workflow
The following diagram illustrates a generalized experimental workflow for evaluating serial testing protocols for SARS-CoV-2 detection:
The Scientist's Toolkit: Essential Research Reagents and Materials
The experimental evaluation of serial testing protocols requires specific reagents, biological materials, and instrumentation to ensure methodological rigor and reproducible results. The following table details essential components of the research toolkit for conducting serial testing studies:
Table 3: Essential Research Reagents and Materials for Serial Testing Studies
| Category | Specific Items | Research Function | Representative Examples |
|---|---|---|---|
| Sample Collection | Nasopharyngeal swabs, Oropharyngeal swabs, Anterior nasal swabs, Saliva collection devices, Viral transport media | Biological specimen acquisition and stabilization | Universal Transport Medium (UTM), Virocult, DNA/RNA Shield |
| Rapid Antigen Tests | Lateral flow immunoassays, Fluorescence immunoassays | Point-of-care detection of viral antigens | Standard Q COVID-19 Ag Test, BD Veritor, Sofia SARS Antigen FIA |
| Molecular Assays | RNA extraction kits, Reverse transcriptase enzymes, PCR master mixes, Primers and probes, Real-time PCR instruments | Gold-standard detection of viral RNA | Allplex 2019-nCoV Assay, TaqPath COVID-19 PCR Kit |
| Analytical Tools | Automated nucleic acid extractors, Real-time thermal cyclers, Microplate readers, Luminometers | Laboratory instrumentation for test processing and analysis | MagLEAD 12gC, CFX96 Real-Time System |
| Data Analysis | Statistical software, Mathematical modeling platforms | Performance calculation and strategy evaluation | R, Python, GraphPad Prism |
The selection of appropriate reagents and instruments must align with study objectives, with particular attention to the compatibility of collection methods with downstream analytical platforms. Validation of sample stability under storage conditions represents an additional methodological consideration for studies involving batch testing or repeated measures [1] [8].
Applications Beyond SARS-CoV-2 Detection
Tuberculosis Diagnostics
The principles of serial testing find application beyond viral detection, with established utility in diseases such as tuberculosis (TB). In Indonesia, studies evaluating serial testing approaches for pulmonary TB demonstrated that applying multiple diagnostic methods sequentially significantly enhanced detection sensitivity compared to individual tests alone [77].
The serial testing algorithm for TB typically initiated with acid-fast bacilli (AFB) smear microscopy, followed by culture methods and nucleic acid amplification tests (NAATs) such as PCR or GeneXpert MTB/RIF for samples with negative initial results. This sequential approach yielded a collective sensitivity of 83.1%, substantially exceeding the 36% sensitivity reported for AFB smear microscopy alone [77].
Cardiac Biomarker Monitoring
In cardiovascular medicine, serial measurement of cardiac troponin represents the standard of care for diagnosing myocardial infarction in emergency department settings. Contemporary and high-sensitivity cardiac troponin assays employ serial testing protocols to detect rising or falling patterns indicative of acute myocardial injury, significantly improving diagnostic accuracy compared to single determinations [78].
The diagnostic framework for myocardial infarction incorporates troponin measurements at presentation and repeated 3-6 hours later, with changing patterns exceeding biological and analytical variation thresholds providing critical diagnostic information that would be unavailable through single timepoint testing [78].
Implications for Public Health and Clinical Practice
The strategic implementation of serial testing protocols carries significant implications for disease control and clinical management across diverse healthcare settings. The evidence synthesized in this review supports several foundational principles for optimizing testing strategies:
First, test selection should align with programmatic objectives—RAts offer particular utility for transmission interruption through their rapid identification of infectious individuals, while RT-PCR provides superior sensitivity for early detection and confirmatory testing [20].
Second, testing frequency must balance operational feasibility with detection requirements—mathematical modeling indicates that frequent testing with moderately sensitive tests can outperform less frequent testing with highly sensitive assays, particularly when accounting for behavioral modifications following rapid results [20].
Third, contextual factors substantially influence testing effectiveness—characteristics of the setting (healthcare, workplace, community), population prevalence, available resources, and implementation capabilities should inform protocol design rather than applying uniform approaches across dissimilar scenarios [20].
These principles provide a framework for developing context-specific serial testing strategies that maximize early detection while constrained by practical implementation considerations.
Serial testing protocols represent a scientifically validated approach to enhancing diagnostic sensitivity through repeated test administration across the disease timeline. Substantial evidence from SARS-CoV-2 research demonstrates that strategically designed serial testing regimens employing either RAts or RT-PCR can effectively compensate for the limitations of individual tests, with the operational advantages of RAts making them particularly valuable for frequent testing applications despite their reduced analytical sensitivity compared to RT-PCR.
The comparative performance data synthesized in this analysis provide researchers and public health officials with evidence-based guidance for selecting and implementing serial testing strategies appropriate to specific use cases and resource environments. Future research should continue to refine our understanding of optimal testing frequencies, multimodal testing approaches, and cost-effective implementations to maximize the public health benefit of serial testing protocols across diverse infectious and non-infectious conditions.
The accurate identification of infectious individuals remains a cornerstone of effective public health management for COVID-19. While Real-Time Reverse Transcription Polymerase Chain Reaction (RT-PCR) has established itself as the gold standard for detecting SARS-CoV-2 RNA, its results do not necessarily correlate with transmissible virus, as it can detect viral fragments long after active infection has ceased. Rapid antigen tests (RATs) offer a practical alternative, detecting specific viral proteins with results available in minutes rather than hours or days. This review examines the critical relationship between RAT positivity and actual transmissibility by comparing RAT performance against both RT-PCR and viral culture, the latter serving as a surrogate marker for infectious virus. Understanding this correlation is essential for researchers, scientists, and drug development professionals making informed decisions about testing strategies and interpreting results in both clinical and research settings.
Comparative Performance Data: RAT vs. RT-PCR vs. Viral Culture
Extensive research has evaluated the diagnostic performance of rapid antigen tests in comparison to molecular and viability assays. The data consistently demonstrate that while RATs show lower sensitivity than RT-PCR overall, their performance significantly improves when compared against viral culture, particularly during the infectious period.
Table 1: Overall Comparative Performance of Rapid Antigen Tests
| Comparison Metric | Sensitivity | Specificity | Key Study Characteristics | Citation |
|---|---|---|---|---|
| RAT vs. RT-PCR | 47% (95% CI: 44-50%) | Not specified | Omicron variant, symptomatic patients, 2022-2023 | [79] |
| RAT vs. Viral Culture | 80% (95% CI: 76-85%) | Not specified | Same study population as above | [79] |
| RAT vs. RT-PCR (Overall) | 84.6% (95% CI: 83.3-85.7%) | 99.4% (95% CI: 99.1-99.6%) | 3,519 RT-PCR-positive cases, 2022 | [80] |
| RAT vs. RT-PCR (Asymptomatic) | 35.0% (95% CI: 15.4-59.2%) | 100% (95% CI: 99.3-100%) | Student population, 2020 | [17] |
| RAT vs. RT-PCR (Asymptomatic) | 69.86% | 99.61% | Community screening, Chile, 2021 | [18] |
The temporal pattern of detection is particularly revealing. During a household transmission study conducted when Omicron variants were predominant, the proportion of positive RAT results peaked three days after symptom onset at 59.0%, closely paralleling the peak in viral culture positivity (52% at two days post-onset) rather than the RT-PCR peak (83.0% at three days post-onset). This temporal alignment between RAT positivity and cultivable virus suggests RATs more accurately reflect the window of transmissibility compared to RT-PCR [79].
Performance variations are significantly influenced by viral load, which serves as a primary determinant of test sensitivity. Among RT-PCR-positive cases, those testing negative by RAT had significantly higher cycle threshold (Ct) values (28.07 ± 4.343) compared to true positives (19.99 ± 4.535), indicating lower viral loads in false-negative cases [18]. This relationship is crucial because higher Ct values (lower viral loads) often correlate with non-infectious states, explaining why RATs better identify actually infectious individuals.
Table 2: Factors Influencing RAT Sensitivity
| Factor | Impact on RAT Sensitivity | Notes | Citation |
|---|---|---|---|
| Symptom Status | Higher in symptomatic individuals | Sensitivity highest with fever | [79] |
| Viral Load | Higher with low Ct values (<25) | Most significant factor | [80] [18] |
| Symptom Onset | Highest 2-3 days after onset | Aligns with viral culture positivity | [79] |
| Previous Infection | Lower in reinfections | Association attenuated after Ct adjustment | [80] |
| Variant Type | Minimal difference between BA.2, BA.5, XBB.1 | Consistent performance across Omicron sublineages | [80] |
Key Experimental Protocols and Methodologies
Household Transmission Study Design
A critical 2022-2023 household transmission study conducted by the CDC and Vanderbilt University employed a comprehensive longitudinal design to assess RAT performance. Participants were enrolled within seven days of symptom onset and completed daily symptom diaries while collecting two nasal swabs daily for 10 days. This intensive sampling regimen allowed for precise temporal mapping of viral shedding patterns. Participants reported RAT results using a single commercially available test, while same-day RT-PCR and viral culture analyses were performed in laboratory settings. The study included 354 participants from 129 households, yielding 2,244 RAT results for analysis. The population spanned ages from 2 months to 83 years (median 36 years), with 93% reporting symptoms, providing robust data on test performance during the infectious period [79].
Diagnostic Accuracy Assessment
Multiple studies have employed similar paired testing methodologies to evaluate RAT performance. The fundamental approach involves collecting duplicate nasopharyngeal swabs from each participant during the same clinical encounter. One swab is immediately tested onsite using the RAT according to manufacturer instructions, typically providing results within 15-30 minutes. The second swab is preserved in viral transport medium and transported under refrigerated conditions (4°C) to a laboratory for RT-PCR analysis. This parallel testing design eliminates variability due to sampling differences and ensures comparable specimens for both methods [18] [6].
RT-PCR testing typically targets multiple viral genes (e.g., N, S, and ORF1ab for SARS-CoV-2) using kits such as the TaqPath COVID-19 RT-PCR Kit. Cycling threshold values below 35-40 are generally considered positive, depending on the manufacturer's instructions. Viral culture methods involve inoculating specimen samples onto permissive cell lines (e.g., Vero E6 cells) and monitoring for cytopathic effects or using PCR to confirm viral replication [6] [79].
Statistical Analysis Approaches
Studies consistently employ standard diagnostic accuracy measures including sensitivity, specificity, positive predictive value (PPV), and negative predictive value (NPV), calculated with 95% confidence intervals. RT-PCR typically serves as the primary reference standard, though some studies use viral culture as an alternative reference for assessing infectiousness. Agreement between tests is often quantified using Cohen's kappa statistic (κ), with values interpreted as follows: <0.20 poor, 0.21-0.40 fair, 0.41-0.60 moderate, 0.61-0.80 substantial, and 0.81-1.00 almost perfect agreement. Regression analyses identify factors associated with false-negative RAT results, with statistical significance typically set at p<0.05 [6] [81].
Test Performance in Context: Implications for Infectiousness Assessment
The relationship between RAT results and actual infectiousness has profound implications for public health strategies and clinical management. The substantially higher sensitivity of RATs when compared to viral culture (80%) versus RT-PCR (47%) underscores their utility in identifying truly infectious individuals [79]. This performance differential stems from the fundamental detection principles of each method: RT-PCR amplifies viral RNA fragments that may persist weeks after infectious virus has cleared, while RATs detect nucleocapsid proteins that typically correlate with high viral loads and active replication.
The temporal alignment between RAT positivity and cultivable virus further supports this relationship. Both peak around 2-3 days after symptom onset, suggesting RATs effectively identify individuals during their most infectious period. This timing is critical for implementing effective isolation measures to interrupt transmission chains. As noted by researchers, "positive antigen test results could indicate transmissible virus; thus, antigen tests might aid persons with COVID-19 in determining when they are no longer infectious once symptoms begin to resolve" [79].
Essential Research Reagent Solutions
Table 3: Key Research Materials and Their Applications
| Reagent/Kit | Primary Function | Research Application | Citation |
|---|---|---|---|
| TaqPath COVID-19 RT-PCR Kit | Multiplex RT-PCR detection of SARS-CoV-2 genes (N, S, ORF1ab) | Gold standard molecular detection; requires lab processing | [6] |
| BioFire Respiratory 2.1 Panel | Multiplex PCR for multiple respiratory pathogens | Simultaneous detection of SARS-CoV-2 and co-infecting pathogens | [80] |
| Mag-Bind Viral DNA/RNA Kit | Nucleic acid extraction from swab samples | Prepares RNA for RT-PCR analysis | [18] |
| Viral Transport Medium (VTM) | Preserves specimen integrity during transport | Maintains viral viability for culture and molecular testing | [6] |
| Permissive Cell Lines (Vero E6) | Support viral replication for culture | Determines presence of infectious virus | [79] |
| Various RAT Kits | Rapid detection of viral nucleocapsid antigen | Point-of-care testing; infectiousness correlation studies | [17] [80] [18] |
Rapid antigen tests demonstrate a stronger correlation with viral culture and thus potentially infectious virus compared to RT-PCR, despite lower overall sensitivity for detecting any SARS-CoV-2 infection. The temporal alignment between RAT positivity and cultivable virus, particularly during the 2-3 day peak following symptom onset, underscores their utility in identifying truly infectious individuals. These characteristics support the strategic use of RATs in situations where identifying transmissible infection is paramount, particularly for informing isolation decisions and implementing timely public health interventions. For researchers and clinicians, these findings emphasize that diagnostic test selection should be guided by the specific clinical or public health question—whether detecting presence of viral RNA or assessing potential for transmission—as each testing modality provides distinct, complementary information in the management of COVID-19.
Critical Appraisal of Real-World Evidence and Manufacturer Claims
The rapid deployment of SARS-CoV-2 Antigen-Detection Rapid Diagnostic Tests (Ag-RDTs) has been a critical component of the global pandemic response. While manufacturers typically report high sensitivity under controlled conditions, real-world performance data often reveals significant discrepancies. This comparative analysis examines the documented variances between manufacturer claims and actual clinical performance of rapid antigen tests, with a specific focus on their sensitivity relative to the gold standard real-time RT-PCR. Understanding these discrepancies is essential for researchers, clinical microbiologists, and public health policymakers in optimizing testing strategies and interpreting results accurately across different clinical and community settings.
Experimental Protocols & Methodologies
Clinical Study Designs for Performance Validation
Real-world evaluations of Ag-RDTs typically employ cross-sectional study designs comparing test performance against reverse transcription quantitative polymerase chain reaction (RT-qPCR) in symptomatic populations. The following methodologies represent standardized approaches for generating comparative performance data:
Brazilian Large-Scale Evaluation: A substantial study involving 2,882 symptomatic individuals within the Brazilian Unified Health System collected paired nasopharyngeal swabs. One swab was analyzed immediately using Ag-RDTs with a 15-minute turnaround, while the counterpart was stored at -80°C in Viral Transport Medium (VTM) for subsequent RT-qPCR testing. This design enabled direct comparison of two widely used test brands (TR DPP COVID-19 and IBMP TR Covid Ag) against the reference standard [26].
Standardized Specimen Processing: For antigen testing, samples were typically processed with glass beads added to VTM tubes to disrupt viscous mucus, followed by vortex mixing. Approximately 200μL of specimen was added to kit-specific extraction buffer, with three drops of the extracted sample applied to the test device. Results were interpreted within 15-30 minutes, following manufacturer instructions [1].
RT-qPCR Methodology: Nucleic acid extraction was performed using automated systems (e.g., MagLEAD 12gC or STARlet platforms). PCR amplification utilized commercial kits targeting multiple SARS-CoV-2 genes (E, RdRp, and N), with cycle threshold (Ct) values <40 defined as positive. Internal controls were incorporated to monitor extraction and amplification quality [26] [1].
Statistical Analysis: Performance metrics including sensitivity, specificity, positive predictive value (PPV), and negative predictive value (NPV) were calculated with 95% confidence intervals. Statistical significance was typically set at 5%, with analyses performed using RStudio or SPSS software [26] [55].
Statistical Adjustment for Viral Load Variability
A key methodological advancement addresses the sampling bias introduced by uneven viral load distributions across studies:
Percent Positive Agreement Function (PPAf): This approach models test positivity as a logistic function of Ct values using logistic regression on paired test results. The PPAf describes how sensitivity changes with viral load [82].
Distribution-Standardized Sensitivity: Raw sensitivity estimates are adjusted by applying the PPAf to a standardized reference Ct distribution, correcting for variability in the underlying viral load of study populations. This enables more accurate comparisons across different tests and studies by removing bias introduced by uneven representation of viral loads [82].
Comparative Performance Data Analysis
Documented Discrepancies in Test Sensitivity
Substantial evidence confirms that real-world sensitivity of Ag-RDTs frequently falls below manufacturer claims, with performance highly dependent on viral load and test brand.
Table 1: Overall Performance Metrics from Real-World Studies
| Study & Population | Sample Size | Overall Sensitivity | Overall Specificity | Positive Predictive Value | Negative Predictive Value |
|---|---|---|---|---|---|
| Brazil (Symptomatic) [26] | 2,882 | 59% (0.56-0.62) | 99% (0.98-0.99) | 97% | 78% |
| Pakistan (Symptomatic) [8] | 320 | 67% | 75% | 86.36% | 50.00% |
| Thailand (Mixed) [1] | 454 | 98.33% (91.06-99.96) | 98.73% (97.06-99.59) | - | - |
| Turkey (Symptomatic) [55] | 200 | 100% | 100% | 100% | 100% |
Table 2: Sensitivity Stratified by Viral Load (Cycle Threshold Values)
| Viral Load Category | Ct Value Range | Sensitivity (%) | Study Reference |
|---|---|---|---|
| High viral load | Ct < 20 | 90.85-100% | [26] [8] |
| Intermediate viral load | Ct 21-25 | 63% | [8] |
| Low viral load | Ct 26-30 | 22-47.8% | [8] [55] |
| Very low viral load | Ct ≥ 33 | 5.59% | [26] |
Inter-Brand Performance Variability
Significant differences in performance exist between test manufacturers, underscoring the importance of brand-specific validation:
Brazilian Brand Comparison: The study found statistically significant differences (p<0.001) between the two evaluated brands. The IBMP TR Covid Ag kit demonstrated significantly higher sensitivity (70%) compared to the TR DPP COVID-19 test (49%), highlighting substantial variability in real-world performance between products [26].
Statistical Adjustment Impact: When raw sensitivity data from four test suppliers (A-D) were recalibrated to a standardized viral load distribution, the adjustment reduced sampling bias and revealed different performance rankings than those suggested by unadjusted values, enabling fairer comparisons across suppliers [82].
Ag-RDT Evaluation Methodology: This workflow illustrates the standardized approach for comparing rapid antigen test performance against RT-qPCR gold standard in clinical studies.
Factors Contributing to Performance Discrepancies
Viral Load Dependence
The most significant factor affecting Ag-RDT sensitivity is viral load, which is inversely correlated with Ct values from RT-qPCR testing:
High Viral Load Performance: Ag-RDTs demonstrate excellent sensitivity (90.85-100%) in samples with Ct values <20, corresponding to high viral loads typically found early in symptomatic infection [26] [8].
Rapid Performance Decline: Sensitivity decreases dramatically as viral load decreases, falling to approximately 22% for samples with Ct values between 26-30 [8]. This relationship follows a logistic function, with the probability of detection decreasing steadily as Ct values increase [82].
Clinical Implications: The strong dependence on viral load means Ag-RDTs perform best during the peak viral load phase, typically in the first 5-7 days of symptoms, making them valuable for identifying transmission-prone individuals but less reliable for convalescence monitoring [55].
Pre-Analytical and Biological Factors
Multiple biological and technical variables contribute to performance variances:
Sample Type Considerations: Studies have reported higher sensitivity with combined oro/nasopharyngeal swabs compared to nasopharyngeal sampling alone. One evaluation found 100% sensitivity with combined sampling versus 98.32% reported in the manufacturer's insert for nasopharyngeal specimens [55].
Temporal Factors: Test performance is optimized when conducted within 0-5 days of symptom onset, when viral loads are typically highest. Sensitivity may decrease significantly when testing is delayed beyond this window [26].
Specimen Quality and Handling: Inadequate sample collection, improper storage conditions, or delays in processing can adversely affect test performance. Complex respiratory matrices containing mucus and cellular debris may also interfere with test accuracy [83] [84].
Essential Research Reagents and Materials
Table 3: Key Research Reagent Solutions for Ag-RDT Evaluation Studies
| Reagent/Equipment | Primary Function | Specific Examples |
|---|---|---|
| Viral Transport Medium (VTM) | Preserves specimen integrity during transport and storage | Hanks' balanced salt solution with 0.4% fetal bovine serum, HEPES, antibiotics [1] |
| Automated Nucleic Acid Extraction Systems | Isolate viral RNA for RT-PCR testing | MagLEAD 12gC platform, STARlet Seegene system, KingFisher Flex [26] [1] |
| RT-qPCR Master Mixes | Amplify and detect viral RNA sequences | Allplex 2019-nCoV Assay, Biospeedy SARS-CoV-2 RT-PCR test, GoTaq Probe 1-Step RT-qPCR system [26] [55] |
| Rapid Antigen Test Kits | Detect SARS-CoV-2 nucleocapsid protein | Standard Q COVID-19 Ag, TR DPP COVID-19, IBMP TR Covid Ag, mö-screen Corona Antigen Test [26] [1] [55] |
| Quality Control Materials | Monitor extraction and amplification efficiency | Internal control targets, negative controls [26] |
Technical Recommendations for Implementation
Context-Specific Test Selection
The documented performance variances necessitate careful test selection based on specific use cases:
High-Sensitivity Settings: In clinical environments where sensitivity is paramount (e.g., healthcare settings, vulnerable populations), RT-PCR remains the gold standard. Digital PCR (dPCR) offers enhanced quantification capabilities, demonstrating superior accuracy for high viral loads of influenza A, influenza B, and SARS-CoV-2, though at higher cost and reduced automation [83].
Surveillance and Screening: Ag-RDTs are particularly valuable for rapid screening programs, outbreak investigations, and settings where quick turnaround times are critical. Their high specificity (typically 98-99%) makes positive results highly reliable in high-prevalence settings [26] [1].
Resource-Limited Environments: In settings with limited laboratory infrastructure, Ag-RDTs provide a practical solution for widespread testing, though their limitations in sensitivity must be accounted for in result interpretation [8].
Methodological Standardization
To enable meaningful comparisons across studies and platforms, standardization of evaluation methodologies is essential:
Viral Load Stratification: Reporting performance metrics stratified by Ct value ranges (e.g., <25, 25-30, >30) provides more clinically relevant data than overall sensitivity alone [26] [8].
Statistical Adjustment: Implementing distribution-aware frameworks that model percent positive agreement as a function of Ct values and reweight results to standardized reference distributions can produce bias-corrected sensitivity estimates [82].
Transparent Reporting: Studies should clearly document sample collection methods, timing relative to symptom onset, specific test brands evaluated, and the demographic characteristics of study populations to enable proper interpretation of results.
Factors Influencing Test Performance: This diagram illustrates the relationship between key variables contributing to discrepancies between manufacturer claims and real-world performance of Ag-RDTs.
The comprehensive analysis of real-world performance data reveals consistent and often substantial discrepancies between manufacturer claims and actual clinical sensitivity of SARS-CoV-2 rapid antigen tests. These variances are primarily driven by viral load dynamics, with test performance declining significantly as cycle threshold values increase. Additional contributing factors include test brand variability, sampling methods, and timing of testing relative to symptom onset. For researchers and clinical professionals, these findings underscore the necessity of contextual test interpretation, brand-specific validation, and implementation of standardized evaluation methodologies that account for viral load distributions. Future test development should focus on improving sensitivity across a broader range of viral loads while maintaining the rapidity and accessibility that make Ag-RDTs valuable public health tools.
The comparative evaluation of Rapid Antigen Tests (RATs) against gold standard methods like real-time reverse transcription-polymerase chain reaction (RT-PCR) and viral culture remains a critical focus for clinical researchers and public health officials. As of 2024, the U.S. Centers for Disease Control and Prevention (CDC) has implemented updated regulatory standards for influenza Rapid Influenza Diagnostic Tests (RIDTs), requiring minimum sensitivity of 80% compared to RT-PCR and 90% for influenza A compared to viral culture, with specificities set at 95% or greater for both comparisons [85]. These benchmarks establish a crucial framework for assessing whether current RATs provide sufficient diagnostic accuracy for clinical use. Recent multi-virus combo tests have demonstrated exceptionally high specificity (up to 100% for some viruses), but exhibit significant variability in sensitivity across different respiratory viruses, highlighting the importance of context-specific test selection and confirming negative results when clinical suspicion is high [86].
Comparative Analytical Performance: Quantitative Data Synthesis
Regulatory Performance Standards and Recent Clinical Findings
Table 1: CDC Regulatory Performance Requirements for Influenza RIDTs (2024)
| Comparison Method | Target Virus | Required Sensitivity | Required Specificity |
|---|---|---|---|
| RT-PCR | Influenza A | ≥80% | ≥95% |
| RT-PCR | Influenza B | ≥80% | ≥95% |
| Viral Culture | Influenza A | ≥90% | ≥95% |
| Viral Culture | Influenza B | ≥80% | ≥95% |
Source: CDC Rapid Diagnostic Testing for Influenza: Information for Clinical Laboratory Directors [85]
Table 2: Recent Clinical Performance of Combo RATs for Multiple Respiratory Viruses (2024 Data)
| Virus Target | RAT Type | Sensitivity (Ct<25) | Sensitivity (Ct<30) | Specificity | Study/Setting |
|---|---|---|---|---|---|
| SARS-CoV-2 | RAT1 | 98.68% | 95.45% | 100% | Northern Finland Emergency Departments [86] |
| Influenza A | RAT1 | 73.53% | 68.42% | 100% | Northern Finland Emergency Departments [86] |
| RSV | RAT1 | 44.44% | 40.00% | 99.75% | Northern Finland Emergency Departments [86] |
| Influenza A | RAT2 | 85.00% | 69.23% | ~100% | Northern Finland Emergency Departments [86] |
| RSV | RAT2 | 100.00% | 66.67% | ~100% | Northern Finland Emergency Departments [86] |
| SARS-CoV-2 | Acon Flowflex | 84.6% overall sensitivity | - | 99.4% | Singapore study (Omicron BA.2, BA.5, XBB.1) [29] |
Table 3: SARS-CoV-2 RAT Performance Across Viral Load Categories
| Ct Value Range | Viral Load Category | Average RAT Sensitivity | Infectiousness Correlation |
|---|---|---|---|
| ≤20 | High | 100% | High infectiousness likely [87] |
| 21-25 | Moderate | 63-99.1% | Likely infectious [8] [87] |
| 26-30 | Low | 22-90.9% | Possibly infectious [8] [87] |
| >30 | Very Low | <22% | Unlikely to be infectious [87] |
Key Determinants of RAT Performance
The most significant factor affecting RAT sensitivity is viral load, typically measured through RT-PCR cycle threshold (Ct) values [29] [87]. Recent research demonstrates an inverse relationship between Ct values and RAT sensitivity, with one study finding the detection limit of 14 different RATs varied between Ct=26.8 and Ct=34.7 [87]. This correlation is crucial for understanding the appropriate use case for RATs, as they perform best when viral loads are highest, typically during the initial symptomatic phase [86].
For SARS-CoV-2, recent data from Singapore during Omicron BA.2, BA.5, and XBB.1 predominance showed overall RAT sensitivity of 84.6% and specificity of 99.4% compared to RT-PCR [29]. The study identified that individuals with previous SARS-CoV-2 infections, co-infections with other respiratory pathogens, or those tested ≥6 days from symptom onset had higher odds of testing RAT-negative despite PCR positivity, though these associations were attenuated after adjustment for Ct values [29].
Diagram 1: Comparative Diagnostic Workflows for Respiratory Virus Detection. RATs provide rapid results but detect antigens; RT-PCR detects viral RNA with higher sensitivity; viral culture detects replicating virus but takes significantly longer.
Experimental Protocols and Methodologies
Clinical Validation Study Designs
Recent comparative studies have employed rigorous methodologies to evaluate RAT performance:
Multi-Virus Combo Test Evaluation (Finland, 2024): This study assessed two commercial combo-RATs (RAT1: Alltest; RAT2: Qingdao HighTop) for influenza A/B, RSV, and SARS-CoV-2 on 620 patients admitted to emergency departments with respiratory symptoms. The protocol involved collecting nasopharyngeal swabs with simultaneous RAT and RT-PCR testing. RT-PCR was performed using commercial assays, and sensitivity/specificity calculations were stratified by Ct value ranges (<25, <30, and any Ct) to evaluate viral load impact [86].
SARS-CoV-2 RAT Performance During Omicron Sublineages (Singapore, 2024): This retrospective study analyzed 8,620 clinical encounters where individuals underwent both RAT (Acon Flowflex or SD Biosensor) and RT-PCR testing during the same clinical encounter. RT-PCR was performed using the BioFire Respiratory 2.1 Panel with TaqPath COVID-19 Combo Kit for confirmation. Whole genome sequencing was conducted on specimens with Ct<30 to identify circulating variants (BA.2, BA.5, XBB.1). Multivariable logistic regression models identified factors associated with false-negative RAT results [29].
Asymptomatic Testing Evaluation (Chile, 2024): This study compared SD Biosensor RAT with RT-PCR in 842 asymptomatic individuals using paired nasopharyngeal swabs collected by healthcare workers. Viral RNA was extracted using Mag-Bind Viral DNA/RNA 96 kit, with RT-PCR performed using GenomeCov19 Detection Kit ABM (Ct≤40 considered positive). Statistical analysis included sensitivity, specificity, PPV, NPV, accuracy, and Kappa coefficient calculations [18].
Analytical Sensitivity Assessment
Limit of Detection (LOD) Comparison Across Multiple RATs: A comprehensive evaluation of 14 different RATs from various manufacturers tested 400 rRT-PCR-positive clinical samples and 50 control samples. Each swab eluate was tested against 4-8 different RATs. Band intensity was assessed both visually (scored 0-5) and through digital scanning using UN-SCAN-IT Digitizer Software. The LOD for each RAT was defined as the highest Ct value at which the test consistently produced positive results [87].
Table 4: Research Reagent Solutions for Respiratory Virus Detection
| Reagent/Kit | Manufacturer | Primary Function | Application in Studies |
|---|---|---|---|
| BioFire Respiratory 2.1 Panel | bioMérieux | Multiplex PCR detection of respiratory pathogens | SARS-CoV-2 detection in Singapore study [29] |
| TaqPath COVID-19 Combo Kit | ThermoFisher | SARS-CoV-2 RT-PCR detection with Ct determination | Confirmatory testing and variant screening [29] |
| LiliF COVID-19 Multi Real-time RT-PCR Kit | INtRON Biotechnology | Multi-gene detection (RdRP, E, N) | RT-PCR reference standard in RAT evaluation [87] |
| GenomeCov19 Detection Kit ABM | Applied Biological Materials | SARS-CoV-2 RT-PCR detection | Asymptomatic testing study in Chile [18] |
| Mag-Bind Viral DNA/RNA 96 kit | Omega Bio-Tek | Viral nucleic acid extraction | RNA extraction for RT-PCR testing [18] |
Discussion: Clinical Implications and Research Applications
Strategic Deployment of RATs in Clinical and Research Settings
The 2024 data supports the strategic use of RATs in specific clinical scenarios while acknowledging their limitations. The high specificity (consistently >99% for most viruses) means positive results are highly reliable across settings [86]. This makes RATs particularly valuable in emergency departments and outpatient settings during high prevalence periods, where rapid identification of infectious patients can inform immediate clinical management and infection control measures [86] [85].
However, the variable sensitivity, particularly for influenza A and RSV, necessitates careful consideration of negative results. The CDC specifically recommends against using RIDTs for hospitalized patients with suspected influenza, instead advocating for molecular assays like RT-PCR due to their superior sensitivity [85]. Similarly, studies of SARS-CoV-2 RATs recommend confirming negative results with RT-PCR when clinical suspicion is high, especially for individuals with previous infections or those tested later in the symptomatic course [29].
Public Health and Research Implications
From a public health perspective, RATs provide significant value in outbreak settings and for epidemiological surveillance. Their rapid turnaround time enables quick implementation of infection control measures in congregate settings [85]. For research applications, understanding the performance characteristics of different RATs is essential for proper study design, particularly when selecting appropriate diagnostic methods based on research objectives—whether prioritizing speed (RATs) or sensitivity (RT-PCR).
The correlation between RAT positivity and infectiousness (as indicated by Ct values) suggests RATs may be particularly useful for identifying actively transmitting individuals, potentially making them more valuable than RT-PCR for infection control purposes in certain scenarios [87]. This distinction between diagnostic sensitivity and identification of infectious individuals represents an important consideration for both clinical management and public health strategy.
In the landscape of medical diagnostics, evaluating test performance requires robust evidence that transcends individual studies with limited sample sizes. Systematic reviews and meta-analyses represent the highest level of evidence in the scientific hierarchy, providing pooled estimates of diagnostic accuracy from multiple studies to inform clinical practice and health policy. Within the context of the COVID-19 pandemic, the comparative performance of rapid antigen tests (RATs) versus real-time reverse transcription polymerase chain reaction (RT-PCR) has emerged as a critical area of investigation, particularly given the trade-offs between speed and sensitivity. These comprehensive analyses synthesize findings across diverse populations, settings, and methodologies, offering insights that individual studies cannot provide alone. For researchers, scientists, and drug development professionals, understanding this evidence base is essential for making informed decisions about test deployment, interpretation, and development.
The fundamental challenge in diagnostic test evaluation lies in balancing multiple performance characteristics: sensitivity (the ability to correctly identify those with the disease), specificity (the ability to correctly identify those without the disease), predictive values, and practical considerations including turnaround time, cost, and technical requirements [88] [76]. Systematic reviews and meta-analyses quantifying these parameters for SARS-CoV-2 testing have been instrumental in shaping testing strategies across clinical and community settings worldwide, particularly as new variants emerge and immunity landscapes shift.
Methodological Framework: How Evidence is Synthesized
Fundamental Concepts in Diagnostic Test Evaluation
The evaluation of diagnostic tests relies on several key metrics derived from 2x2 contingency tables comparing index test results to a reference standard:
- Sensitivity: The proportion of true positives correctly identified by the test = True Positives / (True Positives + False Negatives) [88]
- Specificity: The proportion of true negatives correctly identified by the test = True Negatives / (True Negatives + False Positives) [88]
- Positive Predictive Value (PPV): The probability that subjects with a positive test truly have the disease [88]
- Negative Predictive Value (NPV): The probability that subjects with a negative test truly do not have the disease [88]
These metrics are intrinsic test characteristics that remain unaffected by disease prevalence, unlike predictive values which are highly dependent on the prevalence of the condition in the population being tested [88] [76]. In clinical practice, high sensitivity is particularly valuable for "ruling out" disease when tests return negative results (high NPV), while high specificity is valuable for "ruling in" disease when tests return positive results (high PPV) [88].
Systematic Review and Meta-Analysis Methodology
Systematic reviews of diagnostic test accuracy employ rigorous, protocol-driven approaches to identify, select, appraise, and synthesize all relevant studies on a specific research question. The standard methodology encompasses:
- Protocol Registration: Prospective registration in platforms like PROSPERO to minimize bias and duplication [46]
- Comprehensive Search Strategy: Systematic searching of multiple databases (PubMed, Scopus, Embase, Web of Science) using standardized search terms [46] [89]
- Study Selection: Application of predefined inclusion/exclusion criteria to identify eligible studies
- Quality Assessment: Evaluation of methodological quality using tools such as the JBI checklist or QUADAS-2 [46] [89]
- Data Extraction: Standardized extraction of relevant data points from included studies
- Statistical Synthesis: Meta-analysis using random or fixed effects models to pool accuracy estimates, with investigation of heterogeneity through subgroup analyses and meta-regression [89]
This structured approach minimizes bias and provides the most reliable evidence for guiding diagnostic and therapeutic decisions.
Comparative Test Methodologies
RT-PCR: The Gold Standard
RT-PCR serves as the reference standard for SARS-CoV-2 detection due to its high analytical sensitivity. The methodology involves:
- Sample Collection: Nasopharyngeal, oropharyngeal, or nasal swabs collected by healthcare professionals or self-collected
- RNA Extraction: Isolation of viral RNA from specimen using commercial extraction kits
- Reverse Transcription: Conversion of viral RNA to complementary DNA (cDNA) using reverse transcriptase enzyme
- Amplification: Exponential amplification of target genes (e.g., N, E, RdRP) using sequence-specific primers and probes
- Detection: Fluorescent signal detection in real-time as amplification occurs
The main advantages of RT-PCR include excellent sensitivity (ability to detect low viral loads), high specificity, and quantitative capability (through cycle threshold values). Limitations include long turnaround times (several hours to days), requirement for specialized equipment and trained personnel, and higher cost relative to rapid tests [90].
Rapid Antigen Tests: Point-of-Care Alternative
Rapid antigen tests detect the presence of viral proteins through lateral flow immunoassay technology:
- Sample Collection: Nasal or nasopharyngeal swabs, typically self-collected or collected with minimal training
- Sample Preparation: Mixing of specimen with extraction buffer to release viral antigens
- Lateral Flow Migration: Application of sample to test strip containing labeled antibodies
- Antigen-Antibody Complex Formation: Binding of viral antigens to antibody-conjugated colored particles
- Test Line Capture: Immobilization of complexes at test line containing SARS-CoV-2-specific antibodies
- Result Interpretation: Visual reading of colored bands within 15-30 minutes
The primary advantages of RATs include rapid results (enabling immediate isolation and treatment decisions), point-of-care use (no laboratory infrastructure required), lower cost, and scalability. The major limitation is reduced sensitivity, particularly in cases with low viral load [89] [90].
Figure 1: Methodological Workflow for Systematic Reviews of Diagnostic Test Accuracy
Comprehensive Performance Data from Meta-Analyses
Recent comprehensive meta-analyses have provided robust pooled estimates of RAT performance relative to the RT-PCR gold standard. The largest systematic review and meta-analysis of self-performed RATs, encompassing 45 studies and 50,897 suspected COVID-19 patients, found an overall sensitivity of 0.77 and specificity of 1.00 compared to RT-PCR [89]. This indicates that while RATs correctly identify nearly all patients without the disease (high specificity), they miss approximately 23% of true positive cases that would be detected by RT-PCR. The corresponding diagnostic odds ratio (DOR) was 625.95, reflecting strong overall discriminatory power [89].
Another focused meta-analysis investigating RAT performance specifically against the Omicron variant included 18 qualified studies and reported a similar pooled sensitivity of 0.671 and specificity of 1.000 [46]. The slightly lower sensitivity for Omicron compared to earlier variants suggests potential challenges in detecting this variant, possibly related to its distinctive tropism and replication patterns. Notably, FDA-approved RAT kits demonstrated better performance than WHO-approved ones with a sensitivity of 0.728 [46], highlighting meaningful differences between available tests.
Table 1: Overall Diagnostic Performance of Rapid Antigen Tests from Meta-Analyses
| Analysis Focus | Number of Studies | Sample Size | Pooled Sensitivity | Pooled Specificity | DOR | Reference |
|---|---|---|---|---|---|---|
| Self-performed RATs | 45 | 50,897 patients | 0.77 (77%) | 1.00 (100%) | 625.95 | [89] |
| Omicron Variant | 18 | N/A | 0.671 (67.1%) | 1.000 (100%) | N/A | [46] |
| General Performance | 20 | 26,056 patients | 0.68 (68%) | 0.99 (99%) | N/A | [90] |
Impact of Viral Load and Sample Type
A critical determinant of RAT sensitivity is viral load, as measured by RT-PCR cycle threshold (Ct) values. Comparative evaluations have demonstrated that both fluorescence immunoassay (FIA) and lateral flow immunoassay (LFIA) RAT formats achieve 100% sensitivity at low Ct values (<25), indicating high viral loads [23]. However, sensitivity declines substantially to 31.82% for FIA and 27.27% for LFIA at Ct values >30, corresponding to lower viral loads [23]. This relationship explains the reduced sensitivity of RATs in asymptomatic cases and early infections, where viral loads tend to be lower.
Sample type also significantly influences test performance. The meta-analysis by Mohammadie et al. found that RATs using nasal swabs showed higher sensitivity compared with nasopharyngeal swabs for Omicron detection [46]. This finding is particularly relevant for self-testing applications, as nasal swabs are more accessible for self-collection. Another systematic review confirmed that RATs achieved higher sensitivity with nasal samples compared to other sample types [89].
Table 2: Impact of Modifying Factors on RAT Performance
| Factor | Impact on Sensitivity | Specific Findings | Reference |
|---|---|---|---|
| Viral Load | Strong positive correlation | 100% sensitivity at Ct<25; <30% at Ct>30 | [23] |
| Sample Type | Varies by collection method | Higher sensitivity with nasal vs. nasopharyngeal swabs | [46] [89] |
| Symptoms | Higher in symptomatic cases | Sensitivity significantly lower in asymptomatic individuals | [89] [90] |
| Variant Type | Varies by variant | Reduced sensitivity for Omicron vs. earlier variants | [46] |
| Test Brand | Substantial variation | FDA-approved kits showed better performance than WHO-approved | [46] |
Test Performance in Specific Use Cases
Quarantine and Surveillance Applications
Modeling studies based on meta-analytic data have demonstrated that the optimal testing strategy depends heavily on the specific application. For quarantine durations of two days or shorter, conducting a RAT on exit from quarantine reduces onward transmission more than a single RT-PCR test with a 24-hour delay [20]. This advantage stems from RATs' rapid turnaround time, which compensates for their lower sensitivity by ensuring infected individuals receive immediate results rather than potentially transmitting while awaiting RT-PCR results.
In serial testing applications for surveillance, frequent RATs can outperform less frequent RT-PCR testing despite lower per-test sensitivity. Comparative analyses of eighteen RATs demonstrated their superiority over RT-PCR with 24-hour delay in serial testing scenarios, particularly when testing frequency was high (e.g., every 2-3 days) [20]. The ability to quickly identify and isolate infectious individuals through frequent testing creates an effective barrier to transmission chains, compensating for occasional false negatives.
Variant-Specific Performance
The emergence of new SARS-CoV-2 variants has raised concerns about potential impacts on test performance, particularly for RATs that target viral antigens potentially affected by mutations. A comprehensive comparative evaluation found that both FIA and LFIA RAT formats achieved 100% sensitivity for detecting the Omicron variant, outperforming their sensitivity for Alpha (78.85% FIA, 69.23% LFIA) and Delta (72.22% FIA, 83.33% LFIA) variants [23]. This finding contradicts concerns about reduced RAT performance against Omicron and suggests that the epitopes detected by these tests remain well-conserved despite Omicron's extensive mutations.
However, another meta-analysis specifically focused on Omicron did find impaired performance of RATs for COVID-19 diagnosis when this variant was circulating, particularly in samples with low viral loads [46]. This apparent discrepancy may reflect differences in the specific RATs included in each analysis or methodological variations in sensitivity assessment. What remains consistent across studies is the strong relationship between viral load and detection sensitivity, regardless of variant.
Detailed Experimental Protocols
Standardized Evaluation Methodology
Systematic reviews included in this analysis synthesized data from studies employing standardized evaluation protocols:
Participant Recruitment:
- Consecutive enrollment of patients meeting clinical case definitions for suspected COVID-19
- Recruitment from various settings: hospitals, primary care centers, community testing sites
- Documentation of symptom status and timing relative to test administration
Sample Collection and Processing:
- Paired samples collected from each participant for both RAT and RT-PCR testing
- Sample types: nasopharyngeal, oropharyngeal, nasal, or saliva specimens
- Blind interpretation of index test results without knowledge of reference standard results
- RT-PCR performed in accredited laboratories using validated protocols
Reference Standard Application:
- RT-PCR established as reference standard using WHO-recommended protocols
- RNA extraction using commercial kits
- Amplification targeting at least two SARS-CoV-2 genes
- Cycle threshold (Ct) values recorded for positive samples as proxy for viral load
Data Analysis:
- Construction of 2x2 contingency tables for each study
- Calculation of sensitivity, specificity, and predictive values
- Meta-analysis using bivariate random-effects models
- Investigation of heterogeneity through subgroup analyses
Quality Assessment and Risk of Bias
Included systematic reviews employed rigorous quality assessment using validated tools:
- QUADAS-2 (Quality Assessment of Diagnostic Accuracy Studies) tool applied to evaluate risk of bias and applicability concerns across four domains: patient selection, index test, reference standard, and flow/timing [89]
- JBI Checklist (Joanna Briggs Institute) for diagnostic test accuracy studies used to assess methodological quality [46]
- Evaluation of publication bias using Deek's funnel plot asymmetry test [89]
Figure 2: Experimental Design for Diagnostic Test Accuracy Studies
The Scientist's Toolkit: Essential Research Reagents and Materials
Table 3: Essential Research Materials for Diagnostic Test Evaluation
| Category | Specific Examples | Research Application | Performance Considerations |
|---|---|---|---|
| Rapid Antigen Tests | Abbott BinaxNOW, Abbott Panbio, SD Biosensor STANDARD Q, Roche-SD Biosensor, CareStart | Point-of-care detection of SARS-CoV-2 antigens | Variable sensitivity (48.48%-95.16%); high specificity (94.74%-100%) [89] |
| RNA Extraction Kits | QIAamp Viral RNA Mini Kit, MagMAX Viral/Pathogen Kit, NucliSENS easyMAG | Nucleic acid isolation for RT-PCR | Extraction efficiency impacts sensitivity; automated vs. manual protocols |
| RT-PCR Master Mixes | TaqPath COVID-19 Combo Kit, Allplex SARS-CoV-2 Assay, Xpert Xpress SARS-CoV-2 | Amplification and detection of viral RNA | Multi-target design (N, E, RdRP genes) reduces false negatives from mutations |
| Reference Materials | WHO International Standards, Heat-inactivated virus, Synthetic RNA controls | Assay validation and quality control | Enable standardization across laboratories and platforms |
| Sample Collection | Nasopharyngeal swabs, Anterior nasal swabs, Saliva collection devices | Specimen acquisition for testing | Sample type affects sensitivity; nasal swabs preferred for self-collection [46] |
| Laboratory Equipment | Real-time PCR systems, Biosafety cabinets, Centrifuges, Vortex mixers | Infrastructure for reference testing | Equipment maintenance and calibration critical for assay reproducibility |
Systematic reviews and meta-analyses provide the highest level of evidence regarding the comparative performance of rapid antigen tests and RT-PCR for SARS-CoV-2 detection. The consolidated data demonstrate that while RATs show lower overall sensitivity compared to RT-PCR (68-77% vs. >95%), they maintain consistently high specificity (approaching 100%) across diverse populations and settings [46] [89] [90]. This performance profile makes them particularly valuable in specific applications: rapid screening in high-prevalence settings, serial testing strategies where frequency compensates for reduced per-test sensitivity, and situations where timeliness of results outweighs the need for maximum sensitivity.
The strong dependence of RAT sensitivity on viral load creates both limitations and opportunities for optimized implementation [23]. The reduced detection capability in low viral load cases (high Ct values) explains poorer performance in asymptomatic individuals and early infection. However, the high sensitivity in cases with high viral loads suggests RATs effectively identify the most infectious individuals, which is particularly valuable from a public health perspective. Future test development should focus on improving sensitivity without sacrificing the speed, accessibility, and scalability that make RATs invaluable tools in pandemic response.
For researchers and drug development professionals, these findings highlight the importance of context-specific test selection and the need for continuous evaluation as new variants emerge. The methodological framework presented here for systematic evidence synthesis serves as a model for evaluating diagnostic technologies beyond SARS-CoV-2, ensuring that medical decisions are guided by the most robust evidence available.
The emergence of rapid antigen tests (RATs) has fundamentally transformed diagnostic approaches to infectious diseases, offering unprecedented speed and accessibility at the point of care. However, their adoption in clinical and public health practice necessitates rigorous performance evaluation against gold-standard molecular methods like real-time reverse transcription polymerase chain reaction (RT-PCR). This guide provides a systematic comparison of commercially available RATs across multiple pathogen targets, presenting objective experimental data to inform researchers, scientists, and drug development professionals. The analysis is framed within the broader thesis of understanding the performance characteristics, limitations, and optimal use cases of RATs in real-world settings, where factors such as viral load, operator skill, and circulating variants significantly impact diagnostic accuracy.
Performance Comparison of SARS-CoV-2 Rapid Antigen Tests
The diagnostic performance of RATs for SARS-CoV-2 detection has been extensively studied, with sensitivity consistently shown to be closely linked to viral load, as approximated by RT-PCR cycle threshold (Ct) values.
Table 1: Comparative Performance of SARS-CoV-2 Antigen Tests Against RT-PCR
| Test Kit / Study | Overall Sensitivity (%) | Overall Specificity (%) | Sensitivity at Low Ct (High Viral Load) | Sensitivity at High Ct (Low Viral Load) | PPV/NPV |
|---|---|---|---|---|---|
| iHealth COVID-19 Antigen Test [91] | 94.3% (Primary) | 98.1% | Not Specified | 85-88% (asymptomatic/late onset) | Not Specified |
| Zydus Cadila RAT [6] | 75.17% | 98.89% | Not Specified | Not Specified | PPV: 98.25%NPV: 82.79% |
| Fluorescence Immunoassay (FIA) [23] | 80.25% | 96.79% | 100% (Ct < 25) | 31.82% (Ct > 30) | PPV: 91.55%NPV: 91.88% |
| Lateral Flow Immunoassay (LFIA) [23] | 76.54% | 97.33% | 100% (Ct < 25) | 27.27% (Ct > 30) | PPV: 90.51%NPV: 92.56% |
| PCL Spit Rapid Antigen Test [8] | 67% | 75% | 100% (Ct ≤ 20)63% (Ct 21-25) | 22% (Ct > 26) | PPV: 86.36%NPV: 50.00% |
A 2024 comparative study of fluorescence immunoassay (FIA) and lateral flow immunoassay (LFIA) formats demonstrated comparable overall performance, with FIA showing marginally higher sensitivity (80.25% vs. 76.54%) and strong agreement with RT-PCR (κ = 0.78-0.80) [23]. The same study revealed that both tests achieved 100% sensitivity for detecting the Omicron variant, suggesting robust performance against this variant [23]. A broader systematic review of FDA-authorized tests confirmed that most kits maintain high accuracy post-approval, with pooled sensitivity of 84.5% in real-world use, though some brands like LumiraDx and SOFIA showed statistically significant declines in sensitivity post-approval [92].
Performance Comparison of Dengue NS1 Rapid Tests
The performance of RATs extends beyond respiratory viruses, as demonstrated by evaluations of Dengue virus (DENV) nonstructural protein 1 (NS1) tests.
Table 2: Performance Comparison of Dengue NS1 Rapid Diagnostic Tests Against RT-PCR
| Test Kit | Overall Sensitivity (%) | Overall Specificity (%) | Sensitivity in Secondary Infections | Sensitivity by Post-Symptom Onset (>3 days) | Reference |
|---|---|---|---|---|---|
| Abbott NS1 | 87.4% | 100% | 86.8% | 97.4% | [93] |
| PBF NS1 | 83.1% | 97.5% | 79.2% | 76.9% | [93] |
A 2025 study comparing two Dengue NS1 RDTs found that the Abbott NS1 test demonstrated higher sensitivity across multiple contexts, including secondary infections and later stages of infection (beyond three days post-symptom onset) [93]. The study also highlighted that combining NS1 antigen detection with anti-DENV IgM serology improved overall diagnostic sensitivity, particularly in secondary infections [93].
Key Experimental Protocols and Workflows
The data presented in this guide are derived from rigorously conducted clinical studies. The following workflows summarize the standard methodologies employed.
Diagram 1: Comparative Evaluation Workflow for RATs vs. RT-PCR.
- Sample Collection: Duplicate nasopharyngeal swabs were collected from symptomatic and asymptomatic individuals using appropriate transport media.
- RT-PCR Method: RNA was extracted using magnetic bead-based automated extraction systems (e.g., Kingfisher Flex). Real-time RT-PCR was performed using FDA-approved kits (e.g., TaqPath COVID-19 RT-PCR Kit) targeting multiple genes (N, S, ORF1ab). Amplification conditions typically involved reverse transcription at 50°C for 20 minutes, initial denaturation at 95°C for 10 minutes, followed by 40-45 cycles of denaturation (95°C for 15 seconds) and annealing/extension (60°C for 30-60 seconds). A Ct value below 35-36 was generally considered positive.
- RAT Execution: The second swab was used immediately for RAT analysis according to the manufacturer's instructions, typically involving sample application to the test device, addition of buffer, and interpretation of results within 15-30 minutes.
- Data Analysis: Sensitivity, specificity, positive predictive value (PPV), and negative predictive value (NPV) were calculated using RT-PCR as the reference standard. Statistical agreement was measured using Cohen's Kappa.
- Sample Collection: Clinical samples were obtained from patients during a dengue outbreak.
- Reference Testing: RT-PCR was performed for definitive diagnosis and serotype determination.
- RDT Execution: The two NS1 RDTs (Abbott and PBF) were performed according to their respective package inserts, likely involving the addition of serum or plasma to the test device.
- Data Analysis: Performance was assessed overall and stratified by infection type (primary vs. secondary) and days post-symptom onset.
The Scientist's Toolkit: Key Research Reagents & Materials
Table 3: Essential Research Materials for Test Kit Evaluation
| Item | Function / Application | Specific Examples |
|---|---|---|
| Nucleic Acid Extraction Kit | Purifies viral RNA from swab samples for RT-PCR. | MagMax Viral/Pathogen Kit (Thermo Fisher) [6], GF-1 Viral Nucleic Acid Extraction Kit [8] |
| Real-Time RT-PCR Kit | Amplifies and detects viral RNA targets. | TaqPath COVID-19 RT-PCR Kit [6], Bosphore Novel Coronavirus Detection Kit [8] |
| Viral Transport Media (VTM) | Preserves specimen integrity during transport and storage. | Copan Venturi Transystem [94] |
| Rapid Antigen Test Kits | Detects viral surface proteins (antigens) for rapid diagnosis. | iHealth COVID-19 Test [91], Abbott NS1 Test [93], PCL Spit RAT [8] |
| Automated Nucleic Acid Extractor | Automates the RNA extraction process for high throughput and consistency. | Kingfisher Flex System [6] |
| Real-Time PCR Thermocycler | Instrument that performs amplification and fluorescence detection for RT-PCR. | ABI 7500 Fast [6], Anatolia Montania 4896 [8] |
The comparative data unequivocally demonstrate that while RATs offer significant advantages in speed, cost, and decentralization, their performance is inherently context-dependent. Key findings confirm that RAT sensitivity is highest in patients with high viral loads (low Ct values) and during the early symptomatic phase, making them invaluable for rapid screening and triage. However, their lower sensitivity in asymptomatic individuals or during later stages of infection necessitates careful interpretation of negative results. The variability in performance between different test brands and across pathogen targets underscores the critical need for robust post-market surveillance and independent validation, as highlighted by the FDA review [92]. For research and drug development, these insights are crucial for designing clinical trials, developing next-generation diagnostics, and formulating effective public health testing strategies that leverage the complementary strengths of both rapid antigen and molecular testing methodologies.
The COVID-19 pandemic created an unprecedented global demand for accurate, scalable, and accessible diagnostic testing. This demand propelled the simultaneous development and deployment of two distinct testing methodologies: rapid antigen detection tests (Ag-RDTs) and real-time reverse transcription polymerase chain reaction (RT-PCR) tests. While RT-PCR emerged as the undisputed gold standard for sensitivity, rapid antigen tests offered the advantages of speed, cost-effectiveness, and point-of-care usability. The central challenge for public health policy has been to balance these competing attributes of accuracy and accessibility to control virus transmission effectively.
This guide provides a comparative analysis of the performance data between these two testing modalities, framing the discussion within the context of how empirical evidence shapes national testing guidelines, determines optimal use cases, and influences reimbursement policies. For researchers and drug development professionals, understanding this interplay between diagnostic performance and policy is crucial for developing next-generation tests that meet both clinical and public health needs. The following sections synthesize recent performance data, detail experimental methodologies, and extract the key policy implications that guide the structured and reimbursable use of COVID-19 diagnostics.
Performance Comparison: Rapid Antigen Tests vs. RT-PCR
Extensive comparative studies have quantified the performance characteristics of rapid antigen tests relative to RT-PCR. The following table summarizes key metrics from recent, robust analyses.
Table 1: Comprehensive Performance Comparison of SARS-CoV-2 Ag-RDTs vs. RT-PCR
| Performance Metric | RT-PCR (Gold Standard) | Rapid Antigen Tests (Ag-RDTs) - Overall | Ag-RDTs - High Viral Load (Ct <25) | Ag-RDTs - Low Viral Load (Ct >30) | Fluorescence Immunoassay (FIA) | Lateral Flow Immunoassay (LFIA) |
|---|---|---|---|---|---|---|
| Sensitivity | 100% (Reference) | 59% - 84.5% [92] [95] | ~100% [95] [55] | 5.59% - 31.82% [95] | 80.25% [23] | 76.54% [23] |
| Specificity | 100% (Reference) | 97% - 99.6% [92] [23] | - | - | 96.79% [23] | 97.33% [23] |
| Overall Accuracy | - | 82% - 92.4% [23] [95] | ~91% agreement [95] | Agreement declines significantly [95] | 92.41% [23] | 92.13% [23] |
| Positive Predictive Value (PPV) | - | Varies with prevalence [55] | - | - | 91.55% [23] | 90.51% [23] |
| Negative Predictive Value (NPV) | - | Varies with prevalence [55] | - | - | 91.88% [23] | 92.56% [23] |
| Key Strengths | Highest sensitivity, Gold standard | Speed, Cost, Accessibility | Excellent for identifying contagious individuals | - | Higher sensitivity in asymptomatic cases [23] | Widespread availability, ease of use |
| Primary Limitation | Slower, Requires lab infrastructure | Lower sensitivity, especially in low viral load | - | Misses pre-/post-infectious phases [95] | - | - |
The data reveals a clear performance trade-off. A 2025 systematic review in Clinical Microbiology and Infection found that the pooled sensitivity for Ag-RDTs in post-approval real-world studies was 84.5%, only slightly lower than the 86.5% found in pre-approval studies, indicating consistent performance [92]. However, this overall figure masks critical variability. A large cross-sectional study in Brazil highlighted that while Ag-RDTs showed 90.85% agreement with qPCR in samples with high viral load (Cq < 20), this agreement plummeted to 5.59% in samples with low viral load (Cq ≥ 33) [95]. This establishes viral load, not the mere presence of infection, as the primary determinant of Ag-RDT sensitivity.
Furthermore, performance is not uniform across test formats or manufacturers. A 2024 comparative evaluation found that fluorescence immunoassays (FIA) demonstrated higher sensitivity (80.25%) than lateral flow immunoassays (LFIA) (76.54%) when compared to RT-PCR [23]. This same study noted that FIA showed superior sensitivity (73.68%) and PPV (92.08%) compared to LFIA (65.79% and 90.56%, respectively) in asymptomatic patients, a crucial distinction for screening programs [23]. These nuanced performance data directly inform which tests are recommended for specific use cases and, consequently, which tests receive reimbursement for those applications.
Experimental Protocols and Methodologies
The performance data cited in policy documents are derived from rigorously validated experimental protocols. Understanding these methodologies is essential for evaluating the quality of the evidence.
Protocol for Comparative Accuracy Studies
A standard protocol for comparing Ag-RDTs to RT-PCR involves simultaneous testing of clinical samples with both methods.
Diagram: Experimental workflow for comparative test evaluation
The key steps, as performed in a study published in Microbiology Spectrum, are [23]:
- Cohort Enrollment & Sample Collection: A total of 268 samples were collected from individuals presenting with symptoms suggestive of COVID-19. Simultaneous testing was performed for SARS-CoV-2 using RT-PCR and two types of Ag-RDTs (FIA and LFIA).
- RNA Extraction & RT-PCR: Viral RNA was extracted using automated systems or manual kits. The RT-PCR was performed targeting SARS-CoV-2 specific genes (e.g., N, ORF1a/b). Cycle threshold (Ct) values below 35-40 are typically considered positive, with lower Ct values indicating higher viral loads [23] [55].
- Antigen Testing: The Ag-RDTs (both FIA and LFIA) were performed strictly according to manufacturers' instructions. These tests detect the presence of viral nucleocapsid proteins.
- Viral Load Quantification & Variant Identification: Ct values from RT-PCR are used as a proxy for viral load. Variant identification is performed using PCR-based assays or sequencing.
- Data Analysis: Diagnostic performance (sensitivity, specificity, PPV, NPV) of each Ag-RDT is calculated using RT-PCR as the reference standard. Statistical agreement (e.g., Cohen's Kappa) is also determined.
Protocol for Real-World Post-Market Surveillance
To assess how tests perform outside controlled studies, systematic reviews and meta-analyses of post-approval data are conducted. A 2025 analysis in Clinical Microbiology and Infection exemplifies this approach [92]:
- Literature Screening: Researchers systematically identified 26 post-approval studies that evaluated FDA-authorized SARS-CoV-2 antigen tests used according to manufacturer instructions in real-world settings.
- Data Extraction & Pooling: Data from over 15,500 individuals across nine different test brands were extracted. This included results from both pre-approval (submitted for EUA) and post-approval phases.
- Meta-Analysis: Pooled sensitivity and specificity were calculated for both pre- and post-approval datasets. Subgroup analyses were performed for specific test brands and patient populations (e.g., symptomatic vs. asymptomatic).
- Statistical Comparison: The differences in performance between pre- and post-approval phases were tested for statistical significance, identifying tests with significant performance declines.
The Scientist's Toolkit: Key Research Reagent Solutions
The experiments that generate policy-shaping data rely on a suite of specialized reagents and tools. The following table details these essential components.
Table 2: Key Research Reagents and Materials for COVID-19 Test Evaluation
| Reagent/Material | Function in Experimental Protocol | Example Use-Case & Implication |
|---|---|---|
| Viral Nucleic Acid Transport (vNAT) Medium | Stabilizes viral RNA in swab samples during transport and storage for RT-PCR. | Maintains RNA integrity for accurate RT-PCR results, which is critical for serving as a reliable gold standard in comparative studies [55]. |
| Viral Lysis / RNA Extraction Kits | Breaks open viral particles and purifies RNA, removing inhibitors that can affect RT-PCR. | Automated extraction systems ensure high-throughput and consistent results in large-scale studies, reducing operational variability [96]. |
| RT-PCR Master Mix | Contains enzymes (reverse transcriptase, DNA polymerase), dNTPs, buffers, and probes/primers for target amplification and detection. | The specificity of primers and probes for SARS-CoV-2 genes (N, ORF1ab, E) is fundamental to the test's accuracy and ability to detect variants [23] [97]. |
| SARS-CoV-2 Positive & Negative Controls | Verified positive (inactivated virus or synthetic RNA) and negative (human matrix) samples. | Essential for validating each batch of RT-PCR or antigen tests, ensuring day-to-day experimental reliability and quality control [55]. |
| Fluorescence Immunoassay (FIA) Analyzer & Cartridges | Automated reader that detects fluorescent signals from positive FIA antigen tests, providing objective results. | Reduces subjective interpretation compared to visual LFIA readouts, potentially increasing sensitivity and reliability in studies and clinical use [23]. |
| Combined Oro/Nasopharyngeal Swabs | Specimen collection devices designed to sample both the oropharynx and nasopharynx. | Using combined swabs can increase viral yield, thereby improving the sensitivity of both PCR and antigen tests in validation studies [55]. |
The performance data generated by the aforementioned methodologies directly shapes public health policy, testing guidelines, and reimbursement decisions in several critical ways.
Informed Test Application and Guidelines
Public health bodies like the WHO and CDC have developed nuanced testing guidelines that reflect the empirical performance data [55]:
- Use of Ag-RDTs for Symptomatic Individuals and Outbreaks: Guidelines recommend Ag-RDTs for testing symptomatic individuals within the first 5-7 days of symptom onset when viral loads are highest. They are also prioritized for outbreak investigations and screening in high-prevalence settings (>5%) where the Positive Predictive Value (PPV) is high [55]. Reimbursement policies are often aligned to cover Ag-RDTs in these scenarios.
- Confirmatory RT-PCR for Specific Scenarios: Due to the risk of false negatives with Ag-RDTs in low-viral-load cases, policy often mandates confirmatory RT-PCR testing for symptomatic individuals with a negative Ag-RDT result. Conversely, in low-prevalence settings, a positive Ag-RDT result in an asymptomatic person may require RT-PCR confirmation to avoid false positives [55]. This creates a reimbursement framework for sequential or confirmatory testing.
Driving Post-Market Surveillance and Manufacturer Accountability
The observation that some test brands (e.g., LumiraDx and SOFIA) showed statistically significant declines in sensitivity in post-approval studies highlights a key area for policy intervention [92]. This evidence underscores the necessity of:
- Mandatory Post-Market Surveillance: Regulatory agencies are increasingly advised to require systematic post-market evaluations, especially for tests deployed in non-clinical or asymptomatic populations [92].
- Enhanced Transparency: With only a small fraction of pre-approval studies being peer-reviewed, future policy may require public reporting of all study protocols and results, improving accountability and informing procurement and reimbursement decisions [92].
Economic and Operational Modeling for Reimbursement
The move towards standard cost-effectiveness analyses, as seen in the UK's JCVI advice for COVID-19 vaccination from autumn 2025, has parallels in diagnostics [98]. Reimbursement policies are increasingly shaped by:
- Cost-Effectiveness Assessments: The value of a testing strategy is evaluated based on the cost per correct diagnosis and the downstream public health benefits. The high specificity and low cost of Ag-RDTs make them highly cost-effective for mass screening despite lower sensitivity.
- Targeted Program Deployment: Modeling based on performance data allows policymakers to target testing resources to the most impactful settings (e.g., schools, workplaces, travel) and populations (e.g., older adults, immunosuppressed) [96] [98], ensuring that reimbursement funds are allocated efficiently.
In conclusion, the pathway from laboratory performance data to public health policy is defined by a critical evaluation of trade-offs. RT-PCR remains the cornerstone for definitive diagnosis where maximum sensitivity is required, while rapid antigen tests have proven their utility as a public health tool for screening and rapid isolation. For researchers and developers, the ongoing evolution of policy and reimbursement underscores the need for not only high-performing tests but also robust, real-world evidence that demonstrates their value within a complex and cost-conscious healthcare ecosystem. Future diagnostics must be developed with these policy-shaping performance metrics in mind.
Conclusion
The comparative analysis unequivocally establishes RT-PCR as the more sensitive diagnostic tool, with rapid antigen tests serving as a complementary technology best deployed in specific, high-prevalence scenarios where speed and accessibility are paramount. The performance of RATs is intrinsically linked to viral load, making them most reliable during the peak infectious period and less so for ruling out early or late infection. Future directions for biomedical research must focus on the development of next-generation RATs with improved sensitivity, ongoing validation against emerging viral variants, and the creation of integrated diagnostic frameworks that strategically leverage the strengths of both technologies to enhance pandemic preparedness and response.
References
- 1. Rapid SARS-CoV-2 antigen assay in detection with... comparison [https://virologyj.biomedcentral.com/articles/10.1186/s12985-020-01452-5]
- 2. evaluation of automated chemiluminescence... Performance [https://pmc.ncbi.nlm.nih.gov/articles/PMC8457631/]
- 3. of COVID-19 Patients through SARS-CoV-2 Detection Assay... Antigen [https://bmrat.org/index.php/BMRAT/article/view/879]
- 4. of SARS-CoV-2 Comparison electrochemiluminescence... antigen [https://www.degruyterbrill.com/document/doi/10.1515/dx-2021-0078/html]
- 5. Direct comparison of Xpert Xpress, FilmArray Respiratory Panel... [https://bmcinfectdis.biomedcentral.com/articles/10.1186/s12879-022-07185-w]
- 6. A comparison of SARS-CoV-2 rapid with realtime... antigen testing [https://bmcinfectdis.biomedcentral.com/articles/10.1186/s12879-022-07969-0]
- 7. Diagnostic Performance of an Antigen Test with RT - PCR for the... [https://www.cdc.gov/mmwr/volumes/70/wr/mm7019a3.htm]
- 8. of Comparison with Rapid - Antigen for COVID-19... Test RT PCR [https://romj.org/2024-0210]
- 9. [Retrospective analysis of the performance of the SARS-CoV-2 rapid ...] [https://pubmed.ncbi.nlm.nih.gov/33985935/]
- 10. Interpreting SARS-CoV-2 Diagnostic : Common... | AAFP Tests [https://www.aafp.org/pubs/afp/issues/2021/0415/p465.html]
- 11. Real-Time qPCR and Rapid Antigen Testing of COVID - 19 ... Testing [https://www.intechopen.com/chapters/1134773]
- 12. Frontiers | Droplet digital RT - PCR method for SARS - CoV - 2 variants... [https://www.frontiersin.org/journals/microbiology/articles/10.3389/fmicb.2025.1635733/full]
- 13. evaluation of Comparative - RT and PCR -based antigen ... rapid [https://pmc.ncbi.nlm.nih.gov/articles/PMC11237673/]
- 14. of Comparison Detection Rapid with Reverse... Antigen Test [https://www.medscape.com/medline/abstract/37691370]
- 15. Analytical performance evaluation of a multiplex real - time - RT kit... PCR [https://pubmed.ncbi.nlm.nih.gov/40755805/]
- 16. : less haste, more speed please Antigen testing vs PCR [https://www.cepheid.com/en-US/insights/insight-hub/respiratory-health/2025/09/antigen-testing-vs-pcr-less-haste-more-speed-please.html]
- 17. of COVID-19 Accuracy to rapid - antigenic ... tests compared RT PCR [https://pubmed.ncbi.nlm.nih.gov/34134035/]
- 18. Performance of SARS-CoV-2 rapid with... antigen test compared [https://pmc.ncbi.nlm.nih.gov/articles/PMC8088036/]
- 19. , nasopharyngeal Antigen and saliva... | PLOS One rapid tests PCR [https://journals.plos.org/plosone/article?id=10.1371/journal.pone.0282150]
- 20. analyses of eighteen Comparative and rapid - antigen ... tests RT PCR [https://www.nature.com/articles/s43856-022-00147-y?error=cookies_not_supported&code=f718df2f-9708-4618-ae15-1cd3b83a8629]
- 21. KoreaMed Synapse [https://synapse.koreamed.org/articles/1057290]
- 22. Diagnostic performance of influenza viruses and RSV rapid ... antigen [https://pmc.ncbi.nlm.nih.gov/articles/PMC7185377/]
- 23. evaluation of Comparative - RT and PCR -based antigen ... rapid [https://pubmed.ncbi.nlm.nih.gov/38683014/]
- 24. (PDF) Value of Rapid in antigen with test - comparison ... RT PCR [https://www.academia.edu/111547178/Value_of_Rapid_antigen_test_in_comparison_with_RT_PCR_method_for_diagnosis_of_COVID_19]
- 25. Diagnostic Accuracy of Rapid Antigen Tests for COVID-19 Detection... [https://pmc.ncbi.nlm.nih.gov/articles/PMC9021531/]
- 26. Real-world accuracy of SARS-CoV-2 antigen detection compared with qPCR: A cross-sectional study in Toledo - PR, Brazil - PMC [https://pmc.ncbi.nlm.nih.gov/articles/PMC12036026/]
- 27. Comparative and Prospective Study on the Efficacy of RT-PCR and Rapid Antigen Test in Symptomatic COVID-19 Patients at Tertiary Care Hospital - Journal of Pure and Applied Microbiology [https://microbiologyjournal.org/comparative-and-prospective-study-on-the-efficacy-of-rt-pcr-and-rapid-antigen-test-in-symptomatic-covid-19-patients-at-tertiary-care-hospital/]
- 28. Comparative Performance of a Rapid SARSCoV-2 Antigen Test with RT-PCR for the Diagnosis of COVID-19 [https://www.gavinpublishers.com/article/view/comparative-performance-of-a-rapid-sarscov-2-antigen-test-with-rt-pcr-for-the-diagnosis-of-covid-19]
- 29. Diagnostic performance of rapid antigen tests ( RAT ) for COVID-19 and... [https://bmcinfectdis.biomedcentral.com/articles/10.1186/s12879-024-09408-8]
- 30. A Comparative Study of Real-Time RT-PCR–Based SARS-CoV-2 Detection Methods and Its Application to Human-Derived and Surface Swabbed Material - PMC [https://pmc.ncbi.nlm.nih.gov/articles/PMC8096526/]
- 31. Clinical Significance of Quantitative Viral in Patients Positive for... Load [https://pmc.ncbi.nlm.nih.gov/articles/PMC11256246/]
- 32. Evaluation of the Boson rapid Ag test vs RT – PCR for use as... [https://pmc.ncbi.nlm.nih.gov/articles/PMC9335347/]
- 33. How accurate are rapid antigen COVID tests? [https://www.news-medical.net/news/20220217/How-accurate-are-rapid-antigen-COVID-tests.aspx]
- 34. Accuracy of rapid point-of-care antigen-based diagnostics for SARS-CoV-2: An updated systematic review and meta-analysis with meta-regression analyzing influencing factors | PLOS Medicine [https://journals.plos.org/plosmedicine/article?id=10.1371/journal.pmed.1004011]
- 35. Evaluation of Comparative Detection with Reverse... Rapid Antigen [https://pathology.medresearch.in/index.php/jopm/article/view/657]
- 36. Sensitivity and specificity of two WHO approved SARS-CoV2 antigen assays in detecting patients with SARS-CoV2 infection | BMC Infectious Diseases | Full Text [https://bmcinfectdis.biomedcentral.com/articles/10.1186/s12879-022-07240-6]
- 37. Factors that Influence the Reported Sensitivity of Rapid Antigen Testing for SARS-CoV-2 - PMC [https://pmc.ncbi.nlm.nih.gov/articles/PMC8524138/]
- 38. Performance of two SARS-CoV-2 rapid antigen detection tests in... [https://pmc.ncbi.nlm.nih.gov/articles/PMC11225473/]
- 39. A SARS-CoV-2 antigen rapid diagnostic test for resource ... limited [https://www.nature.com/articles/s41598-021-02128-y?error=cookies_not_supported&code=216ce294-c2dd-4667-b07b-d8b7167298b9]
- 40. - COVID Testing and 19 in Diagnosis : Latest Methods and 2025 Costs [https://www.inliber.com/en/posts/covid-19-testing-and-diagnosis-in-2024-latest-methods-and-costsN4CK]
- 41. of an Antigen-Based Performance for Test and... Asymptomatic [https://www.cdc.gov/mmwr/volumes/69/wr/mm695152a3.htm]
- 42. of the Diagnostic Comparison of a Performance ... Rapid Antigen Test [https://www.dovepress.com/comparison-of-the-diagnostic-performance-of-a-rapid-antigen-test-with--peer-reviewed-fulltext-article-IDR]
- 43. - Real - Time Test for the Detection of SARS-CoV-2: How Does... RT PCR [https://www.labx.com/resources/real-time-rt-pcr-test-for-the-detection-of-sars-cov-2-how-does-it-work/304]
- 44. How accurate is your RAT? Three scenarios show it's about more than... [https://www.abc.net.au/news/2022-01-27/how-accurate-rapid-antigen-test-more-looking-for-lines/100782662]
- 45. Poor sensitivity of "AccuPower SARS-CoV-2 real - time kit..." RT PCR [https://pmc.ncbi.nlm.nih.gov/articles/PMC7666399/]
- 46. Clinical performance of rapid antigen tests in comparison to RT - PCR ... [https://pubmed.ncbi.nlm.nih.gov/36790832/]
- 47. of Rapid Antigen Tests' Comparison Between Performance and... Delta [https://pmc.ncbi.nlm.nih.gov/articles/PMC9578286/]
- 48. Ten rapid antigen for SARS-CoV- tests widely differ in their ability to... 2 [https://pubmed.ncbi.nlm.nih.gov/37561225/]
- 49. Ten rapid antigen for SARS-CoV- tests widely differ in their ability to... 2 [https://link.springer.com/article/10.1007/s00430-023-00775-8]
- 50. Fast and Presumptive Diagnosis of SARS - CoV - 2 ... Omicron Variants [https://bjstr.medium.com/fast-and-presumptive-diagnosis-of-sars-cov-2-omicron-variants-vs-delta-1ef48113d9fb]
- 51. - RT | Reverse transcription PCR PCR [https://www.qiagen.com/us/knowledge-and-support/knowledge-hub/bench-guide/pcr/real-time-rt-pcr/guidelines-for-rt-pcr]
- 52. A new rapid and inexpensive PCR method to detect ... [https://www.news-medical.net/news/20211212/A-new-rapid-and-inexpensive-PCR-method-to-detect-SARS-CoV-2-Omicron-variant.aspx]
- 53. Analytical and clinical evaluation of antigen -based rapid diagnostic... [https://www.news-medical.net/news/20230802/Analytical-and-clinical-evaluation-of-antigen-based-rapid-diagnostic-tests-against-the-most-encountered-SARS-CoV-2-variants.aspx]
- 54. What’s the difference between a PCR and antigen COVID-19 test ? [https://www.umassmed.edu/news/news-archives/2021/11/whats-the-difference-between-a-pcr-and-antigen-covid-19-test/]
- 55. IDCM — Infectious Diseases and Clinical Microbiology [https://www.idcmjournal.org/sars-cov-2-rapid-antigen-vs-pcr]
- 56. accuracy of artificial intelligence-based multi-spectrum... Diagnostic [https://pmc.ncbi.nlm.nih.gov/articles/PMC12114054/]
- 57. Homepage | European for Centre and Disease Prevention Control [https://www.ecdc.europa.eu/]
- 58. (PDF) Performance characteristics of the boson rapid ... [https://www.academia.edu/102497921/Performance_characteristics_of_the_boson_rapid_SARS_cov_2_antigen_test_card_vs_RT_PCR_Cross_reactivity_and_emerging_variants]
- 59. A validation study comparing the sensitivity and specificity of the new... [https://pubmed.ncbi.nlm.nih.gov/21808109/]
- 60. and reproducibility of standardized-competitive Sensitivity - RT for... PCR [https://molecular-cancer.biomedcentral.com/articles/10.1186/1476-4598-3-5]
- 61. (PDF) Omicron Variants World Prevalence 176 WHO Epidemiological... [https://www.academia.edu/127801614/Omicron_Variants_World_Prevalence_176WHO_Epidemiological_Update_CDC_and_ECDC_data_Tracker_review_as_of_February_21_2025]
- 62. of Performance for Rapid -19 Diagnosis... Antigen Tests COVID [https://pmc.ncbi.nlm.nih.gov/articles/PMC8774565/]
- 63. COVID rapid can return antigen , but experts... tests false negatives [https://www.abc.net.au/news/2021-12-30/how-accurate-are-covid-rapid-antigen-tests-vs-pcr/100729792]
- 64. How accurate are COVID-19 rapid , and when is the best... antigen tests [https://www.abc.net.au/news/health/2022-04-13/covid-rapid-antigen-test-most-common-questions/100983842]
- 65. and Reinfections: the Challenges of... false Negatives [https://asm.org/articles/2020/april/false-negatives-and-reinfections-the-challenges-of]
- 66. Distribution of SARS - CoV - 2 PCR Cycle Threshold Values Provide... [https://pubmed.ncbi.nlm.nih.gov/32687186/]
- 67. Delayed Influenza Treatment in Children With false - Negative ... Rapid [https://pmc.ncbi.nlm.nih.gov/articles/PMC8723894/]
- 68. SARS-CoV-2 PCR or Negative result and the... rapid antigen test [https://pubmed.ncbi.nlm.nih.gov/34376152/]
- 69. Modeling the effectiveness of RT - PCR , RT -LAMP, and antigen ... [https://bmcinfectdis.biomedcentral.com/articles/10.1186/s12879-025-11793-7]
- 70. Diagnostic accuracy and feasibility of a rapid SARS-CoV-2 antigen ... [https://pmc.ncbi.nlm.nih.gov/articles/PMC9187884/]
- 71. How accurate are rapid for diagnosing... | Cochrane antigen tests [https://www.cochrane.org/evidence/CD013705_how-accurate-are-rapid-antigen-tests-diagnosing-covid-19]
- 72. and Specificity of SARS-CoV-2 Sensitivity Detection... Rapid Antigen [https://pubmed.ncbi.nlm.nih.gov/35107327/]
- 73. -based and Rapid molecular antigen for the detection of... rapid tests [https://bmcmedicine.biomedcentral.com/articles/10.1186/s12916-023-02810-0]
- 74. Accuracy and cost description of rapid antigen compared with... test [https://pubmed.ncbi.nlm.nih.gov/34169830/]
- 75. Analytical and Clinical Performance of the CDC Real Time RT - PCR ... [https://journals.plos.org/plosntds/article?id=10.1371/journal.pntd.0002311]
- 76. and specificity - Wikipedia Sensitivity [https://en.wikipedia.org/wiki/Sensitivity_and_specificity]
- 77. Application of serial for Mycobacterium tuberculosis tests to... detection [https://bmcresnotes.biomedcentral.com/articles/10.1186/s13104-019-4350-9]
- 78. Diagnostic accuracy of contemporary and high- sensitivity cardiac... [https://pmc.ncbi.nlm.nih.gov/articles/PMC6475186/]
- 79. High- risk patients with COVID symptoms should use PCR ... | CIDRAP [https://www.cidrap.umn.edu/covid-19/high-risk-patients-covid-symptoms-should-use-pcr-rather-rapid-tests-study-suggests]
- 80. Diagnostic performance of rapid antigen tests ( RAT ) for COVID-19... [https://pmc.ncbi.nlm.nih.gov/articles/PMC11107039/]
- 81. (PDF) The Agreement Between Reverse Transcriptase- Polymerase ... [https://www.academia.edu/123468207/The_Agreement_Between_Reverse_Transcriptase_Polymerase_Chain_Reaction_RT_PCR_and_Rapid_Antigen_Test_RAT_in_Diagnosing_COVID_19]
- 82. JMIR Bioinformatics and Biotechnology - Estimating Antigen ... Test [https://bioinform.jmir.org/2025/1/e68476]
- 83. Comparative Performance of Digital PCR and Real -Time RT - PCR in... [https://pmc.ncbi.nlm.nih.gov/articles/PMC12474457/]
- 84. How Good are COVID-19 (SARS-CoV-2)… | College of American... [https://www.cap.org/member-resources/articles/how-good-are-covid-19-sars-cov-2-diagnostic-pcr-tests]
- 85. Rapid Diagnostic Testing for Influenza: Information for Clinical... | CDC [https://www.cdc.gov/flu/php/laboratories/rapidlab.html]
- 86. Clinical performance of two commercially available rapid antigen tests... [https://pmc.ncbi.nlm.nih.gov/articles/PMC11705943/]
- 87. Diagnostic performance of rapid antigen tests ( RATs ) for... [https://www.nature.com/articles/s41598-021-02197-z?error=cookies_not_supported&code=d2aee39d-222d-401f-af02-7559b442d868]
- 88. , Sensitivity , Receiver-Operating Characteristic... Specificity [https://pmc.ncbi.nlm.nih.gov/articles/PMC2556590/]
- 89. Frontiers | Performance of self- performed SARS-CoV-2 rapid ... [https://www.frontiersin.org/journals/public-health/articles/10.3389/fpubh.2024.1402949/full]
- 90. Diagnostic utility of antigen detection rapid diagnostic tests for... [https://diagnosticpathology.biomedcentral.com/articles/10.1186/s13000-022-01215-6]
- 91. - Results and Accuracy of the iHealth COVID-19 FAQ ... Antigen Rapid [https://support.ihealthlabs.com/hc/en-us/articles/8276809279373-FAQ-Results-and-Accuracy-of-the-iHealth-COVID-19-Antigen-Rapid-Test-ICO-3000]
- 92. FDA Rapid COVID Antigen Hold Up After Approval—But... Tests [https://globalbiodefense.com/2025/07/23/fda-covid-rapid-antigen-test-accuracy-review/]
- 93. comparison of two dengue NS1 rapid diagnostic Performance ... tests [https://pubmed.ncbi.nlm.nih.gov/40803240/]
- 94. of Performance Streptococcal Rapid Varies by... Antigen Testing [https://pmc.ncbi.nlm.nih.gov/articles/PMC1698329/]
- 95. Real-world accuracy of SARS-CoV-2 antigen detection compared with... [https://pubmed.ncbi.nlm.nih.gov/40250203/]
- 96. COVID-19 RT - PCR in the Real World: 5 Uses You'll Actually See... Test [https://www.linkedin.com/pulse/covid-19-rt-pcr-test-real-world-5-uses-youll-efjaf]
- 97. Frontiers | Validation of a one-step reverse transcription PCR detection... [https://www.frontiersin.org/journals/plant-science/articles/10.3389/fpls.2025.1535175/full]
- 98. JCVI statement on COVID - 19 vaccination in 2025 and spring... - GOV.UK [https://www.gov.uk/government/publications/covid-19-vaccination-in-2025-and-spring-2026-jcvi-advice/jcvi-statement-on-covid-19-vaccination-in-2025-and-spring-2026]