UHPLC-MS/MS Lipidomics in Metabolic Disease: Unraveling Lipid Pathways in Diabetes and Hyperuricemia
Ultra-High-Performance Liquid Chromatography-Tandem Mass Spectrometry (UHPLC-MS/MS) has emerged as a powerful tool for uncovering lipidomic signatures in complex metabolic disorders.
UHPLC-MS/MS Lipidomics in Metabolic Disease: Unraveling Lipid Pathways in Diabetes and Hyperuricemia
Abstract
Ultra-High-Performance Liquid Chromatography-Tandem Mass Spectrometry (UHPLC-MS/MS) has emerged as a powerful tool for uncovering lipidomic signatures in complex metabolic disorders. This article explores the application of UHPLC-MS/MS lipidomics to investigate the intertwined pathophysiologies of diabetes mellitus (DM) and hyperuricemia (HUA). We detail the distinct lipid profiles—including upregulated triglycerides, phosphatidylethanolamines, and phosphatidylcholines—that characterize these conditions and the central role of disrupted glycerophospholipid and glycerolipid metabolism pathways. A structured framework is provided, covering foundational discoveries, methodological best practices for untargeted and targeted analysis, strategies for troubleshooting and data optimization, and approaches for biomarker validation. This resource is designed to equip researchers and drug development professionals with the knowledge to leverage lipidomics for biomarker discovery and the identification of novel therapeutic targets.
Lipidomic Landscapes: Discovering Dysregulated Pathways in Diabetes and Hyperuricemia
Lipidomics, a specialized branch of metabolomics, provides a comprehensive approach to systematically analyze the entire lipid profile within a biological system. Lipids are not merely energy storage molecules but play crucial roles as structural components of cell membranes, signaling mediators, and regulators of metabolic processes. The structural diversity of lipids is immense, with estimates suggesting hundreds of thousands of molecular lipid species exist in biological systems [1]. In the context of metabolic syndrome—a cluster of conditions including insulin resistance, dyslipidemia, hypertension, and central obesity—lipidomics offers powerful insights into the underlying metabolic disturbances that conventional clinical chemistry cannot capture.
The application of advanced analytical technologies, particularly ultrahigh-performance liquid chromatography-tandem mass spectrometry (UHPLC-MS/MS), has revolutionized lipid research by enabling the identification and quantification of hundreds of lipid molecular species simultaneously. This technical guide explores the core principles, methodologies, and applications of UHPLC-MS/MS-based lipidomics within metabolic syndrome research, with specific emphasis on diabetes mellitus and hyperuricemia as interconnected metabolic disorders.
Analytical Foundations of UHPLC-MS/MS in Lipidomics
Core Technological Principles
UHPLC-MS/MS combines superior chromatographic separation with high-resolution mass spectrometry to address the complexity of the lipidome. Unlike "shotgun" lipidomics approaches that directly infuse samples into the mass spectrometer, UHPLC-MS/MS provides separation prior to mass analysis, which significantly reduces ion suppression effects and increases sensitivity [2]. The UHPLC system utilizes columns packed with sub-2-μm particles, enabling higher pressure operation and significantly improved chromatographic resolution compared to conventional HPLC.
Mass spectrometry detection typically employs high-resolution instruments such as quadrupole-time-of-flight (Q-TOF) or Orbitrap mass analyzers, which provide accurate mass measurements capable of determining elemental composition with sufficient precision to distinguish between lipid species with subtle mass differences [1]. Tandem mass spectrometry (MS/MS) fragments selected precursor ions to provide structural information about fatty acyl chains, polar head groups, and other structural features.
Advantages Over Conventional Approaches
The UHPLC-MS/MS approach offers several critical advantages for lipidomic analysis:
- Enhanced Sensitivity: Detection limits in the femtomole range on-column enable quantification of low-abundance lipid signaling molecules [2]
- Structural Elucidation: MSⁿ capabilities allow detailed structural characterization, including identification of double bond positions and acyl chain composition [1]
- Isomer Separation: Chromatographic resolution can separate positional isomers of lysophospholipids and structural isomers of diacyl phospholipids and glycerolipids [2]
- Reduced Matrix Effects: Chromatographic separation minimizes ion suppression from co-eluting compounds, improving quantification accuracy [2]
Lipid Alterations in Diabetes and Hyperuricemia
Lipidomic Signatures in Diabetes Mellitus with Hyperuricemia
Recent lipidomic studies have revealed specific alterations in patients with diabetes mellitus (DM) and diabetes combined with hyperuricemia (DH). A 2025 study employing UHPLC-MS/MS analysis identified 1,361 lipid molecules across 30 subclasses in plasma samples from DH patients, DM patients, and normal glucose tolerance (NGT) controls [3]. Multivariate analyses revealed a significant separation trend among these groups, confirming distinct lipidomic profiles.
The study identified 31 significantly altered lipid metabolites in the DH group compared to NGT controls [3]. The most prominent changes included:
Table 1: Significantly Altered Lipid Classes in Diabetes with Hyperuricemia (DH) vs. Controls
| Lipid Class | Representative Molecules | Change in DH | Biological Implications |
|---|---|---|---|
| Triglycerides (TGs) | TG(16:0/18:1/18:2) | Significantly upregulated (13 TGs) | Associated with insulin resistance and cardiovascular risk |
| Phosphatidylethanolamines (PEs) | PE(18:0/20:4) | Significantly upregulated (10 PEs) | Membrane fluidity and signaling precursors |
| Phosphatidylcholines (PCs) | PC(36:1) | Significantly upregulated (7 PCs) | Structural membrane components and signaling |
| Phosphatidylinositol (PI) | Not specified | Downregulated | Altered signaling transduction |
Pathway analysis revealed that these differential lipid metabolites were predominantly enriched in six major metabolic pathways, with glycerophospholipid metabolism (impact value: 0.199) and glycerolipid metabolism (impact value: 0.014) identified as the most significantly perturbed pathways in DH patients [3]. Furthermore, comparison of DH versus DM groups identified 12 differential lipids that were also predominantly enriched in these same core pathways, underscoring their central role in the pathophysiology of hyperuricemia complicating diabetes.
Comparative Lipidomics in Hyperuricemia
Independent lipidomic investigations focusing specifically on hyperuricemia (HUA) have identified additional metabolic disturbances. A UPLC-Q-TOF/MS-based study analyzing serum samples from HUA patients and healthy controls identified 138 differential metabolites in HUA serum, integrating analysis from seven different solvent extraction protocols [4]. These metabolites were involved in seven major metabolic pathways:
Table 2: Metabolic Pathways Altered in Hyperuricemia
| Metabolic Pathway | Key Lipid Classes Involved | Biological Significance |
|---|---|---|
| Glycerophospholipid metabolism | Phosphatidylcholines, Phosphatidylethanolamines | Membrane integrity, signaling precursors |
| Sphingolipid metabolism | Ceramides, Sphingomyelins | Insulin resistance, apoptosis regulation |
| Arachidonic acid metabolism | Prostaglandins, Leukotrienes | Inflammation, immune response |
| Linoleic acid metabolism | Linoleic acid derivatives | Energy metabolism, membrane precursors |
| α-Linolenic acid metabolism | α-Linolenic acid derivatives | Anti-inflammatory effects, neuroprotection |
| Phenylalanine metabolism | Aromatic amino acid derivatives | Connection to purine metabolism |
| Phenylalanine, tyrosine, and tryptophan biosynthesis | Aromatic amino acids | Precursors to neurotransmitters and hormones |
The convergence of findings from both studies highlights the central importance of glycerophospholipid metabolism in both diabetes and hyperuricemia, suggesting shared metabolic disturbances that may explain their frequent co-occurrence.
Experimental Workflows in Lipidomics Research
Standardized Lipidomics Workflow
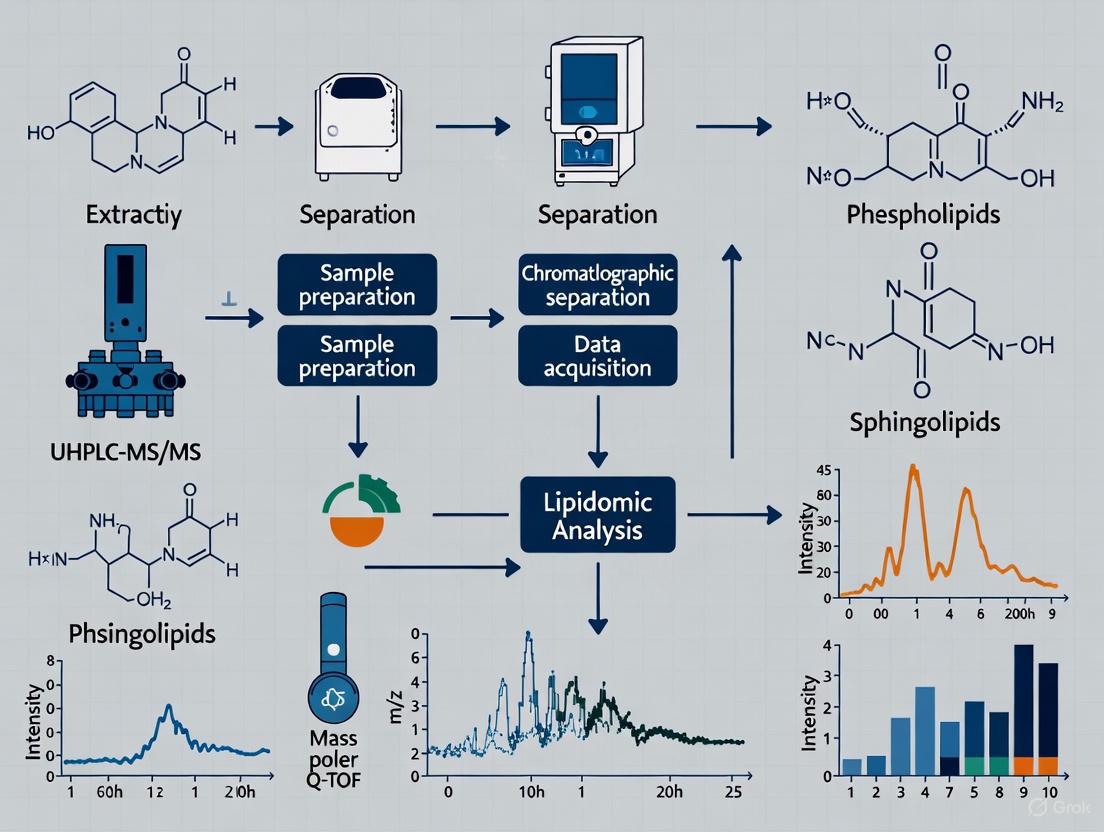
The following diagram illustrates the comprehensive workflow for UHPLC-MS/MS-based lipidomic analysis from sample collection to data interpretation:
Sample Preparation and Extraction Protocols
Proper sample preparation is critical for comprehensive lipidomic analysis. For plasma or serum samples, the following liquid-liquid extraction method based on methyl tert-butyl ether (MTBE) is widely employed [3]:
- Sample Collection: Collect fasting blood samples and separate plasma/serum by centrifugation at 3,000 rpm for 10 minutes at room temperature [3]
- Lipid Extraction:
- Aliquot 100 μL of plasma into a 1.5 mL centrifuge tube
- Add 200 μL of 4°C water and vortex mix
- Add 240 μL of pre-cooled methanol followed by 800 μL of MTBE
- Sonicate in a low-temperature water bath for 20 minutes
- Stand at room temperature for 30 minutes
- Centrifuge at 14,000 g for 15 minutes at 10°C
- Collect the upper organic phase and dry under nitrogen stream [3]
Alternative extraction methods include modified Folch extraction (chloroform:methanol, 2:1) for broader lipid class coverage [1]. The choice of extraction solvent significantly impacts lipid coverage, with different methanol-acetonitrile ratios yielding varying numbers of detected lipid species [4].
UHPLC-MS/MS Analytical Conditions
Standardized chromatographic and mass spectrometric conditions are essential for reproducible lipidomic analysis:
Chromatographic Conditions [3] [1]:
- Column: Waters ACQUITY UPLC BEH C18 (2.1 × 100 mm, 1.7 μm)
- Mobile Phase A: 10 mM ammonium formate in water or 0.2% formic acid aqueous solution
- Mobile Phase B: 10 mM ammonium formate in acetonitrile-isopropanol or methanol with modifiers
- Gradient: Typically from 35-100% organic phase over 7-15 minutes
- Temperature: 45-50°C
- Flow Rate: 0.400 mL/min
- Injection Volume: 2.0 μL
Mass Spectrometry Conditions [3] [4]:
- Ionization: Electrospray ionization (ESI) in positive and negative modes
- Mass Range: m/z 300-1200 or 50-1200
- Ion Spray Voltage: 3.0 kV
- Source Temperature: 120-450°C
- Resolution: High-resolution setting (R = 60,000 for Orbitrap instruments)
The Scientist's Toolkit: Essential Research Reagents and Materials
Table 3: Essential Research Reagents for UHPLC-MS/MS Lipidomics
| Reagent/Material | Function/Purpose | Technical Specifications |
|---|---|---|
| Methyl tert-butyl ether (MTBE) | Primary extraction solvent for liquid-liquid extraction | Chromasolv grade or equivalent [3] [2] |
| Methanol, Acetonitrile, Isopropanol | Organic solvents for extraction and mobile phases | LC-MS grade, Chromasolv grade [3] [2] |
| Ammonium formate | Mobile phase additive for improved ionization | LC-MS grade [3] [2] |
| Formic acid | Mobile phase modifier for protonation in positive mode | LC-MS grade [4] |
| Internal Standards | Quantification standardization | Deuterated or 13C-labeled lipid standards [2] |
| C18 UHPLC Column | Chromatographic separation | 2.1 × 100 mm, 1.7 μm particle size [3] [1] |
Metabolic Pathways in Lipidomics
The following diagram illustrates the key metabolic pathways identified as significantly altered in diabetes with hyperuricemia, based on lipidomic studies:
Data Processing and Statistical Analysis
Lipidomic data processing involves multiple steps to convert raw mass spectrometric data into biologically meaningful information:
- Peak Detection and Alignment: Software tools (e.g., Progenesis QI, MZmine 2) detect chromatographic peaks and align them across samples [4] [1]
- Normalization: Data normalization using internal standards and quality control samples corrects for technical variability [4]
- Multivariate Statistical Analysis:
- Differential Analysis: Statistical tests (e.g., Student's t-test) combined with fold-change calculations identify significantly altered lipids [3]
- Pathway Analysis: Platforms such as MetaboAnalyst 5.0 identify enriched metabolic pathways based on the differential lipid species [3]
Lipidomics has emerged as an essential tool for unraveling the complex metabolic disturbances in metabolic syndrome, particularly in the interplay between diabetes and hyperuricemia. The identification of specific lipid signatures and perturbed pathways provides insights into disease mechanisms and potential therapeutic targets.
Future directions in the field include:
- Standardization of analytical protocols and nomenclature through initiatives such as the Lipidomics Standards Initiative [5]
- Integration of lipidomics with other omics technologies for comprehensive systems biology understanding
- Development of improved computational tools for lipid identification and pathway analysis
- Application of stable isotope labeling for dynamic monitoring of lipid fluxes in metabolic pathways [5]
The continued advancement of UHPLC-MS/MS platforms and analytical methodologies will further enhance our understanding of lipid metabolism in metabolic syndrome, potentially leading to novel diagnostic biomarkers and targeted therapeutic interventions for diabetes, hyperuricemia, and their associated complications.
The comorbidity of Diabetes Mellitus (DM) and Hyperuricemia (HU) presents a significant clinical challenge, with growing evidence suggesting that their confluence exacerbates disruptions in lipid metabolism. Conventional clinical biomarkers often fail to capture the full spectrum of these metabolic alterations. Within the context of a broader thesis on UHPLC-MS/MS lipidomic analysis in metabolic disease research, this technical guide delineates the distinct plasma lipidomic signatures that differentiate patients with diabetes alone from those with diabetes combined with hyperuricemia (DH). The application of advanced lipidomics provides a powerful tool for researchers and drug development professionals to uncover novel biomarkers and elucidate perturbed metabolic pathways, thereby informing targeted therapeutic strategies.
Lipidomic Landscape: DM vs. DH
Ultra-high-performance liquid chromatography-tandem mass spectrometry (UHPLC-MS/MS) based lipidomic studies have successfully characterized the specific lipid disturbances associated with DM and DH. A comparative analysis reveals both shared and unique lipidomic footprints.
Table 1: Key Lipid Class Alterations in DM vs. DH
| Lipid Class | Trend in DM | Trend in DH (vs. DM or Healthy) | Specific Lipid Examples (with notation) | Biological Relevance |
|---|---|---|---|---|
| Triglycerides (TGs) | Commonly elevated [6] | Significantly Upregulated [3] | TG(16:0/18:1/18:2), TG(17:0/17:0/17:0) [3] [7] | Primary energy storage; markers of energy metabolic flux. |
| Phosphatidylcholines (PCs) | Altered levels [6] [8] | Significantly Upregulated [3] | PC(36:1), PC(18:0/20:3) [3] [7] | Major membrane phospholipids; involved in signaling. |
| Phosphatidylethanolamines (PEs) | Altered levels [6] [7] | Significantly Upregulated [3] | PE(18:0/20:4) [3] | Membrane phospholipids; promote membrane curvature. |
| Lysophosphatidylcholines (LPCs) | Downregulated in T2DM [8] [9] | Information Not Specified | LPC(18:0), LPC(18:1), LPC(18:2) [8] | Pro-inflammatory mediators; correlated with HOMA-IR. |
| Ceramides (Cer) | Upregulated in T2DM [6] [9] | Information Not Specified | Cer(d18:1/24:0), 1-deoxyceramides [6] [9] | Pro-apoptotic signaling molecules; implicated in insulin resistance. |
| Sphingomyelins (SM) | Associated with T2DM risk [6] | Information Not Specified | SM(d18:1/24:0), SM(d18:1/16:1) [6] | Membrane sphingolipids; precursors to ceramides. |
A study directly comparing DH, DM, and normal glucose tolerance (NGT) groups identified 1,361 lipid molecules across 30 subclasses. Multivariate analyses confirmed a significant separation trend among these groups. Specifically, 31 lipid metabolites were significantly altered in the DH group compared to NGT controls. Among the most relevant, 13 triglycerides (TGs), 10 phosphatidylethanolamines (PEs), and 7 phosphatidylcholines (PCs) were significantly upregulated, while one phosphatidylinositol (PI) was downregulated [3]. This pattern suggests a massive disruption in glycerolipid and glycerophospholipid metabolism in the comorbid condition.
In contrast, lipidomic studies of T2DM populations have highlighted alterations in different lipid species. For instance, significant changes in lysophosphatidylcholine (LysoPC), phosphatidylcholine (PC), phosphatidylethanolamine (PE), sphingomyelin (SM), and ceramide (Cer) have been reported [6]. A large-scale study of 293 Chinese individuals found that lipid features gradually changed from NGT to prediabetes to T2DM, and identified specific LysoPCs (e.g., LPC(18:0), LPC(18:1), LPC(18:2)) that were negatively correlated with the insulin resistance index (HOMA-IR) [8]. Furthermore, a comparative study between T1D and T2D found that LPCs and Ceramides showed opposite effects; LPCs were mainly upregulated in T1D and down-regulated in T2D, while Ceramides were upregulated in T2D and down-regulated in T1D [9].
Detailed Experimental Protocols for UHPLC-MS/MS Lipidomics
The reliability of lipidomic data is contingent upon rigorous and standardized experimental protocols. The following methodology is synthesized from key studies investigating lipid metabolism in diabetes and hyperuricemia [3] [7].
Sample Collection and Pre-processing
- Sample Type: Fasting venous blood samples are collected.
- Processing: Blood samples are centrifuged (e.g., 3,000 rpm for 10 min at room temperature) to isolate plasma or serum. The upper layer of plasma is aliquoted and stored at -80 °C until analysis.
- Quality Control (QC): Aliquots from all samples are combined to create a pooled QC sample, which is injected at regular intervals throughout the analytical run to monitor instrument stability and data reproducibility [3] [9].
Lipid Extraction
The modified Folch or MTBE method is widely employed for comprehensive lipid recovery:
- Aliquot: 100 μL of plasma.
- Precipitate Proteins: Add 200 μL of 4°C water and 240 μL of pre-cooled methanol. Vortex to mix.
- Extract Lipids: Add 800 μL of methyl tert-butyl ether (MTBE). Vortex and sonicate in a low-temperature water bath for 20 minutes.
- Phase Separation: Allow the mixture to stand at room temperature for 30 minutes. Centrifuge at 14,000 g at 10°C for 15 minutes.
- Recover Organic Phase: The upper organic phase, which contains the lipids, is collected and dried under a gentle stream of nitrogen gas.
- Reconstitution: The dried lipid extract is reconstituted in 100 μL of isopropanol or a suitable mobile phase for MS analysis [3] [10].
UHPLC-MS/MS Analysis Conditions
Chromatographic Conditions:
- Column: Waters ACQUITY UPLC BEH C18 column (2.1 mm i.d. × 100 mm, 1.7 μm) or similar.
- Mobile Phase:
- A: 10 mM ammonium formate in acetonitrile/water (e.g., 60:40 v/v).
- B: 10 mM ammonium formate in acetonitrile/isopropanol (e.g., 10:90 v/v).
- Gradient: A typical gradient runs from 30% B to 100% B over 25 minutes, followed by re-equilibration.
- Flow Rate: 0.3 - 0.4 mL/min.
- Column Temperature: 40 - 45°C.
- Injection Volume: 2 - 3 μL [3] [9].
Mass Spectrometry Conditions:
- Ionization: Heated Electrospray Ionization (H-ESI) in both positive and negative ion modes.
- Spray Voltage: +5.5 kV (positive), -4.5 kV (negative).
- Ion Source Temperature: 300 - 350°C.
- Sheath Gas & Auxiliary Gas: Optimized for nebulization and desolvation (e.g., 45 and 15 arbitrary units).
- Scan Mode: Data-Dependent Acquisition (DDA) or Data-Independent Acquisition (DIA) for untargeted analysis; Multiple Reaction Monitoring (MRM) for targeted analysis [3] [11].
Data Processing and Statistical Analysis
- Peak Alignment & Identification: Software such as Progenesis QI, MS-DIAL, or commercial and in-house pipelines are used for peak picking, alignment, and lipid identification against reference databases (e.g., LIPID MAPS).
- Multivariate Statistics: Principal Component Analysis (PCA) and Orthogonal Partial Least Squares-Discriminant Analysis (OPLS-DA) are applied to observe group separations and identify differentially abundant lipids.
- Differential Analysis: Student's t-test and fold-change analysis are used for initial screening.
- Pathway Analysis: Platforms like MetaboAnalyst 5.0 are used to map differentially expressed lipids onto metabolic pathways based on enrichment analysis and pathway impact values [3] [8].
Metabolic Pathway Disturbances
The distinct lipid profiles in DM and DH are underpinned by specific perturbations in key metabolic pathways. Pathway enrichment analysis of the 31 significantly altered lipids in DH patients revealed their enrichment in six major pathways, with glycerophospholipid metabolism (impact value 0.199) and glycerolipid metabolism (impact value 0.014) identified as the most significantly disturbed [3]. The central role of these pathways is further underscored by the finding that differential lipids between DH and DM groups were also predominantly enriched in these same core pathways [3].
In studies focused on T2DM with dyslipidemia, sphingolipid metabolism and glycerophospholipid metabolism have been identified as the most relevant pathways associated with glucose and lipid metabolism changes [6]. Furthermore, research in hyperuricemia patients has also identified significant involvement of glycerophospholipid metabolism, along with arachidonic acid, linoleic acid, and alpha-linolenic acid metabolism pathways [10].
The Scientist's Toolkit: Essential Research Reagents & Materials
Table 2: Essential Research Reagents and Materials for UHPLC-MS/MS Lipidomics
| Item Category | Specific Examples & Specifications | Critical Function in Workflow |
|---|---|---|
| Chromatography Column | Waters ACQUITY UPLC BEH C18 (1.7 µm, 2.1x100mm); Kinetex C18 [3] [11] | High-resolution separation of complex lipid extracts prior to MS detection. |
| Mass Spectrometer | Q Exactive Focus (Orbitrap); TripleTOF; QTrap 6500+ [7] [9] | Accurate mass measurement and structural characterization via tandem MS. |
| Lipid Internal Standards | PC(14:0)-d13, TG(17:0/17:0/17:0), Cer(d18:1/17:0) [7] | Absolute quantification and correction for extraction/ionization variability. |
| Solvents (HPLC/MS Grade) | Acetonitrile, Isopropanol, Methanol, Chloroform, MTBE [3] [7] | Lipid extraction, mobile phase preparation, and column cleaning. |
| Mobile Phase Additives | Ammonium Formate, Ammonium Acetate, Formic Acid [3] [9] | Enhance ionization efficiency and control chromatographic peak shape. |
| Sample Vials & Plates | Low Recovery/Volume Vials (e.g., 0.3 mL) [9] | Minimize sample loss and ensure compatibility with autosampler systems. |
Visualizing the Lipidomics Workflow
The entire process, from sample collection to biological insight, can be summarized in the following workflow, which integrates the key tools and steps detailed in the previous sections.
Discussion and Future Perspectives
The distinct lipid profiles delineated through UHPLC-MS/MS analysis highlight that Diabetes Mellitus with Hyperuricemia (DH) is not merely an additive condition but one with a unique and exacerbated lipidomic signature, characterized primarily by a pronounced upregulation of triglycerides (TGs), phosphatidylcholines (PCs), and phosphatidylethanolamines (PEs), driven by core disturbances in glycerophospholipid and glycerolipid metabolism [3]. This contrasts with lipidomic patterns in T2DM alone, which often feature more prominent alterations in sphingolipids like ceramides and a downregulation of specific lysophosphatidylcholines (LPCs) [6] [8] [9].
The translational potential of these findings is significant. The identified differential lipid species, such as the specific TGs and PCs, serve as candidate biomarkers for stratifying patient risk and diagnosing the comorbid condition. Furthermore, the elucidated pathways present novel targets for therapeutic intervention. However, challenges remain in the clinical application of lipidomic biomarkers, including the need for standardized protocols, multi-center validation studies, and sophisticated bioinformatics tools to handle the complex data [12]. Future research directions should focus on longitudinal studies to establish causality, the integration of lipidomics with other omics data, and the development of machine learning models to improve the predictive power of lipid-based diagnostic panels [12]. This precise mapping of the lipidomic landscape in DM and DH paves the way for more personalized and effective management strategies for these complex metabolic disorders.
Lipidomic profiling using advanced analytical techniques like ultra-high-performance liquid chromatography-tandem mass spectrometry (UHPLC-MS/MS) has revolutionized our understanding of metabolic diseases. This approach provides a comprehensive picture of lipid metabolic disorders throughout the body, offering new avenues for identifying novel biomarkers and therapeutic targets [3]. In the context of diabetes mellitus (DM) and hyperuricemia—conditions often characterized by significant lipid abnormalities—lipidomics serves as an effective tool to characterize specific lipid perturbations that precede and accompany disease progression [3] [13].
The dysregulation of three key lipid classes—triglycerides (TGs), glycerophospholipids, and sphingolipids—has emerged as particularly significant in diabetes and hyperuricemia research. These lipids not only serve as structural components and energy stores but also function as bioactive molecules in signaling pathways that influence insulin resistance, inflammation, and cellular dysfunction [13] [14]. Understanding the precise alterations in these lipid species provides crucial insights into disease mechanisms and potential intervention points.
This technical guide synthesizes current evidence on TG, glycerophospholipid, and sphingolipid dysregulation in diabetes and hyperuricemia, with a specific focus on UHPLC-MS/MS methodologies for lipidomic analysis. We present quantitative data from recent studies, detailed experimental protocols, relevant metabolic pathways, and essential research tools to support further investigation in this rapidly advancing field.
Lipid Dysregulation in Metabolic Disease
Triglycerides (TGs)
Triglycerides, consisting of three fatty acids esterified to a glycerol backbone, represent the most abundant energy reserve in the body. Recent lipidomic studies have revealed that specific TG subspecies are significantly altered in metabolic diseases, providing more precise information than traditional clinical measurements of total triglycerides [3] [6].
In patients with diabetes mellitus combined with hyperuricemia (DH), 13 different TG molecules were significantly upregulated compared to healthy controls [3]. A key finding was the marked upregulation of TG (16:0/18:1/18:2) in DH patients, suggesting particular disruption in fatty acid handling and storage. These TG alterations were enriched in the glycerolipid metabolism pathway (impact value: 0.014), indicating its central role in the pathophysiology of hyperuricemia complicating diabetes [3].
Table 1: Significant Triglyceride Alterations in Metabolic Diseases
| TG Subspecies | Change in DH vs. Control | Change in T2DM vs. Control | Associated Metabolic Pathways |
|---|---|---|---|
| TG (16:0/18:1/18:2) | Significantly upregulated [3] | Not specified | Glycerolipid metabolism [3] |
| Multiple other TGs | 12 additional TGs upregulated [3] | Not specified | Glycerolipid metabolism [3] |
| Total TG profile | Not specified | Elevated in T2DM with dyslipidemia [6] | Energy metabolism, Lipid storage |
Glycerophospholipids
Glycerophospholipids, including phosphatidylcholines (PCs), phosphatidylethanolamines (PEs), and phosphatidylinositols (PIs), are essential structural components of cellular membranes and play crucial roles in cell signaling [3] [14]. Lipidomic analyses have identified distinct alterations in specific glycerophospholipid species across different metabolic conditions.
In DH patients, 10 phosphatidylethanolamines, including PE (18:0/20:4), and 7 phosphatidylcholines, including PC (36:1), were significantly upregulated, while one phosphatidylinositol was downregulated [3]. These alterations were predominantly enriched in the glycerophospholipid metabolism pathway (impact value: 0.199), which was identified as the most significantly perturbed pathway in DH patients [3].
Table 2: Glycerophospholipid Alterations in Metabolic Diseases
| Glycerophospholipid Class | Specific Molecules | Change in Disease vs. Control | Biological Significance |
|---|---|---|---|
| Phosphatidylethanolamines (PEs) | PE (18:0/20:4) | Upregulated in DH [3] | Membrane fluidity, signaling |
| Phosphatidylcholines (PCs) | PC (36:1) | Upregulated in DH [3] | Membrane structure, lipid signaling |
| Lysophosphatidylcholine (LysoPC) | Multiple species | Altered in T2DM with dyslipidemia [6] | Pro-inflammatory signaling |
| Phosphatidylinositol (PI) | One unspecified PI | Downregulated in DH [3] | Cell signaling, membrane trafficking |
Sphingolipids
Sphingolipids, characterized by a sphingoid base backbone, include diverse subclasses such as ceramides (Cer), sphingomyelins (SM), and sphingosine-1-phosphate (So1P). These lipids function not only as structural membrane components but also as potent signaling molecules that influence insulin sensitivity, apoptosis, and inflammatory responses [14] [15].
Research has demonstrated that sphingolipid metabolism is profoundly dysregulated in type 2 diabetes. In a study of 245 participants, sphingosine-1-phosphate (So1P) levels were highest in healthy controls and gradually decreased as the disease progressed to pre-diabetes and overt T2DM [15]. Other sphingolipids, including glucosylceramide (GluCer), sphingomyelin (SM), sphinganine (Sa), and sphingosine (So), exhibited a 'U'-shaped change during diabetes progression, decreasing in pre-diabetes and rising again in established T2DM [15]. Notably, So1P and Sa were identified as significant predictors of cardiovascular complications in diabetic patients [15].
In newly diagnosed T2DM patients with dyslipidemia, specific sphingolipids including Cer(d18:1/24:0), SM(d18:1/24:0), SM(d18:1/16:1), SM(d18:1/24:1), and SM(d18:2/24:1) were identified as essential potential biomarkers strongly correlated with clinical parameters [6]. These molecules were associated with the sphingolipid metabolism pathway, which was recognized as highly relevant to glucose and lipid metabolism changes in T2DM [6].
Figure 1: Sphingolipid Metabolism Pathway. Key enzymes: SPT (serine palmitoyltransferase), CerS (ceramide synthase), GCS (glucosylceramide synthase), SphK (sphingosine kinase). Ceramide and sphingomyelin accumulation (red) is associated with insulin resistance, while decreased S1P (yellow) correlates with diabetes progression and cardiovascular complications [15].
UHPLC-MS/MS Methodologies for Lipidomic Analysis
Sample Preparation Protocols
Proper sample preparation is critical for reliable lipidomic analysis. Based on recent studies, the following protocols have been employed for plasma/serum sample processing:
Plasma Sample Preparation (from [3]):
- Collect 5 mL of fasting blood and centrifuge at 3,000 rpm for 10 minutes at room temperature
- Aliquot 0.2 mL of upper plasma layer into 1.5 mL centrifuge tubes
- Store at -80°C until analysis
- Thaw samples on ice and vortex
- Aliquot 100 μL into a 1.5 mL centrifuge tube
- Add 200 μL of 4°C water and mix
- Add 240 μL of pre-cooled methanol and mix
- Add 800 μL of methyl tert-butyl ether (MTBE) and mix
- Sonicate for 20 minutes in a low-temperature water bath
- Let stand at room temperature for 30 minutes
- Centrifuge at 14,000 g for 15 minutes at 10°C
- Collect upper organic phase and dry under nitrogen
Serum Sample Preparation (from [16]):
- Collect blood after overnight fast and centrifuge at 3,000 rpm at 4°C for 10 minutes
- Aliquot 50 μL of serum
- Mix with 50 μL methanol and 250 μL methyl tert-butyl ether
- Vortex for 1 minute
- Centrifuge at 12,000 rpm for 20 minutes
- Collect 200 μL supernatant and dry using vacuum freeze-drying equipment
- Reconstitute in 100 μL of isopropyl alcohol-acetonitrile-water (2:1:1) solution
- Centrifuge at 12,000 rpm for 10 minutes and collect supernatant for UHPLC-MS analysis
UHPLC-MS/MS Analytical Conditions
Chromatographic Conditions (from [3] and [16]):
- System: Ultra-high performance liquid chromatography (UHPLC) system
- Column: Waters ACQUITY UPLC BEH C18 column (2.1 mm i.d. × 100 mm length, 1.7 μm particle size) [3] or ACQUITY BEH C8 column (100 mm × 2.1 mm, 1.7 μm) [16]
- Column Temperature: 40°C [16]
- Mobile Phase A: 10 mM ammonium formate acetonitrile solution in water [3] or methanol-acetonitrile-water (1:1:1) solution containing 5 mmol/L ammonium acetate [16]
- Mobile Phase B: 10 mM ammonium formate acetonitrile isopropanol solution [3] or isopropanol solution containing 5 mmol/L ammonium acetate [16]
- Gradient Program (from [16]):
- Start at 80% A
- Linearly decrease to 60% A over 2.5 minutes
- Hold at 60% A for 1.5 minutes
- Linearly decrease to 10% A over 14 minutes
- Hold for 1 minute
- Increase to 80% A for 0.1 minute and hold for 1.9 minutes
- Flow Rate: 0.30 mL/min [16]
- Injection Volume: 4 μL for all samples [16]
Mass Spectrometric Conditions (from [16]):
- System: AB SCIEX Triple TOF 5500 mass analyzer with information-dependent acquisition (IDA)
- Ion Spray Voltage: +5500 V (positive mode) and -4500 V (negative mode)
- Gas 1: 50 psi
- Gas 2: 55 psi
- Curtain Gas: 25 psi
- Drying Temperature: 500°C
- Collision-activated dissociation (CAD): Set as medium
Figure 2: UHPLC-MS/MS Lipidomics Workflow. The process encompasses sample collection through pathway analysis, with critical separation and detection steps (yellow) and complex data analysis phases (red) [3] [16].
Metabolic Pathways and Biological Significance
The dysregulated lipid classes discussed interact in complex metabolic networks that contribute to the pathophysiology of diabetes and hyperuricemia. Lipidomic studies have identified several key pathways that are significantly perturbed in these conditions.
In diabetes mellitus combined with hyperuricemia (DH), glycerophospholipid metabolism (impact value: 0.199) and glycerolipid metabolism (impact value: 0.014) were identified as the most significantly perturbed pathways [3]. These findings were consistent across comparisons between DH, DM, and healthy control groups, underscoring their central role in the pathophysiology of hyperuricemia complicating diabetes.
In proliferative diabetic retinopathy, a major complication of diabetes, sphingolipid metabolism was significantly enriched among the altered metabolic pathways, along with sulfur metabolism and cysteine and methionine metabolism [17]. This highlights the involvement of sphingolipids in diabetic microvascular complications.
For newly diagnosed type 2 diabetes with dyslipidemia, sphingolipid metabolism and glycerophospholipid metabolism were identified as the most relevant pathways to glucose and lipid metabolism changes [6]. The interconnected nature of these pathways creates a complex metabolic network that drives disease progression and complication development.
Table 3: Key Dysregulated Metabolic Pathways in Diabetes and Hyperuricemia
| Metabolic Pathway | Impact Value/ Significance | Associated Lipid Classes | Biological Consequences |
|---|---|---|---|
| Glycerophospholipid metabolism | Impact value: 0.199 in DH [3] | Phosphatidylcholines, Phosphatidylethanolamines, Phosphatidylinositols | Membrane dysfunction, altered cell signaling |
| Glycerolipid metabolism | Impact value: 0.014 in DH [3] | Triglycerides, Diglycerides | Energy metabolism dysregulation, lipid storage |
| Sphingolipid metabolism | Significantly enriched in PDR [17] | Ceramides, Sphingomyelins, Sphingosine-1-phosphate | Insulin resistance, apoptosis, inflammation |
The Scientist's Toolkit: Research Reagent Solutions
Table 4: Essential Research Reagents for Lipidomic Studies in Diabetes and Hyperuricemia
| Reagent/Category | Specific Examples | Function/Application |
|---|---|---|
| Chromatography Columns | Waters ACQUITY UPLC BEH C18 column (2.1 × 100 mm, 1.7 μm) [3], ACQUITY BEH C8 column (100 × 2.1 mm, 1.7 μm) [16] | Lipid separation based on hydrophobicity |
| Mobile Phase Additives | Ammonium formate [3], Ammonium acetate [16] | Enhance ionization efficiency in MS |
| Lipid Extraction Solvents | Methyl tert-butyl ether (MTBE) [3] [16], Methanol, Isopropyl alcohol [16] | Lipid extraction from biological samples |
| Mass Spectrometry Standards | Not specified in results, but internal standards for each lipid class are recommended | Quantification and quality control |
| Data Analysis Software | MetaboAnalyst 5.0 [3] [16], GraphPad Prism [16] | Statistical analysis, pathway mapping, visualization |
UHPLC-MS/MS-based lipidomic analysis has revealed systematic dysregulation of triglycerides, glycerophospholipids, and sphingolipids in diabetes and hyperuricemia. The distinct patterns of alteration in specific lipid subspecies within these classes provide greater insights into disease mechanisms than traditional lipid measurements. The consistency of findings across multiple studies—particularly the perturbations in glycerophospholipid, glycerolipid, and sphingolipid metabolism pathways—highlights their fundamental role in disease pathophysiology.
The translational potential of these findings is significant, with specific lipid species emerging as promising biomarkers for early detection, risk stratification, and monitoring of diabetes, hyperuricemia, and their complications. However, challenges remain in standardizing methodologies, validating findings across diverse populations, and translating lipidomic signatures into clinical practice. Future research should focus on addressing these challenges while further elucidating the complex relationships between lipid dysregulation and metabolic disease progression.
Lipidomics, a specialized branch of metabolomics, provides a comprehensive analysis of lipid molecules within biological systems, enabling the characterization of specific lipid disruptions in metabolic diseases [12]. In the context of diabetes mellitus (DM) and hyperuricemia (HUA)—two prevalent and often co-occurring metabolic disorders—lipidomic profiling using advanced technologies like UHPLC-MS/MS has revealed significant alterations in core metabolic pathways, particularly glycerophospholipid and glycerolipid metabolism [3]. These pathways are crucial for maintaining cellular membrane integrity, energy storage, and signaling processes. Their dysregulation offers critical insights into the pathophysiology of these conditions and presents opportunities for biomarker discovery. This whitepaper provides an in-depth technical examination of these pathways, framed within contemporary lipidomics research on diabetes and hyperuricemia, and details the experimental methodologies used to investigate them.
Pathway Biochemistry and Physiological Context
Glycerophospholipid Metabolism
Glycerophospholipids are glycerol-based phospholipids that serve as the main structural component of biological membranes in eukaryotic cells [18]. Their amphipathic nature—featuring a hydrophilic polar head group and two hydrophobic fatty acyl chains—drives the formation of the lipid bilayer [18]. The metabolism of glycerophospholipids begins with the acylation of glycerol-3-phosphate to form lysophosphatidic acid (LPA), which is subsequently acylated to phosphatidic acid (PA) [18]. PA is a key intermediate that can be dephosphorylated to diacylglycerol (DAG), a precursor for the synthesis of major species such as phosphatidylcholine (PC) and phosphatidylethanolamine (PE) via the Kennedy pathway [18]. Beyond their structural role, glycerophospholipids are reservoirs for second messengers, including DAG, phosphatidic acid, and arachidonic acid derivatives, which are involved in signal transduction, apoptosis, and modulation of transporter and enzyme activities [18].
Glycerolipid Metabolism
The glycerolipid metabolism pathway primarily centers on the biosynthesis and degradation of triacylglycerols (TGs) and their precursors [19]. The core biosynthesis module (M00089) involves the sequential acylation of the glycerol backbone to form TGs, which serve as the body's principal energy storage molecules in adipose tissue [19]. The degradation module (M00098) encompasses the breakdown of acylglycerols, releasing fatty acids and glycerol for energy production or further metabolic processing. Dysregulation of this pathway, particularly the excessive accumulation of TGs, is a hallmark of dyslipidemia, which frequently accompanies insulin resistance and type 2 diabetes [20].
Lipidomic Alterations in Diabetes and Hyperuricemia
Ultra-high performance liquid chromatography-tandem mass spectrometry (UHPLC-MS/MS) based lipidomics has identified distinct perturbations in glycerophospholipid and glycerolipid metabolites in patients with diabetes mellitus (DM), hyperuricemia (HUA), and their co-occurrence (DH).
Table 1: Significantly Altered Lipid Metabolites in Metabolic Disorders
| Lipid Class | Specific Metabolites | Trend in DH vs NGT | Trend in DH vs DM | Biological Relevance |
|---|---|---|---|---|
| Triglycerides (TGs) | TG(16:0/18:1/18:2) and 12 other TGs | Significantly Upregulated [3] | Not Specified | Energy storage; Elevated levels indicate dyslipidemia [3] |
| Phosphatidylethanolamines (PEs) | PE(18:0/20:4) and 9 other PEs | Significantly Upregulated [3] | Not Specified | Membrane structure; Source of signaling precursors [3] |
| Phosphatidylcholines (PCs) | PC(36:1) and 6 other PCs | Significantly Upregulated [3] | Not Specified | Major membrane phospholipid; precursor for signaling molecules [3] |
| Phosphatidylinositol (PI) | Not Specified | Downregulated [3] | Not Specified | Signaling lipid; involved in insulin signaling pathways [3] |
| Sphingomyelins (SMs) | SM(d18:1/24:0), SM(d18:1/16:1) | Not Reported in DH | Not Reported in DH | Membrane integrity; Ceramide precursors; associated with T2DM dyslipidemia [20] |
| Ceramides (Cer) | Cer(d18:1/24:0) | Not Reported in DH | Not Reported in DH | Signaling lipids implicated in insulin resistance [20] |
A study on patients with diabetes and hyperuricemia (DH) identified 1,361 lipid molecules and found 31 to be significantly altered compared to healthy controls (NGT). The dyslipidemia was characterized by a pronounced upregulation of 13 TGs, 10 PEs, and 7 PCs, alongside a downregulation of one PI [3]. Multivariate analyses confirmed a distinct lipidomic profile separating the DH, DM, and NGT groups [3]. Furthermore, the comparison between DH and DM groups identified 12 differential lipids, underscoring a unique lipid signature for the comorbid condition [3].
Independent research on type 2 diabetes with dyslipidemia (NDDD) has reinforced the centrality of these pathways, identifying significant changes in lipid species including lysophosphatidylcholine (LysoPC), PC, PE, sphingomyelin (SM), and ceramide (Cer) [20]. The study highlighted sphingolipid metabolism and glycerophospholipid metabolism as the most relevant pathways disturbed in the context of both glucose and lipid metabolism dysregulation [20].
Table 2: Enriched Metabolic Pathways and Associated Biomarkers
| Metabolic Pathway | Impact Value / Relevance | Key Associated Biomarkers | Related Clinical Conditions |
|---|---|---|---|
| Glycerophospholipid Metabolism | Impact: 0.199 (Most significant in DH) [3] | PC, PE, LysoPC [3] [20] | DH [3], T2DM with Dyslipidemia [20], HUA [10] |
| Glycerolipid Metabolism | Impact: 0.014 (Significant in DH) [3] | TG, DAG [3] | DH [3] |
| Sphingolipid Metabolism | Considered most relevant [20] | Cer(d18:1/24:0), SM(d18:1/24:0) [20] | T2DM with Dyslipidemia [20] |
| Arachidonic Acid Metabolism | Involved [10] | Metabolites of Arachidonic Acid [10] | HUA [10] |
| GPI-Anchor Biosynthesis | Involved [10] | Not Specified | HUA [10] |
Pathway enrichment analysis using the MetaboAnalyst 5.0 platform on data from the DH study revealed that the differential lipids were predominantly enriched in glycerophospholipid metabolism (impact value of 0.199) and glycerolipid metabolism (impact value of 0.014), confirming these as the most significantly perturbed pathways in the comorbid condition [3]. This finding is consistent with other studies showing that glycerophospholipid metabolism is also a key disrupted pathway in hyperuricemia alone, where it is linked to altered levels of immune factors such as IL-6, TGF-β1, and CPT1 [10].
Experimental Workflow for UHPLC-MS/MS Lipidomics
The following diagram and subsequent sections detail the standard experimental protocol for an untargeted lipidomic analysis of plasma samples, as utilized in the cited research.
Diagram 1: Lipidomics Experimental Workflow
Sample Collection and Preparation
- Study Population: Participants are typically recruited based on well-defined diagnostic criteria (e.g., ADA guidelines for diabetes, uric acid levels >420 μmol/L in men for HUA). Age and sex matching with healthy controls is critical. Exclusion criteria often include the use of hypoglycemic, lipid-lowering, or urate-lowering drugs, as well as the presence of other conditions like gout, renal disease, or cancer [3] [20].
- Plasma Collection: Fasting blood samples (e.g., 5 mL) are collected into appropriate anticoagulant tubes. The samples are centrifuged (e.g., 3,000 rpm for 10 min at room temperature) to separate plasma, which is then aliquoted and stored at -80°C until analysis [3] [10].
- Lipid Extraction: The methyl tert-butyl ether (MTBE) method is widely used. A typical protocol involves:
- Thawing plasma samples on ice.
- Vortexing and aliquoting 100 μL of plasma into a tube.
- Adding 200 μL of ice-cold water and 240 μL of pre-cooled methanol.
- Adding 800 μL of MTBE, followed by sonication in a low-temperature water bath for 20 minutes and standing at room temperature for 30 minutes.
- Centrifuging at 14,000 g at 10°C for 15 minutes to achieve phase separation.
- Collecting the upper organic phase and drying it under a gentle stream of nitrogen.
- Reconstituting the dried lipid extract in a suitable solvent (e.g., 90% isopropanol/acetonitrile) for LC-MS injection [3] [10].
- Quality Control (QC): Pooled QC samples are prepared by combining equal volumes of all study samples. These QC samples are injected at regular intervals throughout the analytical run to monitor instrument stability and data quality [3] [20].
UHPLC-MS/MS Analytical Conditions
The following table summarizes the core components of the UHPLC-MS/MS setup as described in the research.
Table 3: Research Reagent Solutions and Key Materials
| Item | Typical Specification / Brand | Function in Protocol |
|---|---|---|
| Chromatography Column | Waters ACQUITY UPLC BEH C18 (2.1 x 100 mm, 1.7 μm) [3] | Separation of complex lipid mixtures |
| Mobile Phase A | 10 mM ammonium formate in acetonitrile/water (e.g., 60:40, v/v) [3] [20] | Aqueous-organic phase for gradient elution |
| Mobile Phase B | 10 mM ammonium formate in acetonitrile/isopropanol (e.g., 10:90, v/v) [3] [20] | Strong organic phase for gradient elution |
| Mass Spectrometer | Q-Exactive Plus (Thermo Scientific) [20] | High-resolution mass detection and fragmentation |
| Ionization Source | Electrospray Ionization (ESI) | Soft ionization of lipid molecules |
| Lipid Extraction Solvent | Methyl tert-butyl ether (MTBE) [3] [10] | Liquid-liquid extraction of lipids from plasma |
| Data Analysis Software | MS DIAL, Lipostar, XCMS [12] | Peak picking, alignment, and lipid identification |
- Chromatographic Conditions: Lipid separation is achieved using a reverse-phase UHPLC system. A typical gradient for a C18 column involves starting at 30% mobile phase B, ramping to 100% B over 20-25 minutes, holding, and then re-equilibrating to the initial conditions. The flow rate is maintained around 300 μL/min, and the column temperature is kept at 45-55°C [3] [20] [10].
- Mass Spectrometric Conditions: Data are acquired in both positive and negative ionization modes to maximize lipid coverage. Key parameters for a Q-Exactive Plus instrument include:
- Sheath Gas Flow: 45 arb
- Aux Gas Flow: 15 arb
- Spray Voltage: 3.0 kV (positive), 2.5 kV (negative)
- Capillary Temperature: 350°C
- Scan Range: 200-1800 m/z
- Resolution: 70,000 for MS1, 17,500 for MS/MS [20] [10]. Data-Dependent Acquisition (DDA) is commonly employed, where the top N most intense ions from the MS1 scan are selected for fragmentation to generate MS/MS spectra for lipid identification.
Data Processing and Statistical Analysis
- Lipid Identification and Quantification: Raw data are processed using software platforms (e.g., MS DIAL, Lipostar) for peak picking, alignment, and deconvolution. Lipids are identified by matching the accurate mass of the precursor ion (MS1) and its fragmentation spectrum (MS/MS) against theoretical spectra in lipid databases [12].
- Multivariate Statistical Analysis: Processed data are subjected to:
- Principal Component Analysis (PCA): An unsupervised method to visualize overall clustering and outliers among sample groups.
- Orthogonal Partial Least Squares-Discriminant Analysis (OPLS-DA): A supervised method to maximize separation between predefined groups and identify lipids that contribute most to the separation [3] [20].
- Differential Analysis and Pathway Mapping: Lipids with a combination of a statistically significant p-value (e.g., < 0.05 from Student's t-test), a large fold-change (FC > 2 or < 0.5), and a high variable importance in projection (VIP) score from OPLS-DA (>1.0) are considered differential lipids [3] [20]. These lipids are then input into pathway analysis tools like MetaboAnalyst 5.0 to identify enriched metabolic pathways based on database references such as KEGG [3].
Integrated Pathway Diagram
The diagram below synthesizes the core interactions between the glycerophospholipid and glycerolipid metabolism pathways and highlights the key lipid species found to be altered in diabetes and hyperuricemia research.
Diagram 2: Core Glycerolipid/Glycerophospholipid Pathways
Discussion and Future Perspectives
The consistent identification of glycerophospholipid and glycerolipid metabolism as central pathways in diabetes, hyperuricemia, and their comorbidity underscores a profound lipidic component to these diseases. The upregulation of TGs aligns with clinical observations of dyslipidemia, while the distinct shifts in specific PC, PE, and PI species suggest more nuanced disruptions in membrane dynamics and cell signaling that may contribute to insulin resistance, inflammation, and cellular dysfunction [3] [20] [18]. The lipidomic signatures uncovered through UHPLC-MS/MS hold significant promise as panels of biomarkers for early detection, risk stratification, and monitoring of disease progression and therapeutic intervention [20] [12].
Future research directions should focus on the multi-omics integration of lipidomic data with genomics and proteomics to build a more comprehensive network of pathogenic mechanisms [12]. Furthermore, large-scale, multi-center validation studies are essential to standardize methodologies and translate these lipid biomarkers from research tools into clinically applicable diagnostics [12]. As lipidomics technologies continue to advance and bioinformatic tools become more sophisticated, the depth of our understanding of these critical metabolic pathways will undoubtedly expand, opening new avenues for targeted therapies and personalized medicine in metabolic disease.
Connecting Lipid Dysregulation to Pathophysiology and Comorbidities
Lipid dysregulation represents a core pathological event in a spectrum of metabolic diseases, contributing significantly to organ damage and the progression of comorbidities. The intricate relationship between disordered lipid metabolism and disease is particularly evident in the common coexistence of diabetes mellitus (DM) and hyperuricemia (HUA), where lipid abnormalities exacerbate the risk of cardiovascular, renal, and other diabetic complications. Advanced lipidomic technologies, specifically ultra-high performance liquid chromatography-tandem mass spectrometry (UHPLC-MS/MS), are uncovering the specific lipid species and pathways involved. This whitepaper details how lipid dysregulation drives pathophysiology in conditions like diabetes and hyperuricemia, summarizes key experimental findings in a structured format, and provides detailed methodologies for lipidomic analysis, serving as a technical guide for researchers and drug development professionals.
Pathophysiological Mechanisms and Comorbidities
The Diabetes-Hyperuricemia Metabolic Crosstalk
The coexistence of diabetes and hyperuricemia is synergistic, creating a vicious cycle of metabolic dysregulation. This comorbidity exacerbates damage to vital organs, particularly the cardiovascular system and kidneys [21]. Key mechanisms include:
- Insulin Resistance: Hyperuricemia contributes to insulin resistance and pancreatic β-cell apoptosis, which in turn worsens glycemic control [21].
- Oxidative Stress and Inflammation: Elevated uric acid levels promote oxidative stress and inflammatory pathways, aggravating diabetic complications such as cardiomyopathy, nephropathy, and retinopathy [21].
- Lipid Dysregulation as a Common Link: Both disorders are independently and collectively associated with profound abnormalities in lipid metabolism, which underpin much of the shared pathophysiology [3] [22].
Core Lipid Pathways in Disease
Lipidomics studies have identified several key metabolic pathways that are consistently perturbed in metabolic diseases:
- Glycerophospholipid Metabolism: This pathway is significantly altered in patients with combined diabetes and hyperuricemia (DH), with an impact value of 0.199, making it one of the most significantly disturbed pathways [3].
- Glycerolipid Metabolism: Also highly relevant in DH patients, this pathway shows an impact value of 0.014 [3].
- Sphingolipid Metabolism: Ceramides, a class of sphingolipids, are significantly elevated in various pathological states and are associated with insulin resistance, inflammation, and apoptosis. In depression, which exhibits comorbidity with metabolic disorders, elevated ceramides activate the NLRP3 inflammasome, triggering cytokine release and contributing to neurotoxicity [23].
Table 1: Key Lipid Classes and Their Pathophysiological Roles
| Lipid Class | Change in Disease | Pathophysiological Role | Associated Conditions |
|---|---|---|---|
| Triglycerides (TGs) | Upregulated | Energy storage; source of pro-inflammatory free fatty acids | DM, HUA, CVD, MDD [3] [23] |
| Phosphatidylethanolamines (PEs) | Upregulated | Membrane integrity; source of pro-inflammatory signaling lipids | DH, MDD [3] [23] |
| Phosphatidylcholines (PCs) | Upregulated/Downregulated (varies by species) | Membrane integrity; precursor to pro-inflammatory mediators | DH, MDD, CVD [3] [23] |
| Ceramides (Cer) | Upregulated | Promote insulin resistance, inflammation, and apoptosis | MDD, DM, CVD [23] |
| Lysophospholipids (e.g., LPC) | Upregulated | Promote monocyte migration and pro-inflammatory cytokine production | MDD [23] |
The diagram below illustrates the core pathological mechanisms linking lipid dysregulation to inflammation and organ damage in cardiometabolic and neurodegenerative diseases.
Remnant Cholesterol as a Novel Biomarker
Beyond specific lipid species, remnant cholesterol (RC)—the cholesterol content in triglyceride-rich lipoproteins—has emerged as a significant biomarker. In type 2 diabetes, elevated RC levels show a strong, independent positive correlation with hyperuricemia. The area under the ROC curve (AUC) for RC in predicting HUA was 0.658, which was larger than those for LDL-C, TG, HDL-C, and TC, indicating its superior predictability [22]. This correlation is likely mediated through RC's association with low-grade inflammation and insulin resistance [22].
Table 2: Key Lipid Biomarkers in Diabetes and Hyperuricemia
| Biomarker | Association/Change | Statistical Significance | Clinical/Pathological Relevance |
|---|---|---|---|
| Remnant Cholesterol (RC) | Positive correlation with HUA in T2DM | OR = 1.63, 95% CI: 1.40–1.90; AUC = 0.658 [22] | Better predictor of HUA than conventional lipids; linked to inflammation |
| TG (16:0/18:1/18:2) | Significantly upregulated in DH vs. NGT | P < 0.05 [3] | Representative of dysregulated glycerolipid metabolism |
| PE (18:0/20:4) | Significantly upregulated in DH vs. NGT | P < 0.05 [3] | Involved in glycerophospholipid metabolism pathway disruption |
| Total Differential Lipids (DH vs. NGT) | 31 significant lipid metabolites | P < 0.05 [3] | Includes 13 TGs, 10 PEs, 7 PCs, 1 downregulated PI |
UHPLC-MS/MS Methodologies for Lipidomic Analysis
The application of UHPLC-MS/MS is critical for the precise identification and quantification of lipid species in metabolic disease research. The following section outlines standard protocols and workflows.
Sample Collection and Pre-processing
The following protocol is adapted from a study investigating lipidomics in diabetes and hyperuricemia [3]:
- Collection: Collect fasting blood samples (e.g., 5 mL) into appropriate anticoagulant tubes.
- Plasma Separation: Centrifuge at 3,000 rpm for 10 minutes at room temperature.
- Aliquoting: Transfer the upper plasma layer (e.g., 0.2 mL) into pre-labeled microcentrifuge tubes.
- Pooled QC: Create quality control (QC) samples by combining equal volumes of plasma from all sample groups.
- Storage: Store all samples at -80°C until analysis.
- Thawing: Thaw samples on ice and vortex thoroughly.
- Lipid Extraction: For a 100 μL plasma sample:
- Add 200 μL of ice-cold water and mix.
- Add 240 μL of pre-cooled methanol and mix.
- Add 800 μL of methyl tert-butyl ether (MTBE) and mix.
- Sonicate in a low-temperature water bath for 20 minutes.
- Let the mixture stand at room temperature for 30 minutes.
- Centrifuge at 14,000 g for 15 minutes at 10°C.
- Organic Phase Collection: Collect the upper organic phase and dry under a gentle stream of nitrogen.
- Reconstitution: Reconstitute the dried lipid extract in a suitable solvent (e.g., 100 μL isopropanol) for UHPLC-MS/MS analysis.
UHPLC-MS/MS Instrumental Conditions
Chromatographic Conditions [3]:
- Column: Waters ACQUITY UPLC BEH C18 column (2.1 mm i.d. × 100 mm length, 1.7 μm particle size).
- Mobile Phase A: 10 mM ammonium formate in acetonitrile-water solution.
- Mobile Phase B: 10 mM ammonium formate in acetonitrile-isopropanol solution.
- Gradient: A specific gradient elution program is used for optimal lipid separation.
Mass Spectrometric Conditions: While parameters vary, a comprehensive targeted method for 260 signaling lipids (including oxylipins, free fatty acids, and lysophospholipids) demonstrates the capability of UHPLC-MS/MS. Such methods are validated for parameters including linearity, limit of detection (LOD), limit of quantification (LOQ), extraction recovery, matrix effect, and precision [24].
The typical workflow from sample to data is summarized below:
The Scientist's Toolkit: Essential Research Reagents and Materials
Table 3: Research Reagent Solutions for UHPLC-MS/MS Lipidomics
| Item/Category | Specific Examples | Function in Workflow |
|---|---|---|
| Chromatography Column | Waters ACQUITY UPLC BEH C18 (1.7 µm) | High-resolution separation of complex lipid mixtures prior to MS detection [3] |
| Lipid Extraction Solvent | Methyl tert-butyl ether (MTBE) | Organic solvent for liquid-liquid extraction, partitioning lipids from aqueous plasma samples [3] |
| Mass Spectrometry Standard | Deuterated Internal Standards (e.g., C15 Ceramide-d7, Stearic acid-d3) | Correct for matrix effects and variability in extraction efficiency; enable semi-quantification [25] |
| Mobile Phase Additive | Ammonium Formate | Volatile salt additive that improves ionization efficiency and aids in adduct formation (e.g., [M+NH4]+) in MS [3] |
| Quality Control Material | NIST Standard Reference Material 1950 | Pooled human plasma with certified/characterized values for inter-laboratory comparison and method validation [24] |
Lipid dysregulation is a cornerstone of pathophysiology in interconnected metabolic disorders such as diabetes and hyperuricemia. The specific upregulation of lipid classes like triglycerides, phosphatidylethanolamines, and ceramides, along with perturbations in glycerophospholipid and glycerolipid metabolism, drives disease progression through inflammation, oxidative stress, and insulin resistance. The integration of advanced UHPLC-MS/MS lipidomics is pivotal for discovering these detailed mechanistic links and identifying novel biomarkers like remnant cholesterol. For researchers and drug developers, a standardized approach encompassing rigorous sample preparation, robust UHPLC-MS/MS protocols, and sophisticated data analysis is essential to translate these lipidomic insights into targeted therapeutic strategies and diagnostic tools, ultimately enabling a more personalized approach to patient care.
From Sample to Spectrum: A Practical UHPLC-MS/MS Lipidomics Workflow
Lipidomics, a specialized branch of metabolomics, provides comprehensive analysis of lipid molecules within biological systems, offering profound insights into metabolic health and disease pathologies [12]. In the context of diabetes mellitus (DM) and hyperuricemia (HU), distinct lipidomic perturbations have been observed, revealing specific lipid signatures associated with these conditions [3]. Ultra-high-performance liquid chromatography-tandem mass spectrometry (UHPLC-MS/MS) has emerged as a powerful analytical platform for lipidomic profiling due to its superior sensitivity, resolution, and capacity to identify and quantify hundreds of lipid species simultaneously [2].
The reliability of any lipidomic study hinges critically on the pre-analytical phase, particularly sample collection and lipid extraction. Methyl tert-butyl ether (MTBE)-based extraction has gained prominence as a robust method for lipid recovery from plasma samples, offering several advantages over traditional chloroform-based methods [26] [27]. This technical guide provides an in-depth protocol for plasma collection and MTBE/methanol lipid extraction, contextualized within a research framework investigating lipidomic alterations in diabetes and hyperuricemia using UHPLC-MS/MS.
Plasma Collection and Pre-processing for Lipidomics
Proper collection and handling of plasma samples are paramount to preserving lipid integrity and ensuring analytically reproducible results.
Blood Collection and Processing
- Collection: Collect fasting blood samples (e.g., 5 mL) into appropriate anticoagulant tubes (e.g., lithium heparin or EDTA) [3] [28].
- Centrifugation: Centrifuge blood samples at 3,000 rpm (approximately 2,000 × g) for 10 minutes at room temperature to separate cellular components from plasma [3].
- Aliquoting: Carefully transfer the upper plasma layer into clean tubes. For lipidomics, creating pooled quality control (QC) samples by combining equal aliquots from multiple subjects is recommended to monitor analytical performance [3] [29].
- Storage: Immediately freeze plasma aliquots at -80°C until lipid extraction. Avoid multiple freeze-thaw cycles to prevent lipid degradation [3].
MTBE/Methanol Lipid Extraction Protocol
The MTBE method produces a biphasic system where lipids partition into the upper organic (MTBE) phase, while proteins and polar metabolites remain in the lower aqueous phase [26] [30]. This configuration allows for easy and quantitative recovery of the lipid-containing layer.
Detailed Step-by-Step Procedure
Table 1: Reagents and Equipment for MTBE Lipid Extraction
| Item | Specification/Function |
|---|---|
| Methanol (MeOH) | LC-MS grade, pre-cooled to 4°C |
| Methyl-tert-butyl ether (MTBE) | HPLC or LC-MS grade |
| Water | MS-grade or deionized, LC-MS grade |
| Ammonium Formate | For mobile phase preparation in LC-MS |
| Plasma Sample | Thawed on ice |
| Centrifuge Tubes | 1.5 mL or 2 mL microcentrifuge tubes |
| Centrifuge | Capable of ≥ 13,000 × g |
| Nitrogen Evaporator | For gentle solvent drying under nitrogen stream |
| Vortex Mixer & Sonicator | For thorough mixing and cell disruption |
The following protocol is adapted from established methodologies [3] [26] [30]:
- Thawing: Thaw frozen plasma samples on ice or in a refrigerator at 4°C. Vortex briefly to ensure homogeneity.
- Aliquot Plasma: Pipette 100 μL of plasma into a 1.5 mL or 2 mL microcentrifuge tube.
- Protein Precipitation: Add 200 μL of ice-cold methanol to the plasma aliquot.
- Vortex vigorously for 10-30 seconds to mix thoroughly. This step begins protein precipitation.
- Lipid Extraction: Add 800 μL of MTBE to the methanol-plasma mixture.
- Incubation: Incubate the mixture for 1 hour at room temperature in a shaker to facilitate complete lipid extraction [26] [30].
- Phase Separation: Add 300 μL of MS-grade water to induce phase separation [30].
- Collection of Lipid Fraction: Carefully collect the upper organic (MTBE) layer without disturbing the intermediate pellet or lower aqueous phase.
- Solvent Evaporation: Evaporate the MTBE solvent to dryness under a gentle stream of nitrogen gas in a fume hood.
- Reconstitution: Reconstitute the dried lipid extract in a suitable solvent for UHPLC-MS/MS analysis, typically 100 μL of isopropanol or a mixture of chloroform-methanol-isopropanol (e.g., 1:2:4, v/v/v) [26]. Vortex thoroughly to ensure complete dissolution.
Diagram 1: MTBE Lipid Extraction Workflow (Total ~2.5 hours)
Application in Diabetes and Hyperuricemia Research
The MTBE extraction protocol effectively captures the lipid perturbations characteristic of diabetes and hyperuricemia. Applied to a study comparing patients with diabetes mellitus (DM), diabetes combined with hyperuricemia (DH), and healthy controls (NGT), this method enabled the identification of significant lipidomic differences [3].
Table 2: Significantly Altered Lipid Classes in Diabetes Mellitus with Hyperuricemia (DH) vs. Healthy Controls (NGT) [3]
| Lipid Class | Number of Significant Lipids | Trend in DH | Examples of Altered Lipids |
|---|---|---|---|
| Triglycerides (TGs) | 13 | Significantly Upregulated | TG(16:0/18:1/18:2), etc. |
| Phosphatidylethanolamines (PEs) | 10 | Significantly Upregulated | PE(18:0/20:4), etc. |
| Phosphatidylcholines (PCs) | 7 | Significantly Upregulated | PC(36:1), etc. |
| Phosphatidylinositols (PIs) | 1 | Downregulated | - |
Multivariate statistical analyses like Principal Component Analysis (PCA) and Orthogonal Partial Least Squares-Discriminant Analysis (OPLS-DA) of the extracted lipid data revealed a clear separation trend among the DH, DM, and NGT groups, confirming distinct lipidomic profiles [3]. Pathway analysis further demonstrated that glycerophospholipid metabolism and glycerolipid metabolism were the most significantly perturbed pathways in patients with combined diabetes and hyperuricemia [3]. This lipidomic insight provides a metabolic basis for understanding the pathophysiology linking these two conditions.
Diagram 2: Research Context from Sample to Discovery
Comparative Performance and Considerations
The MTBE extraction method offers specific advantages for clinical lipidomics studies:
- High Lipid Recovery: Demonstrates similar or better recovery for most major lipid classes compared to traditional Folch or Bligh & Dyer methods [26].
- Practical Superiority: The upper organic phase is easier and safer to collect without disturbing the protein interphase, minimizing contamination [26] [27]. MTBE is also less toxic and hazardous than chloroform [26].
- Automation Compatibility: The protocol is amenable to automation using pipetting robots, enhancing throughput and reproducibility for large-scale clinical studies [30].
The Scientist's Toolkit
Table 3: Essential Research Reagent Solutions for UHPLC-MS/MS Lipidomics
| Reagent/Standard | Function/Application | Example Specification |
|---|---|---|
| SPLASH LIPIDOMIX | Quantification of diverse lipid classes via stable isotope-labeled internal standards | Pre-mixed solution from Avanti Polar Lipids [27] |
| Ammonium Formate | Mobile phase additive for LC-MS; improves ionization and separation | LC-MS grade, 2-10 mM in water [3] [31] |
| UHPLC Columns | Chromatographic separation of complex lipid mixtures | e.g., Waters ACQUITY UPLC BEH C18 or HSS T3 columns [3] [31] |
| MTBE & Methanol | Primary solvents for lipid extraction; high purity critical | HPLC or LC-MS grade [26] [2] |
Ultra-High-Performance Liquid Chromatography (UHPLC) has become an indispensable tool in modern lipidomics, particularly in the study of complex metabolic diseases such as diabetes mellitus (DM) and diabetes mellitus combined with hyperuricemia (DH). The superior speed, resolution, and sensitivity of UHPLC compared to traditional HPLC make it ideally suited for unraveling the intricate lipid alterations characteristic of these conditions [32] [33]. Within the context of a broader thesis on UHPLC-MS/MS lipidomic analysis in diabetes and hyperuricemia research, chromatography optimization is not merely a technical exercise but a fundamental requirement for generating biologically meaningful data.
The analysis of lipidomes in metabolic disorders presents unique challenges. Lipidomic studies in patients with DM and DH have revealed significant alterations in glycerophospholipid and glycerolipid metabolism pathways [32]. These lipid classes encompass hundreds of molecular species with subtle structural differences, requiring chromatographic methods capable of high-resolution separations. The complexity of biological samples, containing diverse biomolecules with varying physicochemical properties, can lead to matrix effects and ion suppression, potentially masking critical lipid biomarkers [33]. Furthermore, the need for high-throughput analysis in large-scale epidemiological cohorts demands methods that balance comprehensive lipid coverage with reasonable analysis times [34].
This technical guide provides a comprehensive overview of UHPLC optimization strategies specifically tailored for complex lipid separation in diabetes and hyperuricemia research. By integrating fundamental chromatographic principles with practical application guidelines, we aim to empower researchers to develop robust, reproducible, and informative lipidomic methods that can advance our understanding of the lipid basis of metabolic diseases.
Fundamental Principles of Lipid Separation by UHPLC
Chromatographic Basis for Lipid Class and Molecular Species Separation
The separation of lipids using UHPLC relies on the differential partitioning of lipid molecules between a stationary phase and a mobile phase. The two predominant separation mechanisms employed in lipidomics are reversed-phase (RP) and hydrophilic interaction liquid chromatography (HILIC). RP-UHPLC, typically using C18 columns, separates lipids primarily based on their hydrophobicity, which is determined by acyl chain length, degree of unsaturation, and the number of acyl chains [2] [1]. This results in lipids eluting generally in order of increasing carbon number and decreasing double bonds within each lipid class.
HILIC separation, in contrast, operates on a different principle where lipids are separated based on the polarity of their head groups [35]. In HILIC mode, lipids from the same class elute together, which can minimize class-specific matrix effects and simplify data interpretation. The choice between these separation mechanisms depends on the specific research questions. For instance, when studying molecular species-level alterations in glycerophospholipids in diabetic patients, RP-UHPLC provides superior resolution, while HILIC may be preferable for class-level profiling [35].
The structural diversity of lipids necessitates careful optimization of chromatographic conditions to achieve optimal separation. For example, in diabetes and hyperuricemia research, the ability to resolve triglycerides (TGs), phosphatidylcholines (PCs), and phosphatidylethanolamines (PEs) – lipid classes frequently dysregulated in these conditions – is particularly important [32]. The presence of the vinyl ether bond in plasmalogens, which have antioxidant properties potentially relevant to oxidative stress in diabetes, further complicates separations and requires specific consideration [1].
Column Chemistry and Particle Technology
The selection of appropriate column chemistry is paramount for successful lipid separations. The majority of RP-UHPLC lipid analyses employ C18 columns with 1.7-2.0 μm particles, which provide an optimal balance of efficiency, pressure, and robustness [2] [1]. The particle technology significantly impacts separation efficiency, with sub-2μm particles being the standard for UHPLC applications, offering higher peak capacities and faster separations compared to conventional HPLC columns [33].
The column dimensions also play a crucial role in method performance. While 100-150 mm × 2.1 mm columns are common, longer columns can provide higher peak capacities for complex samples at the expense of analysis time and operating pressure [36]. The column temperature must be carefully optimized, as elevated temperatures (typically 40-60°C) enhance mass transfer and reduce mobile phase viscosity, leading to improved peak shapes, especially for late-eluting lipids like triglycerides and cholesteryl esters [1].
For specialized applications, alternative stationary phases may be beneficial. For instance, C8 columns can provide shorter analysis times for more polar lipids, while phenyl-hexyl columns offer different selectivity for lipids containing double bonds. In the context of diabetes and hyperuricemia research, where comprehensive lipid profiling is often desired, C18 columns generally provide the best compromise for broad lipid coverage [2].
Critical UHPLC Method Parameters and Optimization Strategies
Mobile Phase Composition and Gradient Optimization
The mobile phase system is a critical determinant of lipid separation efficiency and MS detection sensitivity. Typically, binary solvent systems are employed, consisting of water (aqueous phase) and organic solvents (organic phase). The aqueous phase often contains additives such as ammonium acetate (5-10 mM) or ammonium formate to enhance ionization efficiency and stabilize pH [2] [1]. The organic phase is commonly composed of acetonitrile, isopropanol, or mixtures thereof, with isopropanol being particularly effective for eluting very nonpolar lipids like triglycerides and cholesteryl esters [1].
Table 1: Mobile Phase Systems for Lipid Separation in UHPLC-MS/MS
| Component | Composition A (Aqueous) | Composition B (Organic) | Additives & Functions |
|---|---|---|---|
| Solvent | Water | Acetonitrile:Isopropanol (1:1) | - |
| Additives | 10 mM ammonium formate | 10 mM ammonium formate | Enhance ionization, adduct formation |
| Modifiers | 0.1% formic acid (optional) | 0.1% formic acid (optional) | Promote [M+H]+ formation in positive mode |
| Alternative | 10 mM ammonium acetate | Acetonitrile:Isopropanol (9:1) | - |
Gradient optimization is perhaps the most impactful parameter for controlling lipid separations. A well-designed gradient should provide adequate resolution of critical lipid pairs while maintaining reasonable analysis times. For comprehensive lipidomics, multi-segment gradients are often employed, starting with a high percentage of aqueous phase to retain polar lipids, followed by a shallow gradient segment to separate phospholipids, and a steeper segment to elute neutral lipids [1] [36]. The gradient profile must be optimized based on the specific lipid classes of interest. For diabetes and hyperuricemia research, where glycerophospholipids and glycerolipids are particularly relevant, gradients should be tailored to resolve these classes effectively [32].
Instrumental Parameters and Their Impact
The UHPLC system itself contributes significantly to method performance. Operating pressures in UHPLC typically range from 6000-15,000 psi, enabling the use of columns packed with sub-2μm particles [33] [36]. Flow rates generally fall between 0.2-0.6 mL/min for 2.1 mm id columns, balancing separation efficiency with analysis time. Lower flow rates can improve ionization efficiency in ESI-MS but extend analysis time, necessitating careful optimization based on research priorities.
Injection volume is another critical parameter, typically ranging from 1-10 μL, depending on column dimensions and detection sensitivity requirements. Partial loop injection or needle-overfill techniques can enhance injection precision [36]. The autosampler temperature should be maintained at 4-10°C to ensure sample integrity during analysis, particularly for large sample batches [34].
The column temperature significantly affects lipid separations, with elevated temperatures (40-60°C) generally improving peak shapes, especially for later-eluting neutral lipids. Temperature control also enhances retention time reproducibility, which is crucial for large-scale studies in diabetes and hyperuricemia research where hundreds of samples may be analyzed [1].
Table 2: Optimized UHPLC Conditions for Comprehensive Lipidomics
| Parameter | Recommended Setting | Alternative/Notes |
|---|---|---|
| Column | Waters ACQUITY UPLC BEH C18 (100 mm × 2.1 mm, 1.7 μm) | Equivalent C18 columns from other manufacturers |
| Temperature | 50°C | 40-60°C range acceptable; higher temperature for better TG elution |
| Flow Rate | 0.400 mL/min | 0.2-0.6 mL/min depending on column dimensions |
| Injection Volume | 2.0 μL (for 2.1 mm id column) | 1-10 μL depending on sensitivity needs |
| Gradient Time | 12-20 min | Longer gradients for higher complexity samples |
| Mobile Phase | A: 10 mM ammonium formate in water; B: 10 mM ammonium formate in ACN:IPA (1:1) | Ammonium acetate as alternative buffer |
UHPLC Method Development for Diabetes and Hyperuricemia Lipidomics
Sample Preparation Considerations for Complex Biological Matrices
Robust sample preparation is a prerequisite for successful UHPLC analysis of lipids from biological samples. The choice of extraction method significantly impacts lipid recovery, coverage, and matrix effects. For plasma/serum samples – common in diabetes and hyperuricemia research – the modified Matyash (MTBE/methanol/water) or Folch (chloroform/methanol/water) methods are widely employed [32] [34]. These liquid-liquid extraction approaches provide comprehensive lipid coverage and effectively remove water-soluble contaminants.
For high-throughput applications, such as large cohort studies in metabolic diseases, protein precipitation-based methods in 96-well plate format offer significant advantages [34]. When optimizing sample preparation for diabetes and hyperuricemia research, consider that lipid alterations in these conditions span multiple classes, including triglycerides, phosphatidylcholines, and phosphatidylethanolamines [32]. The extraction method should therefore provide balanced recovery across these diverse lipid classes.
The inclusion of appropriate internal standards is critical for accurate quantification. A mixture of stable isotope-labeled or odd-chain lipid standards covering all major lipid classes should be added prior to extraction to correct for extraction efficiency, matrix effects, and instrument variability [35]. For absolute quantification, calibration curves using authentic standards are necessary, though challenging for comprehensive lipidomics due to commercial availability limitations.
Method Validation and Quality Control
Robust method validation is essential for generating reliable lipidomic data in diabetes and hyperuricemia research. Key validation parameters include linearity, precision, accuracy, limit of detection (LOD), limit of quantification (LOQ), and carryover [35] [36]. For untargeted lipidomics, where hundreds to thousands of lipids are detected, validation can be performed using representative lipids from each major class.
Quality control (QC) samples are indispensable for monitoring system stability and data quality in large-scale studies. Pooled QC samples, created by combining aliquots from all study samples, should be analyzed regularly throughout the batch [35]. The QC samples serve multiple purposes: monitoring retention time stability, mass accuracy, peak intensity, and system carryover; evaluating the need for batch correction; and ensuring data quality throughout the analysis.
Method robustness should be assessed through column-to-column and batch-to-batch reproducibility studies. In one comprehensive study, 1550 continuous injections of plasma extracts onto a single column demonstrated excellent reproducibility, while evaluation of columns from five different batches of stationary phase confirmed method transferability [35]. Such rigorous validation is particularly important in multi-center studies of diabetes and hyperuricemia, where data harmonization across sites is challenging but necessary for meaningful conclusions.
Applications in Diabetes and Hyperuricemia Research
Lipidomic Discoveries in Diabetes and Hyperuricemia
Optimized UHPLC-MS/MS methods have enabled significant advances in understanding lipid dysregulation in diabetes and hyperuricemia. In a recent study comparing diabetic patients with and without hyperuricemia, UHPLC-MS/MS analysis identified 1,361 lipid molecules across 30 subclasses [32]. Multivariate analyses revealed significant separation among diabetes mellitus combined with hyperuricemia (DH), diabetes mellitus (DM), and normal glucose tolerance (NGT) groups, confirming distinct lipidomic profiles.
Specifically, 31 significantly altered lipid metabolites were identified in the DH group compared to NGT controls. Among the most relevant individual metabolites, 13 triglycerides (TGs), 10 phosphatidylethanolamines (PEs), and 7 phosphatidylcholines (PCs) were significantly upregulated, while one phosphatidylinositol (PI) was downregulated [32]. Pathway analysis revealed enrichment in six major metabolic pathways, with glycerophospholipid metabolism (impact value: 0.199) and glycerolipid metabolism (impact value: 0.014) identified as the most significantly perturbed pathways in DH patients [32].
The comparison between DH and DM groups identified 12 differential lipids, which were also predominantly enriched in these same core pathways, underscoring their central role in the pathophysiology of hyperuricemia complicating diabetes [32]. These findings highlight the power of optimized UHPLC methods to reveal subtle but biologically significant lipid alterations in complex metabolic disorders.
Analytical Workflow for Lipidomics in Metabolic Disease Research
Essential Research Reagents and Materials
Table 3: Essential Research Reagent Solutions for UHPLC-MS/MS Lipidomics
| Reagent/Material | Function/Purpose | Example Specifications |
|---|---|---|
| UHPLC System | High-pressure chromatographic separation | Pressure limit: 15,000-22,000 psi; Low dispersion (<10 μL); Reduced dwell volume |
| C18 UHPLC Column | Stationary phase for lipid separation | 100-150 mm × 2.1 mm; 1.7-1.8 μm particle size; BEH C18 or equivalent |
| Mass Spectrometer | Lipid detection and identification | Q-TOF, Orbitrap, or Triple Quadrupole with ESI source |
| Lipid Internal Standards | Quantification and quality control | SPLASH LIPIDOMIX, Avanti Odd-Chained LIPIDOMIX |
| Extraction Solvents | Lipid extraction from biological samples | MTBE, chloroform, methanol, isopropanol (HPLC/MS grade) |
| Mobile Phase Additives | Enhance ionization and control pH | Ammonium formate, ammonium acetate, formic acid (LC-MS grade) |
| Quality Control Materials | Method validation and monitoring | NIST SRM 1950 (Metabolites in Frozen Human Plasma) |
Method Optimization Framework for Targeted Lipid Classes
Optimization Strategy for Diabetes and Hyperuricemia-Related Lipids
The optimization of UHPLC methods for diabetes and hyperuricemia research should prioritize lipid classes most relevant to these conditions. Based on recent findings, glycerophospholipids (PC, PE, PI) and glycerolipids (TG, DG) represent critical targets for method optimization [32]. Each lipid class presents unique chromatographic behaviors that must be considered during method development.
For phospholipid separation, a shallower gradient in the early to mid-section of the chromatographic run typically improves resolution of molecular species. The use of ammonium salts in the mobile phase promotes the formation of [M+H]+ or [M+NH4]+ adducts in positive ion mode, while in negative ion mode, phospholipids can be detected as [M-H]- or [M+CH3COO]- ions, depending on the mobile phase additives [1]. The ability to resolve phospholipid isomers is particularly important, as different molecular species may have distinct biological roles in diabetes pathophysiology.
For triglyceride separation, which is crucial given their significant alterations in diabetes and hyperuricemia, a stronger elution strength is required. Isopropanol as a component of the organic phase is essential for efficient elution of TGs [1]. The separation of TG molecular species follows a pattern based on equivalent carbon number (ECN), where ECN = CN - 2DB, with CN being the total number of carbon atoms in the fatty acyl chains and DB the total number of double bonds [1].
Advanced Optimization Techniques
Beyond basic parameter optimization, several advanced techniques can enhance UHPLC methods for complex lipid separations. Automated method development software can systematically explore the effects of multiple parameters (temperature, gradient profile, mobile phase pH) to identify optimal conditions [36]. These approaches can significantly reduce method development time while potentially revealing non-intuitive optimal conditions.
The implementation of coupled column systems can enhance peak capacity for extremely complex samples. While technically challenging, this approach can be valuable when analyzing lipid extracts from tissues or other samples with exceptionally high complexity. However, for most plasma/serum applications in diabetes and hyperuricemia research, single-column methods are sufficient.
Another advanced consideration is the need for complementary separations to address specific analytical challenges. For instance, the analysis of plasmalogens – ether-linked phospholipids with potential relevance to oxidative stress in diabetes – may benefit from specific MS detection strategies, including precursor ion scanning or MS/MS fragmentation in negative ion mode to identify the characteristic loss of the alk-1'-enylether chain [1].
The optimization of UHPLC conditions for complex lipid separation represents a critical foundation for advancing our understanding of lipid dysregulation in diabetes and hyperuricemia. Through careful consideration of stationary phase selection, mobile phase composition, gradient profile, and instrumental parameters, researchers can develop robust methods capable of resolving the subtle lipid alterations characteristic of these metabolic disorders. The integration of these optimized chromatographic methods with advanced mass spectrometric detection and appropriate sample preparation protocols enables comprehensive lipidomic profiling that can reveal novel mechanistic insights and potential biomarkers. As UHPLC technology continues to evolve, with developments in column chemistries, stationary phases, and instrumentation capabilities, the potential for deeper and more precise lipidome characterization in metabolic disease research will undoubtedly expand, offering new opportunities to unravel the complex lipid basis of diabetes and hyperuricemia.
Electrospray Ionization (ESI) has emerged as a cornerstone technique in mass spectrometry, particularly for the analysis of biological macromolecules and complex organic compounds. As a "soft" ionization technique, ESI efficiently transfers ionic species from solution into the gaseous phase with minimal fragmentation, making it ideally suited for the analysis of thermally labile biomolecules such as proteins, peptides, and metabolites [37] [38]. The fundamental principle of ESI involves applying a high voltage to a liquid sample, creating a fine aerosol of charged droplets that undergo desolvation through solvent evaporation, ultimately yielding gas-phase ions for mass spectrometric analysis [37]. This technique has revolutionized clinical and bioanalytical chemistry by enabling the sensitive and robust analysis of complex biological samples at femtomole quantities in microliter sample volumes [37].
The significance of ESI extends prominently into the field of lipidomics, where its compatibility with liquid chromatography (LC) and tandem mass spectrometry (MS/MS) provides a powerful platform for comprehensive lipid profiling. In the context of diabetes mellitus and hyperuricemia research, ESI-based lipidomic approaches have revealed profound alterations in glycerophospholipid and glycerolipid metabolism pathways, offering new insights into the metabolic perturbations underlying these conditions [3]. The capability to precisely characterize lipidomic profiles in patient plasma samples has positioned ESI-MS/MS as an indispensable tool for identifying potential biomarkers and elucidating pathological mechanisms [3]. A key technical aspect that enhances the utility of ESI in such applications is polarity switching—the ability to rapidly alternate between positive and negative ionization modes during a single analytical run, thereby expanding the range of detectable analytes with diverse chemical properties [39] [40].
Fundamental Principles of ESI and Polarity Switching
The ESI Mechanism: From Solution to Gas-Phase Ions
The electrospray ionization process comprises three sequential steps that facilitate the transition of analytes from solution to gas-phase ions. First, a fine spray of charged droplets is generated at the ESI tip, which is maintained at a high voltage (typically 2.5-6.0 kV) relative to the surrounding chamber [37]. The application of a nebulizing gas such as nitrogen enhances this process, particularly at higher sample flow rates [37]. Second, these charged droplets travel toward the mass spectrometer analyzer region while undergoing continuous solvent evaporation, aided by an elevated ESI-source temperature and/or a stream of nitrogen drying gas [37]. As solvent evaporation progresses, the droplet size decreases while surface charge density increases, leading to heightened electrostatic repulsion forces. Finally, when the electric field strength within the charged droplet reaches a critical point known as the Rayleigh limit, ions at the droplet surface are ejected into the gaseous phase through a process termed Coulomb fission [37] [38].
The final production of gas-phase ions occurs primarily through two proposed mechanisms. The Ion Evaporation Model (IEM) suggests that as droplets reach a critical radius, the field strength at their surface becomes sufficient to assist the field desorption of solvated ions [38]. Conversely, the Charged Residue Model (CRM) proposes that electrospray droplets undergo repeated evaporation and fission cycles until progeny droplets contain approximately one analyte ion or less, with gas-phase ions forming after remaining solvent molecules evaporate [38]. The IEM appears dominant for smaller ions, while the CRM better explains the ionization of larger biomolecules such as folded proteins [38].
Positive and Negative Ionization Modes
ESI mass spectrometry employs two primary polarity modes, each with distinct mechanisms and applications. In positive ion mode, analytes are typically charged through protonation, forming positively charged ions such as [M+H]⁺ or cation adducts like [M+Na]⁺ [39] [38]. This mode is particularly suitable for basic compounds that readily accept protons. For optimal performance in positive ion mode, acidic mobile phase modifiers such as 0.1% formic acid or acetic acid are commonly added to enhance protonation and increase sensitivity [41].
In negative ion mode, ionization occurs primarily through deprotonation, resulting in negatively charged ions denoted as [M-H]⁻ [39]. This mode is ideal for acidic compounds that readily donate protons. To improve deprotonation efficiency and sensitivity in negative ion mode, basic additives such as 0.3% ammonium hydroxide are typically incorporated into the mobile phase [41].
The ions observed in ESI mass spectra are typically even-electron species, formed through the addition or removal of protons rather than through electron gain or loss [38]. For large macromolecules, multiple charging is common, resulting in a characteristic charge state envelope that effectively extends the mass range of the analyzer [38].
Polarity Switching: Principles and Implementation
Polarity switching refers to the instrumental capability to rapidly alternate between positive and negative ionization modes during a single LC-MS/MS analysis. This technique is particularly valuable in untargeted lipidomic studies where analytes with diverse physicochemical properties must be detected simultaneously [39] [40]. The switching speed, a critical instrumental parameter, determines the temporal resolution between data acquisition in each mode and thus impacts data quality and the number of data points collected across chromatographic peaks.
Modern mass spectrometers, including various Orbitrap and Q-TOF systems, increasingly incorporate this functionality [40]. The implementation typically involves precise synchronization between the mass spectrometer's ionization source and the data acquisition system, allowing for seamless transitions between positive and negative voltages applied to the ESI capillary. This capability enables researchers to obtain comprehensive molecular profiles without requiring separate analytical runs for each ionization mode, thereby conserving sample, reducing analysis time, and providing more consistent data alignment between positive and negative mode datasets [39].
Table 1: Comparison of ESI Positive and Negative Ionization Modes
| Parameter | Positive Ion Mode | Negative Ion Mode |
|---|---|---|
| Ionization Mechanism | Protonation ([M+H]⁺) or cation adduction ([M+Na]⁺) | Deprotonation ([M-H]⁻) or anion adduction |
| Suitable Compound Types | Basic compounds, amines, peptides, proteins | Acidic compounds, fatty acids, phospholipids, organic acids |
| Common Mobile Phase Additives | 0.1% Formic acid, acetic acid | 0.3% Ammonium hydroxide, volatile amines |
| Typical Adducts | [M+H]⁺, [M+Na]⁺, [M+K]⁺ | [M-H]⁻, [M+Cl]⁻, [M+CH₃COO]⁻ |
| Dominant Lipid Classes | Lysophosphatidylcholines, sphingolipids | Fatty acids, phosphatidic acids, phosphatidylglycerols |
Optimization of Critical ESI Parameters
Successful implementation of ESI-MS methods, particularly for complex lipidomic analyses, requires careful optimization of multiple instrumental parameters. These parameters collectively influence ionization efficiency, signal stability, and overall method sensitivity.
Voltage and Temperature Parameters
The electrospray voltage (typically 2.5-6.0 kV) applied to the capillary tip is a fundamental parameter that initiates the electrospray process [37] [42]. This high voltage creates the strong electric field necessary for droplet charging and aerosol formation. Optimal voltage setting depends on multiple factors including mobile phase composition, flow rate, and capillary geometry. Insufficient voltage results in poor spray formation and unstable signals, while excessive voltage can cause electrical discharge and increased background noise.
The source temperature plays a critical role in solvent evaporation from charged droplets. Elevated temperatures (typically controlled between 100-300°C) facilitate rapid desolvation, promoting the release of gas-phase ions [42]. This is particularly important in high-flow rate applications where complete desolvation might otherwise be challenging. Additionally, the drying gas (usually nitrogen) flow rate and temperature work in concert with source temperature to optimize desolvation efficiency without causing thermal degradation of analytes [37].
Flow Rates and Mobile Phase Considerations
ESI performance is highly dependent on flow rates, with lower flow rates (nL/min to μL/min range) generally providing improved ionization efficiency and sensitivity due to the production of smaller initial droplets [39] [38]. Nano-electrospray techniques, operating at flow rates of 25-800 nL/min, offer particular advantages for sample-limited applications such as clinical biomarkers analysis [38]. However, practical considerations often necessitate higher flow rates compatible with conventional LC systems, where additional nebulization gas is required to maintain stable spray formation [39].
Mobile phase composition significantly impacts ESI efficiency through its effects on solution conductivity, surface tension, and solvent volatility. Volatile buffers such as ammonium acetate or ammonium formate (typically at concentrations below 20 mM) are essential, as non-volatile buffers (e.g., phosphate, tris) cause severe ion suppression and instrument contamination [39] [41]. The pH of the mobile phase should facilitate analyte ionization—acidic pH (2-4) for positive mode and basic pH (8-10) for negative mode—though compatibility with chromatographic separation must be considered [39]. Organic modifier composition (acetonitrile vs. methanol) also influences spray stability and ionization efficiency, with optimal proportions being analyte-dependent.
Table 2: Optimal ESI Parameter Ranges for Lipidomic Analysis
| Parameter | Recommended Range | Impact on Analysis |
|---|---|---|
| Capillary Voltage | 2.5 - 6.0 kV | Higher voltage improves spray stability but may increase background noise |
| Source Temperature | 100 - 300°C | Higher temperature enhances desolvation; excessive heat may degrade labile lipids |
| Drying Gas Flow | Instrument-dependent | Optimizes solvent evaporation without disrupting spray stability |
| Mobile Phase Buffer Concentration | < 20 mM (volatile buffers only) | Higher concentrations cause ion suppression and source contamination |
| Flow Rate | 0.2 - 0.5 mL/min (conventional ESI); 50 - 500 nL/min (nano-ESI) | Lower flow rates generally improve ionization efficiency |
| Polarity Switching Speed | Instrument-dependent; faster for narrow chromatographic peaks | Determines data point density across chromatographic peaks in dual-polarity acquisition |
Parameter Optimization for Polarity Switching
Implementing polarity switching introduces additional optimization considerations. The switching speed must be balanced against signal stability and data quality, with faster switching enabling better peak definition in both modes but potentially reducing signal-to-noise ratios. The dwell times for each polarity must be sufficient to collect representative mass spectra while maintaining adequate chromatographic sampling across narrow peaks.
Source parameters often require compromise when optimizing for both positive and negative modes simultaneously. While certain conditions might favor one ionization mode over the other, the goal in polarity switching methods is to identify settings that provide acceptable performance across both modes. This typically involves systematic evaluation of key parameters (voltage, temperatures, gas flows) using standard mixtures containing representative compounds of interest for both polarities.
Application in Lipidomic Analysis of Diabetes and Hyperuricemia
Lipidomic Perturbations in Metabolic Disorders
Ultra-high performance liquid chromatography tandem mass spectrometry (UHPLC-MS/MS) with ESI ionization has revealed profound alterations in lipid metabolism in patients with diabetes mellitus (DM) and diabetes mellitus combined with hyperuricemia (DH) [3]. A recent untargeted lipidomic study identified 1,361 lipid molecules across 30 subclasses in plasma samples from DH, DM, and normal glucose tolerance (NGT) groups [3]. Multivariate analyses demonstrated significant separation trends among these groups, confirming distinct lipidomic profiles associated with each metabolic condition [3].
Specifically, comparison of DH versus NGT groups identified 31 significantly altered lipid metabolites. Among the most relevant individual metabolites, 13 triglycerides (TGs) such as TG (16:0/18:1/18:2), 10 phosphatidylethanolamines (PEs) including PE (18:0/20:4), and 7 phosphatidylcholines (PCs) such as PC (36:1) were significantly upregulated, while one phosphatidylinositol (PI) was downregulated [3]. These differential lipids were predominantly enriched in glycerophospholipid metabolism (impact value: 0.199) and glycerolipid metabolism (impact value: 0.014), identifying these as the most significantly perturbed pathways in DH patients [3]. Furthermore, comparison of DH versus DM groups revealed 12 differential lipids that were also predominantly enriched in these same core pathways, underscoring their central role in the pathophysiology of hyperuricemia complicating diabetes [3].
Analytical Considerations for Lipidomic Applications
The comprehensive analysis of lipid species in diabetes and hyperuricemia research presents particular analytical challenges that ESI-MS/MS with polarity switching effectively addresses. Lipid extraction efficiency is critical, with methods such as methyl tert-butyl ether (MTBE) extraction providing broad coverage of lipid classes [3]. Chromatographic separation prior to MS analysis is essential for resolving isobaric and isomeric lipid species, with UHPLC using C18 columns and gradient elution with acetonitrile-water mixtures being commonly employed [3].
The implementation of polarity switching is particularly advantageous in lipidomics due to the diverse chemical properties of different lipid classes. Many glycerophospholipids (e.g., phosphatidylcholines, sphingomyelins) ionize efficiently in positive mode, while acidic phospholipids (e.g., phosphatidylinositols, phosphatidylserines) and fatty acids are preferentially detected in negative mode [39]. The ability to monitor both sets of lipids in a single analytical run provides a more comprehensive lipidomic profile while maintaining consistent chromatographic alignment—a significant advantage when studying complex metabolic relationships in diabetes and hyperuricemia.
Matrix effects present a particular challenge in lipidomic analyses of biological samples, with phospholipids being a major source of ion suppression or enhancement [43]. The extent of matrix effects can vary between ionization polarities, with one study reporting approximately 30-35% ion suppression in positive polarity for enalapril and enalaprilat, compared to approximately 20% ion suppression for enalapril and 10% ion enhancement for enalaprilat in negative polarity [43]. These findings highlight the importance of evaluating matrix effects in the specific polarity used for quantification and implementing appropriate mitigation strategies such as efficient sample cleanup, stable isotope-labeled internal standards, and matrix-matched calibration [43].
Diagram 1: Workflow for UHPLC-ESI-MS/MS Lipidomic Analysis with Polarity Switching. The diagram illustrates the integrated approach for comprehensive lipid profiling in diabetes and hyperuricemia research, highlighting the parallel detection pathways enabled by polarity switching.
Experimental Protocols for Lipidomic Analysis
Sample Preparation and Lipid Extraction
Robust sample preparation is fundamental to successful lipidomic analysis. The following protocol, adapted from a recent study on lipidomics in diabetes and hyperuricemia, provides a reliable method for plasma lipid extraction [3]:
Sample Collection and Handling: Collect fasting blood samples in appropriate anticoagulant tubes (e.g., K₂EDTA). Centrifuge at 3,000 rpm for 10 minutes at room temperature to separate plasma. Aliquot 0.2 mL of plasma into 1.5 mL centrifuge tubes and store at -80°C until analysis [3].
Lipid Extraction Procedure:
- Thaw plasma samples on ice and vortex to ensure homogeneity.
- Transfer 100 μL of plasma to a 1.5 mL centrifuge tube.
- Add 200 μL of 4°C water and vortex to mix.
- Add 240 μL of pre-cooled methanol and vortex thoroughly.
- Add 800 μL of methyl tert-butyl ether (MTBE) and vortex vigorously.
- Sonicate in a low-temperature water bath for 20 minutes.
- Allow the mixture to stand at room temperature for 30 minutes.
- Centrifuge at 14,000 × g for 15 minutes at 10°C.
- Collect the upper organic phase and dry under a stream of nitrogen.
- Reconstitute the dried extract in an appropriate solvent (e.g., isopropanol) for UHPLC-MS/MS analysis [3].
Quality Control: Prepare quality control (QC) samples by pooling equal aliquots from all experimental samples. Include QC samples at regular intervals throughout the analytical sequence to monitor system stability and data quality [3].
UHPLC-MS/MS Analysis with Polarity Switching
The following method provides a foundation for comprehensive lipidomic profiling using polarity switching:
Chromatographic Conditions:
- Column: Waters ACQUITY UPLC BEH C18 column (2.1 × 100 mm, 1.7 μm particle size)
- Mobile Phase A: 10 mM ammonium formate in acetonitrile-water solution
- Mobile Phase B: 10 mM ammonium formate in acetonitrile-isopropanol solution
- Gradient Program: Optimize for comprehensive lipid separation with a total run time of 15-30 minutes
- Column Temperature: 45-55°C
- Injection Volume: 1-5 μL [3]
Mass Spectrometric Conditions:
- Ionization Source: Electrospray ionization (ESI) with polarity switching
- Switching Frequency: Optimize based on chromatographic peak width (typically 1-2 seconds per cycle)
- Capillary Voltage: 2.5-3.5 kV (positive mode), 2.0-3.0 kV (negative mode)
- Source Temperature: 300-350°C
- Drying Gas Flow: Optimize for specific instrument configuration
- Mass Range: m/z 150-2000
- Resolution: >30,000 (for high-resolution instruments)
- Collision Energies: Ramp for comprehensive fragmentation in MS/MS mode [3] [40]
Data Acquisition Modes:
- Full Scan MS: Acquire in both positive and negative modes with polarity switching
- Data-Dependent Acquisition (DDA): Select top N precursors for fragmentation in each polarity
- Data-Independent Acquisition (DIA): Acquire fragmentation data for all precursors within selected m/z windows
- Targeted MS/MS: For quantification of specific lipid classes of interest [3]
Diagram 2: ESI Polarity Switching Data Acquisition Cycle. The diagram illustrates the sequential process of alternating between positive and negative ionization modes during a single LC-MS analysis, showing how data from both polarities are combined for comprehensive analysis.
Data Processing and Lipid Identification
Effective data processing strategies are essential for translating raw MS data into biologically meaningful lipidomic information:
Peak Detection and Alignment: Use specialized software (e.g., MS-DIAL, XCMS, Progenesis QI) for peak picking, retention time alignment, and integration across multiple samples.
Lipid Identification:
- Match accurate mass (typically <5 ppm mass error) against lipid databases (e.g., LIPID MAPS, Human Metabolome Database)
- Confirm identities using MS/MS spectral matching with reference standards or computational prediction tools
- Apply rules for lipid annotation according to international guidelines (e.g., Level 1: identified by both accurate mass and MS/MS; Level 2: identified by accurate mass and literature evidence)
Quantification Approaches:
- Use stable isotope-labeled internal standards for absolute quantification of key lipid classes
- Apply normalization strategies to account for technical variation (e.g., total ion current, internal standard normalization)
- Perform statistical analysis to identify significantly altered lipids between experimental groups
Pathway Analysis: Utilize tools such as MetaboAnalyst 5.0 to identify enriched metabolic pathways based on significantly altered lipids [3].
The Scientist's Toolkit: Essential Research Reagents and Materials
Table 3: Essential Research Reagents and Materials for ESI-MS Lipidomic Analysis
| Item | Function/Application | Technical Considerations |
|---|---|---|
| Methyl tert-butyl ether (MTBE) | Lipid extraction from plasma samples | Provides comprehensive recovery of diverse lipid classes; less prone to formation of emulsion than chloroform-based methods [3] |
| Ammonium formate/acetate | Volatile mobile phase additive for LC-MS | Enhances ionization efficiency; compatible with ESI process unlike non-volatile buffers [39] [41] |
| C18 UHPLC Columns (2.1 × 100 mm, 1.7 μm) | Chromatographic separation of lipid species | Provides high-resolution separation of complex lipid mixtures; compatible with high-pressure UHPLC systems [3] |
| Stable Isotope-Labeled Internal Standards (e.g., d₇-PC, d₅-PE) | Quantification and quality control | Corrects for matrix effects and extraction efficiency variations; essential for accurate quantification [43] |
| Formic Acid (0.1% in mobile phase) | Mobile phase additive for positive ion mode | Promotes protonation of basic lipid species; enhances sensitivity in positive ion mode [41] |
| Ammonium Hydroxide (0.3% in mobile phase) | Mobile phase additive for negative ion mode | Promotes deprotonation of acidic lipid species; enhances sensitivity in negative ion mode [41] |
| Quality Control Pooled Plasma | System suitability and data quality assessment | Monitors instrument stability throughout analytical batches; identifies technical artifacts [3] |
Electrospray ionization mass spectrometry with polarity switching capability represents a powerful analytical platform for comprehensive lipidomic investigations in diabetes and hyperuricemia research. The strategic optimization of ESI parameters—including ionization polarity, source voltages, temperatures, and mobile phase composition—enables sensitive and robust detection of diverse lipid species from complex biological matrices. The implementation of polarity switching during UHPLC-MS/MS analysis provides distinct advantages for capturing the full complexity of lipid metabolic alterations, allowing simultaneous monitoring of both positive and negative mode ions in a single analytical run. As demonstrated in recent clinical studies, this integrated approach has revealed significant perturbations in glycerophospholipid and glycerolipid metabolism pathways in patients with diabetes and hyperuricemia, offering new insights into the lipidomic basis of these metabolic disorders. Continued refinement of ESI methodologies and polarity switching applications will further advance our understanding of metabolic diseases and support the discovery of novel biomarkers and therapeutic targets.
In the realm of metabolic disease research, particularly concerning diabetes mellitus (DM) and hyperuricemia, comprehensive lipidomic profiling has emerged as a pivotal methodology for elucidating underlying pathological mechanisms. The integration of ultra-high performance liquid chromatography-tandem mass spectrometry (UHPLC-MS/MS) has enabled the precise identification and quantification of a vast array of lipid species, offering unprecedented insights into disease-associated metabolic perturbations. Lipidomics, a specialized branch of metabolomics, serves as a powerful tool for characterizing the intricate landscape of lipid disturbances that precede and accompany complex metabolic disorders [3]. This technical guide details the core data processing workflow—peak identification, alignment, and quantification—framed within a clinical investigation of diabetes mellitus combined with hyperuricemia (DH), providing a structured approach for researchers and drug development professionals engaged in biomarker discovery and pathogenic studies.
Core Data Processing Workflow in Lipidomics
The transformation of raw UHPLC-MS/MS data into biologically meaningful information necessitates a robust, multi-stage computational workflow. This process is critical for ensuring the accuracy, reproducibility, and biological validity of the resulting lipidomic profiles, especially when investigating subtle metabolic shifts in conditions like diabetes and hyperuricemia. The following diagram illustrates the primary stages of this workflow, from raw data input to final biological interpretation.
Peak Identification and Filtering
The initial stage involves detecting ion signals from the raw chromatographic data and distinguishing true lipid peaks from background noise and non-lipid artifacts.
- Peak Detection and Deconvolution: Software tools like XCMS and MZmine are commonly employed to pick chromatographic peaks, model their shape, and deconvolute overlapping signals to determine the precise mass and retention time for each detected feature [44]. This step transforms raw spectral data into a list of defined features characterized by mass-to-charge ratio (m/z) and retention time.
- Artifact Removal and Peak Filtering: Specialized tools like LipidFinder are crucial for the subsequent clean-up of the dataset [44]. Its PeakFilter module uses a multi-step algorithm to remove common contaminants, adducts, in-source fragments, and other non-lipid artifacts. This process, which includes blank and background subtraction, adduct removal, and lipid stack resolution, is essential for reducing false positives and yielding a cleaner dataset for downstream statistical analysis [44].
Peak Alignment
In multi-sample studies, technical variations such as retention time shifts and mass drift are inevitable. Peak alignment corrects for these variations to ensure that the same lipid molecule is correctly matched across all samples in the study.
- Retention Time Correction: Algorithms within data processing tools apply nonlinear retention time correction to align peaks across different analytical runs. LipidFinder, for instance, performs this correction after its initial filtering steps, further refining the dataset [44].
- Feature Grouping: Following alignment, features corresponding to the same lipid entity across all samples are grouped together. This creates a consolidated data matrix where each row represents a unique lipid feature and each column represents a sample, a prerequisite for reliable comparative quantification.
Peak Quantification
This stage involves measuring the abundance of each aligned lipid feature to facilitate comparative analysis between experimental groups.
- Extraction of Ion Intensities: The chromatographic peak area or height is typically used as a quantitative measure for each lipid species. This data is extracted for every aligned feature across all samples.
- Integration with Identification: For confident quantification, the quantitative data is integrated with identification results. LipidFinder's online workflow allows for MS searching against comprehensive databases like the LIPID MAPS Structure Database (LMSD) after statistical analysis, linking quantitative data to putative lipid identities [44].
Experimental Protocols for UHPLC-MS/MS Lipidomics
The following detailed methodology is adapted from a clinical lipidomics study investigating diabetes mellitus and hyperuricemia [3].
Sample Preparation Protocol
- Collection: Collect 5 mL of fasting morning blood into appropriate anticoagulant tubes.
- Plasma Separation: Centrifuge the blood samples at 3,000 rpm for 10 minutes at room temperature. Carefully aspirate the upper plasma layer.
- Aliquoting and Storage: Aliquot 0.2 mL of plasma into 1.5 mL microcentrifuge tubes. Prepare quality control (QC) samples by pooling equal volumes from all samples. Store all aliquots at -80°C.
- Lipid Extraction: a. Thaw plasma samples on ice and vortex thoroughly. b. Transfer a 100 μL plasma aliquot to a new 1.5 mL tube. Add 200 μL of ice-cold water and vortex. c. Add 240 μL of pre-cooled methanol and mix vigorously. d. Add 800 μL of methyl tert-butyl ether (MTBE) and mix. e. Sonicate the mixture in a low-temperature water bath for 20 minutes. f. Allow the mixture to stand at room temperature for 30 minutes. g. Centrifuge at 14,000 g for 15 minutes at 10°C to achieve phase separation. h. Transfer the upper organic phase (containing lipids) to a new tube. i. Dry the organic extract under a gentle stream of nitrogen gas. j. Reconstitute the dried lipid extract in 100 μL of isopropanol for UHPLC-MS/MS analysis.
UHPLC-MS/MS Instrumental Conditions
- Chromatography:
- Column: Waters ACQUITY UPLC BEH C18 (2.1 mm x 100 mm, 1.7 μm particle size).
- Mobile Phase A: 10 mM ammonium formate in acetonitrile/water.
- Mobile Phase B: 10 mM ammonium formate in acetonitrile/isopropanol.
- Gradient: A specific linear gradient (details optimized as per laboratory protocol) is used to elute lipids from the column [3].
- Mass Spectrometry:
- Ionization: Electrospray ionization (ESI) in both positive and negative modes.
- Scanning: Data-dependent acquisition (DDA) or data-independent acquisition (DIA) modes are used to fragment precursor ions and obtain MS/MS spectra for lipid identification.
Key Lipid Alterations in Diabetes and Hyperuricemia
Application of the above workflow in a clinical study comparing patients with diabetes mellitus (DM), diabetes mellitus combined with hyperuricemia (DH), and healthy controls (NGT) revealed distinct lipidomic profiles. Multivariate analyses confirmed a significant separation trend among these groups [3]. The following table summarizes the significantly altered lipid metabolites identified in the DH group compared to the NGT controls.
Table 1: Significantly Altered Lipid Metabolites in Diabetes Mellitus with Hyperuricemia (DH) vs. Healthy Controls (NGT)
| Lipid Subclass | Number of Significantly Altered Lipids | Example Molecules | Trend in DH |
|---|---|---|---|
| Triglycerides (TG) | 13 | TG (16:0/18:1/18:2) | Upregulated |
| Phosphatidylethanolamines (PE) | 10 | PE (18:0/20:4) | Upregulated |
| Phosphatidylcholines (PC) | 7 | PC (36:1) | Upregulated |
| Phosphatidylinositol (PI) | 1 | Not Specified | Downregulated |
Furthermore, the comparison between DH and DM groups identified 12 additional differential lipids, underscoring the specific lipidomic impact of hyperuricemia complicating diabetes [3]. The collective analysis of these altered metabolites revealed their enrichment in specific metabolic pathways, as shown below.
Table 2: Enriched Metabolic Pathways from Differential Lipid Analysis
| Metabolic Pathway | Impact Value | Key Lipid Classes Involved |
|---|---|---|
| Glycerophospholipid Metabolism | 0.199 | Phosphatidylethanolamines (PE), Phosphatidylcholines (PC) |
| Glycerolipid Metabolism | 0.014 | Triglycerides (TG) |
The perturbation in these core pathways highlights the interplay between lipid metabolism, glucose homeostasis, and purine metabolism, providing a mechanistic basis for the pathological synergy observed in patients with coexisting diabetes and hyperuricemia. The following diagram synthesizes the relationship between the identified lipid classes and the perturbed metabolic pathways in the context of the disease.
The Scientist's Toolkit: Research Reagent Solutions
The following table catalogues essential materials and computational resources critical for executing a UHPLC-MS/MS based lipidomic study as described.
Table 3: Essential Research Reagents and Resources for UHPLC-MS/MS Lipidomics
| Item Name | Function/Description | Application in Workflow |
|---|---|---|
| Waters ACQUITY UPLC BEH C18 Column | High-resolution chromatographic separation of complex lipid mixtures. | UHPLC Separation |
| Methyl tert-butyl ether (MTBE) | Organic solvent used for efficient liquid-liquid extraction of a broad range of lipid classes from biological matrices. | Lipid Extraction |
| Ammonium Formate | Mobile phase additive that improves ionization efficiency and assists in adduct formation (e.g., [M+H]+ or [M+NH4]+) in mass spectrometry. | UHPLC-MS/MS Analysis |
| LipidFinder on LIPID MAPS | A dedicated online bioinformatics workflow for peak filtering, MS database searching, and statistical analysis, customized for lipidomic data. | Data Processing & Lipid Identification |
| LIPID MAPS Structure Database (LMSD) | A comprehensive, curated database of lipid structures used for putative identification of lipids based on m/z search. | Lipid Identification |
| XCMS / MZmine | Open-source software packages for pre-processing raw MS data, including peak picking, retention time alignment, and feature grouping. | Pre-processing & Peak Alignment |
Lipidomics, the comprehensive analysis of lipids in biological systems, has become an indispensable tool in biomedical research, with particular relevance for understanding complex metabolic disorders such as diabetes mellitus (DM) and hyperuricemia (HU). The intricate relationship between these conditions is underscored by lipidomic studies revealing that patients with combined diabetes and hyperuricemia (DH) exhibit significant alterations in lipid metabolites compared to those with diabetes alone or healthy controls [3]. These findings highlight the critical need for advanced analytical techniques that can provide deeper insights into the lipidomic perturbations underlying disease pathophysiology. However, the accurate identification of lipids in untargeted lipidomics remains challenging due to the tremendous structural diversity of lipid molecules, the prevalence of isobaric and isomeric species, and the limitations of traditional identification methods that rely primarily on mass-to-charge ratio (m/z) and fragmentation patterns [45] [46].
The integration of molecular networking and retention time (RT) prediction represents a transformative approach to these challenges, offering a more robust framework for lipid annotation and identification. Molecular networking organizes lipid species based on the similarity of their MS/MS fragmentation patterns, enabling the discovery of structurally related compounds and novel lipids without requiring prior knowledge of all potential species [45] [47]. Meanwhile, RT prediction models leverage machine learning algorithms to estimate the chromatographic behavior of lipids, providing an orthogonal identification parameter that significantly enhances confidence in annotations [48] [49] [46]. When combined, these techniques form a powerful synergistic workflow that advances our capacity to characterize lipidomic profiles in complex biological systems, ultimately accelerating biomarker discovery and mechanistic studies in diabetes and hyperuricemia research.
Molecular Networking in Lipid Annotation
Fundamental Principles and Workflows
Molecular networking is a computational strategy that organizes and visualizes hundreds or thousands of molecules based on the similarity of their tandem mass spectrometry (MS/MS) spectra. The core principle underlying this approach is that structurally related molecules typically display similar fragmentation patterns when subjected to collision-induced dissociation [45]. This technique, historically applied in the field of plant secondary metabolites, has recently gained traction in lipidomics due to its ability to facilitate the annotation of unknown lipids and discover novel lipid species within complex biological samples [45] [47].
The standard workflow for molecular networking in lipidomics begins with the acquisition of MS/MS spectra from lipid extracts using liquid chromatography coupled to tandem mass spectrometry (LC-MS/MS). The resulting fragmentation data is then processed through computational platforms such as the Global Natural Product Social Molecular Networking (GNPS) platform, which calculates spectral similarity scores between all detected features [47]. These similarity relationships are visualized as networks where nodes represent individual lipid species and edges connecting nodes indicate significant spectral similarity. Clusters of interconnected nodes typically represent groups of lipids sharing common structural features, such as identical polar head groups or similar fatty acyl chains [45]. This organization enables researchers to propagate annotations from known to unknown lipids within the same cluster, significantly expanding lipid coverage while reducing dependency on comprehensive standard libraries.
Analytical Considerations for Lipidomics
The successful application of molecular networking to lipidomics requires careful optimization of several analytical parameters. Collision energy must be systematically calibrated to generate informative fragmentation spectra that retain diagnostic ions while providing sufficient structural detail for meaningful spectral comparisons [45]. For phospholipid annotation, negative ion mode often provides superior structural information, revealing characteristic fragments corresponding to polar head groups and fatty acyl chains. For instance, phosphatidylcholines (PCs) in negative ion mode primarily generate [M-CH₃]⁻ ions and yield diagnostic fragments including demethylated phosphocholine ions (m/z 168.0423) and carboxylate ions from fatty acyl chains [45].
The application of molecular networking to lipidomic studies of diabetes and hyperuricemia has revealed distinct clustering patterns associated with disease states. In a study comparing DH, DM, and normal glucose tolerance (NGT) groups, multivariate analyses of lipidomic data revealed significant separation trends among these groups, confirming distinct lipidomic profiles [3]. Specifically, 31 significantly altered lipid metabolites were pinpointed in the DH group compared to NGT controls, with triglycerides (TGs), phosphatidylethanolamines (PEs), and phosphatidylcholines (PCs) being predominantly upregulated [3]. Molecular networking could further resolve subclasses within these broad lipid categories, potentially revealing more specific lipid signatures associated with the comorbidity of diabetes and hyperuricemia.
Table 1: Key Lipid Classes Altered in Diabetes with Hyperuricemia (DH)
| Lipid Class | Representative Species | Change in DH vs NGT | Biological Relevance |
|---|---|---|---|
| Triglycerides (TGs) | TG(16:0/18:1/18:2) | Significantly upregulated | Energy storage, lipid metabolism |
| Phosphatidylethanolamines (PEs) | PE(18:0/20:4) | Significantly upregulated | Membrane structure, signaling |
| Phosphatidylcholines (PCs) | PC(36:1) | Significantly upregulated | Membrane integrity, signaling |
| Phosphatidylinositol (PI) | Not specified | Downregulated | Cell signaling, insulin response |
Retention Time Prediction Strategies
Machine Learning Approaches
Retention time prediction has emerged as a critical orthogonal method for enhancing confidence in lipid identification, particularly for distinguishing isomeric and isobaric species that exhibit identical mass spectra but different chromatographic behaviors. Machine learning (ML) approaches have demonstrated remarkable efficacy in this domain, leveraging molecular descriptors and structural fingerprints to predict lipid elution times under various chromatographic conditions [48]. These models address a significant challenge in lipidomics: the considerable variation in retention behavior resulting from differences in column chemistries, mobile phase compositions, and gradient profiles across laboratories [48] [49].
Various ML algorithms have been applied to RT prediction, including Multiple Linear Regression (MLR), Random Forests (RF), Support Vector Machines (SVM), and more complex neural network architectures [48] [49]. These models are typically trained using experimental RT data from standard lipid compounds analyzed under specific chromatographic conditions. The performance of such models has been impressive, with some achieving correlation coefficients (R²) of 0.998 and mean absolute error (MAE) values as low as 0.107 for training sets, and R² of 0.990 with MAE of 0.240 for test sets [48]. This level of accuracy enables reliable prediction of retention times for unknown lipids, significantly reducing false positive identifications and enhancing the overall robustness of lipid annotation workflows.
Practical Implementation Tools
Several specialized software tools have been developed to make RT prediction accessible to researchers without extensive bioinformatics expertise. QSRR Automator represents one such solution, automating the creation of Quantitative Structure-Retention Relationship (QSRR) models for lipidomics and metabolomics studies [49]. This tool addresses a critical bottleneck in the field by enabling laboratories with multiple analytical methods to rapidly generate condition-specific prediction models without requiring dedicated bioinformatics support for each application.
For more specialized applications, ReTimeML offers a tailored approach for predicting retention times of sphingolipids, including ceramides (Cer) and sphingomyelins (SM) [46]. This class-specific tool employs a machine-learned regression library of mass-to-charge (m/z) versus RT profiles that does not require retraining when applied to different LC-MS/MS pipelines. Validated across various biological tissues and chromatographic conditions, ReTimeML has demonstrated exceptional agreement with user-determined RTs, with average and median prediction errors of 7.6 and 3.6 seconds, respectively [46]. This precision is particularly valuable for disambiguating SM identities from isobaric distributions, as demonstrated in studies of paired serum-cerebrospinal fluid samples from healthy volunteers [46].
Table 2: Comparison of Retention Time Prediction Tools
| Tool | Algorithm Options | Application Scope | Key Features | Performance Metrics |
|---|---|---|---|---|
| QSRR Automator | SVR, MLR, RF | Broad lipidomics and metabolomics | User-friendly, automated model creation | Comparable to published models across multiple datasets |
| ReTimeML | Lasso, Ridge regression | Sphingolipids (Cer, SM) | No retraining needed for different LC-MS/MS setups | Average error: 7.6 sec; Median error: 3.6 sec |
| ML-based model (Noreldeen et al.) | Random Forest | Broad lipidomics | Uses molecular descriptors and fingerprints | R²: 0.990; MAE: 0.240 (test set) |
Integrated Workflows for Diabetes and Hyperuricemia Research
Experimental Design and Sample Preparation
The application of integrated molecular networking and RT prediction to diabetes and hyperuricemia research requires careful experimental design and sample preparation. In a typical study examining lipidomic profiles in patients with diabetes mellitus combined with hyperuricemia (DH), researchers employ a case-control design with participants matched for age and sex [3]. Sample collection follows standardized protocols, with fasting blood samples collected and processed to obtain plasma, which is then stored at -80°C until analysis to preserve lipid integrity [3].
Lipid extraction typically utilizes modified Bligh-Dyer procedures or methyl tert-butyl ether (MTBE)-based methods, both of which provide comprehensive recovery of diverse lipid classes [3] [47]. For UHPLC-MS/MS analysis, samples are often reconstituted in appropriate solvents such as isopropanol, with quality control samples (pooled from all samples) analyzed intermittently throughout the sequence to monitor instrument performance and reproducibility [3]. Chromatographic separation commonly employs reversed-phase columns (e.g., Waters ACQUITY UPLC BEH C18, 2.1 × 100 mm, 1.7 μm) with mobile phases consisting of acetonitrile/water mixtures and acetonitrile/isopropanol mixtures, both supplemented with 10 mM ammonium formate to enhance ionization efficiency [3].
Data Acquisition and Processing
Mass spectrometric analysis for integrated workflows typically involves high-resolution instruments such as Q-Exactive Orbitrap systems, which provide the mass accuracy and resolution necessary for confident lipid identification [47]. Data-dependent acquisition (DDA) methods are commonly employed to automatically select the most abundant precursors for fragmentation, generating MS/MS spectra for molecular networking. For comprehensive lipid coverage, both positive and negative ionization modes are typically employed in separate runs [3] [45].
The resulting raw data files are converted to open formats (e.g., .mzXML) and processed through computational pipelines that include both molecular networking and RT prediction components. For molecular networking, data is processed through platforms such as GNPS using Feature-Based Molecular Networking tools, which organize lipids based on MS/MS spectral similarity [47]. Concurrently, RT prediction tools such as QSRR Automator or ReTimeML generate expected retention times for lipid identities proposed through molecular networking or database searching. The integration of these orthogonal data dimensions significantly enhances annotation confidence, particularly for challenging isomeric lipids that are prevalent in diabetes and hyperuricemia pathophysiology.
Diagram 1: Integrated workflow for advanced lipid annotation in diabetes and hyperuricemia research. The workflow combines molecular networking and retention time prediction to enhance lipid identification confidence.
Applications in Diabetes and Hyperuricemia
Lipidomic Discoveries in Disease Pathophysiology
The application of advanced annotation techniques to lipidomic studies of diabetes and hyperuricemia has yielded significant insights into the molecular basis of these interconnected metabolic disorders. A recent UHPLC-MS/MS-based plasma untargeted lipidomic analysis revealed profound alterations in the lipidome of patients with combined diabetes and hyperuricemia (DH) compared to those with diabetes alone (DM) and healthy controls (NGT) [3]. This study identified 1,361 lipid molecules across 30 subclasses, with multivariate analyses demonstrating a significant separation trend among the DH, DM, and NGT groups, confirming distinct lipidomic profiles [3].
A total of 31 significantly altered lipid metabolites were pinpointed in the DH group compared to NGT controls, with a striking pattern of upregulation observed for specific lipid classes [3]. Among the most relevant individual metabolites, 13 triglycerides (TGs), 10 phosphatidylethanolamines (PEs), and 7 phosphatidylcholines (PCs) were significantly upregulated, while one phosphatidylinositol (PI) was downregulated [3]. The collective analysis of these metabolite groups revealed their enrichment in six major metabolic pathways, with glycerophospholipid metabolism (impact value: 0.199) and glycerolipid metabolism (impact value: 0.014) identified as the most significantly perturbed pathways in DH patients [3]. These findings highlight the potential of advanced lipidomic approaches to reveal novel mechanistic insights into the pathophysiology of metabolic diseases.
Biomarker Discovery and Clinical Translation
The enhanced annotation capabilities provided by molecular networking and RT prediction have accelerated the discovery of potential lipid biomarkers for diabetes progression and complications. When comparing DH versus DM groups, researchers identified 12 differential lipids that were also predominantly enriched in the core glycerophospholipid and glycerolipid metabolism pathways, underscoring their central role in the pathophysiology of hyperuricemia complicating diabetes [3]. These specific lipid species may serve as early indicators of disease progression or therapeutic targets for intervention.
Beyond diagnostic applications, advanced lipidomic approaches have informed the development of risk stratification tools. The Renal-Metabolic Risk Score (RMRS), which integrates renal and lipid parameters, has shown promise in identifying patients with uncontrolled type 2 diabetes at risk for combined hyperuricemia and dyslipidemia [50]. In a study of 304 patients with uncontrolled T2DM, the prevalence of dyslipidemia and hyperuricemia co-occurrence was 81.6%, with RMRS demonstrating good discrimination (AUC: 0.78) in identifying high-risk patients [50]. Such tools, derived from lipidomic insights, offer practical clinical applications for patient management and personalized treatment strategies.
Diagram 2: Key lipid alterations and their pathophysiological implications in diabetes with hyperuricemia. Upward arrows indicate increased concentration; downward arrow indicates decreased concentration.
The Scientist's Toolkit: Essential Research Reagents and Materials
Table 3: Research Reagent Solutions for UHPLC-MS/MS Lipidomics
| Category | Specific Product/Type | Application Purpose | Key Characteristics |
|---|---|---|---|
| Chromatography Columns | Waters ACQUITY UPLC BEH C18 (2.1 × 100 mm, 1.7 μm) | Lipid separation | Reversed-phase, high resolution for complex lipid mixtures |
| Mobile Phase Additives | 10 mM Ammonium Formate | LC-MS compatibility | Enhances ionization, reduces adduct formation |
| Lipid Standards | Deuterated internal standards (e.g., d7-PC, d5-TG) | Quantification & RT calibration | Enables precise retention time alignment and quantification |
| Extraction Solvents | Methyl tert-butyl ether (MTBE), Methanol, Chloroform | Lipid extraction from plasma/tissues | Comprehensive recovery of diverse lipid classes |
| MS Calibration Solutions | Pierce LTQ Velos ESI Positive/Negative Ion Calibration Solution | Mass accuracy calibration | Ensures < 5 ppm mass error for confident identification |
| Data Processing Software | GNPS, MZmine 2, LipidAnnotator, MS-DIAL | Molecular networking & annotation | Open-source platforms for comprehensive lipidome analysis |
| Retention Time Prediction Tools | QSRR Automator, ReTimeML | Enhanced lipid identification | Machine learning-based RT prediction for specific LC conditions |
The integration of molecular networking and retention time prediction represents a paradigm shift in lipidomic analysis, particularly for complex metabolic disorders such as diabetes and hyperuricemia. These advanced annotation strategies have demonstrated their capacity to reveal novel lipid signatures, elucidate perturbed metabolic pathways, and identify potential biomarkers that might remain obscured using conventional approaches. The continued refinement of these techniques, coupled with expanding lipid databases and improved computational algorithms, promises to further accelerate discoveries in this field.
Looking ahead, several emerging trends are likely to shape the future of advanced lipid annotation. The integration of ion mobility spectrometry provides an additional separation dimension that complements LC and MS, offering collision cross-section (CCS) values as an additional molecular descriptor for lipid identification [45]. Similarly, the development of universal transfer models for retention time prediction across different chromatographic systems would address a significant challenge in method transfer and inter-laboratory reproducibility [48]. As these technologies mature and become more accessible, they will undoubtedly enhance our understanding of the intricate lipid alterations underlying diabetes and hyperuricemia, potentially revealing novel therapeutic targets and personalized treatment approaches for these prevalent metabolic disorders.
In conclusion, the strategic combination of molecular networking and retention time prediction has established a powerful framework for advancing lipidomic research in diabetes and hyperuricemia. By leveraging the complementary strengths of these approaches, researchers can navigate the complexity of the lipidome with unprecedented confidence and precision, transforming massive datasets into meaningful biological insights with potential clinical applications.
Overcoming Complexity: Strategies for Robust Lipid Identification and Quantitation
Addressing Ion Suppression and Matrix Effects in Biological Samples
Matrix effects represent a significant challenge in quantitative bioanalysis, particularly in liquid chromatography-tandem mass spectrometry (LC-MS/MS). These effects are defined as the alteration of mass spectrometric response for an analyte in a standard solution versus its response in a biological matrix such as plasma, serum, or urine [51]. This phenomenon manifests when co-eluting matrix components interfere with the ionization process of target analytes, leading to either ion suppression or enhancement, which ultimately compromises analytical accuracy, precision, and sensitivity [51] [52]. In the specific context of UHPLC-MS/MS lipidomic analysis for diabetes and hyperuricemia research, where samples contain complex biological matrices, understanding and controlling these effects becomes paramount for generating reliable data on lipid species alterations associated with these metabolic conditions [3] [53].
The fundamental vulnerability of MS/MS systems to matrix effects stems from their design, which can be compromised by matrix components that reduce sensitivity and selectivity regardless of the instrument's sophistication [51]. Both endogenous substances (such as salts, carbohydrates, lipids, peptides, and metabolites) and exogenous substances (including mobile phase additives, plasticizers, and anticoagulants) serve as primary sources of these interfering effects [51]. The U.S. Food and Drug Administration (FDA) emphasizes in its "Guidance for Industry: Bioanalytical Method Validation" that appropriate steps must be taken to ensure the lack of matrix effects throughout method application, especially when analyzing biological samples with varying physiological natures [51].
Ionization Mechanisms in ESI and APCI
The mechanisms underlying ion suppression differ significantly between the two most common atmospheric pressure ionization techniques: electrospray ionization (ESI) and atmospheric pressure chemical ionization (APCI). ESI is notably more susceptible to ion suppression due to its ionization mechanism, which occurs in the liquid phase before transfer to the gas phase [51] [52]. In HPLC-ESI-MS, matrix components suppress target analyte ion intensity through several mechanisms: (1) interfering with charge addition to the analyte in the liquid phase, (2) competing for available charges in the liquid phase, (3) increasing droplet viscosity and surface tension which reduces analyte transfer to the gas phase, and (4) co-precipitation of analytes with non-volatile materials that limits their gas phase transfer [51]. Additionally, in the gas phase, interfering substances can neutralize analyte ions or impact ion stability [51].
In contrast, APCI generally experiences less pronounced ion suppression because ionization occurs primarily in the gas phase after the liquid is vaporized in a heated stream [51] [52]. Theoretically, this eliminates competition for charge in the liquid phase and competition to enter the gas phase. However, APCI is not completely immune to matrix effects, which can occur through differences in electron affinity between compounds in the gas phase or through solid formation where analytes coprecipitate with non-volatile sample components [51] [52]. The primary mechanism in APCI involves the presence of numerous chargeable species in the gas phase competing with the target analyte to receive charge from the reagent gas [51].
Biological Matrix Components Causing Suppression
Table 1: Common Biological Matrix Components Causing Ion Suppression
| Matrix Component Category | Specific Examples | Primary Impact on Analysis |
|---|---|---|
| Endogenous Substances | Salts, urea, lipids, peptides, metabolites, phospholipids | Compete for ionization, increase droplet surface tension, co-precipitate with analytes |
| Exogenous Substances | Mobile phase additives (e.g., TFA), plasticizers (e.g., phthalates), anticoagulants (e.g., Li-heparin) | Introduce interfering compounds that co-elute with analytes |
| Phospholipids | Phosphatidylcholines, lysophosphatidylcholines | Major cause of ion suppression, reduce column lifetime, increase MS maintenance |
| Drug Metabolites | Co-administered medications and their metabolites | Cause drug-mediated ion suppression when co-eluting with target analytes |
The complexity of biological matrices introduces numerous potential sources of ion suppression. Phospholipids, particularly phosphatidylcholines and lysophosphatidylcholines, are among the most troublesome components in bioanalytical samples [54]. These compounds not only cause significant ion suppression but also shorten column lifetime and increase mass spectrometer maintenance requirements due to buildup on ion source components [54]. In lipidomic studies focused on diabetes and hyperuricemia, the inherent lipid-rich nature of samples amplifies these challenges, as the very compounds of interest (various lipid species) can themselves contribute to matrix effects [3] [53].
Detection and Assessment Methodologies
Experimental Protocols for Identifying Matrix Effects
Two well-established experimental protocols exist for evaluating the presence and extent of ion suppression in analytical methods. The post-column infusion assay provides comprehensive information about the chromatographic regions affected by matrix effects [52] [55]. This method involves continuously infusing a standard solution containing the analyte of interest into the mobile phase flow downstream from the analytical column using a syringe pump and tee union [55]. When a blank sample extract is injected into the HPLC system, a drop in the constant baseline signal indicates suppression of analyte ionization due to co-eluting interfering materials [52]. This approach effectively maps the retention times at which ion suppression occurs, providing valuable guidance for method optimization.
The post-extraction spiking method offers a complementary approach for quantifying the extent of ion suppression [52] [55]. This protocol involves comparing detector responses between: (1) calibration standards in pure solvent (representing ideal conditions with no suppression), (2) blank sample matrix spiked with identical analyte concentration after extraction (demonstrating the combined effect of ion suppression), and (3) blank sample matrix spiked before extraction (showing the impact of both sample preparation recovery and ion suppression) [55]. The percentage of ion suppression can be calculated quantitatively as (100 - B)/(A × 100), where A represents the unsuppressed signal and B represents the suppressed signal [52].
Workflow Visualization for Ion Suppression Assessment
Diagram 1: Workflow for comprehensive ion suppression assessment during method validation.
Validation Data from Lipidomics Studies
Table 2: Ion Suppression Assessment in Different Chromatographic Systems
| Chromatographic System | Ionization Mode | Ion Source Condition | Observed Ion Suppression Range | Effective Correction with IROA Workflow |
|---|---|---|---|---|
| Reversed-Phase (C18) | Positive | Cleaned | 8.3% (phenylalanine) to >50% for various lipids | Yes - restored linear response |
| Reversed-Phase (C18) | Positive | Uncleaned | 20% to >80% for multiple analytes | Yes - effective correction achieved |
| Ion Chromatography (IC) | Negative | Cleaned | Up to 97% (pyroglutamylglycine) | Yes - even extreme suppression corrected |
| Ion Chromatography (IC) | Negative | Uncleaned | 40% to nearly 100% | Yes for metabolites detected in both 12C/13C channels |
| HILIC | Positive | Cleaned | 15% to 75% across metabolites | Yes - consistent correction performance |
| HILIC | Negative | Uncleaned | 30% to >90% | Yes - maintained linearity after correction |
Recent advances in ion suppression assessment have revealed that all major chromatographic systems experience significant matrix effects across both ionization polarities [56]. A comprehensive study evaluating reversed-phase liquid chromatography (RPLC), ion chromatography (IC), and hydrophilic interaction liquid chromatography (HILIC) systems demonstrated ion suppression ranging from 1% to over 90% across detected metabolites [56]. Importantly, uncleaned ionization sources consistently exhibited significantly greater ion suppression than cleaned sources across all chromatographic platforms [56]. These findings underscore the universal nature of matrix effects and the necessity for robust detection and correction strategies, particularly in complex lipidomic analyses where numerous lipid species coexist in biological samples.
Strategic Approaches for Mitigating Matrix Effects
Sample Preparation Techniques
Effective sample preparation represents the first line of defense against matrix effects in bioanalysis. Protein precipitation, while simple and rapid, often proves inadequate for removing phospholipids and other interfering compounds, leaving samples vulnerable to significant ion suppression [54]. More sophisticated techniques such as solid-phase extraction (SPE) and liquid-liquid extraction (LLE) offer superior cleanup by selectively removing phospholipids and other matrix components [55] [54]. Specialized phospholipid removal plates (e.g., Phree plates) provide an effective compromise, offering simplicity similar to protein precipitation while delivering phospholipid removal comparable to optimized SPE methods [54].
Comparative studies demonstrate that samples prepared using phospholipid removal techniques show dramatically reduced matrix effects and maintain 2.5 times greater sensitivity after 250 injections compared to protein-precipitated samples [54]. Additionally, HPLC columns used with phospholipid-depleted samples exhibit significantly extended lifetimes, maintaining sensitivity where columns processing protein-precipitated samples show virtually complete signal loss after the same number of injections [54]. For lipidomics research, selective sample preparation that removes interfering compounds while preserving target lipid species is essential for accurate quantification.
Chromatographic Optimization
Chromatographic separation provides a powerful approach for mitigating ion suppression by resolving target analytes from interfering matrix components. Simply modifying the chromatographic conditions to shift the retention time of an analyte away from regions of high ion suppression can significantly improve data quality [55] [57]. This approach may involve adjusting mobile phase composition, gradient profiles, column temperature, or switching to a different stationary phase chemistry that provides alternative selectivity.
In practice, however, complete chromatographic resolution of all potential interfering substances is rarely achievable, particularly in untargeted lipidomic analyses where thousands of compounds coexist in biological samples [3] [57]. The implementation of ultra-high performance liquid chromatography (UHPLC) with sub-2μm particles provides enhanced chromatographic resolution and peak capacity, potentially separating analytes from matrix interferences that would co-elute in conventional HPLC systems [3]. For diabetes and hyperuricemia research, where samples contain diverse lipid classes with varying physicochemical properties, sophisticated chromatographic separation is essential for comprehensive lipid profiling while minimizing matrix effects.
Internal Standardization Strategies
The use of appropriate internal standards represents one of the most effective approaches for compensating for residual matrix effects that persist despite sample preparation and chromatographic optimization [56] [57]. Stable isotope-labeled internal standards (SIL-IS) containing deuterium (²H), carbon-13 (¹³C), or other heavy atoms are particularly valuable because they closely mimic the chemical and physical properties of target analytes, including chromatography and ionization behavior [57]. These compounds experience nearly identical matrix effects as their native counterparts, allowing for accurate correction of ionization suppression or enhancement.
Recent advances in internal standardization include the IROA (Isotopic Ratio Outlier Analysis) Workflow, which uses a stable isotope-labeled internal standard library and companion algorithms to measure and correct for ion suppression [56]. This approach adds IROA standards at known concentrations to each sample, then uses the suppression observed for these standards to correct quantitative data for native compounds. The method has demonstrated effective ion suppression correction across diverse analytical conditions, chromatographic systems, and biological matrices, making it particularly valuable for large-scale lipidomic studies [56].
Table 3: Internal Standard Strategies for Matrix Effect Compensation
| Internal Standard Type | Mechanism of Action | Advantages | Limitations |
|---|---|---|---|
| Stable Isotope-Labeled (SIL-IS) | Co-elutes with analyte, experiences identical suppression | Excellent compensation, widely available | Cost, availability for novel analytes |
| Structural Analogues | Similar chemical properties, different retention | More affordable, widely available | May not experience identical suppression |
| IROA Standards | 13C-labeled internal standard library | Corrects suppression across all analytes, identifies artifacts | Requires specialized algorithms and software |
| Standard Addition | Multiple spikes of analyte into sample extract | Compensates for specific sample matrix | Labor-intensive, requires multiple injections |
Application in Diabetes and Hyperuricemia Lipidomics
Lipidomic Workflow for Metabolic Disease Research
The investigation of lipid metabolism in diabetes and hyperuricemia presents particular challenges for mass spectrometric analysis due to the complex nature of the biological samples and the diverse lipid species involved [3] [53]. A typical workflow for such studies involves sample collection from patients and controls, lipid extraction using methods such as methyl tert-butyl ether (MTBE) extraction, UHPLC-MS/MS analysis, data processing, and statistical analysis [3]. At each stage, specific considerations for minimizing matrix effects must be implemented to ensure data quality.
In a recent study investigating lipidomic alterations in patients with diabetes mellitus combined with hyperuricemia (DH), researchers employed UHPLC-MS/MS-based untargeted lipidomic analysis that identified 1,361 lipid molecules across 30 subclasses [3]. The successful characterization of 31 significantly altered lipid metabolites between DH patients and healthy controls required careful management of matrix effects throughout the analytical process [3]. Similarly, research examining the impact of dietary interventions on athletes with hyperuricemia implemented comprehensive lipidomic and metabolomic approaches to quantify 1,074 lipids and metabolites from 94 classes, demonstrating the complex lipid alterations associated with uric acid metabolism [53].
Research Reagent Solutions for Lipidomics
Table 4: Essential Research Reagents for Lipidomic Analysis
| Reagent / Material | Function in Analysis | Application Notes |
|---|---|---|
| Phospholipid Removal Plates | Selective removal of phospholipids from samples | Dramatically reduces ion suppression, preserves column life |
| Stable Isotope-Labeled Lipid Standards | Internal standards for quantification | Correct for matrix effects, essential for accurate quantification |
| Methyl tert-butyl ether (MTBE) | Lipid extraction solvent | Effective for comprehensive lipid extraction from biological samples |
| UHPLC C18 Columns | Chromatographic separation of lipid species | 1.7-2.1μm particles provide high resolution for complex lipid mixtures |
| Ammonium formate | Mobile phase additive | Improves ionization efficiency in positive and negative modes |
| IROA Internal Standard Kit | Isotopic standards for suppression correction | Enables measurement and correction of ion suppression across analytes |
Integrated Strategy for Reliable Lipid Quantification
Diagram 2: Comprehensive workflow for reliable lipidomic analysis in diabetes and hyperuricemia research.
An integrated approach combining multiple mitigation strategies provides the most robust solution for addressing matrix effects in diabetes and hyperuricemia lipidomics. This begins with sample preparation optimized for phospholipid removal, followed by chromatographic conditions that separate analytes from residual matrix interferences, and culminates with isotope-labeled internal standards that correct for any remaining suppression effects [54] [56] [57]. For targeted analysis of specific lipid classes, careful selection of reference standards and stable isotope internal standards is essential, while untargeted approaches benefit from comprehensive standard mixtures and advanced correction algorithms like the IROA Workflow [56].
The application of these rigorous approaches to matrix effect management enables researchers to detect subtle but biologically significant alterations in lipid metabolism associated with diabetes and hyperuricemia. In the DH study, this allowed identification of specific triglycerides, phosphatidylethanolamines, and phosphatidylcholines that were significantly upregulated in patients, along with perturbations in glycerophospholipid and glycerolipid metabolism pathways [3]. Similarly, dietary intervention studies in athletes with hyperuricemia revealed alterations in plasmalogen phosphatidylcholines and acylcarnitines associated with improved uric acid metabolism [53]. Without appropriate management of matrix effects, these important findings could be obscured by analytical artifacts resulting from ion suppression.
Matrix effects and ion suppression present significant challenges in UHPLC-MS/MS lipidomic analysis, particularly in complex metabolic diseases such as diabetes and hyperuricemia where accurate quantification of lipid species is essential for understanding pathological mechanisms. The complex biological matrices associated with these conditions contain numerous compounds that interfere with analyte ionization, potentially compromising data quality and leading to erroneous conclusions. Successful management of these effects requires a systematic approach incorporating appropriate sample preparation, chromatographic optimization, and effective internal standardization.
For researchers investigating lipidomic alterations in diabetes and hyperuricemia, implementation of the strategies outlined in this review is essential for generating reliable, reproducible data. The comprehensive workflow combining phospholipid removal, stable isotope internal standards, and advanced correction algorithms provides a robust foundation for accurate lipid quantification. As lipidomics continues to evolve as a key tool for understanding metabolic diseases, maintaining rigorous approaches to matrix effect management will ensure that biological findings reflect true biochemical alterations rather than analytical artifacts. Through careful attention to these methodological considerations, researchers can advance our understanding of lipid metabolism in diabetes and hyperuricemia, potentially identifying novel biomarkers and therapeutic targets for these prevalent metabolic disorders.
In the field of lipidomics, particularly in the study of complex metabolic diseases such as diabetes mellitus (DM) and hyperuricemia (DH), the precise resolution of structural isomers represents a significant analytical challenge. Structural isomers—molecules sharing identical molecular formulas but differing in atomic connectivity or spatial arrangement—often exhibit distinct biological behaviors yet can produce nearly identical signals in mass spectrometry. Untargeted lipidomic analysis of patient plasma using UHPLC-MS/MS has identified 1,361 lipid molecules across 30 subclasses in DM and DH patients, revealing significant alterations in lipid species including triglycerides (TGs), phosphatidylethanolamines (PEs), and phosphatidylcholines (PCs) [3]. Without effective chromatographic separation, these critical isomer-specific variations remain obscured, potentially masking vital biomarkers and mechanistic insights into disease pathophysiology. This technical guide examines advanced strategies for resolving structural isomers through integrated chromatographic and tandem mass spectrometric approaches within the context of contemporary lipidomic research.
The Critical Role of Isomer Separation in Metabolic Disease Research
The pathophysiological significance of lipid isomers is increasingly recognized in metabolic disease research. In diabetes and hyperuricemia, specific alterations in lipid metabolic pathways—particularly glycerophospholipid metabolism and glycerolipid metabolism—have been identified as significantly perturbed [3]. These pathways involve numerous isomeric lipids that may function differently in disease states. For instance, a lipidomic study comparing DH, DM, and healthy controls found 31 significantly altered lipid metabolites, with 13 triglycerides, 10 phosphatidylethanolamines, and 7 phosphatidylcholines significantly upregulated in DH patients [3]. Positional isomers of these lipids may correlate differently with disease progression and complications.
The inability to resolve these isomers can lead to incomplete or misleading biological interpretations. As lipidomics advances toward clinical application, the demand for isomer-resolved analysis grows increasingly important for developing accurate diagnostic panels and understanding nuanced disease mechanisms [12]. The translational potential of lipid biomarkers depends heavily on the analytical specificity achieved through effective isomer separation.
Chromatographic Strategies for Isomer Separation
Chromatography remains the primary technique for separating isomers prior to mass spectrometric detection. The selection of appropriate stationary phases is crucial for achieving optimal resolution of structurally similar compounds.
Stationary Phase Selection for Different Isomer Types
Table 1: HPLC Column Selection Guide for Resolving Structural Isomers
| Isomer Type | Structural Characteristics | Recommended Column Chemistry | Separation Mechanism |
|---|---|---|---|
| Positional Isomers | Differ in functional group position on molecular structure | Phenyl Hydride [58] | π-π interactions with aromatic compounds |
| Geometric (Cis/Trans) Isomers | Differ in spatial arrangement around double bonds | UDC-Cholesterol [58] | Shape selectivity based on steric complementarity |
| Diastereomers | Differ at one or more (but not all) chiral centers | Conventional reversed-phase (C18) [58] | Combined hydrophobic and polar interactions |
| Empirical Isomers | Same empirical formula, different atomic arrangements | Diamond Hydride [58] | Polar interactions with hydride surface |
Ultra-High Performance Liquid Chromatography (UHPLC) in Lipidomics
Modern lipidomics research employs UHPLC systems with sub-2μm particles to achieve superior separation efficiency. In diabetes and hyperuricemia lipidomic studies, typical chromatographic conditions include:
- Column: Waters ACQUITY UPLC BEH C18 (2.1 × 100 mm, 1.7 μm) [3]
- Mobile Phase: A: 10 mM ammonium formate in water; B: 10 mM ammonium formate in acetonitrile-isopropanol [3]
- Gradient Elution: Optimized for comprehensive lipid separation with typical run times of 15-30 minutes
- Temperature Control: Maintained at constant temperature (e.g., 35°C) for retention time stability [59]
The enhanced efficiency of UHPLC provides greater peak capacity, enabling resolution of complex biological samples containing numerous isomeric species that would otherwise co-elute in conventional HPLC systems.
Alternative Chromatographic Approaches
Liquid-Liquid Chromatography (LLC) techniques, including Centrifugal Partition Chromatography (CPC), offer complementary approaches for challenging separations. In CPC, separation occurs between two immiscible liquid phases without solid stationary phases, leveraging differences in partition coefficients [60]. This technique is particularly valuable for preparative-scale isomer separations and can utilize greener solvent systems.
Diagram 1: Comprehensive workflow for isomer resolution in lipidomics, integrating chromatographic separation and mass spectrometric analysis.
Tandem Mass Spectrometry Techniques for Structural Elucidation
While chromatography separates isomers, tandem mass spectrometry provides the structural information necessary for their identification. Advanced fragmentation techniques and multi-stage mass analysis have significantly enhanced capabilities for isomer characterization.
MS2 and MS3 Analysis for Structural Characterization
Liquid chromatography-high-resolution MS3 (LC-HR-MS3) represents a powerful advancement for compound identification in complex matrices. In this approach:
- Full Scan MS1: Detects precursor ions with high mass accuracy (<5 ppm) [59]
- Data-Dependent Acquisition (DDA): Selects most abundant precursors for fragmentation
- MS2 Analysis: Generates primary product ions through collision-induced dissociation
- MS3 Analysis: Selects and fragments key MS2 product ions to obtain secondary fragmentation patterns [59]
This multi-stage approach provides deeper structural information, with studies demonstrating improved identification confidence for approximately 4-8% of analytes compared to conventional MS2 alone [59]. The additional fragmentation data is particularly valuable for distinguishing between isomeric compounds with similar primary fragmentation patterns.
Spectral Library Matching and Bioinformatics
The identification of isomers relies heavily on comparison to reference spectra in curated libraries. Two primary spectral matching algorithms are employed:
- Forward Search: Compares all peaks in unknown spectra against library spectra; penalizes extra peaks in unknown spectra [61]
- Reverse Search: Compares library spectrum peaks against unknown spectra; more tolerant of additional peaks in unknown spectra [61]
Library matching systems typically employ a scoring algorithm based on dot product calculations of mass peaks and their relative intensities, with scores normalized between 0-100 [61]. This quantitative approach facilitates confident isomer identification when combined with chromatographic retention time data.
Integrated Experimental Protocols for Isomer Resolution
Sample Preparation and Lipid Extraction
Proper sample preparation is foundational for reproducible isomer analysis in lipidomic studies:
- Biological Matrices: Plasma/serum samples from patient cohorts (e.g., 100-400 μL) [3] [11]
- Protein Precipitation: Using cold organic solvents (e.g., 375 μL acetonitrile to 125 μL serum) [59]
- Lipid Extraction: Liquid-liquid extraction with methyl tert-butyl ether (MTBE) or chloroform-methanol mixtures [3] [61]
- Sample Reconstitution: Dried extracts reconstituted in appropriate mobile phase compatible solvents [3]
Standardized protocols minimize artificial isomerization or degradation during sample handling, ensuring analytical fidelity.
Comprehensive UHPLC-MS/MS Analysis Method
Integrated methodology for isomer-resolved lipidomics:
- Chromatographic System: UHPLC with BEH C18 or similar columns (2.1 × 100 mm, 1.7 μm) [3]
- Mobile Phase: Ammonium formate or formic acid additives to enhance ionization [3] [59]
- Gradient Program: Optimized linear or nonlinear gradients (typically 10-30 minutes) [3] [11]
- Mass Spectrometer: High-resolution instrument (Q-TOF, Orbitrap) with ESI source [3] [20]
- Ion Source Parameters: Spray voltage 3.4-5.2 kV, source temperature 300-350°C [3] [59]
- Data Acquisition: Full scan MS1 (resolution ≥60,000) followed by data-dependent MS2 (resolution ≥15,000) [59]
Table 2: Key Research Reagent Solutions for Lipidomic Analysis of Isomers
| Reagent/Chemical | Specifications | Application Function |
|---|---|---|
| Ammonium Formate | MS-grade, 10 mM in mobile phases | Mobile phase additive for improved ionization efficiency [3] |
| Formic Acid | LC-MS grade, 0.05-0.1% in mobile phases | Mobile phase modifier for protonation in positive ion mode [59] |
| Methyl tert-Butyl Ether (MTBE) | HPLC grade | Lipid extraction solvent for comprehensive recovery [3] |
| Acetonitrile/Methanol | LC-MS grade | Protein precipitation and mobile phase components [3] [59] |
| Cholesterol-Based Columns | UDC-Cholesterol stationary phase | Separation of geometric isomers [58] |
| Phenyl Hydride Columns | Aromatic functionalized silica | Resolution of positional isomers [58] |
Data Processing and Statistical Analysis
- Peak Alignment: Retention time correction across samples
- Feature Detection: Extraction of chromatographic peaks for ions
- Isomer Annotation: Library matching with retention time and fragmentation data
- Multivariate Statistics: PCA, OPLS-DA to identify isomer patterns discriminating patient groups [3] [20]
- Pathway Analysis: MetaboAnalyst or similar platforms to map altered isomers to metabolic pathways [3]
Diagram 2: Tandem MS workflow for isomer identification, highlighting the role of multi-stage fragmentation in differentiating structurally similar compounds.
Applications in Diabetes and Hyperuricemia Lipidomics
The integration of isomer-resolution techniques has revealed previously overlooked aspects of lipid dysregulation in metabolic diseases. In DH patients, glycerophospholipid metabolism (impact value 0.199) and glycerolipid metabolism (impact value 0.014) have been identified as the most significantly perturbed pathways [3]. These pathways contain numerous isomeric species whose individual contributions to disease pathophysiology can now be investigated with greater specificity.
Comparative lipidomics of DH versus DM groups identified 12 differential lipids enriched in these core pathways [3], suggesting isomer-specific alterations associated with hyperuricemia complicating diabetes. Similarly, in diabetic retinopathy research, lipidomic profiling has identified specific triglyceride isomers (e.g., TAG58:2-FA18:1) as potential biomarkers for early detection [11]. Without effective isomer resolution, these specific molecular associations would remain obscured within composite lipid signals.
The resolution of structural isomers through advanced chromatographic and tandem MS techniques represents an essential capability in modern lipidomics research. As studies in diabetes, hyperuricemia, and related metabolic disorders increasingly reveal the pathway-specific nature of lipid disruptions, the need for isomer-level analysis becomes ever more critical. The integration of selective stationary phases, high-resolution separations, multi-stage mass spectrometry, and sophisticated bioinformatics provides a powerful toolkit for deciphering the complex lipidomic alterations underlying disease pathophysiology. Continuing advancements in these separation science methodologies will undoubtedly enhance our understanding of metabolic diseases and accelerate the discovery of clinically relevant lipid biomarkers.
Optimizing Collision Energies for Comprehensive Lipid Fragmentation
In the field of lipidomics research, particularly in the study of complex metabolic diseases such as diabetes mellitus (DM) and hyperuricemia (HUA), the precise structural annotation of lipids is paramount for understanding pathological mechanisms and identifying potential biomarkers [3] [62]. Ultrahigh-performance liquid chromatography coupled to tandem mass spectrometry (UHPLC-MS/MS) has become the gold standard for lipidomic analysis, offering high sensitivity and the ability to characterize hundreds of lipid species simultaneously [2] [1]. The reliability of lipid identification, however, critically depends on the quality of MS/MS spectra, which is directly influenced by the optimization of collision energies [45].
Fragmentation of lipid molecules in a mass spectrometer is achieved by applying collision energy to accelerate and collisionally activate precursor ions. The energy transferred during these collisions causes bonds to break, yielding product ions that reveal structural information about the lipid, including its polar head group and fatty acyl chain composition [45]. Optimizing this parameter is a delicate balance; insufficient energy results in inadequate fragmentation and poor structural information, while excessive energy can cause over-fragmentation, destroying diagnostic ions and reducing sensitivity [45]. This technical guide provides an in-depth examination of strategies for optimizing collision energies to achieve comprehensive lipid fragmentation, framed within the context of UHPLC-MS/MS lipidomic analysis in diabetes and hyperuricemia research.
The Critical Role of Fragmentation in Disease Lipidomics
The disruption of lipid homeostasis is a hallmark of several metabolic diseases. In hyperuricemia, characterized by elevated serum uric acid, and diabetes mellitus, a condition of impaired insulin secretion or resistance, specific alterations in lipid profiles have been observed [53] [3] [62]. Lipidomics studies have revealed that patients with combined diabetes and hyperuricemia (DH) exhibit significant perturbations in their plasma lipidome, including upregulated triglycerides (TGs), phosphatidylethanolamines (PEs), and phosphatidylcholines (PCs), alongside disruptions in glycerophospholipid metabolism and glycerolipid metabolism pathways [3].
Accurate identification of these lipid species is not a trivial task. The cellular lipidome encompasses a tremendous number of molecular species with a wide variety of structures [45]. For instance, phospholipid identification requires the determination of the polar head group, the length of the acyl chains, and their sn-1/sn-2 location on the glycerol moiety [45]. Such detailed structural information is biologically critical because the nature and position of acyl chains reflect the homeostatic balance between biosynthesis, remodeling, and degradation, and can indicate the pool of available fatty acids [45]. Consequently, optimized fragmentation that yields clear, interpretable MS/MS spectra is a prerequisite for meaningful biological conclusions in disease research.
Principles of Lipid Fragmentation
Diagnostic Ions for Structural Elucidation
The fragmentation patterns of lipids under different collision energies provide the foundation for their identification. Each major lipid class produces characteristic diagnostic ions that reveal its structure.
- Phospholipids: In negative ion mode, phosphatidylcholines (PCs) are typically detected as [M-CH₃]⁻ ions due to an in-source loss of a methenium group [45]. Their annotation relies on key diagnostic ions, including the deprotonated demethylated phosphocholine ion, carboxylate ions from the fatty acyl chains (e.g., oleate and palmitate), and demethylated lysophosphatidylcholine (LPC) ions formed by the loss of a fatty acid moiety [45]. The relative intensity of these carboxylate ions can also help determine the sn-1/sn-2 positional assignment of the fatty acyl chains on the glycerol backbone [45].
- Sphingolipids: Annotation of sphingolipids like ceramides (Cer) requires fragments corresponding to the sphinganine base moiety (e.g., d18:1) and the fatty acyl side chain [45].
The following table summarizes the primary diagnostic ions used for identifying major lipid classes in negative ion mode, which is particularly useful for determining fatty acyl chain composition [45].
Table 1: Key Diagnostic Ions for Lipid Identification in Negative Ion Mode
| Lipid Class | Precursor Ion Type | Diagnostic Ions and Their Structural Significance |
|---|---|---|
| Phosphatidylcholine (PC) | [M-CH₃]⁻ | • m/z 168.0423: Deprotonated demethylated phosphocholine.• RCOO⁻: Carboxylate ions from sn-1 & sn-2 fatty acyl chains.• [M-CH₃-RCOO⁻]⁻: Demethylated LPC ions from loss of sn-1 or sn-2 chain. |
| Phosphatidylethanolamine (PE) | [M-H]⁻ | • Neutral loss of 141 Da: Characteristic loss of the polar head group.• RCOO⁻: Carboxylate ions from fatty acyl chains. |
| Phosphatidylinositol (PI) | [M-H]⁻ | • Product ions from the inositol head group.• RCOO⁻: Carboxylate ions from fatty acyl chains. |
| Ceramide (Cer) | [M-H]⁻ | • Ions from the sphingoid base (e.g., for d18:1).• RCOO⁻: Carboxylate ion from the N-acylated fatty acid. |
The Challenge of Isomeric Lipids
Chromatographic separation provided by UHPLC is a powerful complement to MS/MS for resolving isomeric lipids that would otherwise be indistinguishable by mass alone [2]. For example, reversed-phase chromatography can separate lipids based on their acyl chain length and degree of unsaturation and is capable of resolving positional isomers of lysophospholipids and structural isomers of diacyl phospholipids and glycerolipids [2]. This separation is crucial because isobaric compounds can have different biological roles and disease associations. Retention time prediction, supported by machine learning models, has emerged as a valuable tool to enhance confidence in lipid annotation by providing an additional identification criterion [48].
Optimizing Collision Energy: A Practical Guide
Systematic Energy Ramping
The optimal collision energy is not a single value but a range that maximizes the intensity of key diagnostic fragments while maintaining a stable precursor ion. A systematic approach involves acquiring MS/MS spectra of lipid standards at progressively increasing collision energies.
A study optimizing conditions for phospholipid and sphingolipid analysis using 65 standard compounds demonstrated this process effectively [45]. For a standard like PC(16:0/18:1), the precursor ion [M-CH₃]⁻ was observed at m/z 744.5540. The diagnostic ions appeared at different energy thresholds:
- The demethylated phosphocholine ion (m/z 168.0423) was formed at 25 eV.
- The carboxylate ions (palmitate m/z 255.2334 and oleate m/z 281.2479) increased in intensity from 20 to 50 eV.
- The demethylated LPC ions (e.g., m/z 480.3098) were detected from 20 to 40 eV, with maximum intensity at 30 eV [45].
Based on such observations, a collision energy ramp between 20 and 40 eV was determined to be suitable for obtaining all six diagnostic ions for PC species with sufficient sensitivity and mass accuracy (Δ < 10 ppm) [45].
Class-Specific and Instrument-Specific Optimization
Optimal collision energy can vary significantly between lipid classes due to differences in their inherent stability and fragmentation pathways. Furthermore, the optimal value is highly dependent on the instrument type (e.g., Q-TOF, Orbitrap, triple quadrupole) and the specific collision cell design.
The table below provides generalized, optimized collision energy values for major lipid classes based on typical experimental conditions, which can serve as a starting point for further refinement on individual instruments.
Table 2: Optimized Collision Energy Ranges for Major Lipid Classes
| Lipid Class | Ionization Mode | Precursor Ion | Optimized Collision Energy (eV) | Critical Diagnostic Ions |
|---|---|---|---|---|
| Phosphatidylcholine (PC) | Negative | [M-CH₃]⁻ | 20-40 eV [45] | m/z 168.0, RCOO⁻, [M-CH₃-RCOO⁻]⁻ |
| Phosphatidylethanolamine (PE) | Negative | [M-H]⁻ | 25-35 eV | NL of 141 Da, RCOO⁻ |
| Phosphatidylinositol (PI) | Negative | [M-H]⁻ | 30-40 eV | Inositol fragments, RCOO⁻ |
| Ceramide (Cer) | Negative | [M-H]⁻ | 25-35 eV [45] | Sphingoid base, RCOO⁻ |
| Triglyceride (TG) | Positive | [M+NH₄]⁺ | 15-30 eV | [M+RCOO]⁺, [M+NH₃-RCOOH]⁺ |
The following diagram illustrates the recommended workflow for developing and applying optimized collision energies in a lipidomics study.
Workflow for Collision Energy Optimization
Integrated Workflow for Robust Lipid Identification
While optimized collision energies are fundamental, confident lipid identification in complex biological samples requires a multi-faceted approach that integrates several techniques [45] [48].
- Molecular Networking: This computational strategy, available through platforms like GNPS, organizes molecules based on the similarity of their MS/MS spectra, clustering structurally related lipids. This allows for the propagation of annotations from well-characterized standard compounds to unknown lipids within the same network cluster, facilitating the discovery of lipids involved in relevant biological processes [45].
- Retention Time (tR) Prediction: The combination of molecular networking with retention time prediction significantly reinforces lipid annotation. By comparing the experimental tR of an unknown lipid with a theoretical value predicted based on its structure, researchers can discriminate between isobaric compounds that have identical masses but different structures [45]. Machine learning models are increasingly used to build accurate tR prediction models, providing a powerful tool to minimize false positives [48].
- High-Mass-Accuracy Measurements: Using high-resolution mass spectrometers (e.g., Orbitrap, Q-TOF) to obtain accurate mass data (with mass error < 10 ppm) for both precursor and fragment ions is essential for assigning correct elemental compositions [45] [2].
Successful lipidomics methodology relies on a set of key reagents and computational tools.
Table 3: Essential Research Reagents and Resources for Lipidomics
| Item Name | Function/Application | Example/Specification |
|---|---|---|
| Synthetic Lipid Standards | Used for optimizing CE, building tR models, and quantitative calibration. | LIPID MAPS quantitative standards; e.g., PC(17:0/17:0), Cer(d18:1/17:0) [2]. |
| Internal Standards (IS) | Correct for matrix effects and variability in extraction/ionization; enable quantification. | Deuterated or ¹³C-labeled IS (e.g., PC(16:1/16:1-D₆), TG(16:0/16:0/16:0-¹³C₃)) [1]. |
| Chromatography Column | Separate complex lipid mixtures by hydrophobicity and isomerism. | Reversed-phase C18 column (e.g., Waters ACQUITY UPLC BEH C18, 1.7 µm) [2] [3]. |
| Mobile Phase Additives | Promote ionization and control LC peak shape. | Ammonium formate or acetate (∼10 mM); formic acid (0.1%) [2] [1]. |
| Data Processing Software | Peak detection, alignment, normalization, and identification. | MZmine 2 (open source) [45] [1]; vendor-specific software. |
| Molecular Networking Platform | Organize MS/MS data for annotation propagation. | GNPS (Global Natural Products Social Molecular Networking) [45]. |
The optimization of collision energies is a critical, non-trivial step in developing robust UHPLC-MS/MS methods for lipidomics. It requires a systematic, class-specific approach, ideally using authentic standards, to strike a balance that generates rich, informative fragmentation patterns. When this optimized fragmentation is integrated with advanced data analysis strategies—including molecular networking and retention time prediction—it creates a powerful framework for confident lipid annotation [45] [48]. This rigorous technical foundation is indispensable for uncovering meaningful lipid biomarkers and understanding the dysregulated metabolic pathways in complex diseases like diabetes and hyperuricemia, ultimately contributing to improved diagnostics and therapeutics.
In mass spectrometry-based lipidomics, the reliability of data is paramount, especially when investigating complex metabolic diseases such as diabetes mellitus (DM) and diabetes mellitus combined with hyperuricemia (DH). These conditions are characterized by significant alterations in lipid metabolism, as revealed by untargeted lipidomic profiling [32]. Ensuring data quality is not merely a preliminary step but a continuous process integrated throughout the analytical workflow. Quality control (QC) samples, particularly pooled QC (PQC) samples, and internal standards (IS) are foundational tools for mitigating technical variance, monitoring analytical performance, and guaranteeing that the observed biological variation is genuine [63] [64]. This guide details the best practices for implementing these quality control measures within the specific context of UHPLC-MS/MS lipidomic analysis for diabetes and hyperuricemia research.
Fundamentals of Quality Control in Lipidomics
The Role of Quality Control
Lipidomics data are susceptible to numerous sources of unwanted variation, including instrumental drift, matrix effects, and inconsistencies in sample preparation [63]. Quality control procedures are designed to:
- Monitor Analytical Precision: Track the stability and performance of the mass spectrometer over time.
- Correct for Batch Effects: Identify and adjust for systematic variations that occur between different analytical batches.
- Assess Data Quality: Provide metrics to determine the technical quality of the dataset and ensure the validity of subsequent biological conclusions [64].
Types of Quality Control Samples
Different QC samples serve distinct purposes in the quality assurance framework:
Table 1: Types of Quality Control Samples in Lipidomics
| QC Sample Type | Description | Primary Function | Preparation Context |
|---|---|---|---|
| Pooled QC (PQC) | A pooled mixture of small aliquots from all study samples [32]. | Accounts for analytical and sample preparation variance; used for signal correction and precision evaluation [64]. | Prepared from extracted samples or before extraction. |
| Surrogate QC (sQC) | A commercially available reference material (e.g., NIST SRM 1950) [63]. | Serves as a long-term reference (LTR); allows for inter-laboratory comparison and standardization [65]. | Acquired from commercial providers. |
| Blank Samples | A sample containing only the extraction solvents. | Identifies background contamination and carry-over from the LC-MS system. | Prepared alongside biological samples. |
Experimental Protocols for Quality Control
Preparation of Pooled QC Samples
The preparation of PQC samples is a critical step that directly influences their effectiveness.
- Protocol: A standard protocol involves collecting a 5 mL fasting morning blood sample from each subject. After centrifugation, 0.2 mL of the upper layer of plasma is aliquoted. A pooled QC sample is created by combining equal volumes from each individual plasma aliquot [32]. This creates a representative sample with a median lipid composition of the entire cohort.
- Best Practices: Studies comparing different PQC preparation methods highlight that the approach must be chosen carefully, as it can significantly impact downstream data quality, including the selection of biomarker candidates [64]. The PQC should be prepared in sufficient volume to be analyzed repeatedly throughout the acquisition sequence.
Integration into the LC-MS Sequence
The strategic placement of QC samples within the analytical run is crucial for effective monitoring.
- Sequence Placement: Pooled QC samples should be analyzed at the beginning of the sequence for initial column conditioning. Subsequently, they should be injected at regular intervals (e.g., every 4-10 samples) and at the end of the batch to monitor instrumental drift [64]. This design allows for the evaluation of signal stability over time.
- Data Processing: The data from these repeated PQC injections are used to assess measurement precision and, through various algorithms, to correct for analytical drift across batches [64].
Application in a Diabetes and Hyperuricemia Study
In a recent study investigating lipidomic profiles in DM and DH patients, researchers employed a rigorous QC protocol [32]. Fasting blood samples were collected from 17 patients in each group (DH, DM) and 17 healthy controls. The samples were processed, and the upper plasma layer was used to create a pooled QC sample. This PQC was then analyzed repeatedly alongside the study samples using UHPLC-MS/MS. The resulting data underwent multivariate analyses like PCA and OPLS-DA, which confirmed distinct lipidomic profiles among the groups, thereby validating the quality and robustness of the findings [32].
Data Quality Assessment and Rules
Establishing Data Quality Rules
Beyond laboratory QC, assessing the final data output against predefined rules is essential. Data quality rules act as guardrails to ensure data integrity.
Table 2: Core Data Quality Rules for Lipidomic Data
| Quality Dimension | Data Quality Rule | Application in Lipidomics |
|---|---|---|
| Completeness | Empty/Blank Fields | Identifies lipids with a high percentage of missing values, which may need to be filtered out before statistical analysis [66]. |
| Uniqueness | Unique Values | Ensures unique identifiers for each sample are not duplicated. |
| Conformity | String Format Match | Validates that lipid nomenclature follows standardized formatting (e.g., PC(36:1)) [66]. |
| Accuracy | Data Type Match | Confirms that concentration values are numerical and not text strings. |
| Timeliness | Freshness | Ensures that the data asset is up-to-date, reflecting the latest processing version [66]. |
| Consistency | Custom Rules | Checks for logical relationships, e.g., that the total area of a lipid class is consistent with the sum of its individual species. |
Handling Missing Values
Lipidomics datasets frequently contain missing values, which can be categorized as Missing Completely at Random (MCAR), Missing at Random (MAR), or Missing Not at Random (MNAR)—the latter often due to lipid abundance falling below the limit of detection [63]. Best practices for handling missing data include:
- Filtering: Remove lipid species with a high percentage of missing values (e.g., >35%) [63].
- Imputation: Use informed imputation methods. k-nearest neighbors (kNN)-based imputation has been recommended for MCAR and MNAR data in shotgun lipidomics, while imputation by a percentage of the lowest concentration is also a common and effective strategy for MNAR [63].
The Scientist's Toolkit
Table 3: Essential Research Reagent Solutions for UHPLC-MS/MS Lipidomics
| Item | Function |
|---|---|
| Pooled QC Sample | Monitors analytical precision and corrects for inter-batch variation; represents the median lipidome of the cohort [64]. |
| Surrogate QC (e.g., NIST SRM 1950) | Provides a long-term, standardized reference material for inter-laboratory comparison and quality assurance [63]. |
| Internal Standards (IS) | Corrects for variability in sample preparation, extraction efficiency, and instrument response; essential for accurate quantification [65]. |
| Methyl tert-butyl ether (MTBE) | A common organic solvent used in liquid-liquid extraction methods for comprehensive lipid isolation from plasma [32]. |
| Ammonium Formate | A mobile phase additive in UHPLC that improves ionization efficiency and helps control pH for robust chromatographic separation [32]. |
| Quality Control (QC) Samples | A broad term encompassing pooled and surrogate QCs, used for system suitability testing and continuous performance monitoring [65]. |
Workflow Visualization
The following diagram illustrates the integrated workflow for ensuring data quality from sample collection to data analysis, specifically within a diabetes and hyperuricemia lipidomics study.
Lipidomics QC Workflow
The path to robust and reproducible lipidomic findings in diabetes and hyperuricemia research is paved with rigorous quality control. The consistent use of pooled quality control samples and appropriate internal standards throughout the UHPLC-MS/MS workflow is non-negotiable. By adhering to the detailed protocols and data quality rules outlined in this guide, researchers can confidently identify true biological signatures, such as the perturbations in glycerophospholipid and glycerolipid metabolism characteristic of diabetes and hyperuricemia, while minimizing the impact of technical artifacts [32]. As the field advances, the standardization of these QC practices will be instrumental in translating lipidomic discoveries into clinically actionable insights.
Lipidomics, the large-scale study of pathways and networks of cellular lipids in biological systems, has become an indispensable tool for understanding metabolic diseases such as diabetes mellitus (DM) and hyperuricemia (HU) [67]. However, the field faces a significant reproducibility challenge that threatens the validity of biological findings and their translation into clinical applications. Studies reveal alarming inconsistencies in lipid annotation; when identical LC-MS spectra are processed through different software platforms (MS DIAL and Lipostar), the agreement on lipid identifications can be as low as 14.0% using default settings and only 36.1% even with fragmentation data [68]. This reproducibility gap represents a critical bottleneck, particularly in diabetes and hyperuricemia research where subtle lipid alterations may serve as key diagnostic biomarkers or therapeutic targets. The fundamental challenge lies in the immense structural diversity of lipids—estimated to include between 1,000 to over 180,000 molecular species—coupled with limitations in current analytical approaches to fully resolve this complexity [69]. This technical guide examines the core bioinformatic challenges underlying these reproducibility issues and provides actionable strategies to enhance the reliability of lipid annotation in metabolic disease research.
Core Challenges in Lipid Annotation
The journey toward reproducible lipid annotation begins with recognizing the multiple sources of variability inherent in UHPLC-MS/MS workflows. A primary challenge stems from the insufficient structural resolution provided by conventional tandem mass spectrometric experiments, which often cannot determine double bond positions, stereochemistry, or the precise sn-positions of fatty acyl chains on the glycerol backbone [69]. This limitation frequently leads to ambiguous annotations where researchers cannot distinguish between isomeric lipid species that may have distinct biological functions.
Co-elution presents another significant hurdle, particularly for complex lipid classes like triglycerides (TGs). In one analysis of human plasma, 40% of features with lipid annotations contained at least two co-eluting lipids, with an average of 7 co-eluting TGs identified per feature [69]. This co-elution problem is exacerbated in biological samples from patients with metabolic diseases, where lipid metabolism is often dysregulated, leading to more complex lipid profiles.
The inconsistency across bioinformatic platforms further compounds these analytical challenges. Different software tools employ distinct algorithms for peak picking, alignment, and identification, often producing substantially different results from identical raw data [68]. These discrepancies arise from multiple factors, including varying implementations of lipid identification algorithms, different default settings for mass tolerance and peak detection, and the use of diverse lipid libraries (LipidBlast, LipidMAPS, ALEX123, METLIN) with non-overlapping content [68].
Annotation Standards and Reporting Practices
Beyond technical limitations, inconsistent application of lipid annotation standards represents a major reproducibility barrier. The lipidomics community has established shorthand notation systems to communicate the level of structural detail experimentally confirmed [69]. Specifically, a slash "/" should be used only when the positions of fatty acyl chains on the glycerol backbone are known, whereas an underscore "_" indicates certainty about fatty acyl constituents but not their positions. Despite these guidelines, analyses of published literature reveal widespread inconsistent usage, with researchers often incorrectly using "/" when positional isomers have not been experimentally determined [69].
This problem is perpetuated by lipid identification software that frequently employs "/" by default regardless of the actual level of structural evidence [69]. The confusion is particularly pronounced for ether-linked lipids (plasmanyl and plasmenyl species), which have the same molecular formula but differ in the degree of unsaturation of their ether linkage, making them indistinguishable by exact mass alone [69]. Without rigorous application of community standards, annotations convey false levels of certainty, leading to erroneous biological interpretations that are irreproducible across research groups.
Table 1: Common Lipid Annotation Errors and Their Impacts
| Annotation Error | Example | Correct Annotation | Impact on Biological Interpretation |
|---|---|---|---|
| Using "/" for unknown sn-positions | PC(16:0/18:1) without experimental sn-position evidence | PC(16:0_18:1) | Misassignment of enzymatic activity in lipid remodeling pathways |
| Ether lipid misidentification | PE(O-38:6) without distinguishing vinyl ether from ether | PE(O-38:6) and PE(P-38:5) both reported | Overlooked biological specificity of plasmenyl lipids in signaling |
| Overreliance on exact mass only | Identification based solely on m/z without MS/MS | Reporting as putative annotation with appropriate confidence level | False positive identifications of biomarkers |
Methodologies for Enhanced Lipid Annotation
Integrated MS/MS and Retention Time Approaches
Substantial improvements in annotation confidence can be achieved by combining multiple orthogonal data dimensions. The integration of tandem mass spectrometry (MS/MS) with retention time (tR) prediction creates a powerful framework for verifying lipid identities. Research demonstrates that molecular networking combined with tR prediction enables annotation of over 150 unique phospholipid and sphingolipid species in human corneal epithelial cells, with the tR comparison providing critical validation that reinforced MS/MS-based annotations [45].
For diabetes and hyperuricemia research, implementing a structured workflow for MS/MS spectral acquisition is essential. As illustrated in [45], collision energy must be carefully optimized for different lipid classes to generate comprehensive fragmentation patterns. For example, phosphatidylcholines (PCs) in negative ion mode require a collision energy ramp of 20-40 eV to produce six diagnostic ions: demethylated phosphocholine ion, both fatty acyl carboxylate ions, and both demethylated lysophosphatidylcholine ions [45]. This systematic approach to fragmentation ensures that sufficient structural information is captured to distinguish between lipid isomers that may be relevant in metabolic diseases.
Retention time prediction provides an independent validation metric that is particularly valuable for separating isobaric lipids that co-fragment. By building retention time models from standard compounds, researchers can compare experimental tR values with theoretical predictions to filter implausible identifications [45]. This approach is especially relevant for diabetes and hyperuricemia studies, where dysregulated lipid metabolism may produce unusual lipid species that challenge identification algorithms.
Standardized Experimental Protocols
Sample Preparation and LC-MS/MS Analysis For plasma/serum samples from diabetic and hyperuricemic patients, a modified Folch extraction using chilled methanol/chloroform (1:2 v/v) supplemented with 0.01% butylated hydroxytoluene (BHT) is recommended to prevent lipid oxidation [68]. The addition of internal standards, such as the Avanti EquiSPLASH LIPIDOMIX quantitative MS standard mixture, should occur before extraction to correct for recovery variations [68].
Chromatographic separation should be performed using UHPLC systems with C18 columns (e.g., Waters ACQUITY UPLC BEH C18, 2.1 × 100 mm, 1.7 μm) maintained at 45°C [3]. Mobile phase composition should consist of A: 10 mM ammonium formate in water/acetonitrile and B: 10 mM ammonium formate in acetonitrile/isopropanol, with a gradient elution from 40% B to 99% B over 5-10 minutes [3] [68]. For specialized applications, ultrahigh-performance supercritical fluid chromatography (UHPSFC)/MS provides complementary separation selectivity, particularly for neutral lipids [70].
Mass spectrometry detection should employ both positive and negative ionization modes with switching to capture the full lipidome diversity. Instrument parameters must be optimized for each lipid class; for instance, phosphatidylcholines analyzed in negative mode require specific collision energies to produce characteristic fragment ions including the demethylated phosphocholine ion (m/z 168.0423) and fatty acyl carboxylate ions [45].
Quality Control Procedures Implementing rigorous quality control is paramount for reproducible lipid annotation. This includes:
- Analysis of quality control (QC) samples derived from pooled study samples throughout the analytical sequence
- Regular injection of system suitability standards to monitor instrument performance
- Use of standardized reference materials like NIST 1950 reference plasma for inter-laboratory comparability [70]
- Monitoring of retention time stability, mass accuracy, and peak intensity in QC samples throughout the batch
Table 2: Key Diagnostic Ions for Major Lipid Classes in Diabetes/Hyperuricemia Research
| Lipid Class | Ionization Mode | Diagnostic Ions | Structural Information Provided |
|---|---|---|---|
| Phosphatidylcholine (PC) | Negative | m/z 168.0423 [demethylated phosphocholine], m/z 255.2334 [16:0], m/z 281.2479 [18:1] | Head group confirmation, fatty acyl composition, sn-positions based on intensity ratios |
| Phosphatidylethanolamine (PE) | Positive | Neutral loss of m/z 141.0191 | Head group identification |
| Ceramide (Cer) | Positive | m/z 264.2687 [d18:1 sphingoid base] | Sphingoid base confirmation |
| Triglycerides (TG) | Positive | m/z [M+NH4]+ fragments corresponding to diacylglycerol ions | Fatty acyl composition (but not positions) |
Bioinformatic Strategies for Reproducible Annotation
Computational Workflows and Standardization
Addressing the reproducibility crisis requires implementing standardized computational workflows that transparently document each processing step. The emergence of code-based frameworks in R and Python provides modular, interoperable components for statistical processing and visualization that enhance reproducibility [71]. These workflows should include:
- Data preprocessing with tools like MzMine 2 for peak detection, alignment, and gap filling [45]
- Lipid identification using multiple software platforms (MS DIAL, Lipostar) to cross-validate results
- Manual curation of putative identifications, especially for conflicting annotations between platforms
- Data normalization using quality control-based approaches like LOESS (Locally Estimated Scatterplot Smoothing) or SERRF (Systematic Error Removal using Random Forest) to correct for batch effects [71]
A critical advancement is the adoption of molecular networking through platforms like GNPS, which organizes MS/MS spectra based on similarity, allowing researchers to leverage the collective fragmentation patterns of structurally related lipids to annotate unknown features [45]. This approach is particularly powerful for discovering novel lipid species that may be dysregulated in diabetes and hyperuricemia.
The Lipidomics Standards Initiative (LSI) provides community-approved guidelines for major lipidomics workflows, including sample collection, storage, data deconvolution, and reporting [72]. Adherence to these standards, along with implementation of FAIR (Findable, Accessible, Interoperable, Reusable) data principles, is essential for improving cross-laboratory reproducibility [71].
Advanced Computational Approaches
Emerging computational methods offer promising avenues for enhancing annotation confidence. Support vector machine (SVM) regression combined with leave-one-out cross-validation can identify potential false positive identifications by detecting outliers in retention time patterns [68]. This data-driven quality control approach complements traditional library matching by flagging annotations with aberrant chromatographic behavior.
Machine learning frameworks are increasingly being applied to lipid annotation challenges. For instance, MS2Lipid has demonstrated up to 97.4% accuracy in predicting lipid subclasses from MS/MS spectra [67]. These models can significantly reduce false annotations, particularly for lipids that lack reference standards.
For diabetes and hyperuricemia research, pathway analysis tools like MetaboAnalyst provide critical biological context by identifying metabolic pathways enriched with dysregulated lipids [3] [73]. In patients with diabetes and hyperuricemia, glycerophospholipid metabolism and glycerolipid metabolism consistently emerge as significantly perturbed pathways, highlighting their central role in disease pathophysiology [3].
Application to Diabetes and Hyperuricemia Research
Lipidomic Signatures in Metabolic Diseases
Lipidomic studies in diabetes and hyperuricemia reveal characteristic alterations in specific lipid classes that serve as both biomarkers and potential mediators of pathology. In patients with combined diabetes and hyperuricemia (DH), 31 significantly altered lipid metabolites have been identified compared to healthy controls, including 13 triglycerides (TGs), 10 phosphatidylethanolamines (PEs), and 7 phosphatidylcholines (PCs) that were significantly upregulated, while one phosphatidylinositol (PI) was downregulated [3]. These changes predominantly affect glycerophospholipid metabolism (impact value 0.199) and glycerolipid metabolism (impact value 0.014), highlighting these as core disrupted pathways in DH patients [3].
The reproducibility of lipid annotation is particularly critical for identifying valid biomarkers in these conditions. For example, specific ceramides and phosphatidylcholines have been associated with cardiovascular risk, which is elevated in both diabetes and hyperuricemia [67]. Without rigorous annotation practices, false positive identifications can lead to incorrect associations and hinder clinical translation.
Biological Implications of Lipid Alterations
The dysregulated lipid species in diabetes and hyperuricemia are not merely biomarkers but active participants in disease mechanisms. Sphingolipids, particularly ceramides, mediate apoptosis through caspase-3 dependent mechanisms and inflammation through the release of cytokines such as IL-1β or IL-6 [45]. Arachidonic acid, primarily derived from phospholipid cleavage, functions as a pro-inflammatory fatty acid that may contribute to the inflammatory state characteristic of both conditions [45].
The diagram below illustrates the interconnected lipid pathways dysregulated in diabetes and hyperuricemia:
Diagram 1: Lipid Pathways in Diabetes-Hyperuricemia
The diagram illustrates how dysregulated lipid metabolism contributes to the pathophysiology of diabetes and hyperuricemia through multiple interconnected pathways. Triglyceride synthesis leads to hypertriglyceridemia, which promotes insulin resistance. Simultaneously, glycerophospholipid metabolism generates pro-inflammatory mediators, while sphingolipid metabolism produces ceramides that further exacerbate insulin resistance and promote apoptosis. Hyperuricemia contributes to oxidative stress, creating a vicious cycle of lipid peroxidation and inflammation.
Table 3: Essential Research Reagents and Computational Tools for Lipid Annotation
| Resource Category | Specific Tools/Reagents | Function/Purpose | Application in Diabetes/HU Research |
|---|---|---|---|
| Internal Standards | Avanti EquiSPLASH LIPIDOMIX | Quantitative mass spectrometry internal standard | Correction for recovery variations in patient samples |
| Reference Materials | NIST 1950 Reference Plasma | Inter-laboratory standardization and normalization | Harmonizing lipid concentrations across study sites |
| Chromatography Columns | Waters ACQUITY UPLC BEH C18 (1.7 μm) | Reversed-phase separation of lipid species | Separation of complex lipid mixtures from patient sera |
| Lipid Identification Software | MS DIAL, Lipostar, LipidSearch | Peak picking, alignment, and lipid annotation | Cross-platform validation of lipid identities |
| Molecular Networking | GNPS Platform | Organization of MS/MS spectra by structural similarity | Discovery of novel lipid species in disease states |
| Statistical Processing | R (ggplot2, mixOmics), Python (seaborn, matplotlib) | Statistical analysis and visualization of lipidomic data | Identification of dysregulated lipid patterns |
| Pathway Analysis | MetaboAnalyst 5.0 | Metabolic pathway enrichment analysis | Linking lipid alterations to biological pathways |
| Data Standards | Lipidomics Standards Initiative (LSI) Guidelines | Standardized reporting and methodology | Ensuring reproducibility across research groups |
Improving reproducibility in lipid annotation requires a multifaceted approach that addresses both analytical and computational challenges. Key strategies include the orthogonal combination of MS/MS spectral data with retention time information, implementation of standardized experimental and computational workflows, rigorous application of lipid annotation guidelines, and adoption of quality control measures throughout the analytical pipeline. For diabetes and hyperuricemia research, these practices are particularly crucial as the field moves toward clinical translation of lipid-based biomarkers.
Future developments in artificial intelligence-driven annotation, ion mobility spectrometry, and community-wide standardization efforts hold promise for further enhancing reproducibility. The integration of these advanced technologies with rigorous manual curation represents the most promising path forward for generating reliable, biologically meaningful lipid annotations that can advance our understanding of metabolic diseases and support the development of novel diagnostic and therapeutic approaches.
Translating Data to Diagnostics: Biomarker Validation and Cross-Study Comparison
Biomarkers are measurable indicators of biological processes, pathogenic states, or pharmacological responses to therapeutic intervention, serving as essential tools throughout drug development and clinical practice [74]. In the context of complex metabolic disorders like diabetes mellitus (DM) and hyperuricemia, biomarkers provide objective measurements that guide patient stratification, therapy selection, and treatment monitoring, thereby empowering molecular diagnostics and personalized medicine [74]. The application of "omics" technologies to biological samples can generate hundreds to thousands of biomarker candidates; however, a discouragingly small number successfully navigate the pipeline to clinical use [75]. This bottleneck exists largely due to the incredible mismatch between the large numbers of biomarker candidates and the paucity of reliable assays and methods for validation studies [75]. For conditions like diabetes combined with hyperuricemia (DH), where global prevalence is increasing and disease mechanisms are complex, robust biomarkers are desperately needed to enable early detection, improve diagnostic precision, and facilitate targeted interventions [3].
The journey from biomarker discovery to clinical implementation follows a structured pipeline designed to ensure scientific rigor, reproducibility, and clinical utility. This process is particularly relevant for biomarkers identified through advanced analytical techniques like UHPLC-MS/MS-based lipidomic analysis, which can provide comprehensive profiles of lipid metabolites in metabolic diseases [3] [16]. By understanding and optimizing this validation pipeline, researchers can improve the translation of promising biomarker candidates from laboratory discoveries to clinically useful diagnostic tools, ultimately advancing precision medicine for metabolic disorders.
Pipeline Stages and Attrition Rates
The biomarker development pipeline consists of multiple sequential stages, each with specific objectives and criteria for advancement. The major stages include biomarker candidate identification, prioritization, verification, and clinical validation [75]. Discovery efforts typically generate hundreds to thousands of candidate biomarkers, but only a minute fraction (approximately 0.1% of potentially clinically relevant cancer biomarkers) progress to routine clinical use [76]. This high attrition rate reflects the stringent requirements for clinical implementation and the numerous challenges encountered throughout the development process.
The validation pipeline represents a significant bottleneck, particularly the transition from candidate identification to clinical application [75]. This challenge is exemplified in the field of protein biomarkers, where diminishingly few new protein biomarkers achieve FDA approval despite extensive discovery efforts [75]. The disconnect between biomarker discovery output and clinical translation has created a "tar pit" in the verification stage, where promising candidates often become stuck due to inadequate validation methods and resources [75].
Key Challenges in Biomarker Translation
Several formidable challenges contribute to the low success rate of biomarker development:
- Technical Variability: Reproducibility of biomarker analysis is often compromised by disease heterogeneity, inter-individual variability, sample quality differences, and operational variations across laboratories [74].
- Analytical Limitations: Conventional technologies frequently lack the sensitivity to detect low-concentration biomarkers or those resulting from disease-associated mutations, aberrant post-translational modifications, or alternative splicing [75].
- Clinical Relevance: Many candidates that show statistical significance in discovery studies lack specificity for particular clinical applications or represent generalized inflammatory responses rather than disease-specific signals [75].
- Regulatory Hurdles: Meeting regulatory requirements for biomarker validation is a lengthy, resource-intensive process requiring extensive collaboration between researchers, regulatory experts, and clinicians [77].
- Economic Constraints: The cost of bringing a biomarker to market is extremely high and often requires co-development with a pharmaceutical product, creating significant financial barriers [78].
For metabolic disorders like diabetes and hyperuricemia, these challenges are compounded by the complex interplay of genetic, environmental, and metabolic factors that drive disease progression and manifestation [3]. Understanding these challenges is essential for developing strategies to overcome them and improve the efficiency of biomarker translation.
Biomarker Discovery and Identification
Discovery Approaches and Technologies
Biomarker discovery employs both hypothesis-driven and data-driven approaches to identify potential biomarkers correlated with disease pathways, therapeutic targets, or measurable clinical outcomes [74]. Omics technologies provide comprehensive, system-level insights into biomolecular processes, uncovering variations that underlie disease-associated cellular behavior and phenotype [74]. For complex metabolic disorders like diabetes and hyperuricemia, lipidomics has emerged as a particularly powerful discovery approach.
Lipidomics, a branch of metabolomics, is an effective tool for studying changes in lipid metabolism in organisms and the role of lipid regulation in life activities [3]. This approach allows identification of individual lipid species and characterization of their specific biological roles, making it well-suited to characterize lipid perturbations that precede diabetes [3]. Ultra-high performance liquid chromatography-tandem mass spectrometry (UHPLC-MS/MS) has become the cornerstone of lipidomic research due to its high sensitivity, broad dynamic range, and extensive metabolite coverage [3] [16] [79].
UHPLC-MS/MS in Lipidomic Biomarker Discovery
The application of UHPLC-MS/MS in lipidomic analysis enables comprehensive profiling of lipid changes in metabolic diseases. In a recent study investigating lipidomic alterations in patients with diabetes mellitus combined with hyperuricemia (DH), researchers identified 1,361 lipid molecules across 30 subclasses using UHPLC-MS/MS-based untargeted lipidomic analysis [3]. Multivariate analyses revealed a significant separation trend among the DH, DM, and normal glucose tolerance (NGT) groups, confirming distinct lipidomic profiles [3].
The discovery phase pinpointed 31 significantly altered lipid metabolites in the DH group compared to NGT controls [3]. Among the most relevant individual metabolites, 13 triglycerides (TGs), 10 phosphatidylethanolamines (PEs), and 7 phosphatidylcholines (PCs) were significantly upregulated, while one phosphatidylinositol (PI) was downregulated [3]. This detailed lipidomic profiling provides a rich source of candidate biomarkers for further validation.
Similar approaches have been applied to type 2 diabetes mellitus (T2DM) research, where UHPLC-MS analysis of serum samples identified 1162 lipid metabolites, of which 267 were significantly altered in the T2DM group [16]. Through rigorous statistical analysis, 11 lipids were identified as potential biomarkers with significant correlations to T2DM-related physiological parameters such as 2h-loaded blood glucose and HbA1c [16].
Table 1: Key Lipid Classes Identified in Diabetes and Hyperuricemia Research
| Lipid Class | Abbreviation | Change in Disease State | Potential Clinical Significance |
|---|---|---|---|
| Triglycerides | TG | Upregulated in DH [3] | Associated with insulin resistance and metabolic dysfunction |
| Phosphatidylethanolamines | PE | Upregulated in DH [3] | Linked to membrane fluidity and cell signaling abnormalities |
| Phosphatidylcholines | PC | Upregulated in DH [3] | Involved in lipoprotein metabolism and inflammation |
| Phosphatidylinositol | PI | Downregulated in DH [3] | Related to insulin signaling pathways |
| Lysophosphatidylinositol | LPI | Identified as potential biomarker in T2DM [16] | Proposed as candidate for diagnostic biosignature |
Data Analysis and Candidate Selection
Following data acquisition, sophisticated bioinformatics and statistical approaches are employed to identify promising biomarker candidates. Data processing typically involves peak recognition, peak extraction, peak alignment, and integration [80]. Statistical methods such as principal component analysis (PCA) and orthogonal partial least squares discriminant analysis (OPLS-DA) are used to observe sample distribution patterns and identify differentially expressed metabolites [3] [80].
In the DH study, Student's t-test and multiple of difference (FC) were used to initially screen differential lipid molecules and determine their trends [3]. Similarly, in the T2DM research, variable importance in projection (VIP) scores, p-values, and fold change thresholds were applied to identify candidate lipid predictors [16]. These statistical approaches help prioritize the most promising biomarkers for further validation, focusing on those with the greatest discriminatory power and biological relevance.
Analytical Validation: Establishing Robust Biomarker Assays
Assay Development and Performance Evaluation
Once candidate biomarkers are identified, the focus shifts to assay development and analytical validation. This phase involves creating reliable detection methods and rigorously evaluating assay performance parameters to ensure accurate and reproducible biomarker measurement [74]. Analytical validation assesses multiple parameters, including selectivity, accuracy, precision, recovery, sensitivity, reproducibility, and stability [78].
The level of validation required depends on the intended use of the biomarker, with different standards applying to research use only, clinical research, or clinical diagnostics [78]. For assays intended for clinical use, compliance with standards such as the Clinical Laboratory Improvement Amendments (CLIA) is essential [78]. The Clinical Laboratory and Standards Institute (CLSI) guidelines provide a framework for biomarker validation that reduces the risk of technical or analytical failure [78].
Advanced Technologies for Biomarker Validation
While traditional methods like ELISA have long been the gold standard for biomarker validation, advanced technologies such as liquid chromatography-tandem mass spectrometry (LC-MS/MS) and Meso Scale Discovery (MSD) offer superior precision, sensitivity, and efficiency [76]. LC-MS/MS surpasses ELISA in sensitivity, making it particularly useful for detecting low-abundance species [76]. MSD, utilizing electrochemiluminescence detection, provides up to 100 times greater sensitivity than traditional ELISA and enables multiplexed analysis of multiple biomarkers simultaneously [76].
The economic advantages of these advanced technologies are significant. For example, measuring four inflammatory biomarkers using individual ELISAs costs approximately $61.53 per sample, while using MSD's multiplex assay reduces the cost to $19.20 per sample – a savings of $42.33 per sample [76]. This combination of improved performance and reduced cost makes advanced platforms increasingly attractive for biomarker validation.
Validation in Lipidomics Research
In lipidomic studies, analytical validation ensures that lipid biomarker measurements are accurate, precise, and reproducible across different samples and batches. The DH study implemented rigorous quality control procedures, including mixing equal groups of samples as quality control samples and inserting them randomly into the assay sequence [3]. This approach helps monitor analytical performance and identify potential technical variations.
Sample preparation is another critical aspect of analytical validation in lipidomics. The DH study employed a standardized protocol involving protein precipitation with pre-cooled methanol, lipid extraction with methyl tert-butyl ether (MTBE), and reconstitution in isopropanol [3]. Similarly, the T2DM research used a detailed sample pre-treatment method involving methanol and MTBE extraction followed by vacuum freeze-drying and reconstitution [16]. Standardizing these procedures minimizes pre-analytical variability and ensures result consistency.
Table 2: Essential Research Reagents for UHPLC-MS/MS Lipidomic Analysis
| Reagent/Equipment | Function in Workflow | Technical Specifications |
|---|---|---|
| Methyl tert-butyl ether (MTBE) | Lipid extraction from biological samples | HPLC-MS grade [16] |
| Ammonium acetate | Mobile phase additive for chromatographic separation | 5-10 mmol/L in mobile phase [3] [16] |
| UPLC BEH C18 or C8 column | Chromatographic separation of lipid molecules | 2.1 mm × 100 mm, 1.7 μm particle size [3] [16] |
| Pre-cooled methanol | Protein precipitation and lipid extraction | Maintained at 4°C [3] |
| Deuterated internal standards | Quality control and quantification reference | Added to extraction solvent [79] |
| ACQUITY UPLC system | Ultra-performance liquid chromatography separation | Coupled with mass spectrometer [16] |
Clinical Validation and Qualification
Establishing Clinical Validity
Clinical validation represents a critical stage where biomarker candidates are evaluated in well-designed clinical studies to establish their relationship with clinical endpoints. This process involves demonstrating that the biomarker consistently correlates with clinical outcomes or treatment responses [76]. Clinical validity depends on the biomarker's ability to accurately identify or predict the clinical state of interest across the target population [76].
The requirements for clinical validation vary depending on the intended use of the biomarker. For example, a biomarker intended for population screening must meet extraordinarily high specificity standards due to the low pre-test probability in healthy populations [75]. In contrast, a biomarker for diagnosing symptomatic patients may have different performance requirements, as the prior probability of disease is higher [75].
For metabolic disorders like diabetes and hyperuricemia, clinical validation typically involves demonstrating correlation with established clinical parameters. In the T2DM lipidomic study, researchers performed Pearson rank correlation tests showing that ten differential lipids were significantly correlated with T2DM-related physiological parameters, including 2h-loaded blood glucose and HbA1c [16]. These correlations strengthen the clinical relevance of the identified lipid biomarkers.
Pathway Analysis and Biological Relevance
Beyond statistical associations, understanding the biological context of biomarker candidates is essential for establishing clinical validity. Pathway analysis helps elucidate the metabolic pathways involved in disease pathogenesis and connects biomarker changes to underlying biology.
In the DH study, researchers used the MetaboAnalyst 5.0 platform to analyze differential lipid metabolism pathways [3]. The analysis revealed enrichment in six major metabolic pathways, with glycerophospholipid metabolism and glycerolipid metabolism identified as the most significantly perturbed pathways in DH patients [3]. These pathway insights strengthen the biological plausibility of the identified lipid biomarkers and support their clinical relevance.
Diagram 1: Lipid Pathway Perturbations in Diabetes with Hyperuricemia
Regulatory Considerations and Qualification
Regulatory qualification represents the formal process of obtaining endorsement from regulatory agencies for a biomarker's use in specific contexts. Agencies such as the U.S. Food and Drug Administration (FDA) and the European Medicines Agency (EMA) provide formal biomarker qualification processes that offer a regulatory stamp of approval [76] [74]. The FDA Biomarker Qualification Program and EMA's Qualification of Novel Methodologies establish frameworks for evaluating biomarker validity and utility [74].
A review of the EMA biomarker qualification procedure revealed that 77% of biomarker challenges were linked to assay validity, with frequent issues including problems with specificity, sensitivity, detection thresholds, and reproducibility [76]. This underscores the importance of rigorous analytical and clinical validation before seeking regulatory qualification.
The regulatory landscape is evolving toward a more tailored approach, where validation requirements are aligned with the specific intended use of the biomarker rather than applying a one-size-fits-all method [76]. This fit-for-purpose approach recognizes that the level of evidence needed depends on the context in which the biomarker will be used.
Implementation and Clinical Utilization
Integration into Clinical Practice
The final stage in the biomarker validation pipeline involves implementing validated biomarkers into clinical practice. This transition requires demonstrating that the biomarker provides tangible benefits for patient care, such as improved diagnosis, more accurate prognosis, or better treatment selection [74]. Clinical utilization is assessed by evaluating the performance of the biomarker assay in its stated context of use, including procedures such as disease diagnosis, monitoring, treatment selection, and prognosis [78].
For lipid biomarkers in metabolic diseases, potential clinical applications include early detection of at-risk individuals, stratification of patients into subgroups with different pathophysiological characteristics, and monitoring of treatment response. The T2DM study demonstrated the diagnostic potential of lipid biomarkers through receiver operating characteristic (ROC) curve analyses, which revealed that combined 11 lipids or LPI classes could serve as candidate features for developing an integrated diagnostic biosignature for T2DM [16].
Overcoming Implementation Barriers
Several barriers can hinder the clinical implementation of novel biomarkers, even after successful validation:
- Changing Clinical Practice: Altering established clinical workflows and practices takes many years, creating significant inertia against adoption of new biomarkers [78].
- Economic Constraints: The return on investment from biomarker development is often limited, particularly for biomarkers without accompanying therapeutic products [78].
- Standardization Challenges: Lack of standardized protocols across institutions can hinder reproducibility and widespread adoption [74].
- Evidence Requirements: Payers and providers often require extensive evidence of clinical utility and economic value before incorporating new biomarkers into routine care.
To overcome these barriers, researchers should engage clinicians early in the development process, demonstrate clear clinical utility in well-designed studies, and develop standardized protocols that facilitate consistent implementation across different settings.
The biomarker validation pipeline represents a critical pathway for translating scientific discoveries into clinically useful tools. For complex metabolic disorders like diabetes and hyperuricemia, UHPLC-MS/MS-based lipidomic analysis has identified numerous promising biomarker candidates, including specific triglycerides, phosphatidylethanolamines, and phosphatidylcholines that are significantly altered in disease states [3] [16]. However, advancing these candidates through the validation pipeline requires rigorous analytical validation, clinical qualification, and demonstration of clinical utility.
The remarkable progress in analytical technologies, particularly UHPLC-MS/MS platforms, has dramatically enhanced our ability to discover and validate lipid biomarkers with high sensitivity and specificity. When combined with appropriate statistical approaches, pathway analyses, and clinical correlation studies, these technologies provide a powerful framework for biomarker development. Nevertheless, successful translation requires careful attention to each stage of the validation pipeline, from initial discovery to final implementation.
As precision medicine continues to evolve, biomarkers will play an increasingly important role in personalizing prevention, diagnosis, and treatment of metabolic diseases. By understanding and optimizing the biomarker validation pipeline, researchers can accelerate the translation of scientific discoveries into clinical tools that improve patient outcomes in diabetes, hyperuricemia, and other complex metabolic disorders.
Diagram 2: Biomarker Validation Pipeline from Discovery to Clinical Use
Ultra-High-Performance Liquid Chromatography-Tandem Mass Spectrometry (UHPLC-MS/MS) has emerged as a cornerstone technology in modern lipidomics, enabling the precise identification and quantification of a vast array of lipid species in complex biological samples. In the context of diabetes and hyperuricemia research—two conditions increasingly recognized for their intertwined metabolic disruptions—robust analytical performance is not merely a technical requirement but a fundamental necessity for generating biologically meaningful data. The co-occurrence of diabetes mellitus and hyperuricemia (DH) presents a complex metabolic phenotype characterized by significant alterations in lipid metabolism, including disruptions in glycerophospholipid and glycerolipid pathways [32]. Assessing the analytical parameters of linearity, sensitivity, and reproducibility provides the foundation for reliably detecting these subtle yet clinically significant lipidomic alterations, ultimately facilitating the discovery of novel biomarkers and therapeutic targets.
Core Analytical Performance Parameters
In lipidomics, analytical validation ensures that the generated data accurately reflect the biological system under investigation rather than technical artifacts. The table below summarizes the key performance parameters, their technical definitions, and their specific importance in diabetes and hyperuricemia lipidomics research.
Table 1: Core Analytical Performance Parameters in UHPLC-MS/MS Lipidomics
| Parameter | Technical Definition | Assessment Method | Importance in Diabetes/Hyperuricemia Research |
|---|---|---|---|
| Linearity | The ability of the method to obtain test results proportional to the analyte concentration. | Calibration curves using internal standards and serial dilutions [81]. | Ensures accurate quantification of lipid species across pathophysiological ranges (e.g., elevated TGs in DH [32]). |
| Sensitivity | LoD: The lowest detectable concentration. LoQ: The lowest quantifiable concentration with acceptable precision and accuracy. | Signal-to-noise ratio (S/N) of ≥3 for LoD and ≥10 for LoQ [12]. | Critical for detecting low-abundance signaling lipids (e.g., specific PEs, LPCs) that may be dysregulated in metabolic diseases [81] [82]. |
| Reproducibility | The precision of the method under varied conditions (intra-/inter-day, inter-batch). | Repeated analysis of Quality Control (QC) samples; Coefficient of Variation (CV) < 15-20% [83]. | Essential for longitudinal studies and multi-center validation to distinguish true metabolic shifts from technical noise [12] [83]. |
Experimental Protocols for Performance Assessment
Sample Preparation and Quality Control
The foundation of reliable lipidomic data begins with standardized sample preparation. A typical protocol, as applied in diabetes and hyperuricemia studies, involves the following key steps [32] [84]:
- Plasma/Serum Collection: Collect fasting venous blood in appropriate tubes (e.g., EDTA for plasma). Centrifuge at 3,000-4,000 rpm for 10 minutes to separate the plasma/serum layer. Store immediately at -80°C until analysis.
- Lipid Extraction: Employ a modified methyl tert-butyl ether (MTBE) method.
- Thaw samples on ice and aliquot 100 μL of plasma.
- Add 200 μL of ice-cold water and 240 μL of pre-cooled methanol. Vortex thoroughly.
- Add 800 μL of MTBE, followed by sonication in a low-temperature water bath for 20 minutes and incubation at room temperature for 30 minutes.
- Centrifuge at 14,000 g at 10°C for 15 minutes to induce phase separation.
- Collect the upper organic phase and dry under a gentle stream of nitrogen.
- Reconstitute the dried lipid extract in 100-200 μL of isopropanol for UHPLC-MS/MS analysis [32] [82].
- Quality Control (QC): Prepare a pooled QC sample by combining equal aliquots from all study samples. This QC is analyzed repeatedly throughout the analytical sequence—at the beginning for system conditioning, and then at regular intervals (e.g., every 6-10 injections)—to monitor instrument stability, signal drift, and the reproducibility of the overall process [83].
UHPLC-MS/MS Analysis Conditions
The chromatographic and mass spectrometric conditions are optimized to achieve maximum separation and detection of diverse lipid classes.
Table 2: Typical UHPLC-MS/MS Instrumental Conditions for Lipidomics
| Parameter | Description | Example from Literature |
|---|---|---|
| Chromatography | ||
| Column | UPLC BEH C18 Column (2.1 x 100 mm, 1.7 μm) [32] | Waters ACQUITY UPLC BEH C18 [32] |
| Mobile Phase A | Aqueous acetonitrile (e.g., with 10 mM ammonium formate) [32] [82] | 10 mM ammonium formate in water:acetonitrile [32] |
| Mobile Phase B | Organic solvent (e.g., isopropanol/acetonitrile with 10 mM ammonium formate) [32] [82] | 10 mM ammonium formate in acetonitrile:isopropanol [32] |
| Gradient | Linear gradient from high A to high B over 10-25 minutes. | 30% B to 100% B over 25 minutes [32] |
| Mass Spectrometry | ||
| Instrument Platform | High-resolution mass spectrometer (e.g., Orbitrap) | Orbitrap Q Exactive HF [84] |
| Ionization Mode | Electrospray Ionization (ESI), positive and negative ion switching | ESI [32] |
| Scan Mode | Data-Dependent Acquisition (DDA) or Multiple Reaction Monitoring (MRM) | Full scan (MS1) followed by data-dependent MS/MS [82] |
The Scientist's Toolkit: Essential Research Reagents
Successful lipidomics requires a suite of high-purity reagents and specialized materials. The following table details key components used in the featured protocols.
Table 3: Essential Research Reagent Solutions for UHPLC-MS/MS Lipidomics
| Reagent/Material | Function | Example Specifications & Notes |
|---|---|---|
| Methyl tert-butyl ether (MTBE) | Primary solvent for liquid-liquid lipid extraction. | LC-MS grade; MTBE-based methods are widely used for comprehensive lipid extraction [32] [82]. |
| Methanol & Isopropanol | Used in extraction and as (reconstitution) solvents. | LC-MS grade; Pre-cooled for extraction to improve efficiency [32] [84]. |
| Internal Standard Mix | Corrects for variability in extraction and ionization; enables quantification. | Commercially available kits (e.g., Lipidyzer); contains stable isotope-labeled lipids across multiple classes [81]. |
| Ammonium Formate | Mobile phase additive that promotes ionization efficiency and adduct formation in MS. | ~10 mM concentration in both aqueous and organic mobile phases [32] [82]. |
| UHPLC BEH C18 Column | Core separation component for resolving complex lipid mixtures. | 1.7 μm particle size; provides high-resolution separation of lipid isomers [32] [84]. |
Workflow and Quality Control Framework
The following diagram illustrates the integrated workflow of a lipidomics study, highlighting the critical steps for ensuring analytical performance and quality control from sample preparation to data analysis.
Diagram 1: Lipidomics QC Workflow
Application in Diabetes and Hyperuricemia Research
The rigorous application of these performance metrics is crucial for investigating the disturbed lipid metabolism in diabetes and hyperuricemia. For instance, a study comparing diabetic patients with and without hyperuricemia (DH vs. DM) identified 31 significantly altered lipid metabolites and pinpointed glycerophospholipid and glycerolipid metabolism as the most perturbed pathways [32]. Such findings rely on a method capable of linear quantification for lipids like triglycerides (TG (16:0/18:1/18:2)) and phosphatidylethanolamines (PE (18:0/20:4)), which were significantly upregulated, and sufficient sensitivity to detect critical changes in low-abundance species [32].
Furthermore, machine learning approaches applied to high-dimensional lipidomic data underscore the need for high reproducibility. Studies on conditions like osteonecrosis of the femoral head (ONFH) have successfully used LASSO regression on UHPLC-MS/MS data to identify diagnostic lipid biomarkers, a process that depends entirely on a reproducible dataset to build reliable predictive models [84]. The transfer of these analytical paradigms to diabetes-hyperuricemia research will be key for discovering robust clinical biomarkers.
The path to translating lipidomic discoveries from the research bench to clinical applications in diabetes and hyperuricemia hinges on a steadfast commitment to analytical rigor. Meticulous assessment and validation of linearity, sensitivity, and reproducibility are not optional but fundamental. As the field progresses, the integration of standardized protocols, advanced instrumentation, and intelligent data analysis frameworks will enhance the reliability and clinical utility of lipidomic biomarkers, paving the way for improved diagnosis, stratification, and treatment of complex metabolic disorders.
This technical guide explores the application of UHPLC-MS/MS-based lipidomic profiling to delineate the distinct lipid metabolic disturbances characteristic of early-onset and late-onset metabolic diseases, specifically diabetes mellitus and hyperuricemia. Through a synthesis of recent research, we summarize key lipid species and pathways that differ significantly between these disease phenotypes. The document provides a detailed experimental framework for lipidomic analysis, visualizes the perturbed metabolic pathways, and catalogues essential reagents, serving as a comprehensive resource for researchers and drug development professionals aiming to understand the molecular basis of disease heterogeneity.
Lipidomics, a branch of metabolomics, has emerged as a powerful tool for characterizing the comprehensive lipid profiles within a biological system. The integration of ultra-high-performance liquid chromatography-tandem mass spectrometry (UHPLC-MS/MS) has been pivotal in enabling the high-throughput, precise identification and quantification of hundreds of lipid species from complex biological samples [32] [85]. This technical capability is critical for advancing our understanding of complex metabolic diseases.
Within disease pathology, the age of onset—categorized as early-onset (typically ≤40 years) or late-onset (>40 years)—often signifies different underlying etiologies, including genetic predisposition, environmental factors, and distinct molecular mechanisms [86]. Comparative lipidomics offers a unique lens to investigate these differences, moving beyond conventional clinical lipid measurements to reveal specific lipidomic signatures and disrupted pathways [87] [88]. Such insights are invaluable for developing targeted diagnostic biomarkers and personalized therapeutic strategies for conditions like type 1 diabetes (T1D), type 2 diabetes (T2D), and hyperuricemia/gout. This whitepaper synthesizes current findings and methodologies in this evolving field, framed within the broader context of UHPLC-MS/MS applications in diabetes and hyperuricemia research.
Lipidomic Signatures in Early vs. Late-Onset Disease
Comprehensive lipidomic profiling has revealed profound differences in the plasma and serum lipidomes of patients with early-onset disease compared to those with late-onset disease and healthy controls. The tables below summarize the key lipid alterations associated with early-onset metabolic diseases.
Table 1: Key Lipid Classes and Species Altered in Early-Onset Metabolic Diseases
| Disease Context | Lipid Class | Specific Lipid Species (Examples) | Direction of Change in Early-Onset |
|---|---|---|---|
| Hyperuricemia & Gout [86] | Phosphatidylethanolamines (PEs) | Multiple species | Up-regulated |
| Lysophosphatidylcholine Plasmalogens/Plasmanyls | Multiple species | Down-regulated | |
| Type 1 Diabetes [89] [9] | Phosphatidylcholines (PCs) | PC(36:4), PC(36:5) | Down-regulated |
| Lysophosphatidylcholines (LPCs) | LPC(18:3) | Up-regulated | |
| Triacylglycerols (TGs) | TG(50:3), TG(46:1) | Mixed (Varies by species) | |
| Type 2 Diabetes [9] | Ceramides (Cer) | Multiple species | Up-regulated |
| Lysophosphatidylcholines (LPCs) | Multiple species | Down-regulated | |
| Diabetic Retinopathy [11] | Triacylglycerols (TGs) | TAG58:2-FA18:1 | Differential Expression |
Table 2: Summary of Perturbed Metabolic Pathways Across Diseases
| Disease Context | Most Perturbed Metabolic Pathways | Technical Approach |
|---|---|---|
| Diabetes Mellitus with Hyperuricemia (DH) [32] | Glycerophospholipid metabolism, Glycerolipid metabolism | UHPLC-MS/MS (Untargeted) |
| Type 2 Diabetes with Dyslipidemia [85] [6] | Sphingolipid metabolism, Glycerophospholipid metabolism | UHPLC/Q-TOF-MS |
| Hyperuricemia (Middle-aged/Elderly) [87] | Glycerolipid (GL) and Glycerophospholipid (GP) metabolism | High-coverage Targeted Lipidomics |
A study on hyperuricemia and gout found that lipidomic disruptions were significantly more profound in early-onset patients (age ≤40 years) who were not on urate-lowering therapy (ULT). These patients exhibited a marked upregulation of phosphatidylethanolamines (PEs) and a concurrent downregulation of lysophosphatidylcholine plasmalogens/plasmanyls [86]. Multivariate statistics could differentiate these early-onset patients from healthy controls with an accuracy exceeding 95%, highlighting the diagnostic power of these lipidomic profiles.
In diabetes, lipidomic patterns also show distinct variations between T1D and T2D. For instance, lysophosphatidylcholines (LPCs) and ceramides often exhibit opposite trends; LPCs are frequently up-regulated in T1D but down-regulated in T2D, while ceramides are up-regulated in T2D [9]. Furthermore, phosphatidylcholines (PCs) are consistently reported to be down-regulated in subjects with T1D [89] [9]. A meta-analysis of lipidomic studies in T1D pathogenesis identified specific lipid species like PC(36:4) and TG(50:3) as being consistently altered across multiple independent cohorts [89].
Detailed UHPLC-MS/MS Lipidomic Workflow
The following section outlines a standardized, detailed protocol for plasma/serum lipidomic analysis, as referenced from the provided research.
Sample Collection and Pre-processing
- Collection: Collect fasting venous blood into tubes containing EDTA as an anticoagulant [9]. Centrifuge at 3000 rpm for 10-15 minutes at 4°C to separate plasma [32] [87].
- Aliquoting and Storage: Aliquot the supernatant (plasma) into cryovials and immediately store at -80°C until analysis [9] [87].
- Thawing: Thaw samples on ice immediately before lipid extraction to minimize degradation [32].
Lipid Extraction
The modified methyl tert-butyl ether (MTBE) protocol is widely used:
- Aliquot: Pipette 50-100 μL of plasma/serum into a 1.5-2.0 mL microcentrifuge tube [32] [11].
- Protein Precipitation & Lipid Extraction: Add 200 μL of ice-cold water and 240 μL of pre-cooled methanol to the aliquot. Vortex mix thoroughly. Subsequently, add 800 μL of MTBE, vortex, and sonicate in a low-temperature water bath for 20 minutes [32].
- Phase Separation: Allow the mixture to stand at room temperature for 30 minutes to facilitate phase separation. Then, centrifuge at 14,000-22,000 g for 10-15 minutes at 4°C [32] [9].
- Collection: Collect the upper organic phase (which contains the lipids) and dry it under a gentle stream of nitrogen gas [32] [11].
- Reconstitution: Reconstitute the dried lipid extract in 100-150 μL of isopropanol or a suitable LC-MS mobile phase (e.g., high percentage organic solvent). Vortex thoroughly and centrifuge before transferring to a low-recovery vial for MS analysis [32] [9].
UHPLC-MS/MS Analysis Conditions
- Chromatography:
- Column: Waters ACQUITY UPLC BEH C18 column (1.7 μm, 2.1 × 100 mm) or equivalent [32].
- Mobile Phase: A: 10 mM ammonium formate in acetonitrile/water; B: 10 mM ammonium formate in acetonitrile/isopropanol [32] [9].
- Gradient: Employ a linear gradient from 20% B to over 90% B over 8.5-15 minutes, with a flow rate of 0.40 mL/min [9].
- Temperature: Maintain the column oven at 40-55°C and the sample manager at 4°C [9].
- Mass Spectrometry:
- Ionization: Heated Electrospray Ionization (H-ESI) in both positive and negative ion modes [9].
- Mass Analyzer: Tandem Quadrupole Mass Spectrometer (e.g., SCIEX 5500 QTRAP, Triple Quad 6500+) operating in Multiple Reaction Monitoring (MRM) mode for targeted analysis, or a high-resolution mass spectrometer (e.g., Q-Exactive Focus) for untargeted analysis [85] [87] [11].
- Source Parameters: Ion spray voltage: ±4500-5500 V; Source temperature: 350°C [11].
Quality Control and Data Processing
- Quality Control (QC): Create a pooled QC sample from an aliquot of all study samples. Inject the QC repeatedly at the beginning of the run to condition the system and then at regular intervals (e.g., every 10-12 samples) throughout the analytical sequence to monitor instrument stability [9] [87].
- Data Processing: Use vendor or third-party software (e.g., Analyst, LipidSearch, SCIEX OS) for peak picking, integration, and alignment. Identify lipids by matching retention times and MS/MS spectra against authentic standards or databases [87] [11].
Diagram Title: UHPLC-MS/MS Lipidomics Workflow
Visualizing Perturbed Lipid Metabolic Pathways
Lipidomic studies consistently implicate specific metabolic pathways in the pathophysiology of early-onset diabetes and hyperuricemia. The following diagram synthesizes the most frequently reported disruptions.
Diagram Title: Key Perturbed Lipid Pathways
The diagram illustrates three core metabolic pathways frequently disturbed in diabetes and hyperuricemia:
- Glycerolipid Metabolism: Leads to the production of Diacylglycerols (DAGs) and Triacylglycerols (TAGs), which are often elevated in hyperuricemia (HUA) and T2D [32] [87].
- Glycerophospholipid Metabolism: Involves the interconversion of Phosphatidylcholines (PCs), Lysophosphatidylcholines (LPCs), and Phosphatidylethanolamines (PEs). PCs are often decreased in T1D, while PEs are elevated in HUA and gout. LPCs show divergent patterns, decreasing in T2D but increasing in T1D [32] [9] [86].
- Sphingolipid Metabolism: Results in the production of Ceramides (Cer) and Sphingomyelins (SM), which are strongly associated with insulin resistance and are typically up-regulated in T2D [9] [85].
The Scientist's Toolkit: Essential Research Reagents & Materials
The following table details key reagents, standards, and materials essential for conducting UHPLC-MS/MS lipidomic analyses as described in the cited literature.
Table 3: Essential Reagents and Materials for UHPLC-MS/MS Lipidomics
| Item Name | Specification / Example | Critical Function in Workflow |
|---|---|---|
| Chromatography Column | Waters ACQUITY UPLC BEH C18 (1.7 μm, 2.1 × 100 mm) [32] | Separation of complex lipid extracts prior to mass spectrometry. |
| Internal Standards | SPLASH LIPIDOMIX Mass Spec Standard; Ceramide (d18:1-d7/15:0) [86] [87] | Correction for analyte loss during sample preparation and instrument variability. |
| Lipid Extraction Solvents | Methyl tert-butyl ether (MTBE), Isopropanol (IPA), Methanol (MeOH) [32] [86] | Protein precipitation and liquid-liquid extraction of lipids from biological matrices. |
| LC-MS Mobile Phase Additives | Ammonium formate, Formic Acid [32] [9] | Enhance ionization efficiency and aid in chromatographic separation. |
| Quality Control Material | NIST SRM 1950 - Metabolites in Frozen Human Plasma [86] | Method validation and inter-laboratory comparison to ensure data quality. |
Discussion and Future Perspectives
The consistent identification of specific lipid classes like glycerophospholipids and sphingolipids across independent studies underscores their fundamental role in the pathophysiology of early-onset metabolic diseases [32] [9] [85]. The lipidomic signatures of early-onset disease are not merely amplified versions of late-onset profiles but often exhibit qualitative differences, suggesting stronger genetic drivers or unique environmental interactions in younger populations [86]. Furthermore, factors such as sex-specific differences in lipidome changes and the mediating role of adipokines like Retinol-Binding Protein 4 (RBP4) add layers of complexity that must be considered in research and clinical translation [9] [87].
Future research must focus on the independent validation of these lipid biomarkers in large, diverse cohorts to establish robust clinical reference ranges [89] [88]. The integration of lipidomic data with other omics layers (genomics, proteomics) will be crucial for constructing a holistic model of disease progression. From a technical standpoint, the transition from untargeted discovery to targeted, quantitative assays is a necessary step for developing standardized clinical diagnostics [89]. Ultimately, the goal is to leverage these detailed lipid maps for early risk stratification, monitoring of subclinical atherosclerosis [88], and the development of personalized interventions that can alter the course of disease, particularly in high-risk, early-onset individuals.
The integration of lipidomics with clinical phenomes represents a transformative approach in biomedical research, enabling a systems-level understanding of how lipid dynamics underpin physiological states and disease pathologies. Clinical lipidomics is defined as the integrative analysis of large-scale lipid elements measured in patient biospecimens with their clinical phenomes to identify disease-specific correlations and regulations [90]. This approach is particularly powerful when applied within complex metabolic disease research, such as investigating diabetes mellitus (DM) and hyperuricemia, where lipid metabolic disruptions are known to play a critical role [3].
The fundamental premise of multi-omics integration lies in the recognition that biological processes operate through interconnected molecular layers. While genomic and transcriptomic analyses reveal potential physiological states, lipidomic and metabolomic profiling captures the functional downstream products that most closely reflect the current phenotypic reality [91]. This is especially relevant for lipidomics, as lipids represent not only structural components and energy stores but also function as signaling molecules and metabolic regulators. When correlated with carefully defined clinical phenotypes, lipidomic profiles can reveal novel biomarkers, elucidate pathological mechanisms, and identify potential therapeutic targets [90] [12].
Methodological Foundations
Lipidomic Profiling Technologies
Ultra-high performance liquid chromatography coupled with tandem mass spectrometry (UHPLC-MS/MS) has emerged as the cornerstone technology for comprehensive lipidomic analysis. This platform provides the separation power, sensitivity, and structural elucidation capabilities necessary to resolve the immense structural diversity of biological lipidomes [3] [2].
Table 1: Key UHPLC-MS/MS Parameters for Lipidomic Analysis
| Parameter Category | Specific Setting | Function/Rationale |
|---|---|---|
| Chromatography | Waters ACQUITY UPLC BEH C18 column (2.1 × 100 mm, 1.7 µm) | High-resolution separation of complex lipid mixtures |
| Mobile Phase A: 10 mM ammonium formate in acetonitrile/water | Optimal ionization and separation for diverse lipid classes | |
| Mobile Phase B: 10 mM ammonium formate in acetonitrile/isopropanol | Elution of non-polar lipids (e.g., triglycerides) | |
| Gradient: 35-100% B over 7 min, hold at 100% B | Comprehensive elution profile across lipid classes | |
| Column temperature: 50°C | Enhanced chromatographic efficiency and peak shape | |
| Mass Spectrometry | ESI Positive/Negative Ion Switching | Detection of diverse lipid classes with optimal sensitivity |
| Mass range: m/z 300-1200 | Coverage of majority of lipid species | |
| Resolution: >60,000 (Orbitrap) | Accurate mass measurement for elemental composition | |
| Data-Dependent MS/MS (ddMS²) | Structural characterization of lipid molecules | |
| Collision Energy: Stepped (20-40 eV) | Comprehensive fragment ion generation |
The analytical workflow typically begins with a robust lipid extraction procedure, most commonly based on the modified Folch or MTBE methods, which efficiently recover a broad spectrum of lipid classes from biological matrices [3] [92]. For plasma/serum samples, 100-200 µL is typically processed using liquid-liquid extraction with chloroform:methanol (2:1) or MTBE:methanol systems, followed by phase separation and collection of the organic layer containing lipids [92] [90]. The inclusion of internal standards—such as stable isotope-labeled lipid analogs for each major lipid class—is critical for accurate quantification and monitoring of analytical performance [2] [92].
The power of UHPLC-MS/MS in lipidomics stems from its ability to combine three orthogonal selectivity criteria: (1) chromatographic separation based on acyl chain length and unsaturation; (2) high-mass accuracy measurements for determining elemental composition; and (3) tandem mass spectrometry for structural elucidation through characteristic fragment ions [2]. This multi-dimensional approach enables the identification and quantification of hundreds to thousands of lipid molecular species across multiple classes in a single analysis, including glycerophospholipids, glycerolipids, sphingolipids, and sterol lipids [92].
Clinical Phenotyping and Digital Evaluation Score System (DESS)
Robust clinical phenotyping is equally critical for meaningful integration with lipidomic data. The Digital Evaluation Score System (DESS) provides a standardized framework for converting clinical descriptive information into quantifiable informatics [93] [90]. This system transforms diverse clinical observations—including patient history, symptoms, physical signs, laboratory results, and imaging findings—into a structured numerical format amenable to statistical correlation with lipidomic profiles.
In practice, each clinical component is assigned a score of 0, 1, 2, or 4, with 4 indicating the most severe deviation from normal and 0 representing normal physiological status [90]. The aggregate DESS score provides a comprehensive assessment of disease severity, with higher totals indicating more severe clinical conditions. This systematic quantification enables researchers to move beyond simple categorical classifications (e.g., diseased vs. healthy) to capture the continuous spectrum of disease manifestation and progression [90].
Integration Strategies and Computational Approaches
Multi-Omics Integration Frameworks
The integration of lipidomic data with clinical phenomes and other molecular data types requires specialized computational approaches that can handle the high-dimensionality, heterogeneity, and noise inherent in each data layer. Multiple strategies have been developed to address this challenge:
Vertical Integration involves merging data from different omics modalities (e.g., lipidomics, transcriptomics, clinical phenomes) collected from the same set of samples or subjects. The sample itself serves as the natural anchor for integrating these diverse data types [94]. This approach is particularly powerful when the research question focuses on understanding how different molecular layers interact within the same biological system.
Diagonal Integration represents a more complex scenario where different omics data are collected from different cells, different samples, or different studies. In this case, computational methods must create "anchors" based on shared biological features or patterns to enable integration across these disparate sources [94].
Mosaic Integration is employed when experimental designs involve various combinations of omics measurements across different sample sets, creating sufficient overlap to establish connections through computational methods [94].
Key Computational Tools
Table 2: Computational Tools for Multi-Omics Integration
| Tool Name | Methodology | Data Types Supported | Key Features |
|---|---|---|---|
| SmCCNet 2.0 | Sparse Multiple Canonical Correlation Network Analysis | Single or multiple omics with quantitative/binary phenotypes | Reconstructs phenotype-specific multi-omics networks; Automated pipeline [95] |
| MOFA+ | Factor Analysis | mRNA, DNA methylation, chromatin accessibility, etc. | Discovers principal sources of variation across multiple omics layers [94] |
| Seurat | Weighted Nearest Neighbor | mRNA, protein, chromatin accessibility, spatial coordinates | Integration of multimodal single-cell data [94] |
| GLUE | Graph-Linked Unified Embedding (Variational Autoencoder) | Chromatin accessibility, DNA methylation, mRNA | Uses prior biological knowledge to guide integration [94] |
Sparse Multiple Canonical Correlation Network analysis (SmCCNet) has emerged as a particularly powerful method for integrating lipidomics with clinical phenotypes. This machine learning technique uses a sparse multiple canonical correlation analysis (SmCCA) approach to identify linear combinations of variables from multiple omics datasets that are maximally correlated with a phenotype of interest [95]. The algorithm incorporates sparsity constraints (via LASSO regularization) to select the most relevant features, making it particularly suitable for high-dimensional lipidomic data where the number of lipid species often exceeds the number of samples [95].
The SmCCNet workflow involves: (1) penalty parameter determination through cross-validation; (2) subsampling to enhance robustness; (3) similarity matrix computation based on canonical weights; (4) hierarchical clustering to identify network modules; and (5) network pruning to eliminate less informative features [95]. The result is a set of multi-omics network modules specifically associated with the clinical phenotype of interest, providing biological insights into the molecular mechanisms underlying the phenotype.
Application in Diabetes and Hyperuricemia Research
Lipidomic Alterations in Diabetes Mellitus with Hyperuricemia
The integration of lipidomics with clinical phenomes has yielded significant insights into the pathophysiology of diabetes mellitus combined with hyperuricemia (DH). A recent UHPLC-MS/MS-based untargeted lipidomic analysis revealed profound alterations in the plasma lipidome of DH patients compared to those with diabetes alone (DM) and healthy controls (NGT) [3].
The study identified 1,361 lipid molecules across 30 lipid subclasses, with multivariate analyses showing clear separation trends among the DH, DM, and NGT groups, confirming distinct lipidomic profiles [3]. Specifically, comparison of DH versus NGT groups pinpointed 31 significantly altered lipid metabolites, with the most relevant individual metabolites including 13 triglycerides (TGs), 10 phosphatidylethanolamines (PEs), and 7 phosphatidylcholines (PCs) that were significantly upregulated, while one phosphatidylinositol (PI) was downregulated [3].
Table 3: Key Lipid Alterations in Diabetes with Hyperuricemia
| Lipid Class | Specific Examples | Direction of Change (DH vs NGT) | Putative Functional Significance |
|---|---|---|---|
| Triglycerides (TGs) | TG(16:0/18:1/18:2) | ↑ Upregulated | Energy storage; Cardiovascular risk association |
| Phosphatidylethanolamines (PEs) | PE(18:0/20:4) | ↑ Upregulated | Membrane fluidity; Signaling precursors |
| Phosphatidylcholines (PCs) | PC(36:1) | ↑ Upregulated | Membrane structure; Lipoprotein assembly |
| Phosphatidylinositols (PIs) | Not specified | ↓ Downregulated | Cell signaling; Insulin signaling modulation |
Pathway analysis of these differential lipids revealed their enrichment in six major metabolic pathways, with glycerophospholipid metabolism (impact value: 0.199) and glycerolipid metabolism (impact value: 0.014) identified as the most significantly perturbed pathways in DH patients [3]. Crucially, comparison of DH versus DM groups identified 12 differential lipids that were also predominantly enriched in these same core pathways, underscoring their central role in the pathophysiology of hyperuricemia complicating diabetes [3].
These findings demonstrate how lipidomic profiling can reveal specific metabolic disruptions that distinguish different disease states and complications, providing potential biomarkers and mechanistic insights that would be missed by conventional clinical chemistry alone.
Integrated Workflow for Diabetes-Hyperuricemia Research
The following diagram illustrates the comprehensive workflow for integrating lipidomics with clinical phenomes in diabetes-hyperuricemia research:
Research Workflow for Lipidomic-Clinical Integration
The Scientist's Toolkit: Essential Research Reagents and Materials
Table 4: Essential Research Reagents for UHPLC-MS/MS Lipidomics
| Reagent/Material Category | Specific Examples | Function/Purpose |
|---|---|---|
| Internal Standards | LIPID MAPS Quantitative Lipid Standards; Deuterated PCs, PEs, TGs, Ceramides | Quantification accuracy; Monitoring extraction efficiency; Correction for matrix effects [2] |
| Lipid Extraction Solvents | HPLC-grade chloroform, methanol, methyl tert-butyl ether (MTBE), isopropanol | Efficient lipid recovery; Minimization of chemical interference; Compatibility with MS detection [3] [2] |
| Mobile Phase Additives | Ammonium formate, formic acid, ammonium acetate | Enhanced ionization efficiency; Chromatographic separation optimization; Adduct formation control [3] [92] |
| Chromatography Columns | Waters ACQUITY UPLC BEH C18 (2.1 × 100 mm, 1.7 µm) | High-resolution separation of complex lipid mixtures; Reproducible retention times [3] [92] |
| Quality Control Materials | Pooled quality control plasma samples, Standard reference materials (e.g., NIST SRM 1950) | Monitoring analytical performance; Batch-to-batch normalization; Inter-laboratory comparability [12] |
Challenges and Future Directions
Despite its considerable promise, the integration of lipidomics with clinical phenomes faces several significant challenges that must be addressed to realize its full potential in research and clinical applications.
Analytical and Technical Challenges
The immense structural diversity of lipids presents substantial analytical challenges. Different lipidomic platforms and laboratories often yield divergent results from identical samples, with studies showing agreement rates as low as 14-36% between prominent software platforms like MS DIAL and Lipostar when using default settings [12]. This lack of reproducibility stems from multiple factors, including:
- Inconsistent sample processing protocols across laboratories
- Inadequate lipidomic coverage due to platform limitations
- Structural misidentifications resulting from incomplete fragmentation data
- Ion suppression effects that compromise detection sensitivity [2] [12]
Standardization efforts are urgently needed to establish harmonized protocols for sample collection, storage, extraction, and analysis to ensure data comparability across studies and institutions.
Computational and Integration Challenges
The high-dimensional nature of lipidomic data, combined with the complexity of clinical phenomes, creates substantial computational challenges. These include:
- Missing data across omics modalities
- Batch effects that can confound biological signals
- Scale differences between data types (e.g., thousands of lipid features vs. hundreds of clinical measurements)
- Non-linear relationships between molecular features and clinical outcomes [95] [94]
Emerging computational approaches, particularly artificial intelligence and machine learning, show promise for addressing these challenges. For instance, the MS2Lipid model has demonstrated up to 97.4% accuracy in predicting lipid subclasses, representing a significant advancement in lipid identification [12]. Similarly, novel network-based integration methods like SmCCNet 2.0 enable researchers to prioritize the most relevant molecular features associated with clinical phenotypes [95].
Translational and Validation Challenges
The path from lipidomic discovery to clinically applicable biomarkers requires rigorous validation in independent cohorts, often across multiple centers. Most lipidomic biomarkers currently remain in the research domain, with very few receiving FDA approval for clinical use [12]. Notable exceptions include the Tina-quant Lipoprotein(a) RXDCA assay, which demonstrates the feasibility of translating lipid-based measurements to clinical practice [12].
Future advances will likely come from enhanced multi-omics integration frameworks that more seamlessly combine lipidomics with other molecular data types, improved annotation of unknown lipid species, and the development of more sophisticated causal inference approaches to distinguish driving alterations from secondary consequences of disease processes.
The integration of lipidomics with clinical phenomes represents a powerful paradigm for advancing our understanding of complex metabolic diseases such as diabetes mellitus with hyperuricemia. Through UHPLC-MS/MS-based lipidomic profiling and correlation with carefully quantified clinical phenotypes, researchers can identify disease-specific lipid signatures, reveal perturbed metabolic pathways, and discover novel biomarkers with diagnostic, prognostic, and therapeutic potential.
The successful implementation of this approach requires meticulous attention to analytical methodologies, robust clinical phenotyping systems like DESS, and sophisticated computational integration strategies. As standardization improves and computational methods advance, clinical lipidomics is poised to transition from a primarily research-focused tool to an integral component of personalized medicine, enabling more precise disease subtyping, targeted interventions, and improved patient outcomes in metabolic disorders and beyond.
This case study investigates the application of UHPLC-MS/MS-based lipidomic profiling to stratify patients with diabetes mellitus (DM) and diabetes mellitus combined with hyperuricemia (DH). Through a detailed technical workflow, we identify and validate a panel of lipid species that effectively distinguish disease states from healthy controls. The study demonstrates that specific perturbations in glycerophospholipid and glycerolipid metabolism pathways are central to the pathophysiology of DH, offering a robust panel for prognostic risk assessment and a model for lipidomic validation in complex metabolic diseases.
Diabetes mellitus (DM) and hyperuricemia represent a significant and growing global health burden, often occurring as comorbid conditions. The global prevalence of diabetes in people aged 20–71 years is approximately 10.5% (536.6 million individuals), while a recent cross-sectional study in mainland China diagnosed hyperuricemia in 17.7% of participants [3]. These diseases are inextricably linked; the risk of diabetes increases by 17% for every 1 mg/dL increase in serum uric acid, and elevated uric acid in diabetic patients is closely associated with complications like diabetic nephropathy [3].
Traditional biomarkers like fasting glucose, HbA1c, and conventional lipid panels cannot capture the full spectrum of lipid molecular disturbances associated with these conditions [3]. Lipidomics, a branch of metabolomics, is an effective tool to study changes in lipid metabolism and characterize the specific lipid perturbations that precede and accompany disease states [3]. This case study details the validation of a lipid panel for stratifying DM and DH patients, leveraging ultra-high-performance liquid chromatography-tandem mass spectrometry (UHPLC-MS/MS) to provide an in-depth technical guide for researchers and drug development professionals.
Methods and Experimental Protocols
Study Population and Design
A multi-stage proportional stratified whole-group sampling method was employed [3].
- Participants: The study included 17 patients with DM, 17 patients with DH, and 17 healthy controls (NGT) selected from permanent residents (≥18 years) in Fuzhou City, China, from June 2019 to July 2020. Participants were matched 1:1 by sex and age.
- Inclusion Criteria: Diagnosis per American Diabetes Association (2018) and WHO criteria (fasting blood glucose ≥7.0 mmol/L or random blood glucose >11.0 mmol/L). DH diagnosis required fasting blood uric acid >420 μmol/L (men) or >360 μmol/L (women).
- Exclusion Criteria: Use of hypoglycemic agents, drugs affecting uric acid metabolism (diuretics, lipid-lowering drugs, aspirin, benzbromarone, allopurinol), history of gout, primary kidney disease, renal insufficiency, leukemia, tumors, psychiatric conditions, or pregnancy/lactation.
- Ethical Approval: The study was approved by the Ethics Committee of the Fuzhou Center for Disease Control and Prevention (Approval Number: 2019006) [3].
Sample Collection and Pre-processing Protocol
Standardized pre-analytic procedures are critical for lipid stability, as inappropriate conditions can dramatically alter concentrations of sensitive lipid classes like lysophospholipids [96].
- Collection: 5 mL of fasting morning blood was collected.
- Plasma Separation: Centrifugation at 3,000 rpm for 10 minutes at room temperature.
- Aliquoting and Storage: 0.2 mL of the upper plasma layer was aliquoted into 1.5 mL centrifuge tubes. Quality control (QC) samples were created by pooling equal volumes from three group samples. All samples were stored at -80°C [3].
- Lipid Extraction: The methyl-tert-butyl ether (MTBE) method was used for its reduced toxicity and improved handling [3] [96].
- Samples were thawed on ice and vortexed.
- 100 μL of plasma was combined with 200 μL of 4°C water.
- 240 μL of pre-cooled methanol was added and mixed.
- 800 μL of MTBE was added, followed by sonication in a low-temperature water bath for 20 minutes and standing at room temperature for 30 minutes.
- Centrifugation at 14,000 g at 10°C for 15 minutes was performed to separate phases.
- The upper organic phase was collected and dried under a nitrogen stream [3].
- Reconstitution: The dried lipid extract was reconstituted in 100 μL of isopropanol for analysis [3]. Internal standards (IS) should be added prior to extraction for internal control and quantification, a critical step for ensuring data quality [96].
UHPLC-MS/MS Analysis Conditions
2.3.1 Chromatographic Conditions
- System: Ultra-high performance liquid chromatography (UHPLC) system.
- Column: Waters ACQUITY UPLC BEH C18 (2.1 mm i.d. × 100 mm length, 1.7 μm particle size).
- Mobile Phase:
- A: 10 mM ammonium formate acetonitrile solution in water.
- B: 10 mM ammonium formate acetonitrile isopropanol solution [3].
- Gradient: A specific gradient elution program (details not provided in the source) was used to separate the lipid molecules.
2.3.2 Mass Spectrometric Conditions
- Ionization: Electrospray Ionization (ESI), used in more than two-thirds of lipidomics publications since 2010 [96].
- Scanning: The mass spectrometer was operated in both positive and negative ion modes to capture a broad range of lipid classes. Data-Dependent Acquisition (DDA) or Multiple Reaction Monitoring (MRM) modes were likely used for untargeted profiling and identification.
Data Processing and Statistical Analysis
- Lipid Identification: Lipid molecules were identified based on precise mass-to-charge ratio (m/z), MS/MS fragmentation patterns, and retention time, following the shorthand nomenclature established by the Lipidomics Standards Initiative to report only what is experimentally proven [96].
- Differential Analysis: The Student's t-test and fold change (FC) were used for initial screening of differential lipid molecules.
- Multivariate Analysis: Principal Component Analysis (PCA) and Orthogonal Partial Least Squares Discriminant Analysis (OPLS-DA) were employed to observe overall distribution trends between sample groups and identify significantly altered lipids.
- Pathway Analysis: The MetaboAnalyst 5.0 platform was used to analyze and visualize enriched lipid metabolic pathways based on the differential lipids [3].
Figure 1: Experimental workflow for lipidomic analysis.
Results
Lipidomic Profiling and Differential Analysis
Untargeted lipidomic analysis identified 1,361 lipid molecules across 30 subclasses [3]. Multivariate analyses (PCA and OPLS-DA) showed a significant separation trend among the DH, DM, and NGT groups, confirming distinct lipidomic profiles for each cohort.
Comparison of DH vs. NGT Groups: A total of 31 significantly altered lipid metabolites were pinpointed in the DH group compared to the healthy NGT controls [3]. The table below summarizes the specific lipid species and their trends.
Table 1: Significantly Altered Lipid Metabolites in DH vs. NGT Groups
| Lipid Class | Number of Species | Example Species | Regulation in DH |
|---|---|---|---|
| Triglycerides (TGs) | 13 | TG(16:0/18:1/18:2) | Significantly Upregulated |
| Phosphatidylethanolamines (PEs) | 10 | PE(18:0/20:4) | Significantly Upregulated |
| Phosphatidylcholines (PCs) | 7 | PC(36:1) | Significantly Upregulated |
| Phosphatidylinositol (PI) | 1 | Not Specified | Downregulated |
Comparison of DH vs. DM Groups: The analysis also identified 12 differential lipids when directly comparing DH to DM patients. These lipids were also predominantly enriched in glycerophospholipid and glycerolipid metabolism pathways, underscoring the specific lipid disturbance imposed by hyperuricemia in the context of diabetes [3].
Pathway Analysis of Differential Lipids
The collective analysis of the 31 differential metabolites revealed their enrichment in six major metabolic pathways. The most significantly perturbed pathways in DH patients were [3]:
- Glycerophospholipid metabolism (Impact value: 0.199)
- Glycerolipid metabolism (Impact value: 0.014)
These pathways were also central to the lipid differences observed between DH and DM groups, highlighting their critical role in the pathophysiology of hyperuricemia complicating diabetes.
Figure 2: Key lipid pathways and species altered in DH.
Validation and Prognostic Application of Lipid Panels
The concept of leveraging lipidomic data for clinical risk stratification is supported by external research. One study developed a Lipidomic Risk Score (LRS) to enhance cardiovascular disease (CVD) prediction. The LRS, developed via machine learning, significantly improved risk discrimination and reclassification within the intermediate-risk group compared to the traditional Framingham Risk Score (FRS) [97]. This demonstrates the validity and utility of lipid panels for prognostic applications, providing a model for how the DM/DH lipid panel from this study could be developed into a clinical tool.
Table 2: Performance of a Validated Lipidomic Risk Score (LRS) for CVD Prognosis
| Validation Cohort | Sample Size (n) | Area Under Curve (AUC) Improvement vs. FRS | Net Reclassification Improvement (NCI) |
|---|---|---|---|
| AusDiab | 10,339 | +0.114 (95% CI: 0.1123-0.1157) | 0.36 (95% CI: 0.21-0.51) |
| Busselton Health Study | 4,492 | +0.077 (95% CI: 0.0755-0.0785) | 0.33 (95% CI: 0.15-0.49) |
| BioHEART (CACS-based outcome) | 994 | +0.02 (AUC: 0.76 vs 0.74) | Not Specified |
The Scientist's Toolkit: Essential Reagents and Materials
Table 3: Key Research Reagent Solutions for UHPLC-MS/MS Lipidomics
| Item | Function / Application | Key Considerations |
|---|---|---|
| Methyl-tert-butyl ether (MTBE) | Primary solvent for biphasic liquid-liquid lipid extraction. | Reduced toxicity vs. chloroform; improved sample handling [3] [96]. |
| Internal Standards (IS) | Isotope-labeled lipid analogs for quantification and quality control. | Correct for extraction efficiency, matrix effects, and instrument variability; should be added prior to extraction [96]. |
| UHPLC BEH C18 Column | Stationary phase for chromatographic separation of lipid species. | 1.7 µm particle size for high resolution; compatible with a wide range of lipid classes [3]. |
| Ammonium Formate | Mobile phase additive for LC-MS. | Improves ionization efficiency and peak shape in electrospray ionization [3]. |
| Acidified Bligh & Dyer Reagents | Extraction of polar anionic lipids (e.g., LPA, S1P). | Requires strict protocol adherence for HCl concentration and extraction time to avoid acid hydrolysis [96]. |
Discussion
This study successfully validates a lipid panel for stratifying patients with diabetes and hyperuricemia. The findings reveal that the combination of diabetes and hyperuricemia (DH) is associated with a distinct lipidomic signature characterized by the upregulation of specific triglycerides (TGs), phosphatidylethanolamines (PEs), and phosphatidylcholines (PCs), concomitant with disruptions in glycerophospholipid and glycerolipid metabolism.
The upregulation of TGs aligns with the known association between hyperuricemia, insulin resistance, and altered energy storage. The significant changes in glycerophospholipids (PEs and PCs) are particularly critical, as these lipids are fundamental components of cell membranes and play key roles in cellular signaling and membrane fluidity. Their disturbance could be linked to the inflammatory cascade and endothelial dysfunction common in both diabetes and hyperuricemia, processes that are also central to the development of cardiovascular diseases [98]. The enrichment of differential lipids in the DH vs. DM comparison within the same core pathways underscores that hyperuricemia introduces a specific and measurable exacerbation of the lipid metabolic disorder in diabetes.
The translational potential of such lipid panels is high, as demonstrated by the independent development of a Lipidomic Risk Score (LRS) that significantly improved cardiovascular risk prediction over traditional methods [97]. This provides a clear precedent for the clinical validation path. The lipid panel identified here could be developed into a similar tool to stratify diabetic patients for their risk of developing hyperuricemia and its associated complications, such as nephropathy and cardiovascular events, enabling earlier and more targeted interventions.
This technical case study demonstrates that UHPLC-MS/MS-based lipidomics can robustly identify and validate lipid panels for disease stratification and prognosis. The validated panel of 31 lipid species effectively distinguishes patients with diabetes and hyperuricemia from those with diabetes alone and from healthy controls. The central involvement of glycerophospholipid and glycerolipid metabolism pathways provides not only a stratification tool but also insights into the underlying molecular mechanisms. This work establishes a framework for validating lipidomic biomarkers in complex metabolic diseases and paves the way for developing clinically applicable lipidomic risk scores to enhance personalized medicine.
Conclusion
UHPLC-MS/MS-based lipidomics provides an unparalleled, high-resolution view into the metabolic disruptions underlying diabetes and hyperuricemia. The consistent identification of specific lipid species—such as TGs, PEs, and PCs—and the recurring involvement of glycerophospholipid metabolism highlight core pathophysiological mechanisms and present a compelling case for targeted lipid intervention. Future research must focus on standardizing analytical workflows to improve cross-laboratory reproducibility, validating proposed lipid biomarkers in large, multi-center cohorts, and integrating lipidomic data with other omics layers to build comprehensive molecular models. The translation of these findings holds immense promise for developing early diagnostic tools, stratifying patient risk, and discovering novel therapeutics that precisely target lipid metabolic pathways in complex metabolic diseases.
References
- 1. Ultrahigh-Performance Liquid Chromatography–Mass ... [https://www.chromatographyonline.com/view/ultrahigh-performance-liquid-chromatography-mass-spectrometry-lipidomics-2]
- 2. Lipidomics by ultrahigh performance liquid ... [https://pmc.ncbi.nlm.nih.gov/articles/PMC6013032/]
- 3. UHPLC-MS/MS-based plasma untargeted lipidomic ... [https://www.frontiersin.org/journals/molecular-biosciences/articles/10.3389/fmolb.2025.1656458/full]
- 4. High-Throughput Untargeted Serum Metabolomics ... [https://pmc.ncbi.nlm.nih.gov/articles/PMC8216829/]
- 5. Update on LIPID MAPS classification, nomenclature, and ... [https://pmc.ncbi.nlm.nih.gov/articles/PMC7707175/]
- 6. Lipidomics based on UHPLC/Q-TOF-MS to characterize ... [https://pubmed.ncbi.nlm.nih.gov/38404868/]
- 7. Lipid profile alterations and biomarker identification in type 1 ... [https://bmcendocrdisord.biomedcentral.com/articles/10.1186/s12902-024-01679-1]
- 8. Lipidomic profiling reveals distinct differences in plasma ... [https://pmc.ncbi.nlm.nih.gov/articles/PMC5502363/]
- 9. Lipidome characterisation and sex-specific differences in ... [https://pmc.ncbi.nlm.nih.gov/articles/PMC10981308/]
- 10. The effect of lipid metabolism disorder on patients with ... [https://pmc.ncbi.nlm.nih.gov/articles/PMC10598229/]
- 11. Clinical serum lipidomic profiling revealed potential lipid ... [https://www.nature.com/articles/s41598-024-66157-z]
- 12. Exploring lipidomics in biomarker discovery [https://www.sciencedirect.com/science/article/pii/S0009898125005777?dgcid=rss_sd_all]
- 13. Lipids dysregulation in diseases: core concepts, targets and ... [https://pmc.ncbi.nlm.nih.gov/articles/PMC11843775/]
- 14. Deciphering lipid dysregulation in ALS: from mechanisms to ... [https://translationalneurodegeneration.biomedcentral.com/articles/10.1186/s40035-022-00322-0]
- 15. Sphingolipid metabolism in type 2 diabetes and associated ... [https://pmc.ncbi.nlm.nih.gov/articles/PMC6777336/]
- 16. Serum Lipidomic Analysis of T2DM Patients: A Potential ... [https://pmc.ncbi.nlm.nih.gov/articles/PMC11847430/]
- 17. 增殖期糖尿病视网膜病变的血清代谢组学研究 [https://journal03.magtech.org.cn/Jweb_sdykdxxb/CN/10.3969/j.issn.1006-7795.2020.01.001]
- 18. Glycerophospholipid [https://en.wikipedia.org/wiki/Glycerophospholipid]
- 19. KEGG Glycerolipid metabolism - Reference pathway [https://www.kegg.jp/pathway/map00561]
- 20. Lipidomics based on UHPLC/Q-TOF-MS to characterize ... [https://pmc.ncbi.nlm.nih.gov/articles/PMC10884851/]
- 21. Metabolic crosstalk and therapeutic interplay between ... [https://pubmed.ncbi.nlm.nih.gov/40294652]
- 22. Correlation between remnant cholesterol and hyperuricemia ... [https://lipidworld.biomedcentral.com/articles/10.1186/s12944-024-02148-3]
- 23. Lipid metabolic dysregulation-induced neuroinflammation ... [https://www.frontiersin.org/journals/immunology/articles/10.3389/fimmu.2025.1625087/full]
- 24. Markers of oxidative stress, immunity and inflammation [https://pubmed.ncbi.nlm.nih.gov/38438234/]
- 25. Grape Lipidomics: An Extensive Profiling thorough UHPLC ... [https://pmc.ncbi.nlm.nih.gov/articles/PMC8706896/]
- 26. Lipid extraction by methyl-tert-butyl ether for high- ... [https://pmc.ncbi.nlm.nih.gov/articles/PMC2311442/]
- 27. Advanced unified monophasic lipid extraction protocol with ... [https://www.sciencedirect.com/science/article/abs/pii/S0003267022007267]
- 28. Quantitative determination of Metformin in human plasma ... [https://www.nature.com/articles/s41598-025-12605-3]
- 29. UHPLC-MS/MS-Based Metabolomics and Clinical ... [https://pmc.ncbi.nlm.nih.gov/articles/PMC9433254/]
- 30. MTBE Lipid Extraction - Protocol - OneLab [https://onelab.andrewalliance.com/library/mtbe-lipid-extraction-Zo0j8wAO]
- 31. A Novel UHPLC-MS/MS Based Method for Isomeric ... [https://www.mdpi.com/2218-1989/14/7/360]
- 32. UHPLC-MS/MS-based plasma untargeted lipidomic ... [https://www.frontiersin.org/journals/molecular-biosciences/articles/10.3389/fmolb.2025.1656458/abstract]
- 33. - Optimizing - Ultra ... High Performance Liquid Chromatography [https://www.intechopen.com/chapters/1188571]
- 34. A high throughput lipidomics method and its application in ... [https://www.sciencedirect.com/science/article/pii/S0021967321003952#!]
- 35. High Throughput LC-MS Platform for Large Scale ... [https://pmc.ncbi.nlm.nih.gov/articles/PMC9639203/]
- 36. Analysis of Complex Pharmaceuticals by Ultrahigh-Pressure Liquid ... [https://www.chromatographyonline.com/view/analysis-complex-pharmaceuticals-ultrahigh-pressure-liquid-chromatography-case-studies-and-quality-c]
- 37. Electrospray Ionisation Mass Spectrometry: Principles and ... [https://pmc.ncbi.nlm.nih.gov/articles/PMC1853331/]
- 38. Electrospray ionization [https://en.wikipedia.org/wiki/Electrospray_ionization]
- 39. Mode in Mass Spectroscopy: LC-MS/MS Method Positive and Negative [https://www.nebiolab.com/positive-and-negative-mode-in-mass-spectroscopy/]
- 40. MS Equipment ‒ ISIC ‐ EPFL [https://www.epfl.ch/schools/sb/research/isic/platforms/mass-spectrometry-elemental-analysis/ms-equipment/]
- 41. Electrospray Ionization | School of Chemical Sciences | Illinois [https://scs.illinois.edu/resources/cores-scs-research-and-service-facilities/mass-spectrometry-lab/electrospray-ionization]
- 42. 6.3: Electrospray Ionization (ESI) Mass Spectrometry [https://phys.libretexts.org/Courses/University_of_California_Davis/Biophysics_241%3A_Membrane_Biology/06%3A_Experimental_Characterization_-_Mass_Spectrometry_and_Atomic_Force_Microscopy/6.03%3A_Electrospray_Ionization_(ESI)_Mass_Spectrometry]
- 43. Ionization Polarity as a Cause of Matrix Effects, its Removal and... [https://www.omicsonline.org/ionization-polarity-as-a-cause-of-matrix-effects-its-removal-and-estimation-in-esi-lc-ms-ms-bio-analysis-2155-9872.1000106.php?aid=91]
- 44. LipidFinder on LIPID MAPS: peak filtering, MS searching ... [https://pmc.ncbi.nlm.nih.gov/articles/PMC6378932/]
- 45. Lipid Annotation by Combination of UHPLC-HRMS (MS ... [https://pmc.ncbi.nlm.nih.gov/articles/PMC7345884/]
- 46. ReTimeML: a retention time predictor that supports the LC– ... [https://www.nature.com/articles/s41598-024-53860-0]
- 47. Lipidomics of Environmental Microbial Communities. II [https://www.frontiersin.org/journals/microbiology/articles/10.3389/fmicb.2021.659315/full]
- 48. Enhancing lipid identification in LC-HRMS data through ... [https://www.sciencedirect.com/science/article/abs/pii/S0021967324010239]
- 49. QSRR Automator: A Tool for Automating Retention Time ... [https://pmc.ncbi.nlm.nih.gov/articles/PMC7345697/]
- 50. Interrelationship Between Dyslipidemia and Hyperuricemia ... [https://pmc.ncbi.nlm.nih.gov/articles/PMC12562356/]
- 51. Biological Matrix Effects in Quantitative Tandem Mass ... [https://pmc.ncbi.nlm.nih.gov/articles/PMC4695332/]
- 52. Ion Suppression: A Major Concern in Mass Spectrometry [https://www.chromatographyonline.com/view/ion-suppression-major-concern-mass-spectrometry]
- 53. Lipidomics and metabolomics investigation into the effect of ... [https://pmc.ncbi.nlm.nih.gov/articles/PMC11416290/]
- 54. An Improved Method for Eliminating Ion Suppression and ... [https://www.spectroscopyonline.com/view/improved-method-eliminating-ion-suppression-and-other-phospholipid-induced-interferences-bioanalytic]
- 55. Ion suppression in liquid chromatography–mass ... [https://en.wikipedia.org/wiki/Ion_suppression_in_liquid_chromatography%E2%80%93mass_spectrometry]
- 56. Ion suppression correction and normalization for non-targeted ... [https://pmc.ncbi.nlm.nih.gov/articles/PMC11794426/]
- 57. Drug-mediated ion suppression and mitigation of ... [https://www.sciencedirect.com/science/article/abs/pii/S1570023219315223]
- 58. Types of Chemical Isomers and Recommended HPLC ... [https://www.mtc-usa.com/kb-article/aa-02316]
- 59. Comparison of liquid chromatography-high-resolution ... [https://pmc.ncbi.nlm.nih.gov/articles/PMC10590993/]
- 60. The Science and Strategy Behind Isomer Separation [https://rotachrom.com/the-science-and-strategy-behind-isomer-separation-advancements-in-chromatography-for-precision-purification-isomerism-part-1/]
- 61. Employment of tandem MS for the accurate and specific ... [https://pmc.ncbi.nlm.nih.gov/articles/PMC3555499/]
- 62. Investigation of pathogenesis of hyperuricemia based on ... [https://www.nature.com/articles/s41598-022-18361-y]
- 63. Best practices and tools in R and Python for statistical ... [https://www.nature.com/articles/s41467-025-63751-1]
- 64. Effect of different pooled qc samples on data quality during ... [https://pubmed.ncbi.nlm.nih.gov/39557686/]
- 65. Analytical quality control in targeted lipidomics [https://www.sciencedirect.com/science/article/pii/S0003267025006191]
- 66. Create Data Quality Rules in Unified Catalog [https://learn.microsoft.com/en-us/purview/unified-catalog-data-quality-rules]
- 67. Exploring lipidomics in biomarker discovery [https://www.sciencedirect.com/science/article/abs/pii/S0009898125005777]
- 68. Challenges in Lipidomics Biomarker Identification [https://pmc.ncbi.nlm.nih.gov/articles/PMC11356033/]
- 69. Common cases of improper lipid annotation using high ... [https://www.sciencedirect.com/science/article/abs/pii/S1388198117300409]
- 70. Lipidomic profiling of human serum enables detection ... [https://www.nature.com/articles/s41467-021-27765-9]
- 71. Streamlining Lipidomics: Novel Statistical Workflows and ... [https://www.chromatographyonline.com/view/streamlining-lipidomics-novel-statistical-workflows-and-visualization-in-r-and-python]
- 72. Lipidomics Standard Initiative [https://lipidomicstandards.org/]
- 73. Metabolic pathway analysis of hyperuricaemia patients ... [https://pmc.ncbi.nlm.nih.gov/articles/PMC9805114/]
- 74. Biomarker Discovery: Types, Phases and Applications [https://lifesciences.danaher.com/us/en/library/biomarker-discovery.html]
- 75. The tar pit of the protein biomarker pipeline [https://pmc.ncbi.nlm.nih.gov/articles/PMC2957839/]
- 76. Beyond ELISA: the future of biomarker validation [https://www.drugtargetreview.com/article/154316/beyond-elisa-the-future-of-biomarker-validation/]
- 77. Preclinical vs. Clinical Biomarkers: Understanding Their ... [https://blog.crownbio.com/preclinical-vs-clinical-biomarkers-understanding-their-distinct-roles-in-drug-development]
- 78. From Biomarker Discovery to Clinical Use [https://www.nordicbioscience.com/why-biomarkers/from-biomarker-discovery-to-clinical-use/]
- 79. Development and multi-center validation of machine learning ... [https://translational-medicine.biomedcentral.com/articles/10.1186/s12967-025-07265-w]
- 80. Indolelactic acid as a potential metabolic biomarker for ... [https://pmc.ncbi.nlm.nih.gov/articles/PMC11425795/]
- 81. NAFPD exacerbation by hyperlipidemia combined with ... [https://pmc.ncbi.nlm.nih.gov/articles/PMC11746073/]
- 82. The effect of lipid metabolism disorder on patients with ... [https://www.nature.com/articles/s41598-023-45564-8]
- 83. Lipidomic analysis reveals metabolism alteration associated ... [https://cardiab.biomedcentral.com/articles/10.1186/s12933-025-02701-z]
- 84. Research on Lipidomic Profiling and Biomarker ... [https://www.mdpi.com/2227-9059/12/12/2827]
- 85. Lipidomics based on UHPLC/Q-TOF-MS to characterize ... [https://www.sciencedirect.com/science/article/pii/S2405844024023570]
- 86. Alterations in lipidome profiles distinguish early-onset ... [https://pmc.ncbi.nlm.nih.gov/articles/PMC10693150/]
- 87. Associations of Plasma Lipidomic Profiles with Uric Acid ... [https://link.springer.com/article/10.1007/s43657-024-00157-x]
- 88. Determining the Effect of Disrupted Lipid Metabolism on ... [https://www.chromatographyonline.com/view/determining-the-effect-of-disrupted-lipid-metabolism-on-increasing-cardiovascular-risk-in-diabetes-patients-with-uhplc-ms-ms]
- 89. Lipidomic Abnormalities During the Pathogenesis of Type ... [https://pmc.ncbi.nlm.nih.gov/articles/PMC7429527/]
- 90. Values of integration between lipidomics and clinical ... [https://translational-medicine.biomedcentral.com/articles/10.1186/s12967-019-1898-z]
- 91. Integrated cellular 4D-TIMS lipidomics and transcriptomics ... [https://www.frontiersin.org/journals/cell-and-developmental-biology/articles/10.3389/fcell.2024.1450971/full]
- 92. Ultrahigh-Performance Liquid Chromatography–Mass ... [https://www.spectroscopyonline.com/view/ultrahigh-performance-liquid-chromatography-mass-spectrometry-lipidomics]
- 93. Integration of clinical phenoms and metabolomics facilitates ... [https://pmc.ncbi.nlm.nih.gov/articles/PMC11063108/]
- 94. A Guide to Multi-omics Integration Strategies [https://frontlinegenomics.com/a-guide-to-multi-omics-integration-strategies/]
- 95. Smccnet 2.0: a comprehensive tool for multi-omics network ... [https://bmcbioinformatics.biomedcentral.com/articles/10.1186/s12859-024-05900-9]
- 96. Recommendations for good practice in MS-based lipidomics [https://pmc.ncbi.nlm.nih.gov/articles/PMC8585648/]
- 97. Lipidomic Risk Score to Enhance Cardiovascular ... [https://www.sciencedirect.com/science/article/pii/S0735109724074321]
- 98. Lipid Disorders and Cardiovascular Risk [https://pmc.ncbi.nlm.nih.gov/articles/PMC10825376/]