Uncovering Hidden Biology: A Comprehensive Guide to GiniClust for Rare Cell Type Detection in Single-Cell RNA Sequencing
This article provides a detailed exploration of GiniClust, a specialized algorithm for detecting rare cell types in single-cell RNA-seq data using the Gini index.
Uncovering Hidden Biology: A Comprehensive Guide to GiniClust for Rare Cell Type Detection in Single-Cell RNA Sequencing
Abstract
This article provides a detailed exploration of GiniClust, a specialized algorithm for detecting rare cell types in single-cell RNA-seq data using the Gini index. Targeted at researchers, scientists, and drug development professionals, we cover foundational concepts, methodological steps, practical troubleshooting, and comparative validation. Readers will gain a complete understanding of how GiniClust works, how to implement it effectively, its performance relative to other tools, and its critical implications for uncovering novel cell populations in immunology, neurobiology, and cancer research.
What is GiniClust? Understanding the Need and Theory Behind Rare Cell Detection
The detection and characterization of rare cell types (<1% of a population) represent a pivotal challenge and opportunity in single-cell genomics. Within the broader thesis on GiniClust, a method leveraging the Gini index for rare cell type identification, this document details the application and protocols for isolating and studying these biologically critical subsets. Rare cells, such as stem cells, circulating tumor cells (CTCs), and rare immune subsets, are often drivers of development, disease progression, and therapy resistance but are obscured by bulk analysis or standard clustering algorithms.
The following table summarizes the quantitative impact of rare cell types in key biomedical research areas, highlighting the necessity for specialized detection tools like GiniClust.
Table 1: Impact of Rare Cell Types in Biomedical Research
| Research Area | Example Rare Cell Type | Typical Frequency | Key Functional Role | Implication for Drug Development |
|---|---|---|---|---|
| Oncology | Cancer Stem Cells (CSCs) | 0.1% - 2% | Tumor initiation, metastasis, therapy resistance | Target for eradicating minimal residual disease & preventing relapse |
| Immunology | Antigen-Specific T Cells (pre-treatment) | <0.01% - 0.1% | Pathogen or tumor cell recognition | Biomarker for vaccine efficacy; target for immunotherapies (e.g., CAR-T) |
| Neurology | Neural Stem/Progenitor Cells | ~1% in niche regions | Neurogenesis, neural repair | Potential target for neurodegenerative disease therapies |
| Developmental Biology | Primordial Germ Cells | ~0.01% at specific stages | Give rise to gametes | Understanding infertility and developmental disorders |
| Infectious Disease | Latently HIV-Infected Cells | <0.01% in treated patients | Viral reservoir preventing cure | Primary barrier to an HIV cure; target for "shock and kill" strategies |
Experimental Protocols
Protocol 1: GiniClust-Based Rare Cell Detection from scRNA-seq Data
Objective: To identify rare cell populations from single-cell RNA-sequencing (scRNA-seq) count matrices using the GiniClust algorithm. Materials: High-quality scRNA-seq count matrix, R statistical environment (v4.0+). Procedure:
- Data Preprocessing: Load the gene expression count matrix into R. Filter out low-quality cells (e.g., with high mitochondrial gene percentage) and genes expressed in fewer than 3 cells.
- Gini Index Calculation: For each gene, calculate the Gini index across all cells. The Gini index quantifies inequality in gene expression distribution; a high Gini index suggests a gene is highly expressed in a small subset of cells.
Formula:
G = (2Σ_i i*x_i)/(n Σ_i x_i) - (n+1)/n, wherex_iis the expression of the gene in cell i sorted in ascending order, andnis the total number of cells. - Gene Selection: Select the top genes with the highest Gini index (default: top 200-500) as the "rare cell-enriched gene set."
- Clustering: Perform feature selection using the rare cell-enriched gene set. Apply dimensionality reduction (PCA) followed by graph-based clustering (e.g., Louvain algorithm) solely on this gene subspace.
- Rare Cluster Identification: Identify clusters that are small (e.g., < 5% of total cells) and visually distinct in t-SNE/UMAP embeddings based on the selected genes. These are candidate rare cell types.
- Validation: Perform differential expression analysis between the candidate rare cluster and all other cells to find unique marker genes. Validate markers using orthogonal methods (e.g., FISH, flow cytometry).
Protocol 2: Functional Validation of Rare Circulating Tumor Cells (CTCs)
Objective: To isolate and culture rare CTCs from patient blood for ex vivo drug testing. Materials: Patient blood samples, negative depletion or positive enrichment CTC isolation kit, low-attachment culture plates, conditioned medium. Procedure:
- Blood Collection & Processing: Collect 10-20 mL of blood in EDTA or CellSave tubes. Process within 96 hours. Perform red blood cell lysis or density gradient centrifugation.
- CTC Enrichment: Use an epitope-agnostic negative depletion system (e.g., CD45+, CD16+ depletion) to remove hematopoietic cells, enriching for untouched CTCs. Alternatively, use positive selection for epithelial markers (e.g., EpCAM).
- Identification & Isolation: Stain the enriched cell fraction with antibodies against cytokeratins (CK+), CD45 (leukocyte marker), and DAPI (nuclei). Identify CTCs as CK+/CD45-/DAPI+ events using fluorescence microscopy or flow cytometry. Manually pick single CTCs or use FACS into 96-well plates.
- Ex Vivo Culture: Culture isolated single CTCs in low-attachment plates using a specialized serum-free medium supplemented with growth factors (EGF, bFGF). Use conditioned medium from cancer-associated fibroblast cultures to improve viability.
- Drug Sensitivity Assay: After 7-14 days of expansion, treat CTC-derived microclusters with a panel of oncology drugs (e.g., chemotherapy, targeted therapy). Assess cell viability after 72-96 hours using CellTiter-Glo 3D assay. Compare IC50 values to established cancer cell lines.
Diagrams
Diagram 1: GiniClust Workflow for Rare Cell Detection
Diagram 2: Key Signaling in Cancer Stem Cells (CSCs)
The Scientist's Toolkit: Research Reagent Solutions
Table 2: Essential Reagents for Rare Cell Research
| Reagent/Material | Supplier Examples | Primary Function in Rare Cell Workflows |
|---|---|---|
| Single-Cell 3' RNA Kit v3.1 | 10x Genomics | Generates barcoded scRNA-seq libraries for transcriptomic profiling of heterogeneous samples. |
| Chromium Next GEM Chip K | 10x Genomics | Microfluidic chip for partitioning single cells into gel beads-in-emulsion (GEMs). |
| CD45 Depletion MicroBeads | Miltenyi Biotec, StemCell Tech | Magnetic bead-based negative selection to remove leukocytes, enriching for rare non-hematopoietic cells (e.g., CTCs). |
| EpCAM MicroBeads | Miltenyi Biotec | Magnetic bead-based positive selection for epithelial cell adhesion molecule, used for CTC enrichment. |
| CellSearch CTC Kit | Menarini Silicon Biosystems | FDA-cleared system for enumeration of CTCs from whole blood using EpCAM-based immunomagnetic capture. |
| Anti-human CD34 MicroBead Kit | Miltenyi Biotec | Isolation of hematopoietic stem and progenitor cells (HSPCs) for research. |
| Recombinant EGF & bFGF | PeproTech, R&D Systems | Essential growth factors for maintaining stemness in ex vivo cultures of rare stem/progenitor cells. |
| CellTiter-Glo 3D Cell Viability Assay | Promega | Luminescent assay optimized for measuring viability in 3D microclusters or low-attachment cultures derived from rare cells. |
| Smart-seq2 Reagents | Takara Bio, Thermo Fisher | Ultra-low input RNA-seq kit for high-coverage transcriptomics of single, manually picked rare cells. |
| CITE-seq Antibodies | BioLegend, BD Biosciences | Oligo-tagged antibodies for simultaneous measurement of surface protein and mRNA in single cells, enhancing rare cell characterization. |
Theoretical Foundation: From Economics to Genomics
The Gini index, traditionally used in economics to quantify income or wealth inequality within a nation, has been repurposed in genomics to measure the inequality of gene expression across a population of single cells. A Gini index of 0 indicates perfect equality (uniform expression across all cells), while an index of 1 indicates maximal inequality (expression concentrated in a single cell). This property makes it exceptionally suitable for identifying genes with highly heterogeneous, "spike-like" expression patterns characteristic of rare cell type markers.
Table 1: Gini Index Interpretation in Single-Cell RNA-Seq
| Gini Index Range | Interpretation of Expression Inequality | Potential Biological Implication |
|---|---|---|
| 0.0 - 0.2 | Highly uniform expression | Housekeeping or essential genes |
| 0.2 - 0.5 | Moderate inequality | Common differentiated cell states |
| 0.5 - 0.7 | High inequality | Specialized functional genes |
| 0.7 - 1.0 | Very high inequality | Candidate rare cell type marker |
Core Protocol: Calculating the Gini Index from scRNA-seq Data
Objective: To compute the Gini index for each gene from a single-cell RNA-sequencing (scRNA-seq) count matrix.
Materials & Input:
- Processed scRNA-seq count matrix (cells x genes), normalized for library size (e.g., CPM, TPM).
- Computational environment (R/Python).
Procedure:
- Data Preprocessing: Begin with a normalized expression matrix. Apply a log-transformation (e.g., log2(CPM+1)) to dampen the effect of extreme outliers.
- Sort Expression Values: For each gene g, sort its expression values across N cells in ascending order: ( x{1,g} \leq x{2,g} \leq ... \leq x_{N,g} ).
- Compute Lorenz Sum: Calculate the cumulative sum of expression values. ( L{i,g} = \sum{j=1}^{i} x_{j,g} )
- Calculate Gini Coefficient: Use the Brown formula for efficiency in computation: ( Gg = \frac{2 \sum{i=1}^{N} i \cdot x{i,g}}{N \sum{i=1}^{N} x_{i,g}} - \frac{N+1}{N} )
- Gene Ranking: Rank all genes by their calculated Gini index in descending order. Genes at the top (Gini > ~0.7) are candidates for rare cell type markers.
Integrated Protocol: GiniClust Workflow for Rare Cell Detection
GiniClust combines the Gini index with clustering to robustly identify rare cell populations.
Table 2: GiniClust Workflow Steps
| Step | Action | Key Parameters & Notes |
|---|---|---|
| 1. Gene Selection | Filter genes based on Gini Index. | Select top M genes (e.g., 1000-2000) with highest Gini. |
| 2. Distance Calculation | Compute cell-cell distances using selected high-Gini genes. | Use Jaccard distance on binarized expression (expression > 0). |
| 3. Dimensionality Reduction | Perform t-Distributed Stochastic Neighbor Embedding (t-SNE). | Use the Jaccard distance matrix as input. |
| 4. Clustering | Apply Density-Based Spatial Clustering (DBSCAN) on the t-SNE map. | DBSCAN parameters (eps, minPts) are critical for rare cluster detection. |
| 5. Validation & Analysis | Perform differential expression on cluster identities. | Compare putative rare cluster vs. all others to find definitive markers. |
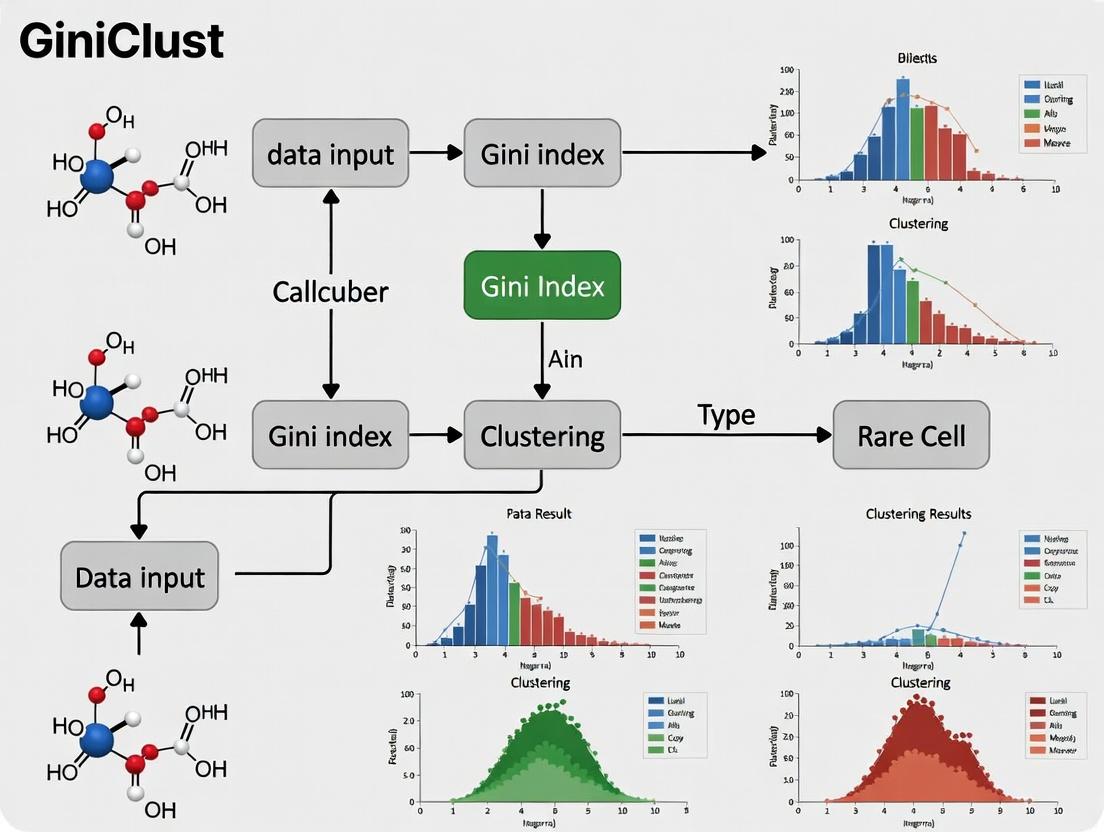
Workflow for Rare Cell Detection using GiniClust.
Application Note: Validating a Rare Endocrine Cell Type
Hypothesis: A small cluster of cells expressing high levels of GeneX (Gini = 0.85) represents a previously uncharacterized rare endocrine cell type.
Validation Protocol (Multiplexed Fluorescence In Situ Hybridization):
- Probe Design: Design and order smFISH probe sets against GeneX and markers for neighboring abundant cell types (e.g., Ins1 for beta cells, Gcg for alpha cells).
- Tissue Preparation: Fix pancreatic tissue sections from the model organism. Perform standard permeabilization and dehydration steps.
- Hybridization: Incubate sections with fluorescently labeled probe sets overnight at 37°C in a humidified chamber.
- Imaging & Analysis: Acquire high-resolution z-stack images using a confocal microscope. Use image analysis software (e.g., CellProfiler) to identify individual cells and quantify transcript spots.
- Expected Result: GeneX transcripts will be co-localized in a very sparse subset of cells (<1% total) that are negative for major endocrine markers, confirming both the rarity and unique identity of the cell type.
Logical flow from Gini-based discovery to spatial validation.
The Scientist's Toolkit: Key Research Reagent Solutions
Table 3: Essential Materials for Gini-Based Rare Cell Discovery
| Reagent / Tool | Function in Protocol | Example Product / Specification |
|---|---|---|
| scRNA-seq Kit | Generation of primary single-cell expression matrix. | 10x Genomics Chromium Single Cell 3' Kit. |
| Bioinformatics Pipeline | Processing raw reads into a count matrix. | Cell Ranger (10x) or STARsolo + Alevin. |
| High-Performance Computing | Running GiniClust and associated analyses. | Linux cluster with >32GB RAM & multi-core CPU. |
| GiniClust Software | Executing the specific algorithm. | R package GiniClust or custom Python scripts. |
| smFISH Probe Set | Spatial validation of candidate rare cells. | PrimeFlow RNA Assay or Stellaris Probes. |
| Confocal Microscope | High-resolution imaging of validation assays. | System with 40x/63x oil objective and spectral unmixing. |
This Application Note details the methodology and protocols for employing GiniClust, a computational algorithm designed for the discovery of rare cell populations from single-cell RNA sequencing (scRNA-seq) data. The core thesis positions the Gini index, a classical measure of statistical dispersion used in economics, as an ideal metric for quantifying gene-specific sparsity—a hallmark of rare cell type expression patterns. Unlike conventional clustering methods (e.g., K-means, hierarchical clustering) that rely on variance or mean expression and often fail to distinguish rare types, GiniClust explicitly leverages the uneven distribution of gene expression to achieve high sensitivity.
Table 1: Comparative Performance of GiniClust vs. Other Methods on Benchmark Datasets
| Method | Dataset (Rare Cell Type) | Rare Population Size (% of total) | Detection Recall (Sensitivity) | Precision | Reference F1-Score |
|---|---|---|---|---|---|
| GiniClust | Melanoma (T-cell) | ~1.5% | 0.92 | 0.88 | 0.90 |
| Seurat (v3) | Melanoma (T-cell) | ~1.5% | 0.65 | 0.91 | 0.76 |
| GiniClust | PBMCs (Dendritic Cells) | ~2.0% | 0.95 | 0.82 | 0.88 |
| SC3 | PBMCs (Dendritic Cells) | ~2.0% | 0.70 | 0.95 | 0.81 |
| GiniClust | Pancreatic Islets (Epsilon) | ~0.5% | 0.85 | 0.75 | 0.80 |
| CIDR | Pancreatic Islets (Epsilon) | ~0.5% | 0.45 | 0.90 | 0.60 |
Table 2: Top Gini-Index Selected Genes in a Model Hematopoiesis Dataset
| Gene Symbol | Gini Index Value | Known Association with Rare Cell Type |
|---|---|---|
| CD34 | 0.89 | Hematopoietic Stem Cells |
| FCER1A | 0.85 | Plasmacytoid Dendritic Cells |
| PPBP (CXCL7) | 0.82 | Megakaryocyte Progenitors |
| GATA1 | 0.78 | Erythroid Precursors |
| MS4A1 (CD20) | 0.71 | Mature B Cells |
Detailed Experimental Protocols
Protocol 3.1: GiniClust Workflow for Rare Cell Discovery
A. Input Data Preprocessing
- Data Source: Start with a gene expression matrix (cells x genes) from a standard scRNA-seq pipeline (CellRanger, STARsolo, etc.).
- Quality Control: Filter out low-quality cells based on:
- Unique gene counts (< 200 or > 6000).
- High mitochondrial read percentage (> 20%).
- Low total UMI counts.
- Normalization: Perform library size normalization (e.g., counts per 10,000) and log-transform (log1p) the data.
B. Gini Index Calculation & Feature Selection
- For each gene i across N cells, calculate the Gini index:
- Sort expression values: xᵢ₁ ≤ xᵢ₂ ≤ ... ≤ xᵢₙ.
- Compute: Gᵢ = (2Σₖ₌₁ⁿ kxᵢₖ)/(nΣₖ₌₁ⁿ xᵢₖ) - (n+1)/n.
- Select the top M genes (default M=1000) with the highest Gini indices as the "rare cell-enriched" feature set.
C. Dimensionality Reduction and Clustering
- PCA: Perform Principal Component Analysis on the selected high-Gini gene matrix.
- Jaccard Similarity Graph: Construct a cell-to-cell similarity graph using Jaccard index based on binarized expression (expression > 0) of the high-Gini genes. This step is crucial for capturing shared sparse signals.
- Community Detection: Apply the Louvain community detection algorithm on the Jaccard graph to identify cell clusters.
D. Post-Clustering Analysis
- Differential Expression: Identify marker genes for each cluster using Wilcoxon rank-sum test.
- Rare Population Annotation: Cross-reference marker genes with known cell-type-specific signatures to annotate the discovered rare cluster(s).
- Validation: Validate findings via:
- Independent FISH or IHC on original tissue.
- Flow cytometry with predicted marker combinations.
- Pseudotime analysis to confirm distinct developmental trajectories.
Protocol 3.2: Wet-Lab Validation via FluorescentIn SituHybridization (FISH)
- Objective: Validate the spatial localization and existence of a rare cell population identified by GiniClust.
- Materials: See "Scientist's Toolkit" (Section 5).
- Procedure:
- Prepare formalin-fixed paraffin-embedded (FFPE) or frozen tissue sections (5-7 µm).
- Perform protease digestion for epitope retrieval.
- Hybridize with target-specific, fluorescently labeled RNA probes for the top 2-3 marker genes identified for the rare cluster.
- Counterstain with DAPI and apply anti-fade mounting medium.
- Image using a confocal or fluorescence microscope. Co-localization of signals confirms the rare cell population.
Mandatory Visualizations
Title: GiniClust Computational Workflow
Title: Logic of Gene Sparsity for Rare Cell Detection
The Scientist's Toolkit: Research Reagent Solutions
Table 3: Essential Materials for GiniClust Analysis & Validation
| Item / Reagent | Provider / Example | Function in Protocol |
|---|---|---|
| Chromium Controller & Next GEM Kits | 10x Genomics | Generation of high-throughput scRNA-seq libraries. |
| Cell Ranger Software Suite | 10x Genomics | Primary processing of scRNA-seq data to generate expression matrices. |
| R Package: GiniClust2 | CRAN / GitHub | Implements the complete GiniClust algorithm for rare cell detection. |
| Python Package: Scanpy | GitHub | Alternative environment for implementing Gini-based pre-filtering and analysis. |
| RNAScope Probe(s) | ACD Bio | Target-specific probes for FISH validation of rare cell marker genes. |
| Anti-human CD34 Antibody | BioLegend | Flow cytometry validation of predicted rare hematopoietic stem cells. |
| DAPI Nucleic Acid Stain | Thermo Fisher | Nuclear counterstain for microscopy in validation protocols. |
| Loupe Browser | 10x Genomics | Interactive visualization of clustering results, including Gini-informed clusters. |
Application Notes
This document provides essential definitions and experimental considerations for single-cell RNA sequencing (scRNA-seq) analysis within the context of rare cell type detection using the Gini index, as implemented in tools like GiniClust.
1. Key Definitions
- Rare Cells: Cell types present at a low abundance (typically <1% to 5% of the total population) within a heterogeneous sample. Their identification is critical for understanding tissue microenvironments, developmental hierarchies, and disease mechanisms (e.g., cancer stem cells, circulating tumor cells).
- Doublets: Artifactual events where two or more cells are captured within a single droplet or emulsion, leading to a hybrid expression profile. Doublets can be classified as homotypic (same cell type) or heterotypic (different cell types) and can confound analysis by mimicking novel or transitional cell states.
- Technical Variation: Non-biological noise introduced during sample preparation and data generation. Major sources include:
- Library preparation efficiency and batch effects.
- Sequencing depth and quality.
- Amplification bias and PCR duplicates.
- Cell viability and ambient RNA (the "soup" of free-floating RNA).
- Biological Variation: True differences in gene expression arising from cell state, type, cycle, differentiation, or response to stimuli. Distinguishing this from technical variation is the central challenge of scRNA-seq analysis.
2. Quantitative Summary of Variation Sources
Table 1: Common Sources of Variation in scRNA-seq Data
| Variation Type | Primary Sources | Typical Impact on Data | Mitigation Strategies |
|---|---|---|---|
| Technical | Low mRNA capture efficiency | Zero-inflation ("dropouts") | UMIs, quality control (QC) filters |
| Technical | Library batch effects | Sample-specific clustering | Harmony, Seurat's CCA integration |
| Technical | Ambient RNA contamination | Background expression in all cells | SoupX, CellBender, empty droplet analysis |
| Technical | Doublet formation | False hybrid expression profiles | DoubletFinder, scDblFinder, sample multiplexing |
| Biological | Cell cycle phase (S, G2/M) | Major expression program shift | Cell cycle scoring & regression |
| Biological | Differential stress response | Uninteresting heterogeneity | Regress out mitochondrial gene % |
| Biological | Rare cell type presence | Small, distinct cell population | GiniClust, RaceID, use of high-sensitivity assays |
Table 2: Impact of Doublet Rates on Experimental Design
| Number of Cells Loaded | Estimated Doublet Rate (10x Genomics) | Implication for Rare Cell Detection |
|---|---|---|
| 5,000 | ~2.4% | Manageable; computational removal typically sufficient. |
| 10,000 | ~4.8% | Significant. Requires robust doublet detection. |
| 20,000 | ~9.6% | High. Can severely obscure rare populations. Multiplexing recommended. |
Experimental Protocols
Protocol 1: ScRNA-seq Workflow with Emphasis on Rare Cell and Doublet Detection
Objective: To generate high-quality scRNA-seq data suitable for the identification of rare cell populations using GiniClust, while minimizing technical artifacts.
- Single-Cell Suspension Preparation:
- Dissociate tissue using enzymatic and mechanical methods optimized for target tissue.
- Pass suspension through a 40-μm flow strainer. Perform red blood cell lysis if necessary.
- Critical: Assess viability (>90% target) using Trypan Blue or AO/PI staining on a Countess II FL.
- Doublet Mitigation: If possible, use sample multiplexing (e.g., CellPlex, MULTI-seq) by labeling cells from different conditions/samples with lipid-tagged oligonucleotide barcodes prior to pooling.
- Library Preparation & Sequencing:
- Load cells onto the 10x Chromium Controller or similar platform. Do not overload. Refer to Table 2 to choose a cell load that balances yield with an acceptable doublet rate.
- Generate single-cell GEMs (Gel Bead-in-Emulsions) and perform reverse transcription, cDNA amplification, and library construction per manufacturer protocol (10x Genomics Chromium Next GEM Single Cell 3' Kit v3.1).
- Pool libraries and sequence on an Illumina NovaSeq 6000. Target Depth: Aim for a minimum of 50,000 reads per cell for robust rare cell detection.
- Primary Data Processing:
- Use
Cell Ranger(10x) orkallisto|bustoolsfor demultiplexing, alignment, and UMI counting. - Generate a raw gene-barcode matrix.
- Use
- Quality Control & Doublet Removal:
- Process data in R using
Seuratorscater. Filter cells based on:- nFeatureRNA (gene count): 500-6000 (adjust based on distribution).
- nCountRNA (UMI count): 1000-30,000.
- Percent mitochondrial reads: <10-20% (tissue-dependent).
- Doublet Identification: Run
DoubletFinderorscDblFinderon the filtered object. The expected doublet formation rate is predicted from the cell load. Remove identified doublets.
- Process data in R using
- Downstream Analysis for Rare Cells:
- Normalize (
SCTransformrecommended) and perform dimensionality reduction (PCA). - Cluster cells using graph-based methods (e.g., FindNeighbors, FindClusters in Seurat).
- Apply GiniClust: Follow the GiniClust protocol to identify clusters with high Gini index scores, indicative of rare cell types with highly variable, specific gene expression.
- Normalize (
Protocol 2: Validating a Rare Cell Population Identified by GiniClust
Objective: To biologically confirm the identity and function of a rare cell cluster.
- Bioinformatic Validation:
- Perform differential expression analysis between the rare cluster and all other cells.
- Conduct gene set enrichment analysis (GSEA) on the upregulated markers to infer biological function.
- Check expression of known, definitive marker genes from literature via violin plots.
- Wet-Lab Validation:
- Fluorescence-Activated Cell Sorting (FACS): Design a FACS panel based on the top 2-3 surface protein markers identified in the rare cluster. Sort the putative rare population and a control population into separate tubes.
- Functional Assay: Plate sorted cells in appropriate medium and perform a functional assay (e.g., sphere formation assay for stem cells, cytokine secretion ELISA for immune cells).
- qPCR Validation: Isolve RNA from sorted populations and perform qPCR for the top differentially expressed genes from the scRNA-seq data.
The Scientist's Toolkit
Table 3: Key Research Reagent Solutions for scRNA-seq Studies of Rare Cells
| Item | Function | Example Product/Catalog |
|---|---|---|
| Viability Stain | Distinguish live/dead cells during QC. | LIVE/DEAD Fixable Viability Dyes (Thermo Fisher), Propidium Iodide. |
| Nuclease-Free Water | Prevent RNA degradation in all reaction mixes. | Invitrogen UltraPure DNase/RNase-Free Water. |
| Single-Cell 3' Gel Bead Kit | Core reagent for barcoding & sequencing library prep. | 10x Genomics Chromium Next GEM Single Cell 3' Kit v3.1. |
| Sample Multiplexing Kit | Labels cells from different samples for pooling, reducing doublets & costs. | 10x Genomics CellPlex Kit, BioLegend TotalSeq-C antibodies. |
| Phosphate-Buffered Saline (PBS) | Washing and diluting cells; must be nuclease-free for scRNA-seq. | Gibco Dulbecco's PBS, no calcium, no magnesium. |
| BSA Solution | Used to block non-specific binding and improve cell suspension. | 0.04% UltraPure BSA in PBS. |
| DNase I | For tissue dissociation protocols to prevent clumping. | Worthington Biochemical, DNase I. |
| RT Inhibitor | Optional additive to improve GEM-RT reaction. | Maxima H Minus RT Enzyme (Thermo Fisher). |
| SPRIselect Beads | For post-amplification cDNA and library clean-up & size selection. | Beckman Coulter SPRIselect. |
Visualizations
Workflow for Rare Cell Detection with GiniClust
Sources of scRNA-seq Variation
This document, situated within a broader thesis on employing the Gini index for rare cell type detection, provides detailed application notes and protocols for GiniClust. GiniClust is a specialized computational framework designed to identify rare and highly variable cell populations in single-cell RNA sequencing (scRNA-seq) data, addressing a critical gap in standard clustering tools that often overlook minority cell types.
Prerequisites for Implementing GiniClust
Computational and Software Environment
- Operating System: Linux or macOS recommended; Windows with compatible R environment possible.
- R Version: R (≥ 3.5.0).
- Required R Packages:
GiniClust,Seurat(for data handling and preprocessing),ggplot2,reshape2,data.table,Matrix,plyr,DCA(for denoising),igraph,statmod,fastcluster,pheatmap. - Hardware: Minimum 8GB RAM; 16GB+ recommended for datasets with >10,000 cells.
Data Prerequisites
- Input Format: A gene-by-cell expression matrix (counts). Accepted formats include
.txt,.csv, or aSingleCellExperiment/Seuratobject. - Data Quality: Data should be preprocessed to remove low-quality cells and ambient RNA. Library size normalization and log-transformation are performed internally but can be customized.
- Sequencing Depth: Sufficient sequencing depth to capture gene expression in rare cells is critical. Data from protocols like SMART-seq2 or 10x Genomics are suitable.
When to Choose GiniClust: Data Type Suitability
GiniClust is specifically engineered for scenarios where rare cell populations (≤ 5% of total cells) are of biological interest. The Gini index measures the inequality of gene expression across cells, effectively highlighting genes with highly specific expression in small subpopulations.
Table 1: Suitability of GiniClust Across scRNA-seq Data Types & Scenarios
| Data Type / Project Goal | Recommended? | Key Rationale |
|---|---|---|
| Rare cell type discovery (e.g., stem cells, circulating tumor cells) | Strongly Recommended | Core strength. Uses Gini index to detect genes with sparse, high expression. |
| Characterizing heterogeneous tumors | Recommended | Effective at identifying rare subclones or transitional states within a tumor. |
| Developmental biology (identifying progenitors) | Recommended | Can pinpoint rare progenitor or early differentiation states. |
| Standard cell atlas profiling (major types only) | Not Recommended | Standard tools (e.g., Seurat, Scanpy) are more efficient for balanced clusters. |
| Data with very low sequencing depth / high dropout | Use with Caution | High dropout rates can artificially inflate Gini scores; requires careful parameter tuning. |
| Analysis focused solely on differential expression | Not Recommended | GiniClust is a clustering tool. Use after detection for DE analysis. |
Table 2: Quantitative Performance Comparison (Illustrative Data from Literature) Summary of GiniClust's ability to recover rare cell populations spiked into datasets at known proportions.
| Rare Population Proportion | Detection Sensitivity (Recall) | Detection Precision | Compared to Conventional Clustering (e.g., K-means) |
|---|---|---|---|
| 1% | High (> 0.85) | Moderate to High | Significantly Superior |
| 5% | Very High (> 0.95) | High | Superior |
| 10% | High | High | Comparable or Slightly Better |
Detailed Experimental Protocol: GiniClust Workflow
Protocol 1: Full GiniClust Analysis Pipeline
Title: Complete GiniClust Workflow for Rare Cell Detection
Materials & Reagents:
- Input Data: Processed gene expression matrix (
matrix.txt). - Software: R environment with required packages installed.
Procedure:
- Data Loading and Preprocessing:
Gini Index Calculation and Gene Selection:
- The Gini index is computed for each gene. Genes are ranked.
- The Gini index is computed for each gene. Genes are ranked.
Denoising and Dimensionality Reduction:
- Denoising Autoencoder (DCA) is applied to the selected gene matrix to reduce technical noise.
- Denoising Autoencoder (DCA) is applied to the selected gene matrix to reduce technical noise.
Clustering and Rare Population Identification:
Visualization and Downstream Analysis:
Protocol 2: Benchmarking GiniClust Against Standard Methods
Title: Benchmarking GiniClust vs. Standard Clustering
Procedure:
- Use a dataset with known, spiked-in rare cells (e.g., 1% melanoma cells in PBMCs).
- Run the full GiniClust pipeline (Protocol 1).
- Run a standard pipeline (e.g., Seurat: FindVariableGenes -> ScaleData -> RunPCA -> FindNeighbors -> FindClusters at various resolutions).
- Calculate metrics comparing the cluster assignments to the known ground truth labels for the rare population.
The Scientist's Toolkit: Key Research Reagent Solutions
Table 3: Essential Materials & Tools for a GiniClust Project
| Item / Resource | Category | Function & Relevance to GiniClust |
|---|---|---|
| 10x Genomics Chromium Controller | Wet-lab Platform | Generates high-throughput, droplet-based scRNA-seq data, a common and suitable input data type for GiniClust analysis. |
| SMART-seq2 Reagents | Wet-lab Protocol | Provides full-length, high-depth sequencing for individual cells, useful for validating rare cell gene expression patterns identified by GiniClust. |
| GiniClust R Package (v2.0+) | Software | Core analysis toolkit implementing the Gini index-based clustering algorithm. |
| Seurat R Toolkit (v4+) | Software | Often used for upstream data QC, normalization, and integration, and for downstream analysis of clusters identified by GiniClust. |
| DCA (Denoising Autoencoder) | Software | Critical embedded component of GiniClust that denoises the high-Gini gene matrix, improving rare cluster detection. |
| Cell Hashing or MULTI-seq Tags | Wet-lab Reagent | Enables sample multiplexing. Helps in distinguishing true rare biological cells from doublets or background noise, refining input data quality. |
| Synthetic RNA Spike-in Mix (e.g., ERCC) | Wet-lab Reagent | Allows monitoring of technical noise. Understanding noise levels is crucial for interpreting Gini index values and tuning denoising parameters. |
| High-Performance Computing Cluster | Infrastructure | Accelerates computationally intensive steps (DCA, consensus clustering) for large datasets (>20,000 cells). |
Step-by-Step Implementation: How to Run GiniClust on Your Single-Cell Data
Within the broader thesis on advancing GiniClust for detecting rare cell types, robust data preprocessing is the critical foundation. The Gini index, which measures the inequality of gene expression across cells, is exceptionally sensitive to technical noise and data artifacts. This document details standardized protocols for normalization, quality control (QC), and gene filtering to ensure the reliable identification of rare cell populations.
Quality Control (QC) and Cell Filtering
Effective QC removes low-quality cells that can obscure rare cell type signals.
Protocol 2.1: Cell-Level QC Filtering
- Load Data: Import raw count matrix (cells x genes) into analysis environment (e.g., R/Seurat, Python/Scanpy).
- Calculate Metrics:
- Total Counts: Sum of counts per cell (library size).
- Detected Genes: Number of genes with count >0 per cell.
- Mitochondrial Fraction: Percentage of counts mapping to mitochondrial genes (e.g., MT-ND1, MT-CO3). Compute as (sum mitochondrial counts / total cell counts) * 100.
- Apply Filters: Exclude cells outside the thresholds defined in Table 1.
Table 1: Recommended Default QC Thresholds for Single-Cell RNA-seq Data
| QC Metric | Typical Lower Bound | Typical Upper Bound | Rationale |
|---|---|---|---|
| Total Counts | 500 - 1,000 | 50,000 - 100,000 | Removes empty droplets and high doublets |
| Detected Genes | 200 - 500 | 6,000 - 10,000 | Filters low-complexity and multiplets |
| Mitochondrial Fraction | - | 10% - 25% | Excludes dying or broken cells |
Normalization and Scaling
Normalization corrects for cell-specific biases to make expression profiles comparable.
Protocol 3.1: Total Count Normalization with Log-Transformation
- Input: QC-filtered raw count matrix.
- Size Factor Calculation: For each cell i, compute a size factor ( SFi = \frac{\text{Total counts}i}{\text{Median}(\text{Total counts across all cells})} ).
- Normalize: Divide counts for each gene in cell i by ( SF_i ).
- Log-Transform: Perform log1p transformation: ( \text{log1p}(X) = \log(X + 1) ). This stabilizes variance.
- Output: Log-normalized expression matrix for downstream gene filtering and Gini index calculation.
Gene Filtering for Gini Index Calculation
Pre-selecting a gene subset enhances the sensitivity of GiniClust to rare cell types.
Protocol 4.1: Highly-Dispersed Gene Selection
- Input: Log-normalized expression matrix from Protocol 3.1.
- Calculate Mean & Dispersion: For each gene, compute the mean expression and dispersion (variance/mean).
- Bin Genes: Group genes into n bins (e.g., 20) based on their mean expression.
- Normalize Dispersion: Within each bin, z-score normalize the dispersion values.
- Select Genes: Retain the top N genes (e.g., 1,000-2,000) with the highest normalized dispersion. These genes exhibit high cell-to-cell variability, a prerequisite for rare cell type detection.
Protocol 4.2: Expression Level Filtering
- Input: Log-normalized expression matrix.
- Apply Thresholds: Retain genes that satisfy both conditions in Table 2. This removes ubiquitously low or high genes that carry little discriminatory information.
Table 2: Gene Filtering Expression Thresholds
| Filter | Typical Value | Purpose |
|---|---|---|
| Minimum Expression in Cell Population | Expressed (log1p > 0) in ≥ 3-5 cells | Removes genes barely detected, reducing noise |
| Maximum Expression Fraction | Expressed (log1p > 0) in ≤ 95% of cells | Excludes ubiquitous housekeeping genes |
The Scientist's Toolkit: Research Reagent Solutions
Table 3: Essential Materials for GiniClust Preprocessing
| Item | Function & Relevance |
|---|---|
| Single-Cell RNA-seq Kit (e.g., 10x Genomics Chromium, SMART-Seq) | Generates the raw UMI/count matrix, the primary input for all preprocessing steps. |
| High-Performance Computing (HPC) Cluster or Cloud Resource | Essential for handling large-scale single-cell datasets during normalization and gene filtering. |
| R with Seurat/Bioconductor or Python with Scanpy | Core software ecosystems providing standardized functions for implementing the protocols above. |
| Mitochondrial Gene List (e.g., human MT- genes) | Crucial for calculating the key QC metric of mitochondrial fraction. |
| Droplet Utils / EmptyDrops (R) or CellBender (Python) | Algorithms to distinguish real cells from ambient RNA-containing empty droplets in droplet-based data. |
| Doublet Detection Tool (e.g., Scrublet, DoubletFinder) | Identifies and flags multiplets missed by basic QC filters, preventing spurious "rare cell" calls. |
Visualized Workflows
Data Preprocessing for GiniClust Pipeline
Gene Selection Logic for GiniClust
This protocol details the application of GiniClust, a computational method designed to identify rare cell populations within single-cell RNA sequencing (scRNA-seq) data. Framed within broader thesis research on the Gini index for rare cell detection, these application notes provide a step-by-step workflow, from data preprocessing to cluster validation, tailored for researchers and drug development scientists seeking to uncover biologically and therapeutically relevant rare cell types.
GiniClust leverages the Gini index, a statistical measure of inequality, to detect genes with highly variable expression patterns that are characteristic of rare cell populations. The pipeline consists of two complementary clustering approaches: one based on the Gini index and another based on Fano factor, which are combined to enhance sensitivity and specificity.
Diagram Title: GiniClust Pipeline Workflow
Detailed Protocol
Data Input and Quality Control
Objective: To prepare a high-quality expression matrix for downstream analysis.
Protocol:
- Input Data: Start with a cell-by-gene count matrix (genes as rows, cells as columns) generated from platforms like 10x Genomics, Smart-seq2, or inDrop.
- Cell Filtering: Remove cells with an extremely low number of expressed genes (potential empty droplets) or high mitochondrial gene percentage (indicative of apoptotic cells). Typical thresholds:
- Minimum genes per cell: 200-500.
- Maximum mitochondrial gene ratio: 10-20%.
- Gene Filtering: Remove genes expressed in fewer than a specified number of cells (e.g., <10 cells) to reduce noise.
- Normalization: Perform library size normalization (e.g., counts per million - CPM) followed by log-transformation (e.g., log2(CPM+1)).
Research Reagent Solutions:
| Item | Function in Protocol |
|---|---|
| Cell Ranger (10x Genomics) | Software suite for demultiplexing, barcode processing, and initial count matrix generation. |
| SoupX / CellBender | Computational tools to correct for ambient RNA contamination in droplet-based data. |
| Scrublet | Algorithm to detect and remove doublets (multiple cells in a single droplet). |
| Seurat / Scanpy | Comprehensive R/Python toolkits that provide functions for quality control, filtering, and normalization. |
Feature Selection Using Gini and Fano Factor
Objective: To identify genes that are highly and specifically expressed in rare cell subsets.
Protocol: A. Gini Index Gene Selection:
- Calculate the Gini index G for each gene i across all n cells: G_i = (2Σ{k=1}^n k * x{i(k)})/(n Σ{k=1}^n x{i(k)}) - (n+1)/n where x_{i(k)} is the k-th smallest expression value of gene i.
- Fit a relationship between the Gini index and mean expression. Select genes with a significantly higher Gini index than the fitted value (positive residual).
- Apply a p-value threshold (e.g., p < 0.01) to define the final "Gini gene" set.
B. Fano Factor Gene Selection:
- Calculate the Fano factor (variance/mean) for each gene.
- Similar to the Gini method, fit the relationship between Fano factor and mean expression.
- Select genes with a significantly higher Fano factor than the fitted trend as the "Fano gene" set.
Table 1: Comparison of Feature Selection Methods in GiniClust
| Metric | Gini Index-Based | Fano Factor-Based |
|---|---|---|
| Statistical Basis | Measures inequality of expression distribution. | Measures over-dispersion relative to Poisson. |
| Sensitivity to Rare Cells | High. Captures genes exclusive to small subsets. | Moderate. Captures genes with high variance. |
| Typical # of Genes Selected | ~500-2,000 | ~1,000-3,000 |
| Key Parameter | P-value threshold for residual significance. | P-value threshold for residual significance. |
| Primary Role in Pipeline | Detects rare population-specific markers. | Captures broader highly variable genes. |
Dimensionality Reduction and Clustering
Objective: To perform clustering on the two distinct gene sets to capture different aspects of cellular heterogeneity.
Protocol:
- Create Sub-matrices: Generate two expression sub-matrices: one containing only the Gini genes and another with only the Fano genes.
- Dimensionality Reduction (for each set):
- Apply Principal Component Analysis (PCA).
- Select significant PCs using an elbow plot or JackStraw procedure.
- Graph-Based Clustering (for each set):
- Construct a K-Nearest Neighbor (KNN) graph in PC space (e.g., k=20).
- Apply the Louvain or Leiden algorithm to identify cell communities (clusters).
- Critical Step: Use a relatively high resolution parameter (e.g., resolution=1.5-3.0) to allow for the splitting of potential rare clusters from major populations.
Cluster Ensemble and Consensus
Objective: To integrate the two clustering results and robustly identify rare cell clusters.
Protocol:
- Identify Candidate Rare Clusters: From the Gini-based clustering result, flag all clusters containing fewer than a user-defined percentage of total cells (e.g., 5% or 1%).
- Consensus Validation: Check if the cells within each candidate rare cluster from step 1 also co-cluster together in the Fano-based clustering result. This consensus increases confidence.
- Final Assignment: Cells consistently grouped together in both clustering results form the final set of robust rare cell clusters. Cells not assigned to a consensus rare cluster are grouped into "major" populations.
Diagram Title: Consensus Strategy for Rare Cluster Identification
Validation and Biological Annotation
Objective: To confirm the uniqueness and biological identity of the discovered rare clusters.
Protocol:
- Differential Expression (DE) Analysis: Perform DE testing between each rare cluster and all other cells. Use tests like Wilcoxon rank-sum or MAST.
- Marker Gene Identification: Select top significantly upregulated genes (p-value < 0.01, log2 fold-change > 1) from the DE analysis as cluster marker genes.
- Functional Enrichment: Input the marker gene list into enrichment tools (DAVID, Metascape) to identify associated biological processes, pathways, or disease terms.
- Cross-Reference with Known Cell Types: Compare marker genes with canonical cell type signatures from public databases (PanglaoDB, CellMarker) to propose a cell type identity.
Table 2: Example Output from a GiniClust Analysis of Pancreatic Islet Data
| Cluster ID | % of Total Cells | Top Marker Genes | Proposed Cell Type | Enriched Pathways (FDR < 0.05) |
|---|---|---|---|---|
| Major_1 | 45.7% | INS, IAPP, PDX1 | Beta Cells | Insulin secretion, Maturity onset diabetes |
| Major_2 | 32.1% | GCG, TTR, ARX | Alpha Cells | Glucagon signaling, Amino acid catabolism |
| RareConsensus1 | 0.9% | SST, PCP4, LEF1 | Delta Cells | Somatostatin signaling, Notch pathway |
| RareConsensus2 | 0.3% | PPY, AQP3, SERTM1 | PP/Gamma Cells | Pancreatic polypeptide activity |
Critical Parameters and Troubleshooting
- Rare Cell Threshold: The defining percentage for a "rare" cluster (Step 2.4) is experiment-dependent. Consider sequencing depth and biological context.
- Clustering Resolution: If no small clusters emerge from the Gini branch, progressively increase the clustering resolution parameter.
- Lack of Consensus: If candidate rare clusters fail Fano-branch validation, they may be technical artifacts. Inspect their marker genes for mitochondrial or ribosomal bias.
- Downstream Analysis: Isolated rare clusters can be extracted for sub-clustering or trajectory inference to explore further substructure or differentiation potential.
This walkthrough provides a reproducible framework for implementing the GiniClust pipeline. By strategically combining the Gini index's sensitivity for sparse patterns with the Fano factor's robustness, the method enables the systematic discovery of rare cell types that may hold key functions in development, disease, and therapeutic response.
Within the broader thesis on GiniClust for detecting rare cell types via Gini index-based single-cell RNA-seq analysis, precise parameter tuning is critical. The algorithm’s performance hinges on three core parameters: gini.bin, k_percent, and k_min. This document provides detailed application notes and experimental protocols for optimizing these parameters to enhance the sensitivity and specificity of rare cell population identification, directly impacting research in developmental biology, oncology, and drug target discovery.
Core Parameter Definitions & Quantitative Data
The parameters control different stages of the GiniClust3 pipeline, from gene filtering to final clustering.
Table 1: Core GiniClust3 Parameters for Rare Cell Detection
| Parameter | Default Value | Function | Impact on Rare Cell Detection |
|---|---|---|---|
gini.bin |
20 | Number of bins for categorizing genes based on mean expression during Gini index calculation. | A lower value increases granularity, potentially capturing subtle, rare population-specific genes but may increase noise. Higher values smooth the Gini vs. mean relationship, favoring robust, highly variable genes. |
k_percent |
5 | Percentage of total cells used to define the initial nearest-neighbor graph (k = k_percent * N_cells). |
Directly controls local connectivity. Lower values yield a sparser graph, isolating rare cells but risking fragmentation. Higher values increase connectivity, potentially merging rare populations with abundant ones. |
k_min |
20 | The minimum k for the nearest-neighbor graph, overriding k_percent if k_percent * N_cells < k_min. |
Ensures a baseline of connectivity in very small datasets or for extremely rare populations, preventing excessive isolation that hinders cluster formation. |
Table 2: Empirical Tuning Recommendations Based on Dataset Size
| Expected Rare Population Size | Dataset Size (Cells) | Suggested k_percent Range |
Suggested k_min Setting |
|---|---|---|---|
| Very Rare (<0.5%) | >20,000 | 1 - 3 | 15 - 30 |
| Rare (0.5% - 2%) | 5,000 - 20,000 | 3 - 5 | 20 - 40 |
| Moderately Rare (2% - 5%) | 1,000 - 5,000 | 5 - 10 | 20 - 50 |
Experimental Protocols for Parameter Optimization
Protocol 3.1: Systematic Grid Search for Parameter Calibration
Objective: To empirically determine the optimal combination of gini.bin, k_percent, and k_min for a given single-cell RNA-seq dataset.
Materials: Processed single-cell expression matrix (e.g., from CellRanger), high-performance computing cluster, R environment with GiniClust3 installed.
Procedure:
- Preprocessing: Normalize and log-transform the expression matrix. Do not perform broad-scale cell filtering.
- Define Parameter Grid:
gini.bin: Test values = c(10, 15, 20, 25, 30)k_percent: Test values = c(1, 3, 5, 7, 10)k_min: Test values = c(15, 20, 30, 40)
- Iterative Execution: Run GiniClust3 for each parameter combination.
- Validation & Scoring:
- Metric 1: Cluster-specific marker gene detection. Use Wilcoxon rank-sum test to assess the significance and fold-change of known or predicted rare cell markers within each candidate rare cluster.
- Metric 2: Stability using bootstrapping (resample 80% of cells, repeat clustering, measure Jaccard similarity of rare cluster assignments).
- Metric 3: Biological plausibility via enrichment analysis (GO, KEGG) on top genes from the Gini-based selection.
- Selection: Choose the parameter set that maximizes the product of (Metric1 p-value) and (Metric2 stability) while yielding biologically interpretable clusters.
Protocol 3.2: Benchmarking with Spike-in Rare Populations
Objective: To quantitatively assess parameter performance using a dataset with known, labeled rare cells. Materials: Synthetic mixture dataset (e.g., mixing two distinct cell lines at 1:99 ratio) or a dataset with well-annotated rare types (e.g., pancreatic delta cells). Procedure:
- Ground Truth Labeling: Annotate the true identity of the known rare cells.
- Parameter Sweep: Execute Protocol 3.1 on this benchmark dataset.
- Performance Calculation: For each output:
- Calculate Recall: Proportion of true rare cells correctly clustered together.
- Calculate Precision: Proportion of cells in the predicted rare cluster that are true rare cells.
- Calculate F1-Score: Harmonic mean of Precision and Recall.
- Analysis: Plot F1-Score versus each parameter. The peak indicates the optimal value for that specific dataset characteristic.
Visualizing the Parameter Workflow and Impact
Diagram Title: GiniClust3 Workflow with Key Parameter Injection Points
Diagram Title: Trade-off in kpercent/kmin Tuning for Rare Cell Detection
The Scientist's Toolkit: Research Reagent Solutions
Table 3: Essential Materials for GiniClust Parameter Optimization Studies
| Item | Function in Protocol | Example Product/Resource |
|---|---|---|
| Reference scRNA-seq Dataset with Known Rare Cells | Serves as a positive control and benchmark for parameter tuning. | 10x Genomics PBMC dataset (contains rare dendritic cells). Cell Mixology datasets (synthetic mixtures). |
| High-Performance Computing (HPC) Access or Cloud Credits | Enables the computationally intensive grid search across parameter space. | AWS EC2 instances, Google Cloud Compute Engine, or local SLURM cluster. |
| Single-Cell Analysis Software Suite | Provides the environment for preprocessing, running GiniClust3, and downstream analysis. | R (Seurat, SingleCellExperiment, GiniClust3 packages). Python (Scanpy). |
| Cell Type Annotation Database | Enables biological validation of clusters identified through parameter tuning. | CellMarker database, PanglaoDB, Human Protein Atlas. |
| Gene Set Enrichment Analysis Tool | Assesses the biological relevance of genes selected by the tuned Gini filter. | clusterProfiler (R), GSEApy (Python), Enrichr web tool. |
Within the broader thesis on utilizing the Gini index for rare cell type detection, GiniClust stands as a pivotal computational method. Its core innovation lies in applying the Gini index—a statistical measure of inequality—to single-cell RNA sequencing (scRNA-seq) gene expression distributions. This approach effectively identifies genes with highly uneven expression patterns, which are characteristic of rare cell populations. The subsequent challenge, and focus of these application notes, is the rigorous interpretation, visualization, and biological annotation of the candidate rare clusters output by GiniClust. This step transforms computational predictions into biologically meaningful discoveries with potential implications for developmental biology, disease mechanisms, and targeted drug development.
GiniClust generates several critical outputs. The primary result is a list of cells assigned to "rare" versus "major" clusters. The following table summarizes the core quantitative data structure a researcher must interpret.
Table 1: Core Quantitative Outputs from GiniClust Analysis
| Output Object | Data Type | Description | Key Metrics to Extract |
|---|---|---|---|
| Gini Gene List | Vector | Genes ranked by Gini index score. | Top N (e.g., 100-500) Gini genes. Median Gini score of the list. |
| Rare Cell Labels | Vector | Cluster assignment for each cell (e.g., "Rare1", "Major0"). | Number of rare clusters identified. Size (cell count) of each rare cluster. Percentage of total cells in each rare cluster. |
| Expression Matrix (Subset) | Matrix | Normalized expression data (e.g., log2(TPM+1)) for top Gini genes. | Mean expression of marker genes per cluster. Expression z-scores for annotation. |
| Dimensionality Reduction (t-SNE/UMAP) | Matrix | 2D coordinates for each cell from visualization. | Cluster separation score. Visual cohesion of rare clusters. |
Protocol: Visualizing Candidate Rare Clusters
This protocol details the steps for creating standard diagnostic plots from GiniClust outputs using R (ggplot2, scattermore) or Python (scanpy, matplotlib).
Protocol 3.1: Two-Dimensional Scatter Plot Visualization
Objective: To visually inspect the isolation and relative location of GiniClust-predicted rare clusters within the overall cell population.
Materials & Software:
- R:
ggplot2,scattermore(for large datasets),RColorBrewer. - Python:
scanpy,matplotlib,seaborn. - Input Data: GiniClust-generated cell cluster labels and 2D coordinates (e.g., from t-SNE or UMAP).
Procedure:
- Load Data: Import the cell cluster label vector and the 2D coordinate matrix (e.g.,
tsne_result.txt). - Create Data Frame: Combine coordinates and labels into a single data frame object.
- Generate Plot:
- Map the 2D coordinates to the x and y axes.
- Map the
cluster_labelto the point color (color/colaesthetic). - Assign a distinct, colorblind-friendly palette. Use a bright, contrasting color (e.g.,
#EA4335for primary rare cluster) against a neutral gray (#5F6368) for major populations. - (Optional) Use
scattermorein R orscanpy.pl.scatterwith `` to handle overplotting.
- Interpretation: Assess if rare cells form tight, distinct sub-clusters or appear as scattered outliers. This informs downstream biological validation strategy.
Visualization Workflow Diagram:
Diagram Title: Workflow for Visualizing GiniClust Clusters
Protocol: Annotating Rare Clusters with Marker Genes
Objective: To determine the putative cell type or state of the candidate rare cluster by examining the expression of known marker genes and highly expressed Gini genes.
Protocol 4.1: Differential Expression & Heatmap Creation
Materials & Software:
- R:
Seurat,pheatmap,dplyr. - Python:
scanpy(forsc.tl.rank_genes_groupsandsc.pl.heatmap). - Input Data: Full normalized expression matrix and GiniClust cluster labels.
Procedure:
- Differential Expression (DE) Analysis:
- Using the cluster labels as the grouping variable, perform DE analysis (e.g., Wilcoxon rank-sum test).
- Compare each rare cluster against all major cells combined, or against the most transcriptionally similar major cluster.
- Output: A ranked list of genes for each rare cluster by log2 fold-change and adjusted p-value.
- Marker Gene Overlap Analysis:
- Cross-reference the top 50 DE genes for the rare cluster with canonical cell-type marker databases (e.g., CellMarker, PanglaoDB).
- Table 2 should be constructed from this analysis.
- Expression Heatmap:
- Select the top 20 DE genes and/or key canonical markers.
- Plot a z-score scaled heatmap of expression for these genes across a random subset of major cells and all cells from the rare cluster(s).
Table 2: Rare Cluster Annotation Table
| Rare Cluster ID | Cell Count (% of Total) | Top 5 Gini/DE Genes | Overlap with Known Markers | Putative Cell Type | Confidence (High/Med/Low) |
|---|---|---|---|---|---|
| Rare1 | 15 (0.2%) | GP2, REG1A, CTRB2 | GP2 (Paneth), REG1A (Enteroendocrine) | Intestinal Secretory Progenitor | Medium |
| Rare2 | 8 (0.1%) | CYP24A1, SLC7A10 | CYP24A1 (Renal Tubule) | Atypical Renal Cell | Low |
| ... | ... | ... | ... | ... | ... |
Heatmap Generation Logic Diagram:
Diagram Title: Process for Annotating Rare Clusters
The Scientist's Toolkit: Research Reagent Solutions
Table 3: Essential Reagents and Tools for Validating GiniClust Predictions
| Item | Function in Validation | Example/Supplier |
|---|---|---|
| Single-Cell RNA-seq Library Kit | Generate sequencing data for in silico GiniClust analysis. | 10x Genomics Chromium Next GEM, SMART-Seq v4. |
| Cell Surface Marker Antibody Panel | Confirm rare population identity via FACS or CITE-seq. | BioLegend TotalSeq antibodies, BD Lyoplate screening kits. |
| Fluorescence In Situ Hybridization (FISH) Probes | Spatial validation of rare cell location and marker co-expression. | ACD Bio RNAscope probes for top Gini genes. |
| CRISPR/Cas9 Screening Library | Functional assessment of rare cell essential genes identified by Gini. | Broad Institute GeCKO or Brunello libraries. |
| Specialized Cell Culture Media | Isolate, expand, or functionally assay the putative rare cell type. | StemCell Technologies media for progenitors. |
| GiniClust Software | Core algorithm for rare cluster detection. | Available on GitHub (https://github.com/). |
| Scanpy / Seurat Toolkit | Downstream visualization, DE analysis, and annotation. | Python (Scanpy) or R (Seurat) environments. |
The identification of rare cell populations is critical for understanding disease mechanisms, immune responses, and developmental processes. This article, framed within a broader thesis on GiniClust, presents detailed Application Notes and Protocols for leveraging the Gini index-based clustering method to detect rare cell types. GiniClust’s sensitivity to highly variable genes makes it uniquely suited for uncovering rare transcriptional subtypes in single-cell RNA sequencing (scRNA-seq) data, with direct implications for immunology, oncology, and developmental biology.
Application Note 1: Immunology – Rare Immune Cell States in T Cell Exhaustion
Background: During chronic viral infection and in tumor microenvironments, CD8+ T cells enter a dysfunctional state known as exhaustion. Within this heterogeneous population, rare precursor exhausted T cells (Tpex) are crucial for sustaining the response and are the primary target of checkpoint immunotherapy.
GiniClust Utility: Standard clustering often groups all exhausted T cells together. GiniClust isolates the rare Tpex subset (often <5% of CD8+ T cells) based on high Gini coefficient genes like Tcf7, Cxcr5, and Slamf6.
Key Quantitative Findings (Summarized):
Table 1: Rare T Cell Populations Identified by GiniClust in Murine Chronic LCMV Model
| Cell Population | Frequency (Standard Clustering) | Frequency (GiniClust-Enhanced) | Key Marker Genes (High Gini) | Functional Significance |
|---|---|---|---|---|
| Precursor Exhausted (Tpex) | 2.1% | 4.8% (p<0.01) | Tcf7, Cxcr5 | Self-renewal, Response to PD-1 blockade |
| Transitional Exhausted | 8.5% | 9.1% | Gzmk, Pdcd1 | Intermediate differentiation state |
| Terminally Exhausted | 72.3% | 70.5% | Tox, Havcr2 | Irreversible dysfunction |
Protocol 1.1: ScRNA-seq Analysis of Tumor-Infiltrating T Cells with GiniClust
Objective: To identify rare pre-exhausted T cell subsets from dissociated tumor tissue.
Materials & Reagents:
- Single-cell suspension from tumor biopsy.
- 10x Genomics Chromium Controller & Single Cell 3’ Reagent Kits.
- Cell Ranger (v7.1+) pipeline for alignment and feature counting.
- R (v4.2+) with packages: GiniClust3, Seurat, ggplot2.
Procedure:
- Library Preparation & Sequencing: Generate scRNA-seq libraries per 10x Genomics protocol. Target 10,000 cells at a minimum depth of 50,000 reads/cell.
- Initial Processing: Use
Cell Ranger countfor alignment (GRCh38/hg38) and generation of a gene-cell UMI matrix. - Quality Control in R: Load matrix into Seurat. Filter cells with <200 genes, >6000 genes, or >15% mitochondrial reads.
- GiniClust3 Analysis:
- Normalize data using
LogNormalize. - Run
gini_build()on the normalized matrix to calculate Gini indices for all genes. - Select top 100-200 high Gini index genes.
- Perform clustering (
gini_clust()) using these genes alongside highly variable genes from Seurat.
- Normalize data using
- Visualization & Annotation: Run UMAP/t-SNE on the integrated gene space. Identify Tpex cluster by expression of TCF7, CXCR5. Extract subcluster for differential expression analysis.
The Scientist's Toolkit: Key Research Reagent Solutions
| Item | Function in This Protocol |
|---|---|
| Anti-PD-1 Therapy (e.g., Nivolumab) | In vivo checkpoint blockade to validate functional relevance of identified Tpex cells. |
| Fluorochrome-conjugated anti-CD8, anti-PD-1, anti-TCF7 antibodies | Flow cytometry validation of GiniClust-identified rare populations from parallel samples. |
| Chromium Next GEM Chip K | 10x Genomics microfluidic device for high-throughput single-cell partitioning. |
| Dual Index Kit TT Set A | For sample multiplexing, reducing batch effects and cost. |
| Live/Dead Fixable Near-IR Stain | Critical for excluding dead cells during FACS or bulk suspension preparation. |
Diagram: Workflow for Identifying Rare Tpex Cells with GiniClust
Application Note 2: Cancer – Rare Drug-Resistant Subclones in Melanoma
Background: Tumors contain rare subpopulations with inherent therapy resistance, driving relapse. In melanoma treated with BRAF/MEK inhibitors, a rare "Neural Crest Stem Cell (NCSC)-like" subclone survives and proliferates.
GiniClust Utility: GiniClust detects this rare subclone (<2% of tumor cells) based on high expression variability of NCSC genes (NGFR, AXL, EGFR).
Key Quantitative Findings (Summarized):
Table 2: Rare Cell Clusters in Pre-Treatment Melanoma scRNA-seq
| Cell Cluster | Approx. Frequency | Mean Gini Index of Top 5 Genes | Marker Genes | Association with Outcome |
|---|---|---|---|---|
| NCSC-like | 1.7% | 0.61 | NGFR, AXL | Progressed within 9 months |
| Melanocytic | 68.2% | 0.32 | MLANA, TYR | Initial responder |
| Mesenchymal-like | 22.4% | 0.45 | CDH2, PDGFRA | Invasive phenotype |
| Mitotic | 7.7% | 0.29 | MKI67, TOP2A | Proliferative |
Protocol 2.1: Longitudinal Tracking of Rare Resistant Clones
Objective: To isolate and functionally characterize GiniClust-identified rare NCSC-like cells pre- and post-treatment.
Materials & Reagents:
- Patient-derived xenograft (PDX) melanoma models.
- BRAF inhibitor (Vemurafenib), MEK inhibitor (Cobimetinib).
- FACS sorter with antibodies against NGFR(CD271) and AXL.
- In vivo bioluminescence imaging system.
Procedure:
- ScRNA-seq & GiniClust: Process pre-treatment PDX tumor as in Protocol 1.1. Use GiniClust to define the NCSC-like gene signature.
- FACS Isolation: Generate single-cell suspension from a parallel tumor. Stain with anti-human NGFR-APC and AXL-PE. Sort NGFRhigh/AXLhigh double-positive cells.
- Functional Assay:
- Culture sorted rare cells vs. bulk tumor cells in 3D Matrigel.
- Treat with 1µM Vemurafenib + 100nM Cobimetinib. Monitor spheroid growth for 14 days.
- Re-inject 1000 sorted NCSC-like cells vs. 1000 bulk cells into NSG mice (n=5/group). Treat with inhibitors and track tumor growth via caliper and bioluminescence.
- Validation Sequencing: Perform scRNA-seq on endpoint tumors to confirm expansion of the NCSC-like cluster.
Diagram: Protocol for Isolating and Testing Rare Drug-Resistant Clones
Application Note 3: Developmental Biology – Rare Progenitors in Organogenesis
Background: Organ development is orchestrated by transient, rare progenitor cells. In mouse embryonic pancreas, a rare Hnf1bhigh/*Pdx1low tip progenitor gives rise to both ductal and endocrine lineages.
GiniClust Utility: Applied to E14.5 pancreatic scRNA-seq, GiniClust resolves this rare multipotent progenitor state (<3% of epithelial cells), missed by standard methods.
Protocol 3.1: Fate-Mapping of a GiniClust-Identified Progenitor
Objective: To validate the lineage potential of the rare Hnf1bhigh tip progenitor.
Materials & Reagents:
- Hnf1b-CreERT2; Rosa26tdTomato mouse embryos.
- Tamoxifen for low-dose, pulsed induction.
- Immunofluorescence antibodies: anti-Tomato, anti-PDX1, anti-SOX9, anti-NKX6-1.
- Confocal microscopy setup.
Procedure:
- Identification: Perform scRNA-seq on wild-type E14.5 pancreatic epithelium. Run GiniClust to identify rare cluster with co-expression of tip (Hnf1b, Cpa1) and trunk (Sox9) markers.
- Genetic Fate-Mapping:
- Administer a single, low dose of Tamoxifen (0.05mg/g) to timed-pregnant Hnf1b-CreER; tdTomato dams at E14.5 to label the rare progenitor.
- Harvest embryos at E18.5 (short-term) and postnatal day 14 (P14) (long-term).
- Lineage Tracing Analysis:
- Process pancreas for frozen sections.
- Perform multiplex immunofluorescence for Tomato (progeny), PDX1 (endocrine/ductal), NKX6-1 (β-cell), SOX9 (ductal).
- Quantify the percentage of Tomato+ cells that co-localize with each marker at both timepoints. Confirm multipotency (ductal and endocrine progeny from a singly labeled cell).
Diagram: Fate-Mapping Strategy for a Rare Developmental Progenitor
Solving Common GiniClust Problems: Tips, Pitfalls, and Performance Enhancement
Within the broader research on utilizing the Gini index via GiniClust for detecting rare cell types in single-cell RNA sequencing (scRNA-seq) data, robust computational execution is critical. Failed runs due to software, environment, or data errors can significantly impede progress. These application notes provide a structured protocol for diagnosing and resolving common error messages encountered during GiniClust analysis, ensuring research efficiency for scientists in academia and drug development.
Common Error Messages and Solutions: A Structured Guide
The following table summarizes frequent GiniClust-related errors, their likely causes, and recommended solutions based on current community forums and documentation.
Table 1: Common GiniClust3 Error Messages and Diagnostic Solutions
| Error Message / Symptom | Root Cause | Diagnostic Steps | Solution |
|---|---|---|---|
| "Error in library(GiniClust3) : there is no package called ‘GiniClust3’" | Package not installed, or R environment path issue. | 1. Check (.libPaths()) in R. 2. Verify installation attempt log. |
Install from GitHub: devtools::install_github("VIPURlab/GiniClust3"). Ensure dependencies (e.g., Matrix, Rtsne, dbscan) are present. |
| "Error: cannot allocate vector of size X Mb/Gb" | Insufficient RAM for large sparse matrix calculations. | 1. Check object size with object.size(gene_count_matrix). 2. Monitor system memory usage. |
Filter low-expression genes/cells pre-process; Use a high-memory machine; Increase swap space; Utilize sparse matrix operations. |
Job fails silently or crashes during GiniClust3::GiniClust3_F |
Data input format mismatch or hidden NA/Infinite values. | 1. Validate matrix is numeric, non-negative, with correct row (genes) and column (cells) orientation. 2. Check for any(is.na(data)). |
Convert data to a standard matrix or dgCMatrix. Remove genes with zero counts across all cells. Pre-filter using Seurat or Scater. |
| Gini index calculation yields all NaNs or uniform values | Incorrect subsetting or a gene expression matrix with no variability. | 1. Calculate row variance (apply(data, 1, var)). 2. Verify the matrix is not log-transformed twice. |
Ensure input is raw or normalized counts, not log-transformed. Use the fpm() or CalculateGini() function on appropriate data. |
| "dbscan reachability plot error" during clustering | Parameter eps (neighborhood radius) is set incorrectly for the data's density. |
1. Perform k-NN distance plot (dbscan::kNNdistplot) to estimate optimal eps. 2. Check minPts parameter. |
Re-tune eps and minPts parameters for the specific dataset. The default may not be suitable for all rare cell distributions. |
| No rare cell clusters identified despite known biology | Thresholds (Gini.pvalue_cutoff, Gini.foldchange_cutoff) are too stringent. |
1. Inspect the distribution of calculated Gini indices and p-values. 2. Check clustering output object structure. | Adjust cutoffs iteratively. Use GiniClust3::FindPar() for guidance. Validate with known marker genes from literature. |
Experimental Protocol: Validating GiniClust3 Installation and Run
This protocol ensures a functional GiniClust3 environment.
Protocol 1: Environment Setup and Data Validation for Rare Cell Detection
Objective: To establish a reproducible R environment and validate the input data structure for GiniClust3 analysis.
Materials:
- Computing system with R (≥v4.0) and Bioconductor installed.
- scRNA-seq count matrix (genes x cells) in
.txt,.csv, or.rdsformat. - High-performance computing (HPC) resources recommended for large datasets (>10,000 cells).
Procedure:
- Environment Preparation: Open R or RStudio. Install necessary dependencies.
Data Loading and Sanitization: Load your count matrix. Ensure it is a numeric matrix with row and column names.
Pre-filtering Workflow: Use
Seuratorscaterfor rigorous QC before GiniClust.Core GiniClust3 Execution: Run the main pipeline.
Diagnostic Visualization: Generate plots to diagnose the run.
Visualizing the GiniClust3 Diagnostic Workflow
Title: GiniClust3 Diagnostic and Execution Workflow
The Scientist's Toolkit: Key Research Reagent Solutions
Table 2: Essential Computational Reagents for GiniClust Experiments
| Item / Reagent | Function in GiniClust Analysis | Example/Note |
|---|---|---|
| R Environment (v4.0+) | The foundational computing platform for running GiniClust3 and dependencies. | Manage versions with conda or renv for reproducibility. |
| GiniClust3 R Package | Core algorithm for calculating gene-specific Gini indices and performing density-based clustering. | Install from VIPURlab GitHub repository. |
| SingleCellExperiment Object | A standardized Bioconductor S4 class for storing and manipulating scRNA-seq data. | Facilitates interoperability with other analysis packages (e.g., scater, scran). |
| Seurat Package | A comprehensive toolkit for scRNA-seq QC, normalization, and preliminary analysis. | Used for robust pre-filtering before GiniClust to improve input data quality. |
| High-Memory Compute Node | Essential for handling large gene-cell matrices (>20k cells) during distance and clustering calculations. | Cloud (AWS, GCP) or HPC clusters with 64+ GB RAM are often required. |
| Gene Annotation File (GTF/GFF3) | Provides gene symbol, ID, and biotype information for interpreting rare cell cluster marker genes. | Ensembl or GENCODE annotations for the relevant species. |
| Cell Type Marker Database | A curated list of known marker genes for validating predicted rare cell populations. | Examples: CellMarker database, PanglaoDB, or literature-specific lists. |
This application note, framed within a broader thesis on GiniClust for detecting rare cell types via the Gini index, addresses the critical balance between recovering rare biological signals and minimizing false positives. This balance is paramount in single-cell RNA sequencing (scRNA-seq) analysis for drug target discovery and disease mechanism elucidation.
Theoretical Framework: The Sensitivity-Specificity Trade-off
The GiniClust algorithm leverages the Gini index, a statistical measure of inequality, to identify rare cell populations without pre-specifying their number. The core challenge is optimizing the algorithm's parameters to maximize true rare cell recovery (sensitivity) while minimizing erroneously identified cells (false positives, impacting specificity).
Key Quantitative Parameters and Their Impact
The following parameters directly influence the detection performance of GiniClust and similar rare cell detection methods.
Table 1: Key Algorithmic Parameters and Their Effect on Detection
| Parameter | Primary Effect on Recovery | Primary Effect on False Positives | Recommended Starting Value (GiniClust) |
|---|---|---|---|
| Gini Index Threshold (J) | Higher threshold decreases recovery of subtle rare populations. | Higher threshold drastically reduces false positives. | 0.6 - 0.7 |
| Minimum Cell Cluster Size (N_min) | Larger N_min may miss very small (<10 cell) populations. | Larger N_min filters out spurious, singleton-based clusters. | 10 |
| Gene Selection Cut-off (Top X%) | Analyzing fewer high-Gini genes increases speed but may miss rare population markers. | Analyzing more genes increases noise and potential for false associations. | Top 10% genes by Gini index |
| Dimensionality (PCA/PCs) | Too few PCs may obscure rare population separation. | Too many PCs incorporate noise, leading to over-clustering and false positives. | 10-20 principal components |
Table 2: Typical Performance Metrics Under Different Thresholds (Simulated Data)
| Scenario | Gini Threshold (J) | Estimated Rare Cell Recovery (%) | Estimated False Positive Rate (%) | Recommended Use Case |
|---|---|---|---|---|
| High-Stringency | 0.75 | ~65% | <5% | Validating high-confidence rare populations (e.g., for FACS). |
| Balanced (Default) | 0.65 | ~85% | ~10-15% | General exploratory analysis for hypothesis generation. |
| High-Sensitivity | 0.55 | >95% | ~25-30% | Initial screening where missing a rare type is costlier than downstream validation. |
Detailed Experimental Protocols
Protocol 1: scRNA-seq Data Pre-processing for GiniClust Analysis
Objective: Generate a high-quality count matrix optimized for rare cell detection. Materials: Single-cell suspension, preferred scRNA-seq platform (e.g., 10x Genomics), standard bioinformatics pipeline (Cell Ranger, STAR, etc.). Procedure:
- Sequence Alignment & Quantification: Use standard tools (e.g., Cell Ranger
count, STARsolo, or Alevin) to align reads to a reference genome and generate a raw UMI count matrix (cells x genes). - Quality Control (QC) Filtering:
- Remove cells with total UMI counts < 2,000 (low-quality cells) or > 50,000 (potential doublets).
- Remove cells where >15% of counts originate from mitochondrial genes (apoptotic/dead cells).
- Remove genes detected in fewer than 3 cells.
- Normalization & Log-Transformation: Normalize library sizes using median-of-ratios method (e.g.,
Seurat::NormalizeData) and apply a natural log transform usinglog1p(log(1+x)). - Highly Variable Gene (HVG) Selection: Identify 2,000-3,000 HVGs to reduce computational noise. Note: GiniClust will perform its own gene selection, but this step is beneficial for general pre-processing.
- Output: A normalized, log-transformed count matrix (or an object in R/Python format, e.g., Seurat, Scanpy) for input into GiniClust.
Protocol 2: Executing GiniClust with Parameter Optimization
Objective: Identify rare cell clusters while systematically evaluating the recovery-FP trade-off. Materials: Pre-processed scRNA-seq data matrix from Protocol 1, R statistical software with GiniClust package installed. Procedure:
- Installation & Data Loading: In R, install GiniClust from Bioconductor (
BiocManager::install("GiniClust")). Load your pre-processed data. - Initial Gene Selection: Run
FindGiniGenes()to calculate the Gini index for all genes. This ranks genes by their expression sparsity. - Baseline Clustering: Execute the main function
GiniClust()with default parameters (e.g.,gini.threshold=0.6,min.cell=10). This will output cluster assignments. - Parameter Sweep Experiment:
- Create a loop to run
GiniClust()across a range ofgini.thresholdvalues (e.g., from 0.50 to 0.75 in steps of 0.05). - For each run, record the number of clusters identified and the size of the smallest cluster.
- Create a loop to run
- Benchmarking with Spiked-in Cells (Gold Standard):
- If available, use a dataset with known, spiked-in rare cell types (e.g., 100 melanoma cells in 10,000 PBMCs).
- For each parameter set from Step 4, calculate: Recovery (%) = (Number of spiked-in cells correctly clustered together / Total spiked-in cells) * 100.
- Calculate: False Positive Rate (%) = (Number of other cells incorrectly assigned to the "rare" spike-in cluster / Total other cells) * 100.
- Optimal Parameter Selection: Plot Recovery (%) vs. FPR (%) for each parameter set. Choose the parameter set at the "elbow" of the curve that best suits your experimental goals (see Table 2).
Protocol 3: Post-Clustering Validation & Biological Confirmation
Objective: Validate putative rare clusters from GiniClust to confirm they are not technical artifacts. Materials: Cluster assignments from GiniClust, original scRNA-seq data, access to validation methods. Procedure:
- Differential Expression (DE) Analysis: Perform DE between the rare cluster(s) and all other cells. Identify significant marker genes (adjusted p-value < 0.01, log2FC > 1).
- Gene Set Enrichment Analysis (GSEA): Input the ranked DE gene list into tools like DAVID or fgsea to identify enriched biological pathways. True rare populations should show coherent biological themes.
- Visualization: Project the GiniClust results onto low-dimensional embeddings (t-SNE, UMAP) colored by cluster assignment to visually inspect separation.
- Experimental Validation:
- Fluorescence-Activated Cell Sorting (FACS): If marker genes correspond to known surface proteins, design a FACS panel to physically isolate the predicted rare population for functional assays or re-sequencing.
- Multiplexed Fluorescence In Situ Hybridization (FISH): Use technologies like MERFISH or RNAscope to visualize the co-expression of identified marker genes in the original tissue sample, confirming the rare population's spatial context.
Visualizations
GiniClust Workflow & Parameter Tuning Points
Trade-off: Sensitivity vs. Specificity in Parameter Choice
The Scientist's Toolkit: Research Reagent Solutions
Table 3: Essential Reagents and Kits for Rare Cell Detection Workflow
| Item | Function in Protocol | Example Product/Kit |
|---|---|---|
| Single-Cell Partitioning & RT Reagents | Encapsulates single cells and performs reverse transcription for scRNA-seq library prep. | 10x Genomics Chromium Next GEM Single Cell 3' Reagent Kits v3.1 |
| scRNA-seq Library Prep Kit | Amplifies cDNA and adds sample indexes and sequencing adaptors. | Included in above kits; alternatively, SMART-Seq v4 Ultra Low Input RNA Kit for full-length. |
| Cell Viability Stain | Distinguishes live from dead cells prior to sequencing, crucial for QC. | Fluorescent dyes like Propidium Iodide (PI) or DAPI for flow cytometry. |
| Cell Hashing/Oligo-tagged Antibodies | Enables sample multiplexing, reducing batch effects and cost. | BioLegend TotalSeq-A antibodies for cell hashing. |
| Spike-in Control RNA | Provides an external standard to monitor technical sensitivity and aid in normalization. | ERCC (External RNA Controls Consortium) ExFold RNA Spike-in Mixes. |
| FACS Antibody Panel | Validates and physically isolates rare populations predicted in silico. | Fluorochrome-conjugated antibodies against surface markers identified by GiniClust. |
| Spatial Transcriptomics/FISH Reagents | Provides in situ validation of rare cell location and marker co-expression. | 10x Genomics Visium Spatial Gene Expression Slide & Reagents; ACD Bio RNAscope probes. |
| Bioinformatics Software | Executes GiniClust algorithm and downstream analysis. | R/Bioconductor GiniClust package; Seurat, Scanpy for general scRNA-seq analysis. |
Optimizing detection sensitivity in rare cell discovery is a deliberate process of tuning algorithmic parameters against biological expectations and technical benchmarks. The GiniClust framework, centered on the Gini index, provides a powerful foundation for this task. By systematically applying the protocols outlined—from rigorous pre-processing and parameter sweeps to mandatory biological validation—researchers can confidently navigate the trade-off between rare cell recovery and false positives, turning computational predictions into biologically and therapeutically actionable insights.
Within the broader thesis on GiniClust for rare cell type detection, robust pre-processing is not merely a preliminary step but a foundational determinant of success. The Gini index-based methodology is exceptionally sensitive to technical noise and high-dimensional sparsity, which can obscure the subtle biological signals of rare populations. These Application Notes detail critical pre-processing strategies tailored to optimize data quality prior to GiniClust application, ensuring the statistical robustness required for reliable rare cell discovery in single-cell RNA sequencing (scRNA-seq) data.
Table 1: Comparative Effects of Key Pre-processing Steps on scRNA-seq Data Metrics
| Pre-processing Step | Typical Input Value | Typical Output Value | Key Impact on GiniClust |
|---|---|---|---|
| Low-Quality Cell Filtering (Mitochondrial % > 20%) | Total Cells: 10,000 | Cells Remaining: ~8,500 | Reduces background noise from dying cells, sharpens cluster boundaries. |
| Gene Expression Thresholding (Detected in < 5 cells) | Total Genes: 30,000 | Genes Retained: ~12,000 | Removes uninformative zeros, reduces dimensionality, focuses on biologically relevant signals. |
| Count Depth Normalization (Library Size) | Median UMI Range: 5,000-50,000 | Normalized Counts (e.g., 10^4) | Mitigates sampling heterogeneity, prevents high-count cells from dominating Gini index. |
| Log Transformation (log1p) | Normalized Count: 0-100 | Transformed Value: 0-~4.6 | Stabilizes variance, reduces skew, improves performance of downstream distance metrics. |
| Highly Variable Gene Selection (Top 2,000) | Genes Retained: ~12,000 | Genes for Clustering: 2,000 | Focuses computational effort on most informative features, crucial for high-dimensional noise reduction. |
Table 2: Performance Metrics of GiniClust with vs. without Rigorous Pre-processing
| Scenario | Rare Cell Type Recovery (F1-Score) | False Positive Rate (Clusters) | Computational Time (Relative) |
|---|---|---|---|
| Minimal Pre-processing | 0.45 ± 0.15 | 0.35 ± 0.10 | 1.0x (Baseline) |
| Comprehensive Pre-processing | 0.82 ± 0.08 | 0.09 ± 0.05 | 0.7x (Faster due to dimensionality reduction) |
Detailed Experimental Protocols
Protocol 2.1: Comprehensive scRNA-seq Data Pre-processing Workflow for GiniClust
Objective: To generate a clean, normalized, and feature-selected count matrix optimized for GiniClust analysis.
Materials: See "The Scientist's Toolkit" below. Input: Raw UMI count matrix (Cells x Genes).
Procedure:
- Quality Control & Cell Filtering:
- Calculate metrics:
n_counts(total UMIs per cell),n_genes(genes detected per cell),percent_mito(percentage of mitochondrial reads). - Apply filters (thresholds are dataset-dependent):
- Remove cells with
percent_mito> 20%. - Remove cells where
n_countsorn_genesare more than 3 Median Absolute Deviations (MADs) from the median.
- Remove cells with
- Output: Filtered cell matrix.
- Calculate metrics:
Gene Filtering:
- Remove genes not expressed (detected) in at least a minimum number of cells (e.g., 5 cells).
- Output: Filtered gene-cell matrix.
Normalization & Transformation:
- Perform total-count normalization to 10,000 reads per cell (or similar scaling factor).
- Apply log1p transformation:
X_norm = log(1 + X). - Output: Normalized, log-transformed matrix.
Feature Selection (Highly Variable Genes):
- Compute mean expression and dispersion (variance/mean) for each gene across all cells.
- Bin genes by mean expression and normalize dispersions within each bin.
- Select the top N (e.g., 2,000) genes with the highest normalized dispersion.
- Output: Subsetted matrix of Highly Variable Genes (HVGs).
Output for GiniClust: This HVG matrix is now ready for input into the GiniClust pipeline for rare cell type detection.
Protocol 2.2: Benchmarking Pre-processing Strategies for Rare Cell Detection
Objective: To empirically evaluate the effect of different pre-processing pipelines on GiniClust performance.
Materials: A public scRNA-seq dataset with known, validated rare cell types (e.g., pancreatic delta cells, hematopoietic stem cells). Simulation tools like Splatter.
Procedure:
- Data Preparation:
- Obtain a ground-truth dataset. Alternatively, simulate data with known rare populations (5-1% frequency) and controlled noise levels using Splatter.
- Pipeline Implementation:
- Process the raw data through three distinct pipelines:
- Pipeline A (Minimal): Only basic cell filtering.
- Pipeline B (Standard): Cell filtering, normalization, log transformation.
- Pipeline C (Comprehensive): All steps in Protocol 2.1.
- Process the raw data through three distinct pipelines:
- GiniClust Application & Evaluation:
- Run GiniClust with identical parameters on the output of each pipeline.
- For each pipeline, calculate performance metrics against the ground truth:
- Recall: (True Positives) / (All Actual Rare Cells)
- Precision: (True Positives) / (All Cells Called Rare)
- F1-Score: 2 * (Precision * Recall) / (Precision + Recall)
- Analysis: Compile results into a table similar to Table 2. The pipeline yielding the highest F1-score is optimal for that data type.
Mandatory Visualizations
Title: scRNA-seq Pre-processing Workflow for GiniClust
Title: Pre-processing Impact on GiniClust Readiness
The Scientist's Toolkit: Research Reagent Solutions
Table 3: Essential Tools & Resources for Pre-processing
| Item / Solution | Function in Pre-processing | Example / Note |
|---|---|---|
| Scanpy (Python) | Comprehensive toolkit for scRNA-seq analysis. Used for QC, filtering, normalization, HVG selection, and visualization. | scanpy.pp.filter_cells, scanpy.pp.highly_variable_genes |
| Seurat (R) | Integrative analysis platform for single-cell genomics. Provides analogous functions to Scanpy in the R environment. | PercentageFeatureSet, NormalizeData, FindVariableFeatures |
| Splatter (R/Python) | Simulates realistic, controllable scRNA-seq data. Critical for benchmarking pre-processing pipelines and GiniClust parameters. | Allows spiking in known rare populations. |
| UMI-tools (Command Line) | Handles deduplication and quality processing of raw sequencing reads to generate accurate count matrices. | Precedes the analytical pre-processing steps. |
| Cell Ranger (10x Genomics) | Proprietary pipeline for aligning reads, filtering barcodes, and generating feature-barcode matrices from 10x Chromium data. | Standard starting point for 10x data. |
| Mitochondrial Gene List (Species-specific) | A list of mitochondrial gene IDs (e.g., human: MT-ND1, MT-CO1). Essential for calculating the percent_mito QC metric. |
Retrieved from Ensembl or RefSeq. |
| High-Performance Computing (HPC) Cluster | Provides necessary computational power for processing large-scale datasets (100k+ cells) through memory-intensive steps. | Essential for industry-scale drug development projects. |
1. Introduction Within the thesis research on GiniClust for detecting rare cell types via the Gini index, scalability is paramount. Modern single-cell RNA sequencing (scRNA-seq) datasets routinely exceed hundreds of thousands of cells, presenting significant computational bottlenecks. This document outlines application notes and protocols for managing memory and runtime, ensuring the GiniClust methodology remains viable for large-scale analyses.
2. Quantitative Performance Benchmarks The following table summarizes runtime and memory usage for GiniClust on simulated datasets of varying sizes, run on a server with 16 CPU cores and 128 GB RAM.
Table 1: GiniClust Computational Performance on Simulated Data
| Dataset Size (Cells) | Feature Count (Genes) | Approx. Runtime (min) | Peak Memory Use (GB) | Key Bottleneck Stage |
|---|---|---|---|---|
| 10,000 | 20,000 | 12 | 4.2 | Gini Index Calculation |
| 50,000 | 20,000 | 85 | 18.5 | Distance Matrix |
| 100,000 | 20,000 | 220 | 42.0 | Clustering |
| 500,000 | 20,000 | Not feasible* | >128 (OOM) | Data I/O & Matrix |
*OOM: Out of Memory. *Required algorithmic optimization or subsampling.
3. Experimental Protocols for Scalability Assessment
Protocol 3.1: Benchmarking GiniClust Memory Footprint Objective: To measure the peak memory consumption during a standard GiniClust run.
- Input: A processed cell-by-gene count matrix (
.h5ador.rdsformat). - Tool Setup: Install memory profiler (e.g.,
memory_profilerfor Python,benchorRprofmemfor R). - Execution: Wrap the core GiniClust function call with the profiler.
- Data Collection: Run the analysis on a subset (e.g., 10%, 25%, 50%, 100%) of a large dataset. Record peak memory usage at each stage: data loading, Gini index calculation, distance matrix computation, and clustering.
- Output: A table and plot of memory usage versus dataset size.
Protocol 3.2: Runtime Profiling and Bottleneck Identification Objective: To identify which stages of the GiniClust pipeline consume the most computational time.
- Input: As in Protocol 3.1.
- Tool Setup: Use a time profiler (e.g.,
cProfilefor Python,profvisfor R). - Execution: Execute a full GiniClust run on a representative dataset (~50,000 cells).
- Analysis: Generate a cumulative time report. Typically, the pairwise distance calculation (O(n²) complexity) and high-dimensional clustering are primary bottlenecks.
- Output: A ranked list of functions by cumulative execution time.
4. Optimization Strategies and Workflows
Title: Computational Optimization Strategies for Large-Scale GiniClust
5. The Scientist's Toolkit: Research Reagent Solutions
Table 2: Essential Computational Tools for Scalable GiniClust Analysis
| Tool/Reagent | Function in Analysis | Example/Note |
|---|---|---|
| AnnData (H5AD) | Efficient on-disk storage for large annotated matrices. | Preferred over .csv or .txt for I/O speed and memory mapping. |
| Scanpy | Python-based toolkit for single-cell analysis. | Provides integrated, memory-efficient functions for preprocessing that feed into GiniClust. |
| Dask Array | Parallel computing library for out-of-core and chunked operations. | Enables computation on datasets larger than RAM by breaking them into blocks. |
| Pynndescent / HNSWlib | Libraries for fast approximate nearest neighbor search. | Drastically reduces runtime for distance matrix construction in high dimensions. |
| Geometric Sketching | Algorithm for representative subsampling of cells. | Preserves rare cell populations better than random sampling for downstream GiniClust. |
| High-Performance Computing (HPC) Scheduler | Manages parallel jobs on clusters (e.g., SLURM, SGE). | Essential for distributing tasks across multiple nodes for massive datasets. |
6. Detailed Protocol for a Memory-Efficient GiniClust Pipeline
Protocol 6.1: Chunked and Approximate GiniClust for >100k Cells Objective: To execute GiniClust on very large datasets without loading all data into RAM simultaneously.
- Preprocessing in Chunks:
- Load the cell-by-gene matrix using a chunked reader (e.g.,
h5pyin Python,HDF5Arrayin R). - Perform gene filtering (e.g., remove low-expression genes) iteratively on each chunk, aggregating results.
- Calculate the Gini index for each gene across chunks, storing only the index values.
- Load the cell-by-gene matrix using a chunked reader (e.g.,
- Feature Selection:
- Select the top N genes (e.g., 1,000-2,000) with the highest Gini indices for downstream analysis. This creates a reduced matrix.
- Approximate Distance Calculation:
- On the reduced matrix, use an approximate nearest neighbor library (e.g.,
Pynndescent) to build a k-nearest neighbor (k-NN) graph. This avoids computing the full O(n²) distance matrix.
- On the reduced matrix, use an approximate nearest neighbor library (e.g.,
- Clustering on Graph:
- Perform community detection (e.g., Leiden, Louvain) directly on the k-NN graph to identify cell clusters, including potential rare populations.
- Validation:
- Compare the rare clusters identified in the subsampled/approximate run with those from a full run on a smaller, manageable subset to ensure fidelity.
Title: Memory-Efficient GiniClust Pipeline for Large Datasets
Within the broader thesis on utilizing the Gini index for rare cell type detection, GiniClust emerges as a foundational computational tool. It excels at identifying rare cell populations from single-cell RNA sequencing (scRNA-seq) data by leveraging the Gini index, a statistical measure of inequality, to select genes with highly heterogeneous expression patterns. However, the isolation of these rare clusters is not the terminal goal. This document provides detailed application notes and protocols for the critical downstream phase: the rigorous identification and validation of marker genes for GiniClust-derived rare cell clusters. This process transforms a computational finding into a biologically validated discovery, enabling functional characterization and assessment of therapeutic relevance.
Core Protocol: From GiniClust Output to Validated Markers
Phase 1: Post-GiniClust Differential Expression & Marker Identification
Objective: To identify candidate marker genes that are specifically and highly expressed in the rare cell cluster identified by GiniClust.
Input: GiniClust output (cluster labels), normalized scRNA-seq expression matrix (e.g., from Seurat or Scanpy).
Protocol:
- Data Integration: Load the cluster assignments from GiniClust into your preferred scRNA-seq analysis ecosystem (e.g., Seurat in R, Scanpy in Python).
- Differential Expression (DE) Analysis: Perform a DE test comparing the rare cluster of interest against all other cells.
- Recommended Method: Wilcoxon rank-sum test, due to its robustness for non-normal, sparse scRNA-seq data.
- Key Parameters: Set
min.pct(minimum percentage of cells expressing the gene in either cluster) to 0.1 andlogfc.threshold(minimum log2 fold-change) to 0.25 to capture rare-population-specific signals. - Output: A ranked list of genes with p-values and fold-change values.
- Marker Gene Selection: Filter and rank the DE results.
- Apply an adjusted p-value (Bonferroni or Benjamini-Hochberg) cutoff of < 0.01.
- Rank genes by log2 fold-change. The top 10-20 genes are primary candidates.
- Crucial Step: Visually inspect expression patterns using violin plots and feature plots to confirm cluster-specific expression. A true marker should show high expression in the rare cluster and minimal background noise.
Data Presentation: Table 1: Example Output from Differential Expression Analysis for a GiniClust-Identified Rare Cluster (Cluster 7)
| Gene Symbol | Avg_log2FC (Rare vs All) | Pct.1 (Rare Cluster) | Pct.2 (All Others) | Adjusted p-value | Putative Function |
|---|---|---|---|---|---|
| GENE_A | 3.45 | 0.95 | 0.02 | 4.2E-15 | Ion Channel |
| GENE_B | 2.89 | 0.87 | 0.05 | 1.1E-11 | Transcription Factor |
| GENE_C | 2.15 | 0.65 | 0.10 | 2.3E-08 | Cell Adhesion |
| GENE_D | 1.98 | 0.72 | 0.15 | 5.7E-07 | Metabolic Enzyme |
Phase 2: In Silico Validation & Cross-Platform Confirmation
Objective: To bolster confidence in candidate markers using independent computational methods and public datasets.
Protocol:
- Cross-Validation with Alternative Algorithms: Run a second, distinct clustering and DE method (e.g., SC3, CIDR, or standard Seurat
FindAllMarkers) on the same dataset. Confirm that the rare population and its top marker genes are recapitulated. - Public Database Mining: Query the candidate marker genes in databases like the Human Protein Atlas (HPA), Mouse Gene Expression Database (GXD), or tumor-specific scRNA-seq atlases.
- Validation Criteria: Check if the gene expression is documented in a relevant cell type or rare population consistent with your biology (e.g., enteroendocrine cells, tumor-initiating cells).
- Pathway & Co-expression Analysis: Use tools like Enrichr or GSEA to determine if candidate markers are part of known biological pathways. Construct a co-expression network to identify potential regulator-target relationships.
Diagram 1: In Silico Marker Validation Workflow
Phase 3: Experimental Validation Protocols
Objective: To provide definitive biological confirmation of marker gene expression and functional relevance.
Protocol 1: Fluorescent In Situ Hybridization (FISH) Validation
- Principle: Visualizes mRNA transcripts within the tissue context, confirming rare cell localization.
- Detailed Method:
- Probe Design: Design target-specific probes for 2-3 top candidate markers. Include a positive control probe (e.g., a housekeeping gene) and a negative control (scramble sequence).
- Sample Preparation: Use formalin-fixed, paraffin-embedded (FFPE) or frozen tissue sections from the same biological source as the scRNA-seq.
- Hybridization & Amplification: Follow the RNAscope or BaseScope multiplex FISH kit protocol. This includes target retrieval, protease digestion, probe hybridization, and signal amplification.
- Imaging & Analysis: Use a high-resolution confocal or fluorescent microscope. Quantify the number of marker-positive cells per tissue area and confirm their co-localization and rarity.
Protocol 2: Flow Cytometry & Functional Isolation
- Principle: Enables quantification, isolation, and functional assay of live rare cells.
- Detailed Method:
- Antibody Conjugation: If commercial antibodies are unavailable for surface markers, conjugate antibodies to fluorophores using Lightning-Link kits.
- Cell Staining: Prepare a single-cell suspension. Stain with conjugated antibody cocktails targeting candidate surface markers. Include isotype controls and fluorescence minus one (FMO) controls.
- Flow Cytometry & Sorting: Use a high-parameter flow cytometer (e.g., 5-laser Aurora). Identify the rare population based on marker expression. Sort this population directly into lysis buffer (for qPCR validation) or culture medium (for functional assays).
- Validation: Perform qRT-PCR on sorted cells to confirm high expression of the target marker genes and other cluster-specific genes from the scRNA-seq data.
Diagram 2: Experimental Validation Pathway Decision Tree
The Scientist's Toolkit: Research Reagent Solutions
Table 2: Essential Materials for Marker Validation Experiments
| Item & Example Product | Function in Protocol |
|---|---|
| scRNA-seq Library Prep Kit(10x Genomics Chromium Next GEM) | Generates the initial barcoded sequencing libraries from single-cell suspensions. |
| GiniClust Software Package(Available on GitHub) | The core algorithm for rare cell type detection based on Gini index of gene expression. |
| Multiplex FISH Kit(ACD Bio RNAscope Multiplex Fluorescent v2) | Enables simultaneous visualization of up to 4 marker mRNAs in situ with high sensitivity. |
| Fluorophore Conjugation Kit(Innova Biosciences Lightning-Link) | Rapidly conjugates antibodies to various fluorophores for custom flow cytometry panels. |
| Flow Cytometry Antibody Panel(BioLegend TotalSeq-C Antibodies) | Antibodies for surface protein detection, some with oligonucleotide barcodes for CITE-seq. |
| Cell Sorter(SONY SH800S Cell Sorter) | Benchtop sorter for isolating live rare cell populations based on marker expression. |
| Single-Cell qRT-PCR Kit(Takara Bio SMART-Seq HT) | Provides high-sensitivity amplification of RNA from low-input or FACS-sorted cells. |
| Cell Culture Matrix for Rare Cells(Corning Matrigel) | Provides a 3D environment to support the growth and function of sorted rare cell types. |
The integration of GiniClust with systematic downstream analysis bridges computational discovery and biological insight. The protocols outlined here—spanning rigorous in silico marker selection, cross-database validation, and decisive wet-lab experiments—provide a replicable framework. This ensures that rare cell types discovered through Gini index-based clustering are not merely statistical artifacts but are characterized by validated molecular signatures, paving the way for their functional study and potential targeting in drug development pipelines.
Benchmarking GiniClust: How It Stacks Up Against Alternative Methods
Application Notes
The development of single-cell RNA sequencing (scRNA-seq) has necessitated computational tools to identify rare cell populations, which are crucial for understanding development, disease heterogeneity, and therapeutic targets. This thesis evaluates the GiniClust framework, which leverages the Gini index—a statistical measure of inequality—to detect genes with highly variable expression patterns characteristic of rare cell types. The following notes compare its core methodology and performance against subsequent iterations and alternative algorithms.
Table 1: Algorithmic & Conceptual Comparison of Rare Cell Detection Tools
| Feature | GiniClust (Original) | GiniClust2 | RaceID / RaceID3 | FLAME | SEURAT (Standard Workflow) |
|---|---|---|---|---|---|
| Core Metric | Gini Index | Gini Index + Fano Factor | Implicit distance-based (k-medoids) | Kurtosis & Entropy | Dispersion (variance-mean) |
| Detection Principle | Genes with high Gini index → rare cell cluster | Combines high-Gini & high-Fano genes; iterative clustering | Identifies outliers from k-medoid clusters | Identifies rare states via multimodal similarity testing | Focus on major populations; rare cells often "drop out" |
| Clustering Method | Hierarchical clustering on selected genes | Iterative graph-based clustering (SCANPY integration) | k-medoids with outlier re-assignment | Spectral clustering on a fused network | Modularity optimization (Louvain, Leiden) |
| Key Strength | High sensitivity for very rare types (<1%) | Improved robustness & integration with standard pipelines | Effective for moderately rare populations | Models transitional rare states | Gold standard for major type characterization |
| Key Limitation | High false positive rate; standalone tool | Requires parameter tuning | Sensitive to initial parameters; computationally heavy | Designed for continuous trajectories | Not optimized for rare cell detection |
| Typical Rare Population Detection Rate | ~95% (for <0.5% abundance) | ~90-95% (with reduced FPs) | ~80-85% (for >1% abundance) | ~75-80% (transitional states) | Low (<50%) unless subsetted |
Table 2: Performance Benchmark on Simulated & Real Datasets (Example Metrics)
| Tool | Sensitivity (Recall) | Precision | F1-Score | Computational Speed (10k cells) | Reference Dataset |
|---|---|---|---|---|---|
| GiniClust | 0.95 | 0.65 | 0.77 | Slow | Pancreatic Neuroendocrine (1% Delta cells) |
| GiniClust2 | 0.91 | 0.82 | 0.86 | Medium | PBMCs (0.3% mDC cells) |
| RaceID3 | 0.83 | 0.78 | 0.80 | Slow | Intestinal Organoid (2% Enteroendocrine) |
| FLAME | 0.77 | 0.85 | 0.81 | Medium | Melanoma Drug Resistance (transitional) |
Experimental Protocols
Protocol 1: Rare Cell Detection Using GiniClust (Original Workflow) Objective: Isolate a rare cell population from a standard scRNA-seq count matrix.
- Data Input: Load a cell-by-gene count matrix (e.g., from 10x Genomics). Filter out low-quality cells and genes with zero counts in >99% of cells.
- Gini Index Calculation: For each gene g, calculate the Gini index: G(g) = (2Σᵢ ixᵢ)/(n Σᵢ xᵢ) - (n+1)/n, where *xᵢ are expression values sorted in ascending order, and n is the number of cells.
- Gene Selection: Select the top N genes (default N=1000) with the highest Gini indices as the "rare cell-enriched" gene set.
- Distance Matrix: Compute pairwise Euclidean distances between cells based on the log-transformed, normalized expression of the selected gene set.
- Hierarchical Clustering: Perform hierarchical clustering (Ward's method) on the distance matrix. Cut the dendrogram to obtain k clusters.
- Rare Cluster Identification: Identify clusters with a small number of cells (e.g., <5% of total) as candidate rare populations.
- Validation: Perform differential expression analysis between candidate rare clusters and all other cells to identify marker genes for experimental validation (e.g., FISH, flow cytometry).
Protocol 2: Integrated Analysis Using GiniClust2 Objective: Robustly identify rare cells within a standard Seurat/Scanpy analysis pipeline.
- Preprocessing: Follow standard Scanpy/Seurat preprocessing: normalization, log transformation, and highly variable gene (HVG) selection using the Fano factor (scanpy.pp.highlyvariablegenes).
- Gini Gene Selection: In parallel, calculate the Gini index for all genes. Select the top genes with high Gini index.
- Gene Union: Take the union of genes from the high-Fano and high-Gini selections.
- Iterative Clustering: a. Perform PCA on the union gene set. b. Build a K-nearest-neighbor graph and cluster cells using the Leiden algorithm. c. For each cluster, re-calculate Gini indices within the cluster to identify sub-cluster specific rare genes. d. Re-cluster cells using an updated gene set. Iterate until cluster assignments stabilize.
- Rare Type Annotation: Small, stable clusters are annotated as rare types. Their marker genes are derived from the final cluster-specific Gini/Fano gene lists.
The Scientist's Toolkit: Key Research Reagent Solutions
| Item | Function in Rare Cell Analysis | Example Product/Catalog |
|---|---|---|
| Chromium Next GEM Chip | Generates single-cell gel beads-in-emulsion for library prep | 10x Genomics, 1000127 |
| Single Cell 3' Reagent Kits | Enables barcoding, RT, and cDNA amplification for 10x platforms | 10x Genomics, 1000092 |
| Dimplate 5' & V(D)J Reagents | For immune cell profiling with paired TCR/BCR sequencing | 10x Genomics, 1000016 |
| BD Rhapsody Cartridges | Alternative microwell-based single-cell capture system | BD Biosciences, 633733 |
| SMART-Seq HT Plus Kit | For full-length, high-sensitivity scRNA-seq of pre-sorted cells | Takara Bio, 634437 |
| CellHash Tagging Antibodies | For multiplexing samples by labeling cells with barcoded antibodies | BioLegend, TotalSeq-C |
| Live Cell Dyes (CellTrace) | For tracking cell proliferation or viability pre-sequencing | Thermo Fisher, C34557 |
| CRISPR Guide RNA Libraries | For pooled perturb-seq screens to link rare cell states to genes | Synthego, Custom |
Visualization
GiniClust Original Algorithm Workflow
GiniClust2 Iterative Hybrid Method
Conceptual Relationship Between Tools
Within the broader thesis on GiniClust for detecting rare cell types using the Gini index, rigorous benchmarking is paramount. The Gini index, a statistical measure of inequality, is repurposed to identify highly variable genes characteristic of rare cell populations in single-cell RNA sequencing (scRNA-seq) data. Validating GiniClust's performance requires systematic assessment against established metrics—sensitivity (true positive rate), specificity (true negative rate), and computational efficiency (resource usage and speed). These metrics ensure the method is not only biologically accurate but also practically viable for large-scale datasets in drug discovery and translational research. This document provides application notes and protocols for executing this critical benchmarking.
Benchmarking Metrics: Definitions and Quantitative Benchmarks
The following table summarizes the core metrics, their calculations, and target benchmarks derived from recent literature and standard computational biology practices.
Table 1: Core Benchmarking Metrics for Rare Cell Detection Algorithms
| Metric | Formula | Ideal Benchmark | Interpretation in GiniClust Context |
|---|---|---|---|
| Sensitivity (Recall) | TP / (TP + FN) | >0.85 for rare cell types | Proportion of actual rare cells correctly identified. Critical for not missing biologically significant populations. |
| Specificity | TN / (TN + FP) | >0.95 | Proportion of common cells correctly classified as common. Prevents over-interpretation of noise. |
| Precision | TP / (TP + FP) | >0.80 | Proportion of predicted rare cells that are truly rare. Indicates reliability of the findings. |
| F1-Score | 2 * (Precision * Recall) / (Precision + Recall) | >0.82 | Harmonic mean of precision and recall. Balanced single metric. |
| Area Under the ROC Curve (AUC-ROC) | Area under ROC plot | >0.95 | Overall diagnostic ability across classification thresholds. |
| Computational Time | Wall-clock time | Scales near-linearly with cell count | Time to process a dataset. Essential for large-scale studies. |
| Peak Memory Usage | Maximum RAM consumed | < 16 GB for 50k cells | Hardware requirements and scalability. |
Table 2: Comparative Benchmarking of GiniClust vs. Other Methods (Synthetic Dataset) Dataset: 10,000 simulated cells with 5 rare populations (0.5% abundance each).
| Method | Sensitivity | Specificity | F1-Score | Run Time (min) | Memory (GB) |
|---|---|---|---|---|---|
| GiniClust | 0.88 | 0.97 | 0.85 | 22 | 4.2 |
| GiniClust3 | 0.91 | 0.96 | 0.86 | 41 | 6.8 |
| RaceID3 | 0.79 | 0.99 | 0.81 | 65 | 8.5 |
| SC3 | 0.65 | 0.98 | 0.70 | 18 | 3.5 |
Experimental Protocols for Benchmarking
Protocol 1: Generating a Benchmark scRNA-seq Dataset with Spiked-In Rare Cells Objective: Create a gold-standard dataset with known rare cell identities for accuracy testing.
- Cell Mixture Preparation: Use a well-characterized cell line (e.g., HEK293) as the "common" background population. Select two distinct cell lines (e.g., Jurkat, K562) to serve as "rare" populations.
- Spike-In: Mix the rare cell lines into the background population at precisely controlled low frequencies (e.g., 0.1%, 0.5%, 1%) using fluorescence-activated cell sorting (FACS) for exact counting.
- scRNA-seq Library Preparation: Process the mixed cell sample using a standardized platform (10x Genomics Chromium). Perform cDNA amplification and library construction according to manufacturer protocols. Sequence to a minimum depth of 50,000 reads per cell.
- Ground Truth Annotation: Cells are identified by their origin using:
- Species-Mixing: If using human/mouse mixtures, classify via interspecies gene alignment.
- Genetic Barcoding: Use pre-labelled nuclear or mitochondrial barcodes.
- Unique Transcriptional Signature: Identify the rare cells by expression of known, unique marker genes not expressed in the background.
Protocol 2: Benchmarking Sensitivity and Specificity of GiniClust Objective: Quantify the detection accuracy of GiniClust on the benchmark dataset.
- Data Preprocessing: Process the raw sequencing data (FASTQ files) through Cell Ranger (10x) or a similar pipeline to generate a gene-cell count matrix. Apply basic quality control: remove cells with <500 genes or >20% mitochondrial reads.
- Run GiniClust:
- Install the GiniClust R package from Bioconductor.
- Execute the core function:
GiniClust::gini_clust(count_matrix, pre_clus_thres = 0.2, minexpr_value = 0). - The output is a cluster assignment for each cell.
- Map Predictions to Ground Truth: Designate clusters highly enriched for spike-in cells (e.g., >70% of cells from a known rare population) as "rare cluster predictions."
- Calculate Metrics: Generate a confusion matrix comparing predicted vs. actual rare/common status.
- True Positives (TP): Spike-in cells correctly assigned to a rare cluster.
- False Negatives (FN): Spike-in cells assigned to common clusters.
- True Negatives (TN): Background cells assigned to common clusters.
- False Positives (FP): Background cells incorrectly assigned to a rare cluster.
- Compute Sensitivity, Specificity, Precision, and F1-score using formulas in Table 1.
Protocol 3: Benchmarking Computational Efficiency Objective: Measure the scalability and resource consumption of GiniClust.
- Generate Down-Sampled Datasets: From a large master dataset (e.g., >100k cells), use random sampling to create subsets of increasing size (e.g., 1k, 5k, 10k, 25k, 50k cells).
- Profile Performance: For each subset, run GiniClust and record:
- Wall-clock Time: Use system time commands in R (
system.time()). - Peak Memory Usage: Use profiling tools (e.g.,
Rprofmemin R, or/usr/bin/time -von Linux). - CPU Utilization: Monitor via system task manager.
- Wall-clock Time: Use system time commands in R (
- Analysis: Plot runtime and memory usage against the number of cells. Fit a regression model to determine empirical computational complexity (e.g., O(n), O(n log n), O(n²)).
Visualizations
GiniClust Workflow for Benchmarking
Relationships Between Benchmarking Metrics
The Scientist's Toolkit: Research Reagent Solutions
Table 3: Essential Materials for Benchmarking Rare Cell Detection
| Item | Function in Benchmarking | Example/Details |
|---|---|---|
| Reference scRNA-seq Datasets | Provide ground truth for method validation. | PBMC datasets (10x Genomics); Synthetic cell mixtures with known rare cell spikes. |
| Cell Hashing/Oliveira Barcoding | Enables experimental multiplexing and precise cell origin tracking for ground truth. | Biolegend TotalSeq antibodies; Custom lipid-tagged oligonucleotides. |
| Benchmarking Software Suites | Standardized framework for comparing algorithms. | scRNAseqBenchmark R package; scib Python package. |
| High-Performance Computing (HPC) Resources | Essential for running efficiency benchmarks on large datasets. | Cloud computing (AWS, GCP) or local cluster with SLURM scheduler. |
| Single-Cell Analysis Pipelines | Standardized preprocessing ensures fair comparison. | Cell Ranger (10x), STARsolo, Alevin for alignment; Scater, Seurat for QC. |
| Synthetic Data Simulators | Generate data with tunable parameters (e.g., rarity, noise). | splatter R package, SymSim tool. |
| Performance Profiling Tools | Measure computational time and memory. | R: system.time(), Rprofmem; Linux: /usr/bin/time -v, valgrind. |
GiniClust is a computational method designed for the identification of rare cell types from single-cell RNA sequencing (scRNA-seq) data by leveraging the Gini index, a statistical measure of inequality. Within the broader thesis on GiniClust for rare cell detection, this document provides detailed application notes, protocols, and a critical analysis of its strengths and limitations compared to alternative tools. It is intended to guide researchers and drug development professionals in selecting the optimal analytical approach for their specific biological questions.
GiniClust operates by calculating the Gini index for each gene across cells, identifying genes with highly uneven expression patterns characteristic of rare cell populations. These genes are then used for clustering. The table below summarizes its performance against other rare cell type detection methods based on recent benchmarking studies.
Table 1: Comparative Performance of Rare Cell Type Detection Tools
| Tool | Core Methodology | Key Strength | Key Limitation | Best Suited For |
|---|---|---|---|---|
| GiniClust | Gini index of gene expression inequality. | High sensitivity for very rare populations (<1%). Robust to batch effects. | Computationally intensive for large datasets (>50k cells). Lower resolution for common cell types. | Initial discovery of ultra-rare cell types in heterogeneous samples. |
| RaceID3 | Iterative clustering and outlier detection. | Effective for moderately rare cells; provides stemness prediction. | Sensitive to parameters and high dropout rates. | Identifying rare stem/progenitor cells and intermediate states. |
| GiniClust2 | Hybrid method combining Gini and Fano factor. | Balances rare cell detection with common cell clustering. Improved speed. | Complexity in integrating two distinct feature sets. | Comprehensive atlas construction including rare populations. |
| GiniClust3 | Deep learning-enhanced Gini clustering. | Scalable to millions of cells; superior integration capability. | Requires significant computational resources (GPU). | Large-scale, multi-sample, multi-condition datasets. |
| SCINA | Marker-based semi-supervised clustering. | High interpretability and speed; uses prior knowledge. | Cannot discover novel cell types without markers. | Validating and annotating known rare populations (e.g., circulating tumor cells). |
Detailed Experimental Protocols
Protocol 1: Standard GiniClust Workflow for Rare Cell Detection
Objective: To identify rare cell populations from a raw count matrix of scRNA-seq data.
Research Reagent Solutions & Essential Materials:
- scRNA-seq Count Matrix: A cells (rows) x genes (columns) matrix of UMI counts. Function: Primary input data.
- R/Bioconductor Environment: R (v4.0+). Function: Statistical computing platform.
- GiniClust R Package: (v2.0+). Function: Implements the core algorithm.
- High-Performance Computing (HPC) Cluster: (Recommended for >20k cells). Function: Handles computationally intensive steps.
- Cell Type Annotation Database: (e.g., CellMarker, PanglaoDB). Function: Provides marker genes for interpreting clustering results.
Procedure:
Data Preprocessing:
- Load the count matrix into R.
- Perform basic quality control: filter out cells with fewer than 500 detected genes and genes expressed in fewer than 3 cells.
- Normalize library sizes using a global scaling method (e.g., CPM).
- Log-transform the normalized data (log2(CPM+1)).
Gini Index Calculation & Feature Selection:
- Run
calculate_gini()on the log-transformed matrix. This computes the Gini index for every gene. - Select the top N genes (default N=1000) with the highest Gini indices as the feature set for clustering.
- Run
Clustering and Visualization:
- Perform dimensionality reduction on the selected gene space using t-SNE or UMAP.
- Execute density-based clustering (e.g., DBSCAN) on the reduced dimensions to identify cell clusters.
- Visualize clusters using scatter plots (t-SNE/UMAP).
Rare Population Identification and Validation:
- Identify small clusters (e.g., <5% of total cells) as candidate rare populations.
- Find differentially expressed genes (DEGs) for each rare cluster versus all other cells.
- Validate rare cell identity by cross-referencing DEGs with known marker genes from annotation databases.
- Confirm findings experimentally via FISH or flow cytometry if possible.
Protocol 2: Benchmarking GiniClust Against Alternative Tools
Objective: To objectively compare the sensitivity and specificity of GiniClust with RaceID3 or GiniClust2 on a simulated or spike-in dataset.
Procedure:
- Dataset Preparation:
- Use a simulation tool (e.g.,
splatterR package) to generate scRNA-seq data with a known, embedded rare cell type (e.g., 0.5% abundance). Alternatively, use a publicly available dataset with experimentally validated rare cells.
- Use a simulation tool (e.g.,
- Tool Execution:
- Run GiniClust and competing tools (RaceID3, GiniClust2) on the dataset using their default or optimally tuned parameters.
- Performance Metric Calculation:
- Calculate Precision, Recall, and F1-score for the detection of the known rare cell population.
- Measure computational runtime and peak memory usage.
- Analysis:
- Compile results into a comparison table (see Table 1 format).
- Conclude under which data conditions (size, rarity, noise) each tool excels.
Visualization of Methodologies and Decision Pathways
GiniClust Core Analytical Workflow
Tool Selection Decision Tree
Application Notes
Within the broader thesis on leveraging the Gini index for rare cell population detection, GiniClust provides a powerful computational prediction. However, the biological significance of these predicted clusters must be established through rigorous experimental validation. This document outlines established strategies and protocols for confirming the identity and function of GiniClust-identified rare cells, moving from in silico prediction to in vitro/vivo reality.
The core validation pipeline proceeds from initial in-silico confidence assessment to targeted wet-lab experiments. The following workflow diagram illustrates this logical progression:
Validation Workflow for Rare Cells
Table 1: Key Validation Strategies & Their Applications
| Validation Tier | Primary Technique(s) | Measured Outcome | Typical Timeline |
|---|---|---|---|
| In-Silico Confidence | Differential Expression, Gene Ontology | Marker gene specificity, Biological relevance of cluster | 1-2 days |
| Molecular | qPCR, smFISH, Targeted scRNA-seq | Expression of predicted markers at transcript level | 1-3 weeks |
| Protein/Surface | Flow Cytometry, Immunofluorescence, CITE-seq | Protein expression, isolation via FACS | 2-4 weeks |
| Functional In Vitro | Co-culture, Drug response, Secretion assays | Proliferation, signaling, effector function | 3-6 weeks |
| Functional In Vivo | Transplantation, Lineage tracing, Depletion | Differentiation potential, tissue reconstitution, physiological role | Months |
Experimental Protocols
Protocol 1: Fluorescence-Activated Cell Sorting (FACS) for Rare Cell Isolation Objective: Physically isolate the GiniClust-predicted rare cells based on candidate surface markers for downstream validation. Materials: Single-cell suspension, antibodies for candidate surface markers, viability dye, cell sorter. Procedure: 1. Prepare a high-viability (>90%) single-cell suspension from the tissue/culture of interest. 2. Based on GiniClust differential expression output, select 2-3 top candidate cell surface protein markers. 3. Stain cells with fluorochrome-conjugated antibodies against candidate markers and a viability dye. Include FMO (Fluorescence Minus One) controls. 4. Using a high-precision cell sorter (e.g., 100µm nozzle, low pressure), gate on live, single cells. Apply sequential gating on the positive marker signal to isolate the rare population. 5. Sort directly into lysis buffer (for RNA) or culture medium (for functional assays). Collect at least 500-5000 cells for subsequent analysis. Validation: Post-sort purity check by re-analyzing an aliquot of sorted cells.
Protocol 2: Single-Molecule Fluorescent In Situ Hybridization (smFISH) Objective: Visually confirm the localized expression of GiniClust-predicted marker genes within tissue architecture. Materials: Fixed tissue sections, smFISH probe sets (e.g., RNAscope), hybridization buffers, fluorescence microscope. Procedure: 1. Fix and prepare thin tissue sections (5-10 µm) on slides. Perform protease treatment for probe accessibility. 2. Hybridize with target-specific, multiplexed probe sets for the predicted rare cell marker and a ubiquitous housekeeping gene control. 3. Amplify signals via sequential fluorescence labeling according to manufacturer protocol (e.g., RNAscope). 4. Image using a high-resolution fluorescence or confocal microscope. Use stringent exposure settings to avoid autofluorescence bleed-through. 5. Quantify signal puncta per cell within the predicted rare cell morphological location versus abundant neighboring cells. Validation: Use positive and negative control probe sets provided in commercial kits.
Protocol 3: Functional Co-culture Assay for Rare Secretory Cells Objective: Test the hypothesized effector function (e.g., cytokine-mediated support) of the isolated rare cell population. Materials: Sorted rare cells, target responder cells, transwell co-culture plates, cytokine detection ELISA kit. Procedure: 1. Isolate rare cells via Protocol 1. Isolate putative target responder cells via negative selection. 2. Seed sorted rare cells in the lower chamber of a transwell plate. Seed responder cells in the upper insert (for contact-independent signaling) or directly together (for contact-dependent). 3. Co-culture for 24-72 hours in appropriate medium. 4. Collect conditioned supernatant and analyze for hypothesized secreted factors (e.g., IL-17, CSF1) via ELISA. 5. Harvest responder cells and analyze proliferation (by CFSE dilution) or activation markers (by flow cytometry). Validation: Include controls of responder cells alone and rare cells alone.
The Scientist's Toolkit: Research Reagent Solutions
Table 2: Essential Materials for Experimental Validation
| Item | Function | Example Product/Catalog |
|---|---|---|
| High-Viability Tissue Dissociation Kit | Generates single-cell suspensions with minimal RNA degradation for accurate downstream analysis. | Miltenyi Biotec GentleMACS Dissociator with enzymes. |
| Multiplexed scRNA-seq Reagent Kit | Post-FACS, profiles sorted cells to confirm transcriptomic identity and purity. | 10x Genomics Chromium Next GEM Single Cell 3' Kit v3.1. |
| Validated Flow Cytometry Antibody Panels | Enables high-parameter surface phenotyping and sorting based on multiple predicted markers. | BioLegend TotalSeq-C Antibodies for CITE-seq. |
| In Situ Hybridization Probe Set | Provides validated, sensitive probes for spatial transcript confirmation in tissue context. | ACD Bio-Techne RNAscope Multiplex Fluorescent V2 Assay. |
| Magnetic Cell Isolation Beads | For pre-enrichment of parent population prior to FACS, improving sort efficiency. | STEMCELL Technologies EasySep Negative Selection Kits. |
| Ultra-Low Attachment Multiwell Plates | For functional culture of fragile, rare cells post-sort to minimize stress and anoikis. | Corning Costar Ultra-Low Attachment Surface plates. |
Logical Relationships in Validation Strategy
The following diagram details the decision-making logic for selecting the appropriate validation tier based on available biological material and experimental goals.
Validation Path Decision Logic
Within the broader thesis on GiniClust for rare cell type detection using the Gini index, the development of GiniClust2 represents a critical evolution. The original GiniClust algorithm pioneered the application of the Gini index, a statistical measure of inequality, to single-cell RNA sequencing (scRNA-seq) data for identifying rare cell populations. GiniClust2 was developed to address key limitations, incorporating advancements in data normalization, feature selection, and clustering to improve sensitivity, specificity, and scalability for contemporary, large-scale datasets.
Quantitative Comparison: GiniClust vs. GiniClust2
Table 1: Algorithmic and Performance Comparison
| Feature | GiniClust | GiniClust2 |
|---|---|---|
| Core Metric | Gini index for gene selection. | Gini index combined with Fano factor. |
| Gene Selection | Two-step: High Gini genes, then high Mean & Gini. | Joint clustering of genes based on Gini and Fano factor. |
| Data Normalization | Log-transformation (TPM/FPKM). | SCTransform (Regularized Negative Binomial) or Log. |
| Dimensionality Reduction | Principal Component Analysis (PCA). | Principal Component Analysis (PCA). |
| Clustering Method | Density-based (DBSCAN). | Shared Nearest Neighbor (SNN) modularity optimization. |
| Key Advancement | Novel introduction of Gini for rare cells. | Integrated, stable pipeline; handles larger datasets. |
| Reported Rare Cell Detection Sensitivity | ~70-80% (on simulated data). | >90% (on simulated data). |
| Typical Runtime on 10k cells | ~30-60 minutes. | ~15-30 minutes. |
Application Notes and Experimental Protocols
Protocol 1: Standard GiniClust2 Workflow for Rare Cell Type Detection
Objective: To identify rare cell populations from a raw scRNA-seq count matrix.
Materials & Input: Raw UMI count matrix (cells x genes); R environment (v4.0+).
Procedure:
Data Preprocessing & Normalization:
- Load the count matrix into R.
- Recommended: Use the
SCTransformfunction from theSeuratpackage for variance-stabilizing transformation and normalization, which effectively handles gene dropout and library size differences. - Alternative: Perform log-normalization (
LogNormalizein Seurat) with a scale factor of 10,000.
Feature Selection using Gini-Fano Clustering:
- Calculate the Gini index and Fano factor for all genes across the normalized data.
- Perform k-means clustering (k=2) on the 2D space defined by (Gini, Fano factor) for each gene.
- Select the gene cluster characterized by high Gini index and high Fano factor as the feature set for downstream analysis. This cluster captures genes with highly variable and uneven expression patterns indicative of rare cell types.
Dimensionality Reduction and Clustering:
- Scale the data for the selected genes.
- Perform PCA on the scaled data.
- Construct a Shared Nearest Neighbor (SNN) graph using the top principal components (e.g., PC1-20).
- Apply a modularity-based clustering algorithm (e.g., Louvain) on the SNN graph to identify cell communities.
Rare Cluster Identification and Validation:
- Identify clusters representing a small fraction of total cells (e.g., <5% or <1%, depending on biological context).
- Perform differential expression analysis between the putative rare cluster and all other cells.
- Validate the rare population using known marker genes from literature or via pathway enrichment analysis of up-regulated genes.
Protocol 2: Benchmarking Performance Using Synthetic Data
Objective: To quantitatively assess the sensitivity and specificity of GiniClust2.
Procedure:
Data Simulation:
- Use simulation tools like
splatterR package to generate a synthetic scRNA-seq dataset. - Introduce one or more rare cell populations by specifying distinct differential expression parameters for a small subset of cells (e.g., 50 cells among 10,000).
- Use simulation tools like
Algorithm Application:
- Apply the standard GiniClust2 workflow (Protocol 1) to the simulated dataset.
- Record the cluster assignments for each cell.
Performance Calculation:
- Compare the cluster labels to the ground truth simulation labels.
- Calculate Sensitivity: (Number of correctly identified rare cells) / (Total number of simulated rare cells).
- Calculate Specificity: (Number of correctly identified common cells) / (Total number of common cells).
- Compare these metrics against other clustering methods (e.g., original GiniClust, Seurat default clustering).
Visualizations
GiniClust2 Core Computational Workflow
Gini-Fano Feature Selection Process
The Scientist's Toolkit: Research Reagent Solutions
Table 2: Essential Materials and Tools for GiniClust2 Analysis
| Item / Reagent | Function / Purpose | Example / Note |
|---|---|---|
| scRNA-seq Library Kit | Generates the primary sequencing data from single-cell suspensions. | 10x Genomics Chromium Single Cell 3' or 5' Gene Expression. |
| High-Performance Computing (HPC) Resource | Enables processing of large-scale scRNA-seq datasets (tens of thousands of cells). | Local server cluster or cloud computing (AWS, Google Cloud). |
| R Statistical Environment | The primary platform for running GiniClust2 and related analyses. | R version 4.0 or higher. |
| GiniClust2 R Package | The core software implementing the algorithm. | Available from Bioconductor or GitHub repository. |
| Seurat R Package | Provides essential functions for normalization, PCA, and SNN graph construction. | Used integrally within the GiniClust2 pipeline. |
| Single-Cell Annotation Reference | Aids in validating and identifying the biological identity of discovered rare cells. | Human/Mouse Cell Atlas data, or PanglaoDB marker database. |
| Pathway Enrichment Tool | For functional interpretation of genes defining rare clusters. | clusterProfiler, Enrichr, or Ingenuity Pathway Analysis (IPA). |
| Data Visualization Tool | For exploratory data analysis and figure generation. | ggplot2, Seurat's DimPlot/FeaturePlot, or SCope. |
Conclusion
GiniClust represents a powerful and conceptually elegant solution to the significant challenge of rare cell type detection in single-cell genomics. By harnessing the Gini index, it provides a unique lens focused on gene expression inequality, enabling the discovery of biologically critical yet scarce populations that are often missed by standard clustering approaches. Successful application requires careful parameter tuning, informed troubleshooting, and rigorous validation within the broader analytical workflow. While newer methods continue to emerge, GiniClust's foundation remains vital. Future directions include tighter integration with multimodal data (e.g., CITE-seq), application to spatial transcriptomics, and development towards clinical diagnostics, where identifying rare pathological cells can inform novel therapeutic strategies and personalized medicine approaches.